CHAPTER 21 (FIN MAN); CHAPTER 7 (MAN)
VARIABLE COSTING FOR MANAGEMENT ANALYSIS
DISCUSSION QUESTIONS
1. a. Under absorption costing, both variable and fixed manufacturing costs are included as a
part of the cost of the product manufactured.
b. Under variable costing, only the variable manufacturing costs are included as a part of
the cost of the product manufactured. The fixed manufacturing costs are treated as an
expense of the period in which they are incurred.
2. Fixed factory overhead.
3. Included as part of the cost of product manufactured: (b), (d), (g).
6. All costs are controllable by someone within the business but not necessarily by the same
level of management. For a specific level of management, noncontrollable costs are costs
for which another level of management is responsible.
9. Rewarding sales personnel on the basis of total sales will normally motivate the sales staff
to expend their efforts promoting high-volume products, which will produce a large total
amount of sales dollars. In some cases, more profit may be earned by promoting specialty
products with lower sales volume but which have higher profit margins on each product
sold. For example, grocery stores must generate a large volume of sales to earn the same
profit as a jewelry store, because the profit margin for the grocery industry is low, while
the profit margin for the jewelry industry is high. A better measure of sales performance is
the total dollar contribution margin of each salesperson (total sales less variable cost of
goods sold and variable selling expenses) to overall company profit.
CHAPTER 21 (FIN MAN); CHAPTER 7 (MAN) Variable Costing for Management Analysis
BASIC EXERCISES
BE 21–1 (FIN MAN); BE 7–1 (MAN)
a. $438,000 = $912,000 – $474,000
BE 21–2 (FIN MAN); BE 7–2 (MAN)
a. Variable costing operating income is less than absorption costing operating income
BE 21–3 (FIN MAN); BE 7–3 (MAN)
BE 21–4 (FIN MAN); BE 7–4 (MAN)
a. $52,500 greater in producing 15,000 units. 10,000 units × ($15.75* – $10.50**),
BE 21–5 (FIN MAN); BE 7–5 (MAN)
CHAPTER 21 (FIN MAN); CHAPTER 7 (MAN) Variable Costing for Management Analysis
EXERCISES
Ex. 21–1 (FIN MAN); Ex. 7–1 (MAN)
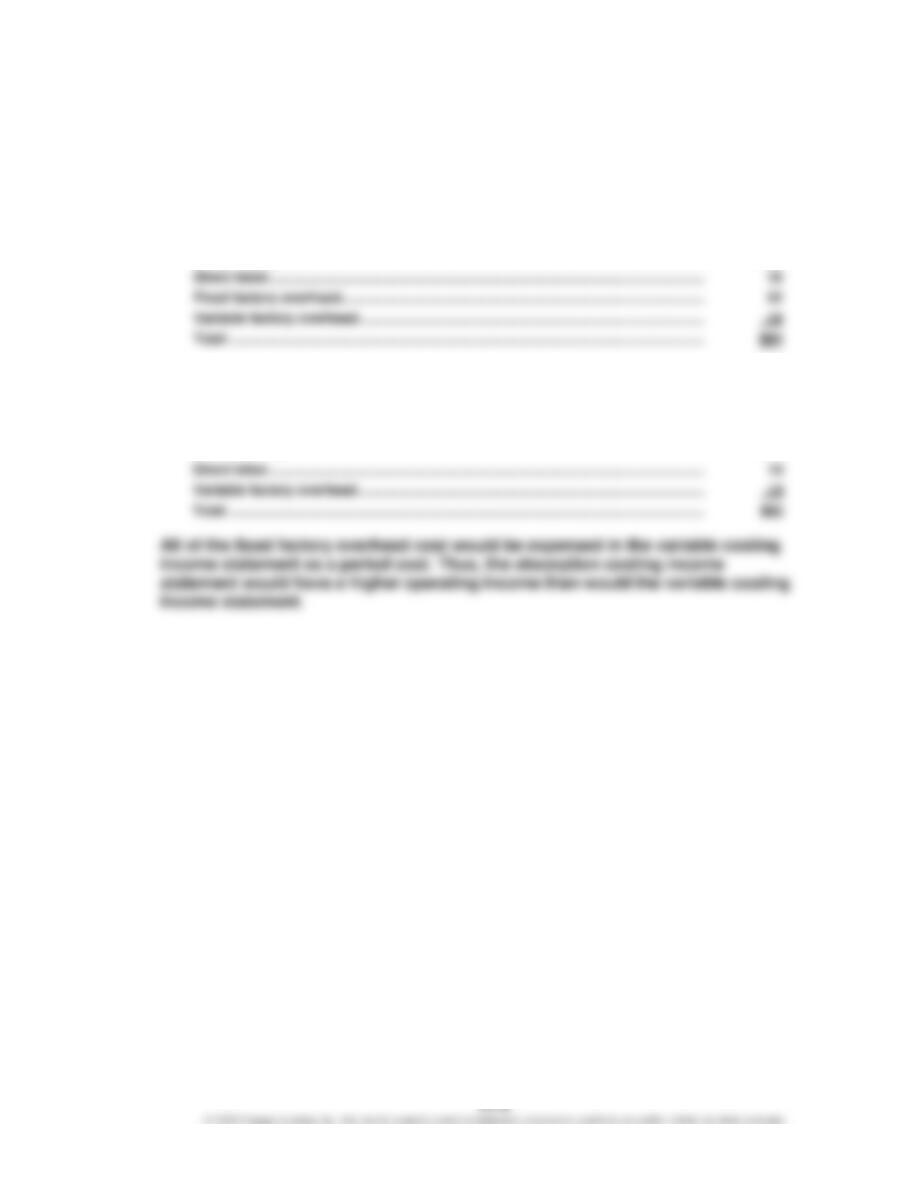
a. The inventory valuation under the absorption costing concept would include
the fixed factory overhead cost, as follows:
21,500 units × $84* = $1,806,000
*
Direct materials ……………………………………………………………………………………………….
$30
b. The inventory valuation under the variable costing concept would not include
the fixed factory overhead cost, as follows:
21,500 units × $62* = $1,333,000
*
Direct materials ……………………………………………………………………………………………….
$30
Total ……………………………………………………………………………………………………………….
$62
CHAPTER 21 (FIN MAN); CHAPTER 7 (MAN) Variable Costing for Management Analysis
Ex. 21–2 (FIN MAN); Ex. 7–2 (MAN)
a.
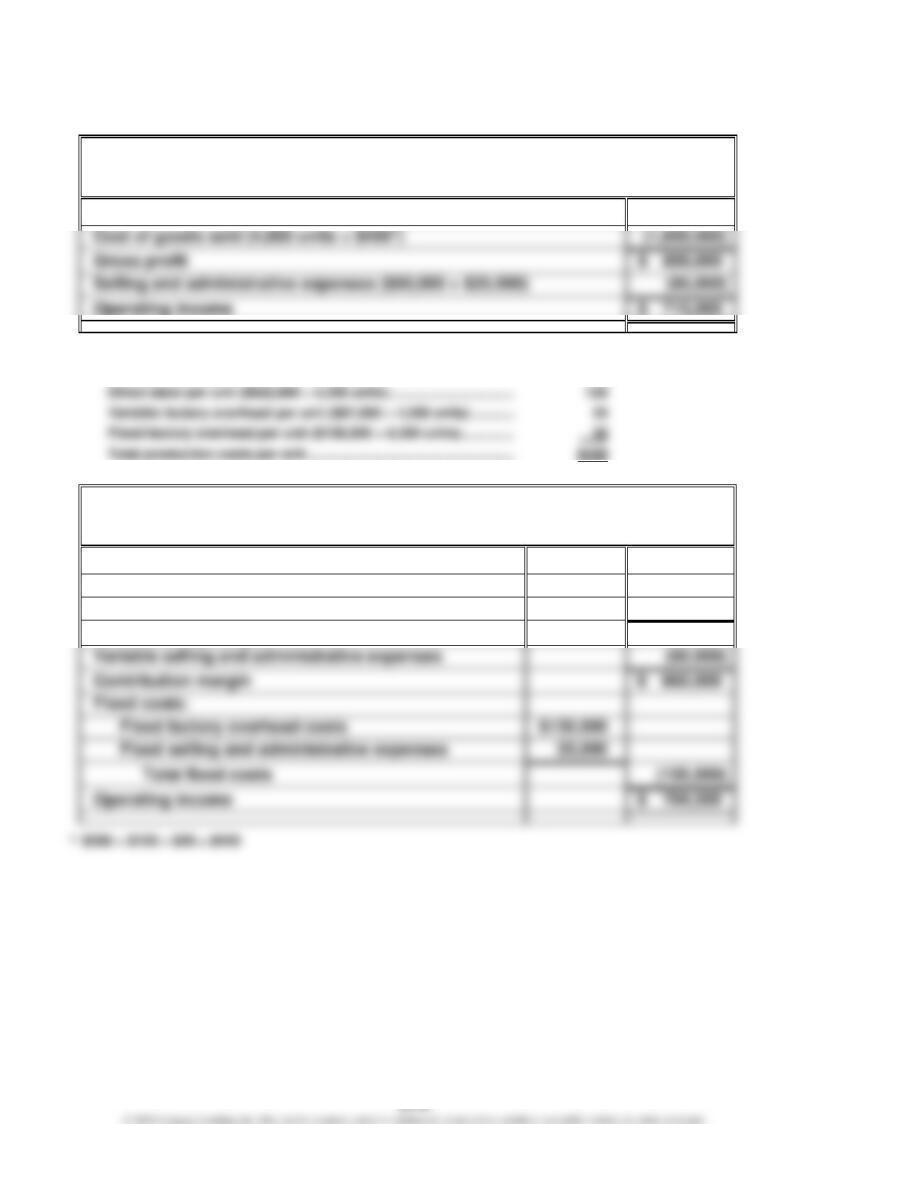
Gallatin County Motors Inc.
Absorption Costing Income Statement
For the Month Ended July 31
Sales
$ 2,600,000
Gross profit
$ 800,000
Selling and administrative expenses ($60,000 + $25,000)
*
Production costs per unit:
Direct materials per unit ($1,218,000 ÷ 4,350 units) …………………..
$280
b.
Gallatin County Motors Inc.
Variable Costing Income Statement
For the Month Ended July 31
Sales
$ 2,600,000
Variable cost of goods sold
(4,000 units × $420* per unit)
(1,680,000)
Manufacturing margin
$ 920,000
Contribution margin
$ 860,000
Fixed costs:
CHAPTER 21 (FIN MAN); CHAPTER 7 (MAN) Variable Costing for Management Analysis
Ex. 21–2 (FIN MAN); Ex. 7–2 (MAN) (Concluded)
c. The difference between the absorption and variable costing operating income
of $10,500 ($715,000 – $704,500) can be explained as follows:
Increase in inventory …………………………………………………………………..
350
× Fixed factory overhead per unit ………………………………………………..
× $30
Difference in operating income ……………………………………………………
$10,500
CHAPTER 21 (FIN MAN); CHAPTER 7 (MAN) Variable Costing for Management Analysis
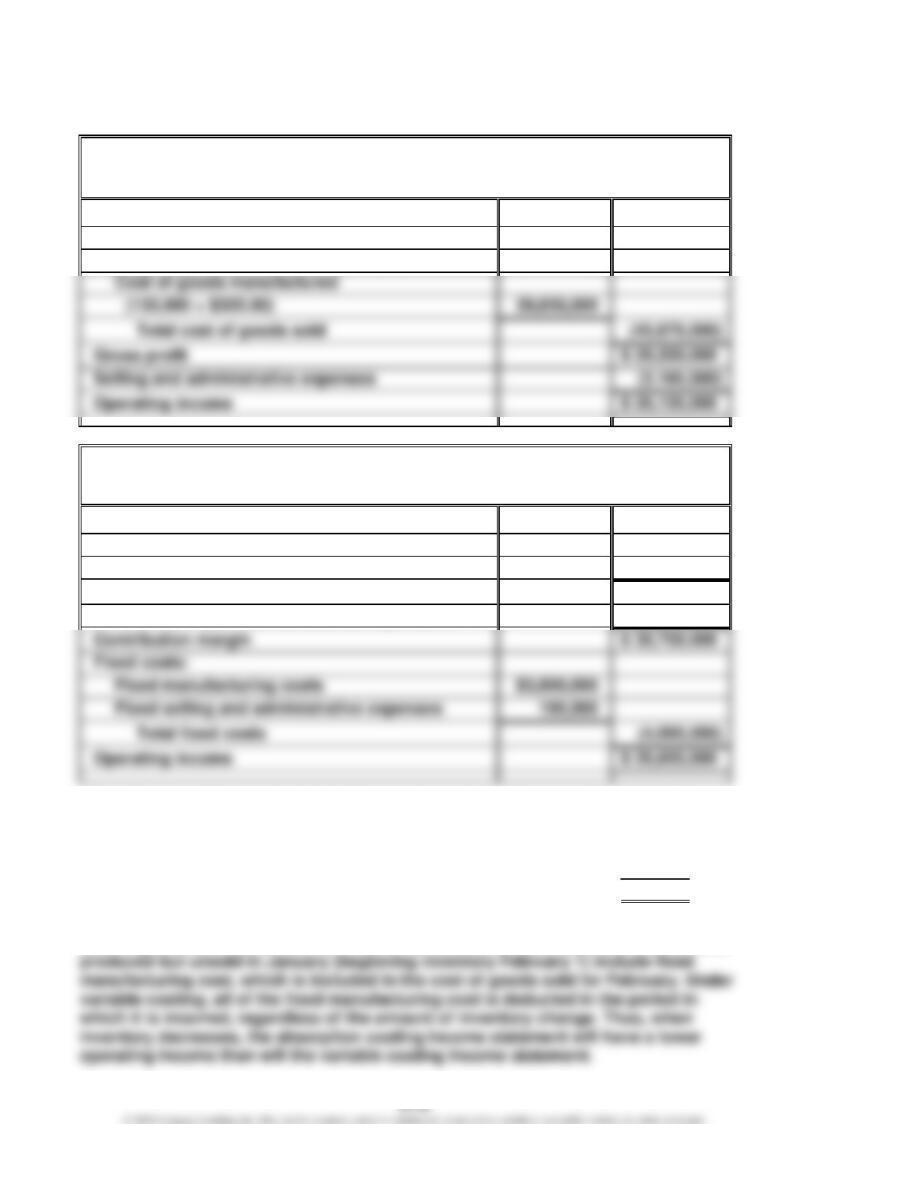
Ex. 21–3 (FIN MAN); Ex. 7–3 (MAN)
a.
Fresno Industries Inc.
Absorption Costing Income Statement
For the Month Ended February 28
Sales (150,000 × $500.00)
$ 75,000,000
Cost of goods sold:
Beginning inventory (20,000 × $301.00)
$ 6,020,000
39,650,000
(45,670,000)
Selling and administrative expenses
(3,195,000)
b.
Fresno Industries Inc.
Variable Costing Income Statement
For the Month Ended February 28
Sales
$ 75,000,000
Variable cost of goods sold
(150,000 units × $275.00 per unit)
(41,250,000)
Manufacturing margin
$ 33,750,000
Variable selling and administrative expenses
(3,000,000)
Contribution margin
Fixed costs:
Fixed manufacturing costs
$3,900,000
Operating income
c. The difference between the absorption and variable costing operating income
of $520,000 ($26,655,000 – $26,135,000) can be explained as follows:
Beginning inventory ………………………………………………………………..
20,000
Fixed manufacturing cost per unit in January …………………………...
× $26.00
Difference in operating income…………………………………………………
$520,000
Under the absorption costing concept, the fixed manufacturing cost included in the
cost of goods sold is matched with the revenues. As a result, 20,000 units that were
CHAPTER 21 (FIN MAN); CHAPTER 7 (MAN) Variable Costing for Management Analysis
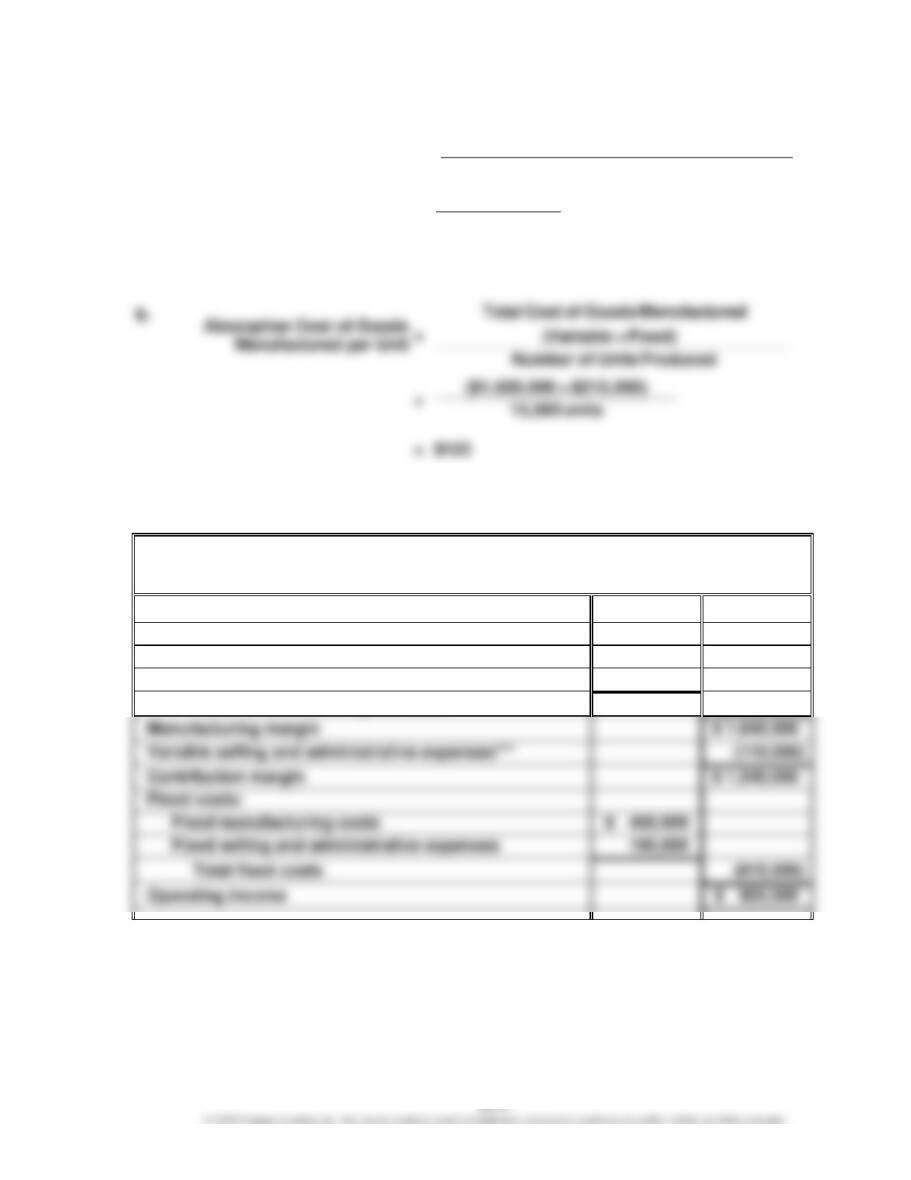
Ex. 21–4 (FIN MAN); Ex. 7–4 (MAN)
a.
Variable Cost of Goods
Manufactured per Unit
=
Variable Cost of Goods Manufactured
Number of Units Produced
=
$1,620,000
15,000 units
=
$108
Ex. 21–5 (FIN MAN); Ex. 7–5 (MAN)
Joplin Company
Variable Costing Income Statement
For the Month Ended April 30
Sales (275,000 units)
$ 4,950,000
Variable cost of goods sold:
Variable cost of goods manufactured*
$3,600,000
Inventory, April 30 (25,000 units)**
(300,000)
Total variable cost of goods sold
(3,300,000)
Variable selling and administrative expenses***
(615,000)
*
$4,050,000 – $450,000 (total manufacturing cost less fixed manufacturing cost)
**
$3,600,000 ÷ 300,000 units manufactured = $12.00;
$12.00 × 25,000 units = $300,000
***
$275,000 – $165,000 = $110,000
CHAPTER 21 (FIN MAN); CHAPTER 7 (MAN) Variable Costing for Management Analysis
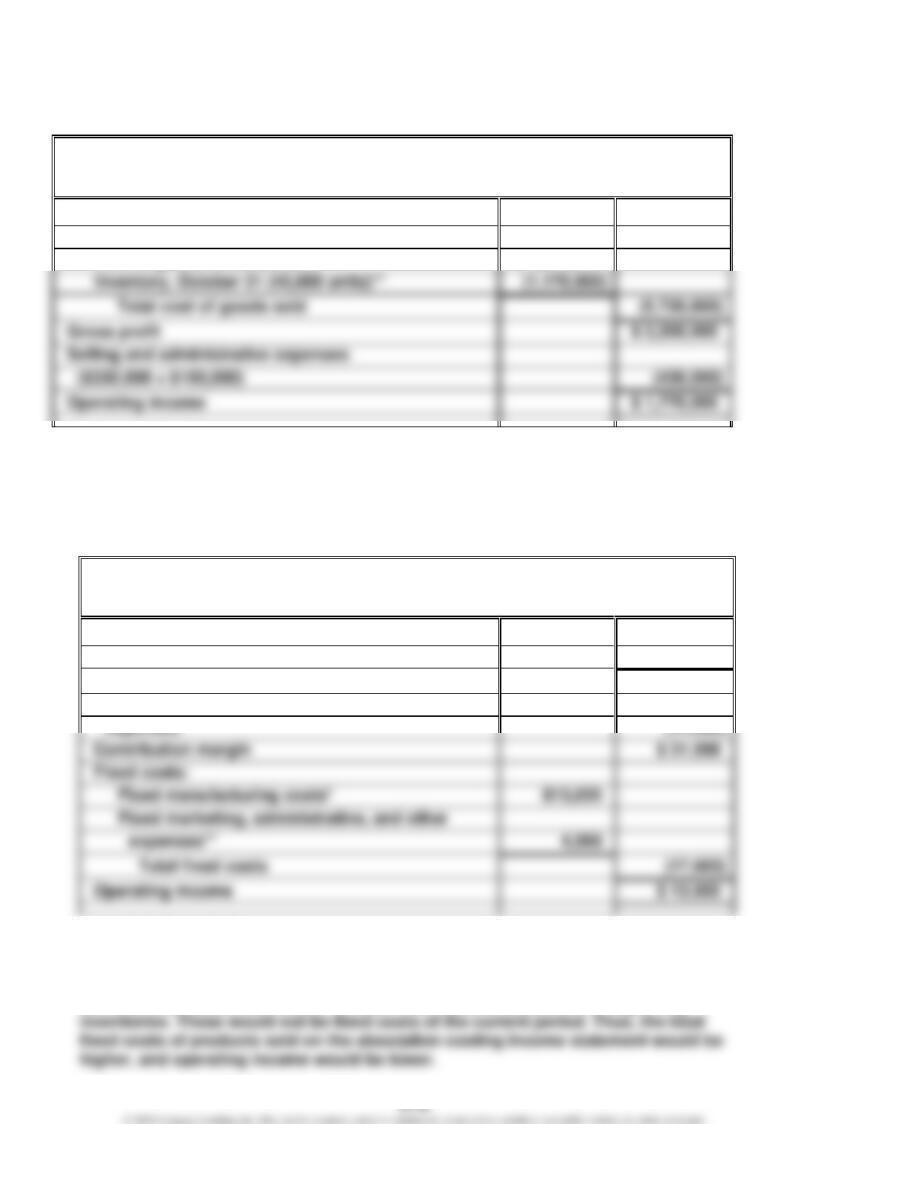
Ex. 21–6 (FIN MAN); Ex. 7–6 (MAN)
Maryville Equipment Company
Absorption Costing Income Statement
For the Month Ended October 31
Sales (220,000 units)
$ 7,920,000
Cost of goods sold:
Cost of goods manufactured*
$ 6,890,000
Gross profit
$ 2,200,000
Operating income
*
$6,360,000 + $530,000 (total variable plus fixed manufacturing cost)
**
$6,890,000 ÷ 265,000 units manufactured = $26 per unit; $26 × 45,000 units = $1,170,000
Ex. 21–7 (FIN MAN); Ex. 7–7 (MAN)
a.
The Procter & Gamble Company
Variable Costing Income Statement (assumed)
(in millions)
Sales
$ 65,058
Variable cost of products sold
(19,500)
Manufacturing margin
$ 45,558
Variable marketing, administrative, and other
Contribution margin
$ 31,558
Fixed costs:
(17,603)
*
$32,535 – $19,500
**
$18,568 – $14,000
b. If The Procter & Gamble Company reduced its inventories during the period, then
the cost of products sold would include fixed costs allocated to the beginning
CHAPTER 21 (FIN MAN); CHAPTER 7 (MAN) Variable Costing for Management Analysis
Ex. 21–8 (FIN MAN); Ex. 7–8 (MAN)
a. 1.
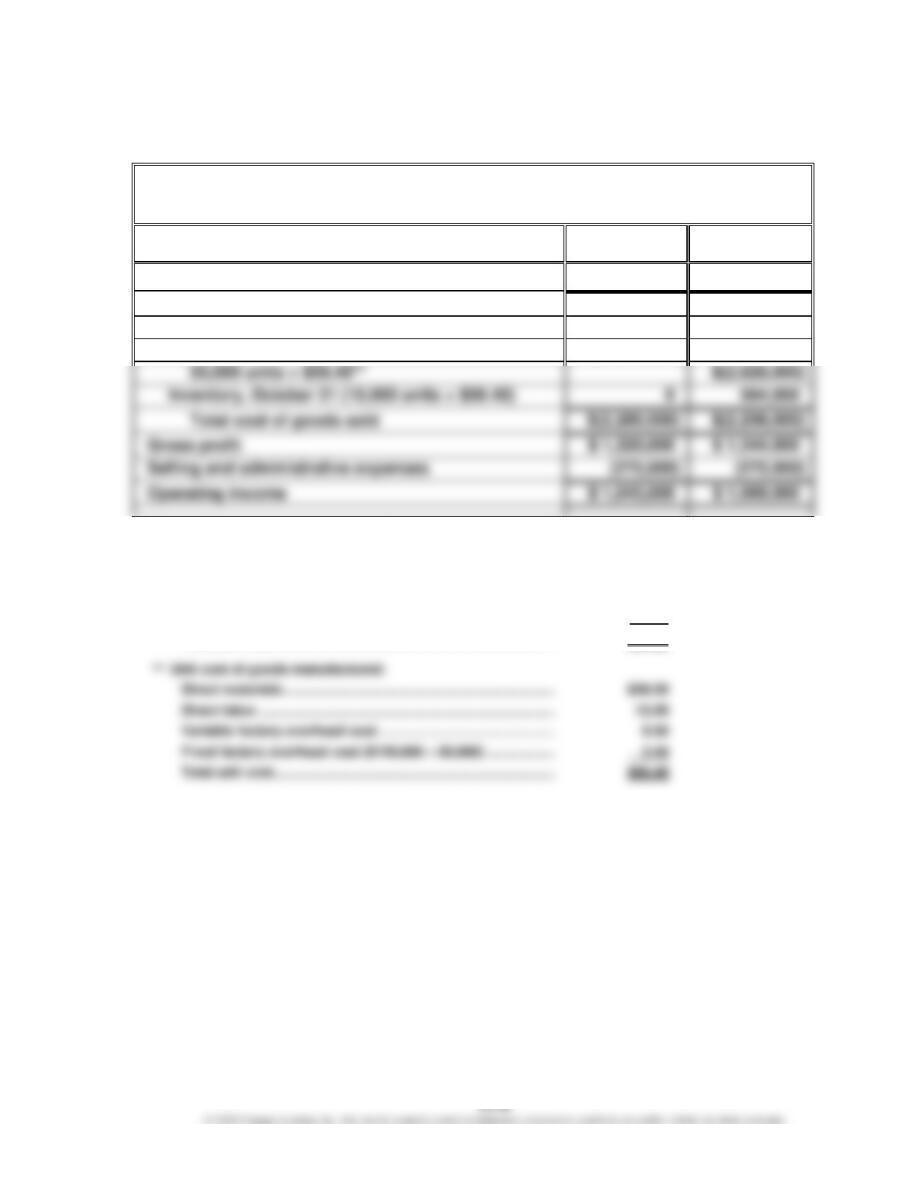
Marshall Inc.
Absorption Costing Income Statement
For the Month Ending October 31
40,000 Units
Manufactured
50,000 Units
Manufactured
Sales
$ 3,600,000
$ 3,600,000
Cost of goods sold:
Cost of goods manufactured:
40,000 units × $57.00*
$(2,280,000)
Inventory, October 31 (10,000 units × $56.40)
Total cost of goods sold
$(2,280,000)
Gross profit
Selling and administrative expenses
*
Unit cost of goods manufactured:
Direct materials ($1,440,000 ÷ 40,000) ………………………………
$36.00
Direct labor ($480,000 ÷ 40,000) ……………………………………….
12.00
Variable factory overhead cost ($240,000 ÷ 40,000) …………..
6.00
Fixed factory overhead cost ($120,000 ÷ 40,000) ………………
3.00
Unit cost of goods manufactured:
Direct materials ………………………………………………………………
Direct labor …………………………..………………………………………..
Fixed factory overhead cost ($120,000 ÷ 50,000) ………………
Total unit cost …………………………………………………………………
$57.00
CHAPTER 21 (FIN MAN); CHAPTER 7 (MAN) Variable Costing for Management Analysis
Ex. 21–8 (FIN MAN); Ex. 7–8 (MAN) (Concluded)
2.
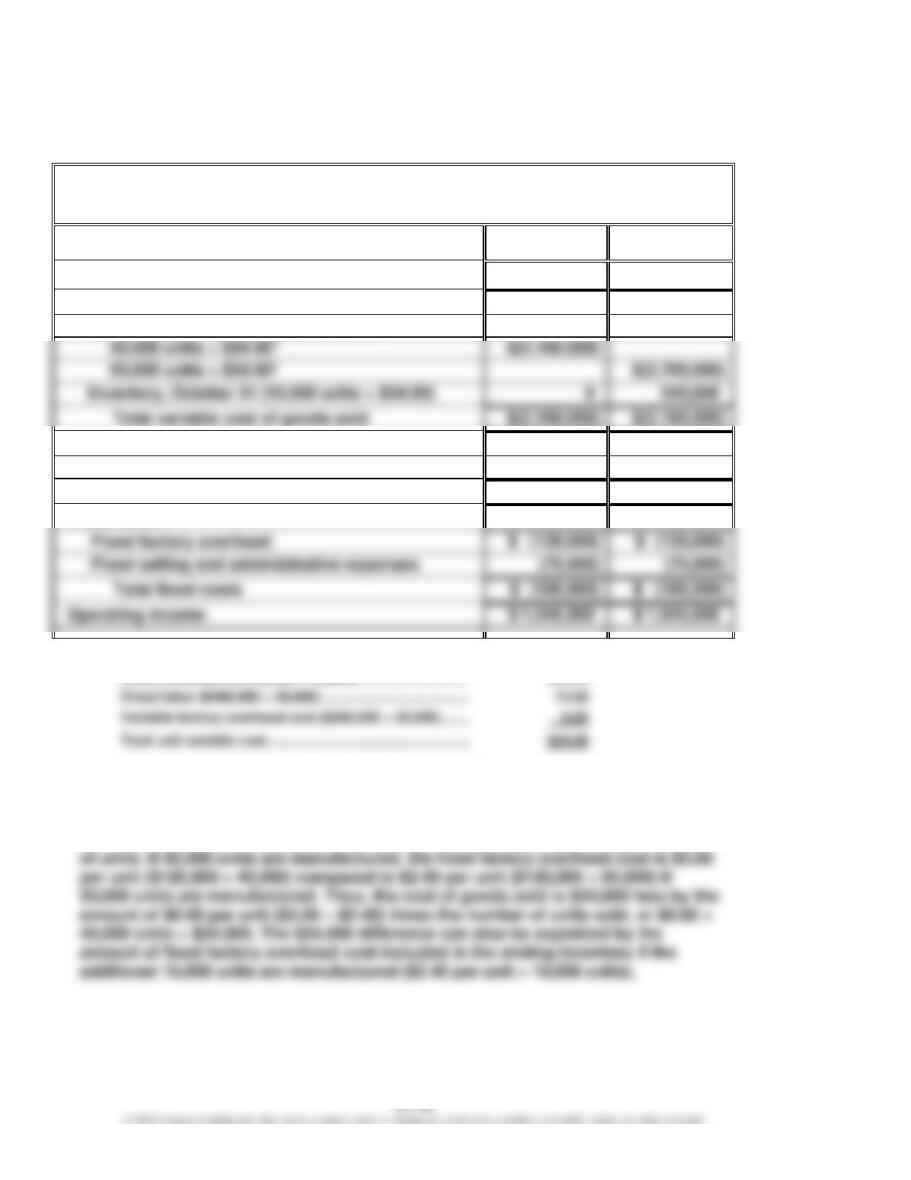
Marshall Inc.
Variable Costing Income Statement
For the Month Ending October 31
40,000 Units
Manufactured
50,000 Units
Manufactured
Sales
$ 3,600,000
$ 3,600,000
Variable cost of goods sold:
Variable cost of goods manufactured:
Inventory, October 31 (10,000 units × $54.00)
Manufacturing margin
$ 1,440,000
$ 1,440,000
Variable selling and administrative expenses**
(200,000)
(200,000)
Contribution margin
$ 1,240,000
$ 1,240,000
Fixed costs:
*
Unit variable cost of goods manufactured:
**
Variable selling and administrative expenses are constant with constant sales levels.
b. If 50,000 units rather than 40,000 units are manufactured, the increase in operating
income of $24,000 ($1,069,000 – $1,045,000) under absorption costing is caused
by the allocation of $120,000 of fixed factory overhead cost over a larger number
CHAPTER 21 (FIN MAN); CHAPTER 7 (MAN) Variable Costing for Management Analysis
Ex. 21–9 (FIN MAN); Ex. 7–9 (MAN)
a.
Caterpillar Inc.
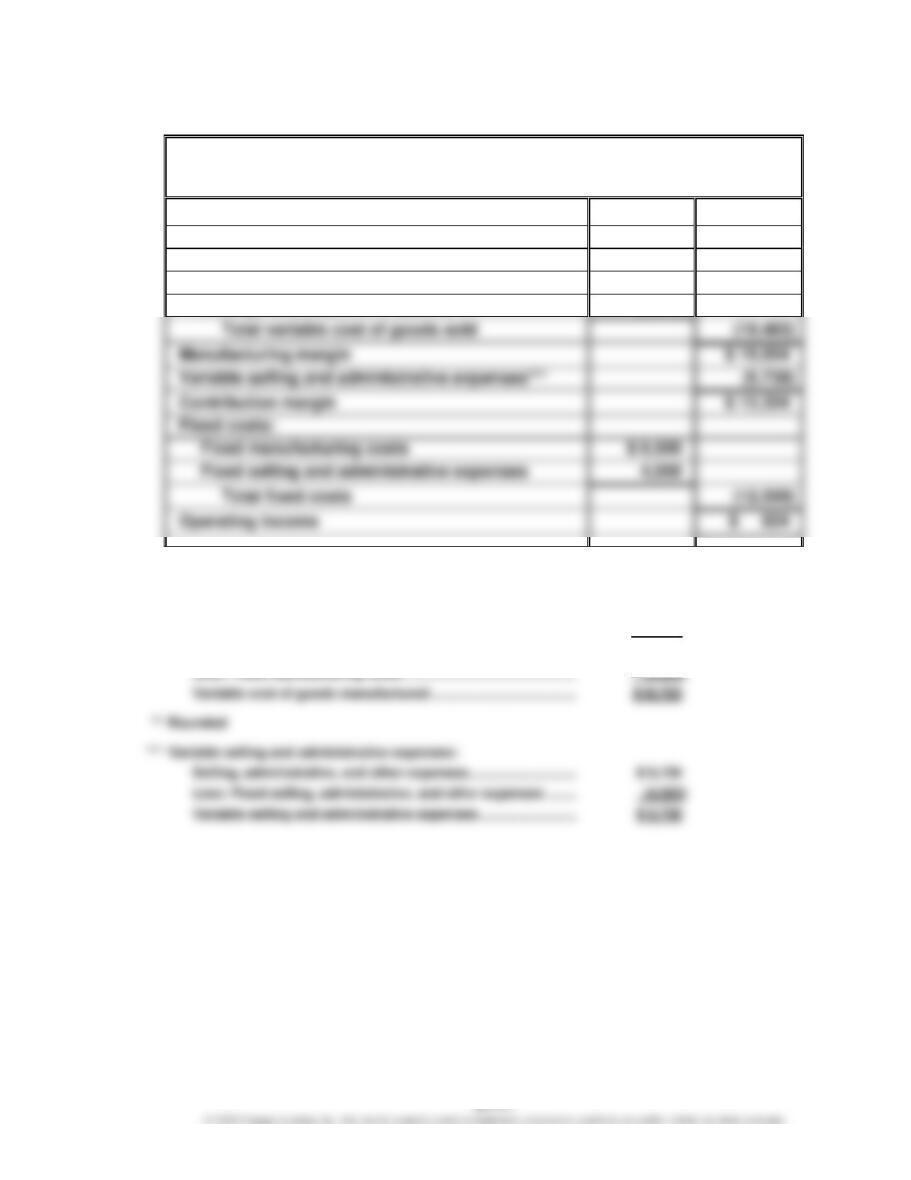
Variable Costing Income Statement (assumed)
For Year Ended December 31
Sales
$ 38,537
Variable cost of goods sold:
Beginning inventory (70% × $9,700)
$ 6,790
Variable cost of goods manufactured*
18,723
Ending inventory (70% × $8,614)**
(6,030)
Contribution margin
Fixed costs:
Fixed manufacturing costs
$ 8,500
Fixed selling and administrative expenses
*
Variable cost of goods manufactured:
Cost of goods sold …………………………………………………………….
$28,309
Plus: Ending inventory ………………………………………………………
8,614
Less: Beginning inventory …………………………………………………
(9,700)
Cost of goods manufactured ……………………………………………..
$27,223
Variable cost of goods manufactured …………………………………
Variable selling and administrative expenses:
Selling, administrative, and other expenses ………………………..
Less: Fixed selling, administrative, and other expenses ……..
CHAPTER 21 (FIN MAN); CHAPTER 7 (MAN) Variable Costing for Management Analysis
Ex. 21–9 (FIN MAN); Ex. 7–9 (MAN) (Concluded)
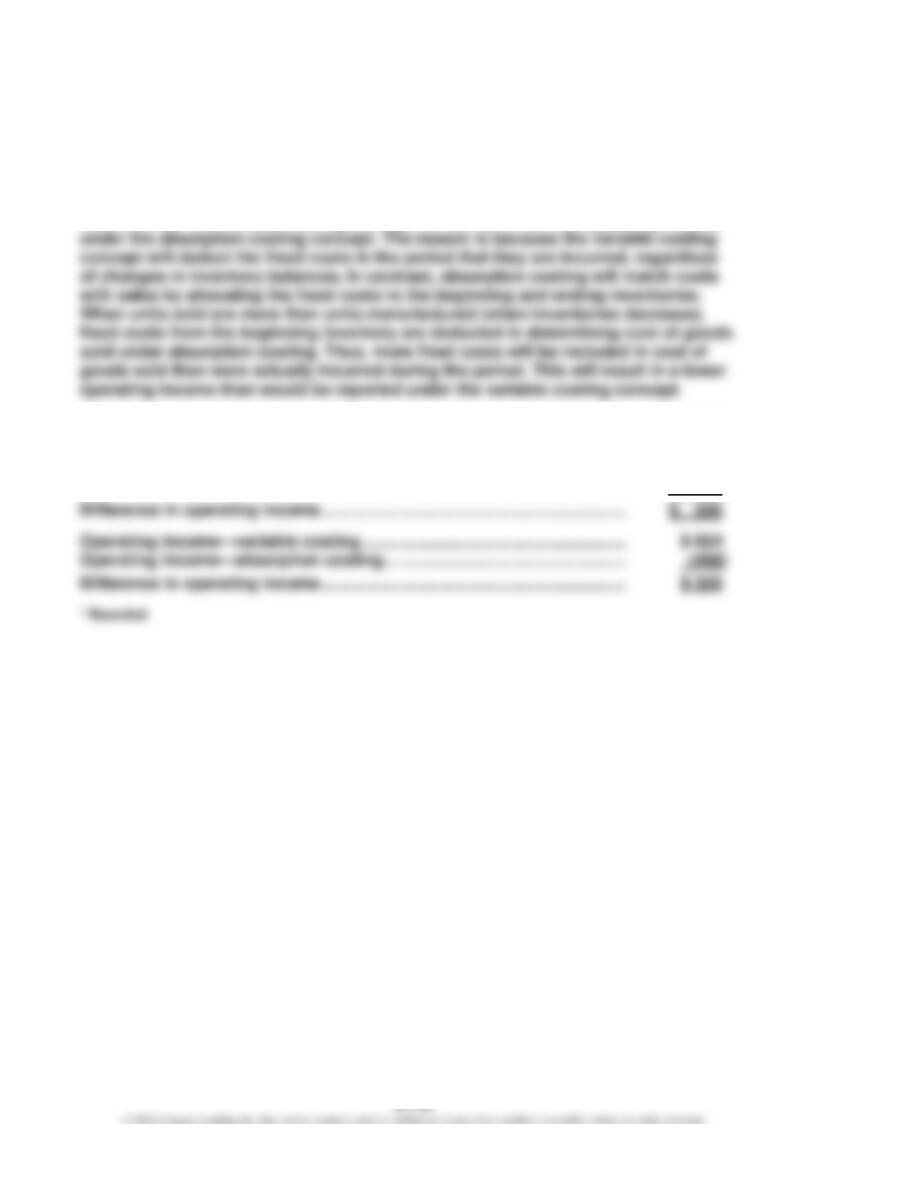
b. The operating income under the variable costing concept will not be the same as
the operating income under the absorption costing concept when the inventories
either increase or decrease during the year. In this case, Caterpillar’s inventory
decreased, meaning it sold more than it manufactured. As a result, the operating
income under the variable costing concept will be more than the operating income
The difference between the operating income under the two concepts can be shown
as follows (rounded):
Fixed cost portion of January 1 inventory (30% × $9,700) …………………..
$ 2,910
Less: Fixed cost portion of December 31 inventory (30% × $8,614)* ……
(2,584)
Operating income—absorption costing …………………………………………….
CHAPTER 21 (FIN MAN); CHAPTER 7 (MAN) Variable Costing for Management Analysis
Ex. 21–10 (FIN MAN); Ex. 7–10 (MAN)
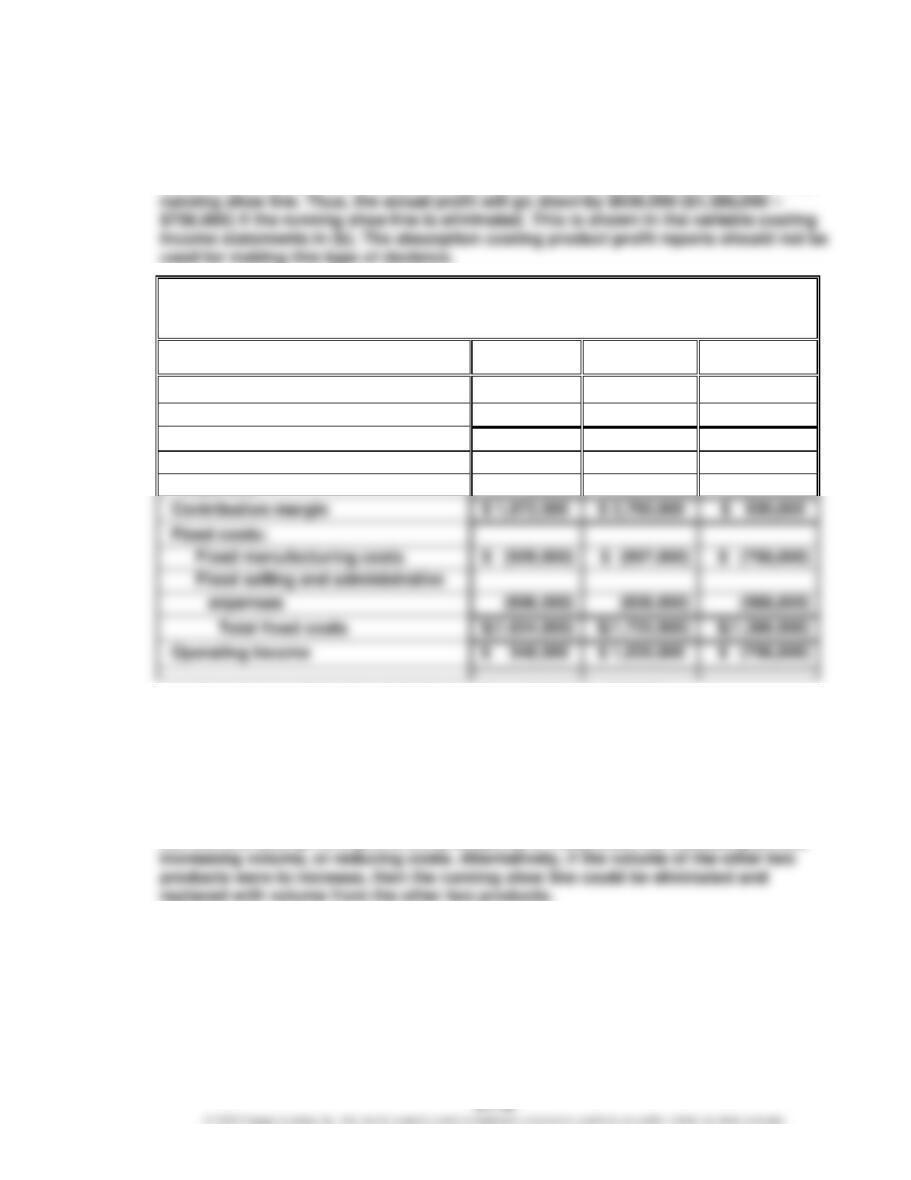
a. Management’s decision and conclusion are incorrect. The profit will not be improved
by $756,000 because the fixed costs used in manufacturing and selling running shoes
will not be avoided if the line is eliminated. These fixed costs total $1,386,000 for the
used for making this type of decision.
b.
Winslow Inc.
Variable Costing Income Statements—Three Product Lines
For the Year Ended December 31
Cross Training
Shoes
Golf
Shoes
Running
Shoes
Revenues
$ 5,800,000
$ 6,900,000
$ 4,200,000
Variable cost of goods sold*
(2,088,000)
(2,484,000)
(2,016,000)
Manufacturing margin
$ 3,712,000
$ 4,416,000
$ 2,184,000
Variable selling and administrative
Contribution margin
Fixed costs:
expenses**
(1,740,000)
(1,656,000)
(1,554,000)
*
Cross Training: $3,016,000 – $928,000; Golf Shoes: $3,381,000 – $897,000;
Running Shoes: $2,814,000 – $798,000
**
Cross Training: $2,436,000 – $696,000; Golf Shoes: $2,484,000 – $828,000;
Running Shoes: $2,142,000 – $588,000
c. If the running shoe line were eliminated, then the contribution margin of the product
line also would be eliminated. The fixed costs would not be eliminated. Thus, the
profit of the company would actually decline by $630,000. Management should keep
CHAPTER 21 (FIN MAN); CHAPTER 7 (MAN) Variable Costing for Management Analysis
Ex. 21–11 (FIN MAN); Ex. 7–11 (MAN)
Sun Sound
Headphones
Ear Bling
Headphones
Unit volume increase ……………………………………………………….
28,000
30,000
× Contribution margin per unit………………………………………….
× $33.60
× $30.00
Increase in profitability …………………………………………………….
$940,800
$900,000
The increase in total profitability would be $1,840,800 ($940,800 + $900,000). Note that
Ex. 21–12 (FIN MAN); Ex. 7–12 (MAN)
a.
Galaxy Sports Inc.
Contribution Margin by Product
Conquistador
Hurricane
Sales
$ 60,000,000
$ 46,000,000
$ 15,000,000
$ 18,400,000
CHAPTER 21 (FIN MAN); CHAPTER 7 (MAN) Variable Costing for Management Analysis
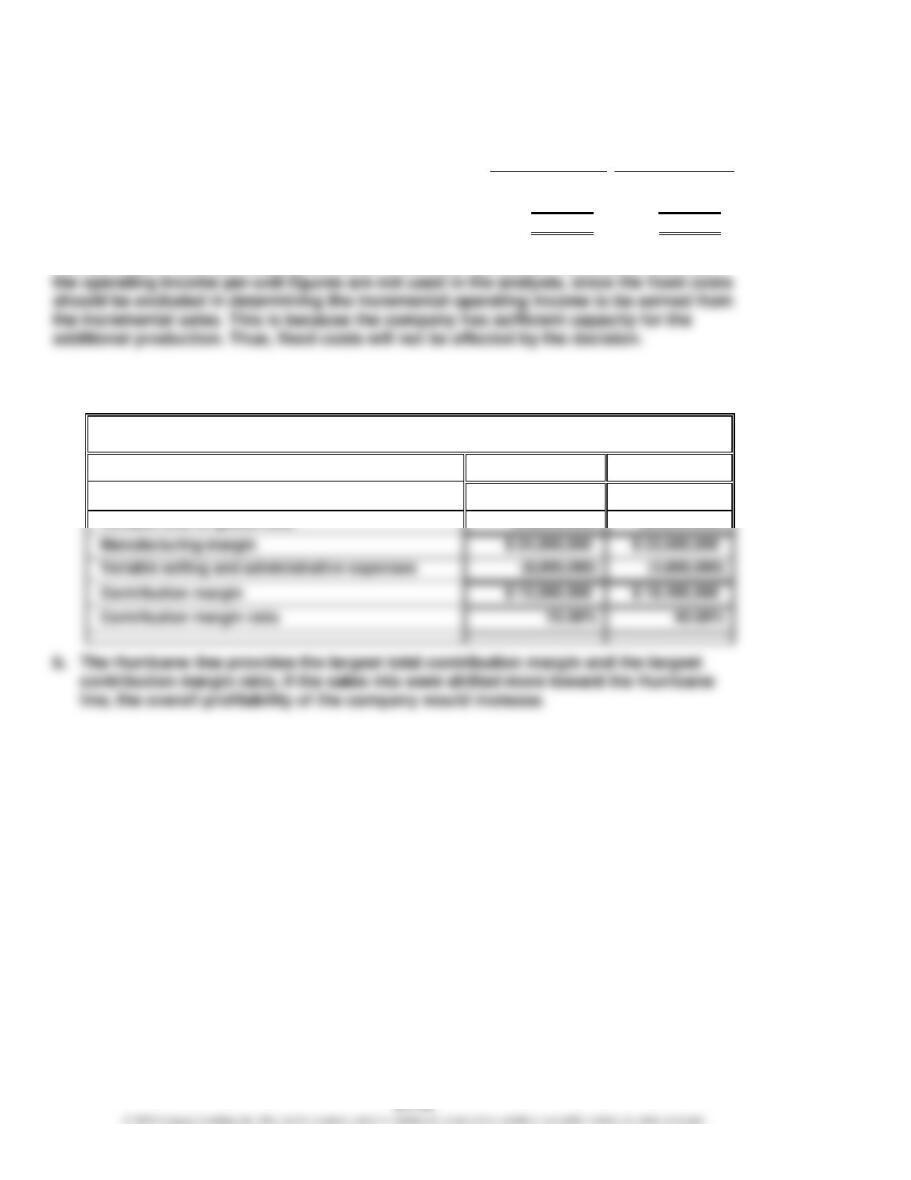
Ex. 21–13 (FIN MAN); Ex. 7–13 (MAN)
a.
Coast to Coast Surfboards Inc.
Contribution Margin by Territory
East Coast
West Coast
Sales
$ 8,000,000
$ 8,000,000
Variable cost of goods sold
(6,000,000)
(6,000,000)
Contribution margin
b. The total contribution margin is slightly lower for the East Coast, while the
contribution margin ratio is slightly higher for the West Coast. This is because East
Coast sells only Atlantic Waves, which have a lower contribution margin ratio (8.0%
vs. 11.7%)* but a higher contribution margin per unit ($16 vs. $14). In attempting to
improve the company’s profitability, it is unlikely that changing the mix of products
to the two territories will have much effect. East Coast will sell very few Pacific
* 8.0% = $16 ÷ $200
11.7% = $14 ÷ $120, rounded to one decimal place
CHAPTER 21 (FIN MAN); CHAPTER 7 (MAN) Variable Costing for Management Analysis
Ex. 21–14 (FIN MAN); Ex. 7–14 (MAN)
a.
1.
Havasu Off-Road Inc.
Contribution Margin by Salesperson
Rene
Steve
Colleen
Paul
Sales
$ 558,000
$ 384,000
$ 560,000
$1,080,000
Variable cost of goods sold
(334,800)
(192,000)
(336,000)
(540,000)
Variable commission
Manufacturing margin
$ 223,200
$ 192,000
$ 224,000
$ 540,000
2. Paul earns the highest contribution margin and has the highest contribution margin
ratio. This is because he sells the most units, has a low commission rate, and sells a
product mix with a high manufacturing margin (50% of sales, $540,000 ÷ $1,080,000).
Steve also sells products with a high average manufacturing margin (50% of sales,
CHAPTER 21 (FIN MAN); CHAPTER 7 (MAN) Variable Costing for Management Analysis
Ex. 21–14 (FIN MAN); Ex. 7–14 (MAN) (Concluded)
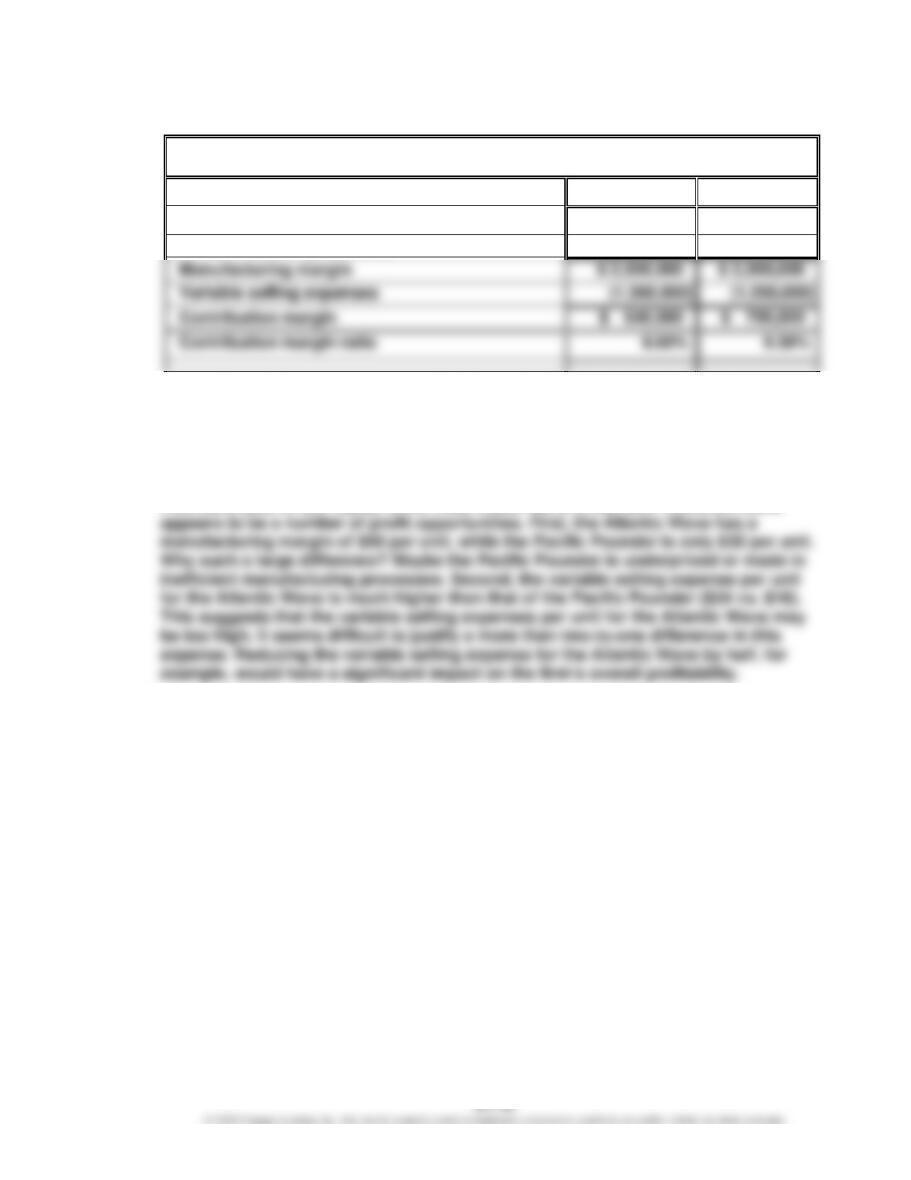
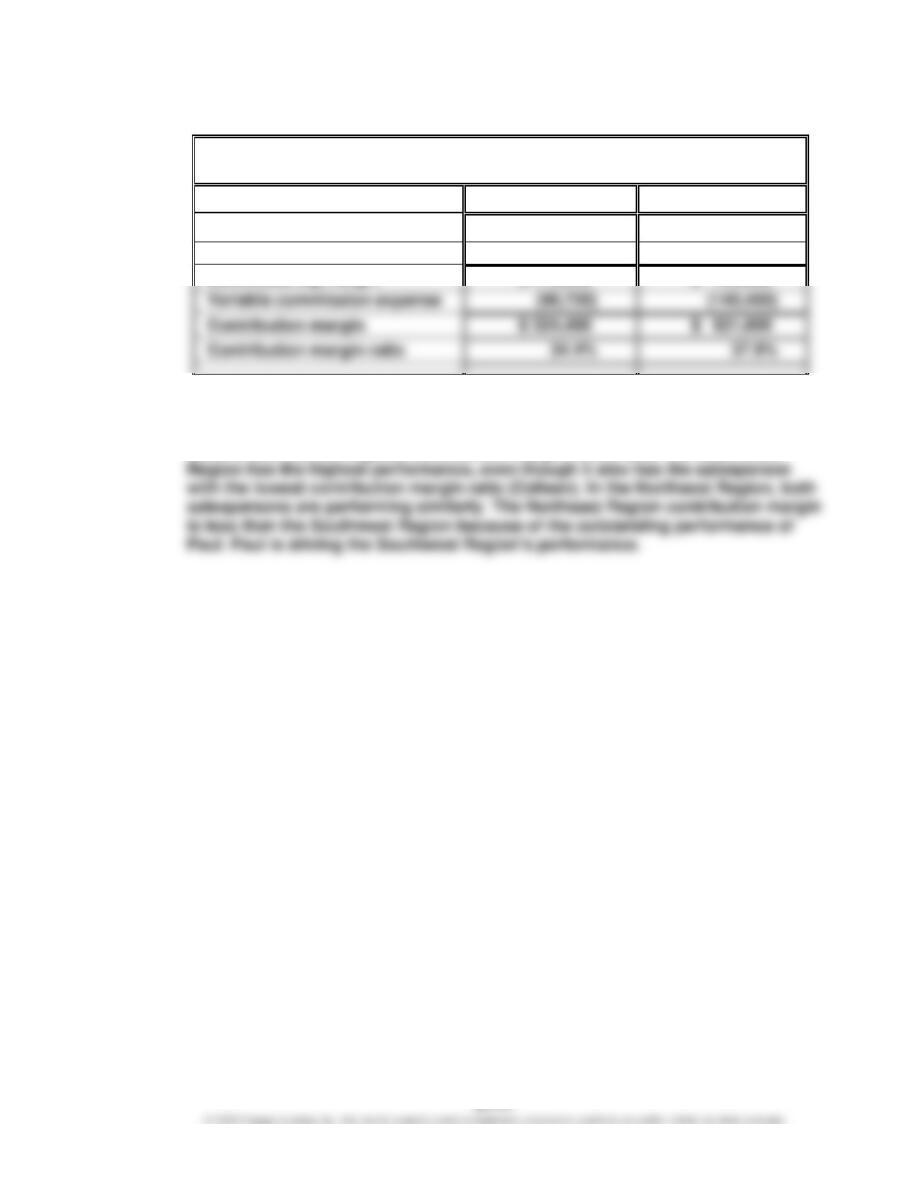
b.
1.
Havasu Off-Road Inc.
Contribution Margin by Territory
Northeast
Southwest
Sales
$ 942,000
$1,640,000
Variable cost of goods sold
(526,800)
(876,000)
Contribution margin
2. The Southwest Region has $698,000 more sales and $297,120 more contribution
margin. In addition, the Southwest Region has the largest contribution margin
ratio. In the Southwest Region, the salesperson with the highest sales unit
CHAPTER 21 (FIN MAN); CHAPTER 7 (MAN) Variable Costing for Management Analysis
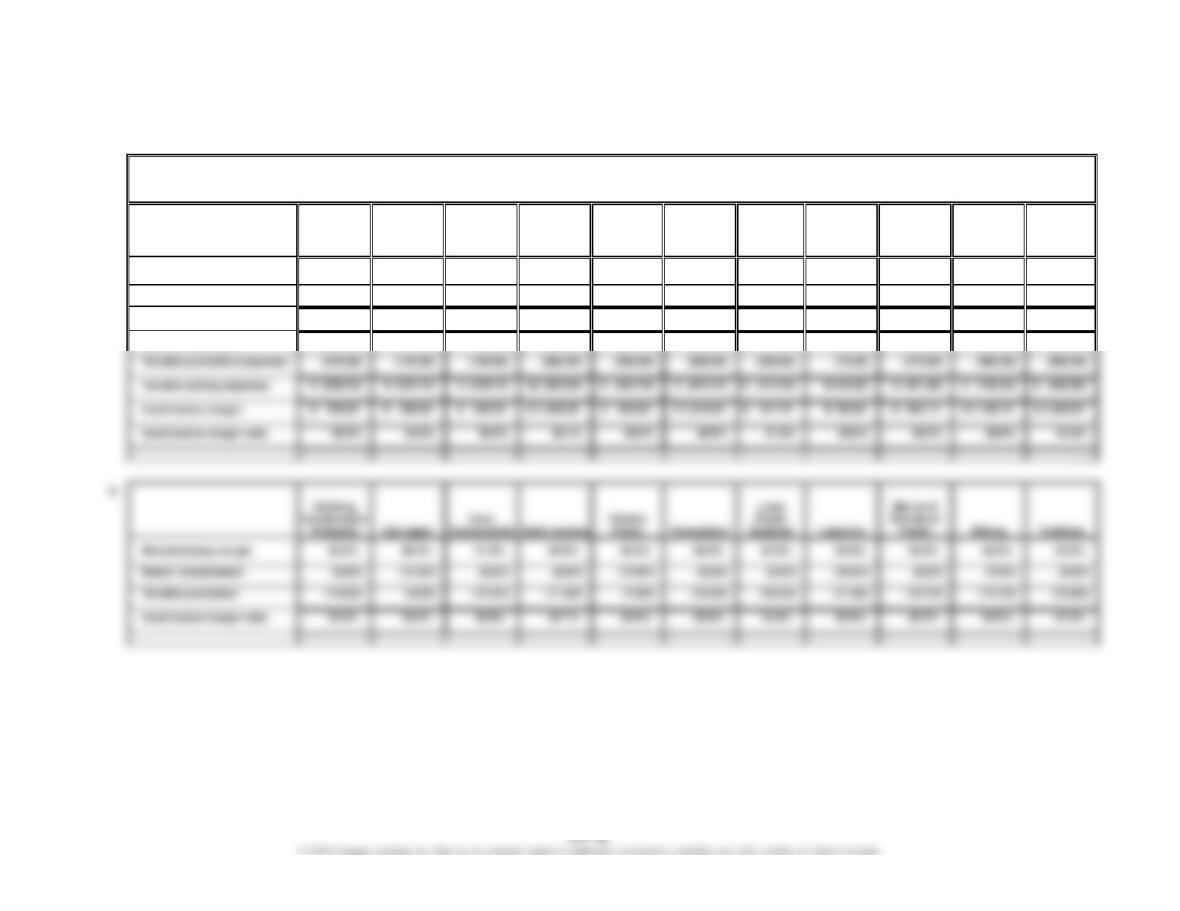
Ex. 21-15 (FIN MAN); Ex. 7-15 (MAN)
a.
Caterpillar Inc.
Contribution Margin by Segment (assumed)
(in millions, except ratio figures)
Building
Construction
Products
Cat Japan
Core
Components
Earth moving
Electric
Power
Excavation
Large
Power
Systems
Logistics
Marine &
Petroleum
Power
Mining
Turbines
Sales
$2,217.00
$1,225.00
$1,234.00
$ 5,045.00
$ 2,847.00
$ 4,562.00
$ 2,885.00
$ 659.00
$2,132.00
$ 3,975.00
$3,321.00
Variable cost of goods sold
(997.65)
(673.75)
(604.66)
(2,572.95)
(1,537.38)
(2,372.24)
(1,529.05)
(329.50)
(1,066.00)
(2,067.00)
(1,594.08)
Manufacturing margin
$1,219.35
$ 551.25
$ 629.34
$ 2,472.05
$ 1,309.62
$ 2,189.76
$ 1,355.95
$ 329.50
$1,066.00
$ 1,908.00
$ 1,726.92
Variable promotion expenses
(310.00)
(120.00)
(150.00)
(600.00)
(600.00)
(270.00)
(480.00)
Variable selling expenses
$ (509.53)
$ (254.75)
$(1,003.60)
$ (484.70)
$ (873.72)
$ (461.88)
$ (758.25)
$ (698.89)
Contribution margin
$ 709.82
$ 296.50
$ 1,468.45
$ 824.92
$ 1,316.04
$ 188.60
$ 1,149.75
$ 1,028.03
Contribution margin ratio
Building
Construction
Products
Cat Japan
Core
Components
Earth moving
Electric
Power
Excavation
Large
Power
Systems
Logistics
Marine &
Power
Mining
Turbines
Manufacturing margin
47.0%
Dealer commissions
Variable promotion
(10.4)%
Contribution margin ratio
31.6%
Dealer commissions
$ (199.53)
$ (134.75)
$ (98.72)
$ (403.60)
$ (284.70)
$ (273.72)
$ (144.25)
$ (65.90)
$ (191.88)
$ (278.25)
$ (298.89)
CHAPTER 21 (FIN MAN); CHAPTER 7 (MAN) Variable Costing for Management Analysis
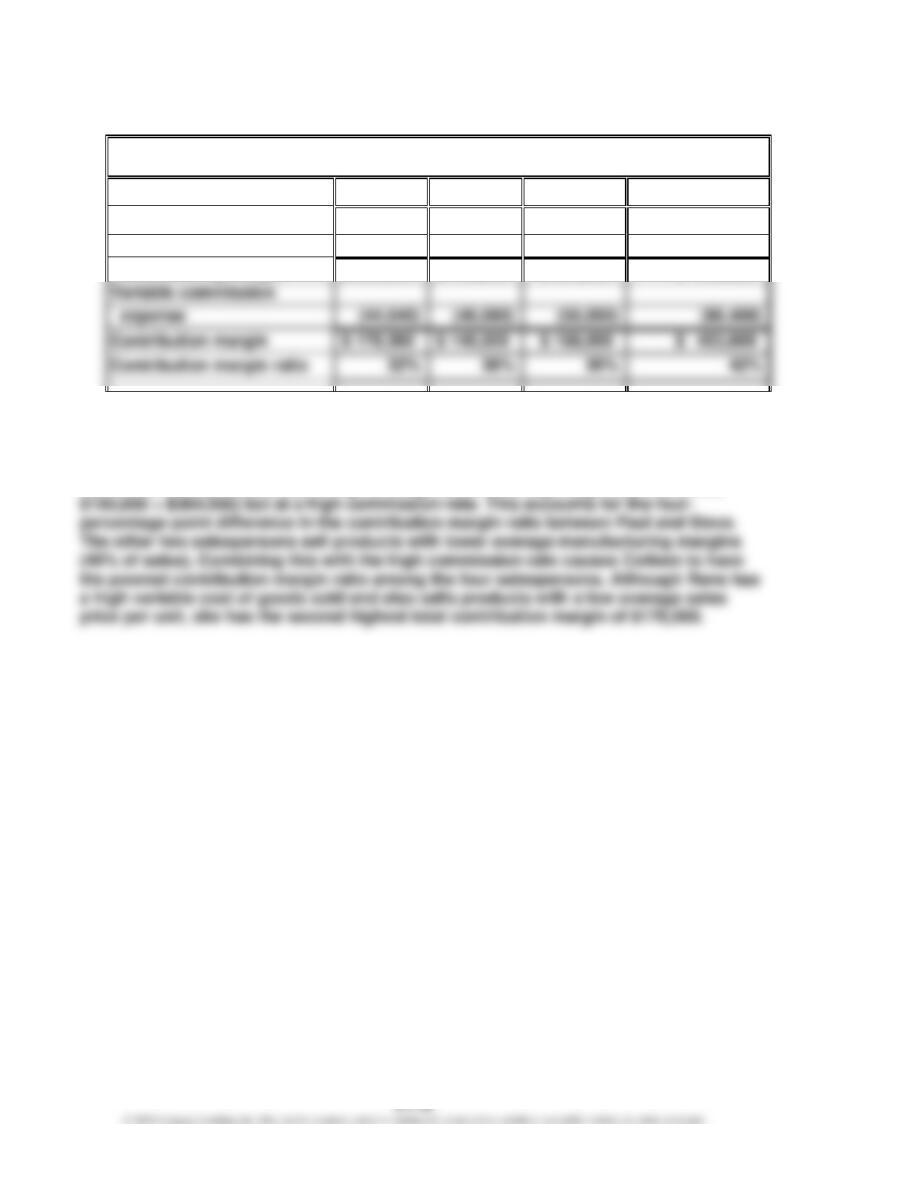
Ex. 21–15 (FIN MAN); Ex. 7–15 (MAN) (Concluded)
c. The Building Construction Products segment has the highest contribution margin
ratio. The manufacturing margin is high, while the dealer commission rate is average.
The variable promotion expenses as a percent of sales is higher than average. Cat
Japan is the poorest performing segment in terms of contribution margin ratio. This
is because the manufacturing margin is the lowest and dealer commissions are the
CHAPTER 21 (FIN MAN); CHAPTER 7 (MAN) Variable Costing for Management Analysis
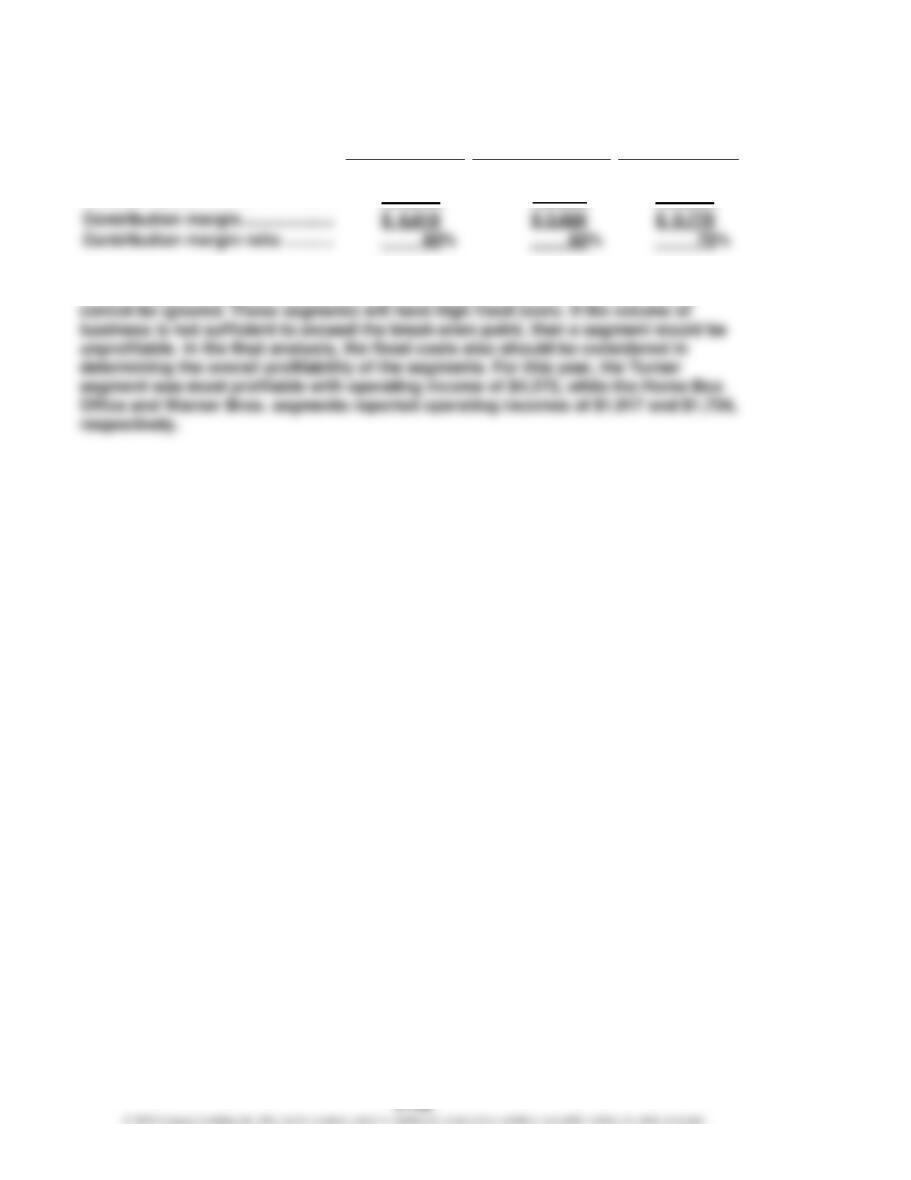
Ex. 21–16 (FIN MAN); Ex. 7–16 (MAN)
a.
Turner
Home Box Office
Warner Bros.
Revenues ……………………………….
$11,364
$ 5,890
$13,037
Variable costs …………………………
(4,546)
(2,062)
(3,259)
b. The higher contribution margin ratio of Warner Bros. segment of 75% in part (a)
should not be interpreted that it is the most profitable segment. The fixed costs