1. The receiving report should be reconciled to the initial purchase order and the vendor’s invoice
statements at May 31, the end of the fiscal year.
10. Manufacturer’s. The manufacturer retains title until the goods are sold. Thus, any unsold merchandise
CHAPTER 7
INVENTORIES
DISCUSSION QUESTIONS
CHAPTER 7 Inventories
PE 7–1A
PE 7–1B
PE 7–2A
a. Cost of merchandise sold (May 28):
PE 7–2B
a. Cost of merchandise sold (July 24):
PRACTICE EXERCISES
Gross Profit
February
Ending Inventory
February 28
June June 30
Gross Profit Ending Inventory
CHAPTER 7 Inventories
PE 7–3A
a. Cost of merchandise sold (June 26):
b. Inventory, June 30:
PE 7–3B
a. Cost of merchandise sold (March 27):
PE 7–4A
a. Weighted average unit cost: $71.25
Inventory total cost after purchase on July 15:
PE 7–4B
a. Weighted average unit cost: $9.50
Inventory total cost after purchase on October 22:
CHAPTER 7 Inventories
PE 7–5A
PE 7–5B
PE 7–6A
Unit Unit
Inventory Cost Market Lower of
Commodity Quantity Price Price Cost Market C or M
PE 7–6B
Unit Unit
Inventory Cost Market Lower of
Commodity Quantity Price Price Cost Market C or M
Total
Total
CHAPTER 7 Inventories
PE 7–7A
Balance Sheet:
Merchandise inventory understated*…………………
PE 7–7B
Balance Sheet:
Merchandise inventory overstated*…………………
…
…
Overstatement (Understatement)
Amount of Misstatement
Amount of Misstatement
Overstatement (Understatement)
$ 8,780
$(4,450)
…
PE 7–8A
a.
Cost of merchandise sold
b.
Cost of merchandise sold
Average daily cost of
2014 2013
$1,452,500 $1,120,000
Inventory Turnover
Number of Days’ Sales
in Inventory 2014 2013
$1,452,500 $1,120,000
CHAPTER 7 Inventories
PE 7–8B
a.
Cost of merchandise sold
b.
Cost of merchandise sold
Average daily cost of
$4,001,500
$3,864,000
Inventory Turnover
Number of Days’ Sales
in Inventory 2014 2013
2014 2013
$3,864,000 $4,001,500
CHAPTER 7 Inventories
Ex. 7–1
Switching to a perpetual inventory system will strengthen Triple Creek Hardware’s
internal controls over inventory, since the store managers will be able to keep
Ex. 7–2
a. Appropriate. The inventory tags will protect the inventory from customer theft.
EXERCISES
CHAPTER 7 Inventories
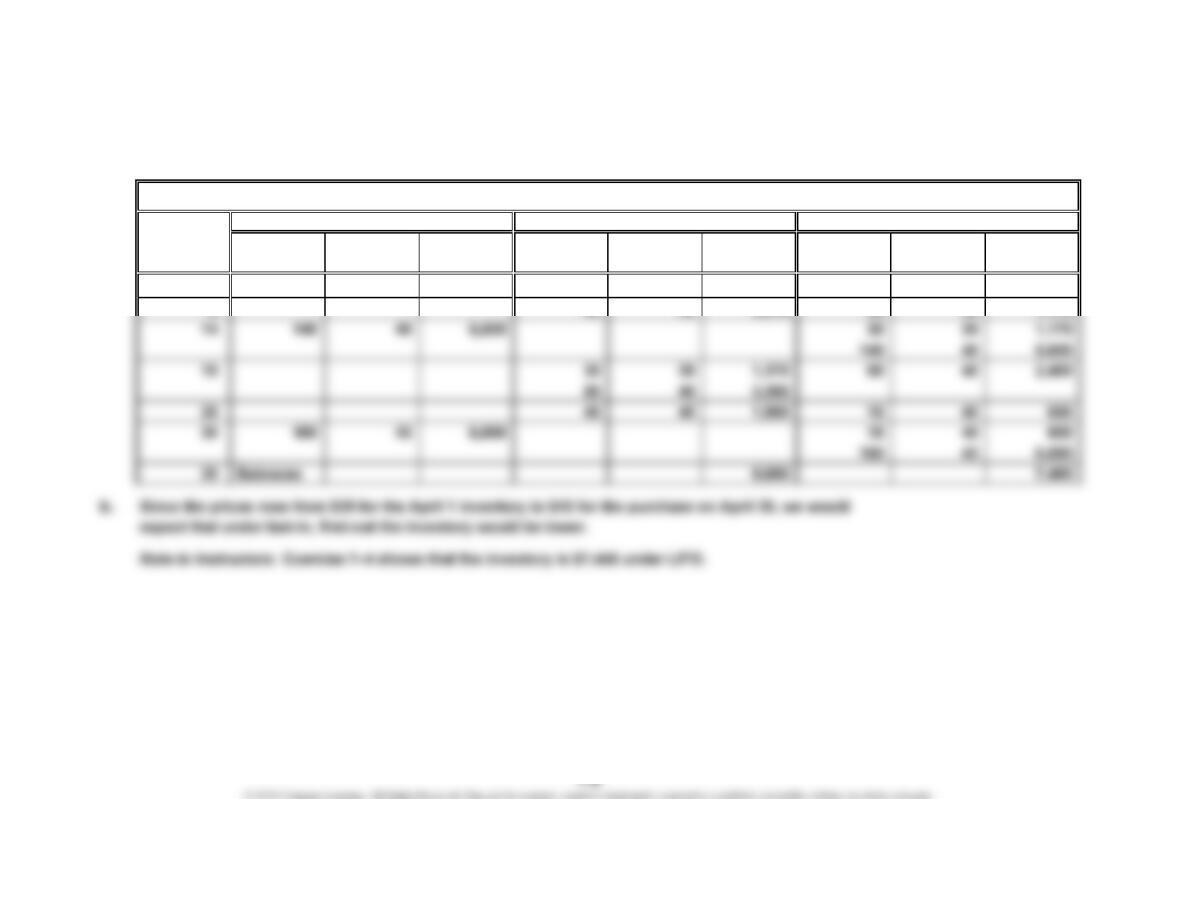
Ex. 7–3
a.
Unit Total Unit Total Unit Total
Quantity Cost Cost Quantity Cost Cost Quantity Cost Cost
Apr. 1 120 39 4,680
6 90 39 3,510 30 39 1,170
Date
Portable DVD Players
Purchases Cost of Merchandise Sold Inventory
CHAPTER 7 Inventories
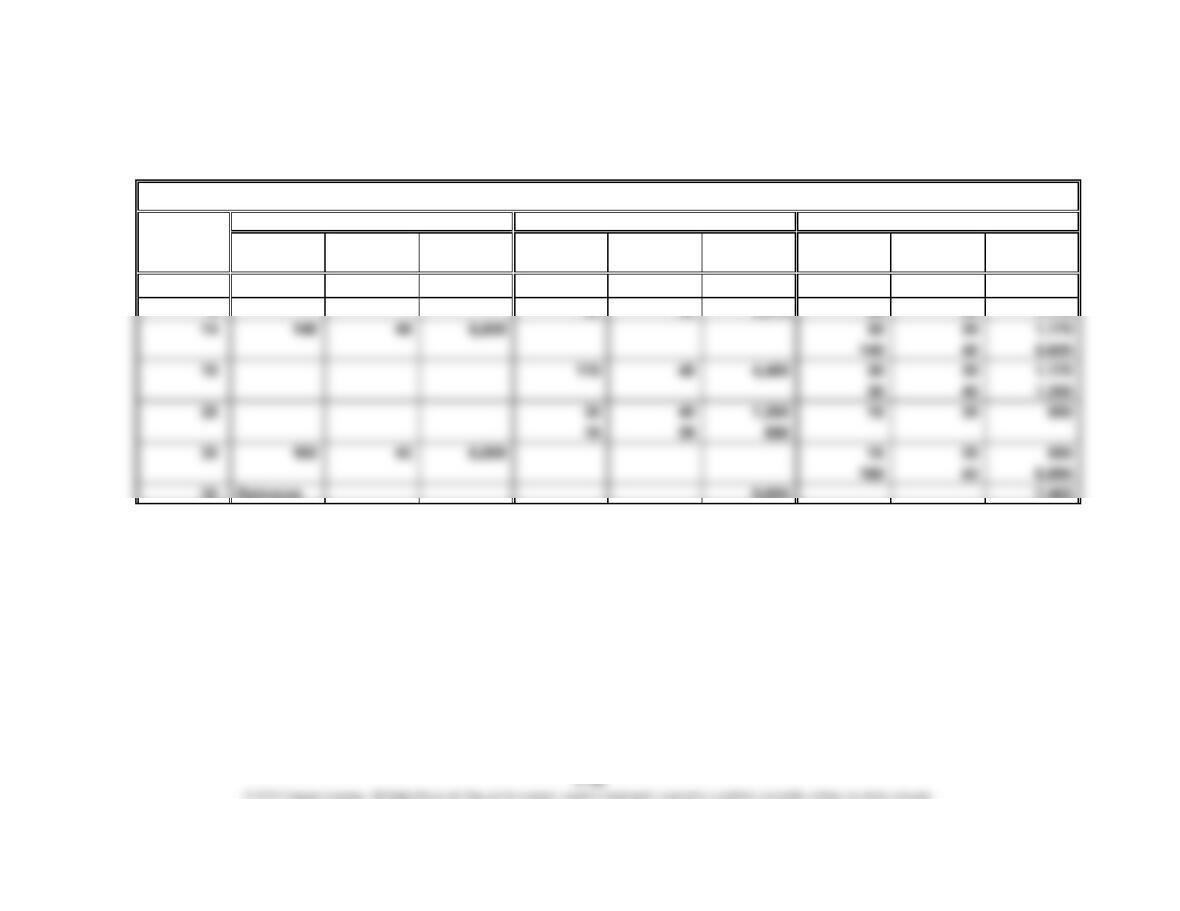
Ex. 7–4
Unit Total Unit Total Unit Total
Quantity Cost Cost Quantity Cost Cost Quantity Cost Cost
Apr. 1 120 39 4,680
6 90 39 3,510 30 39 1,170
30 Balances 9,695 7,465
Date
Portable DVD Players
Purchases Cost of Merchandise Sold Inventory
CHAPTER 7 Inventories
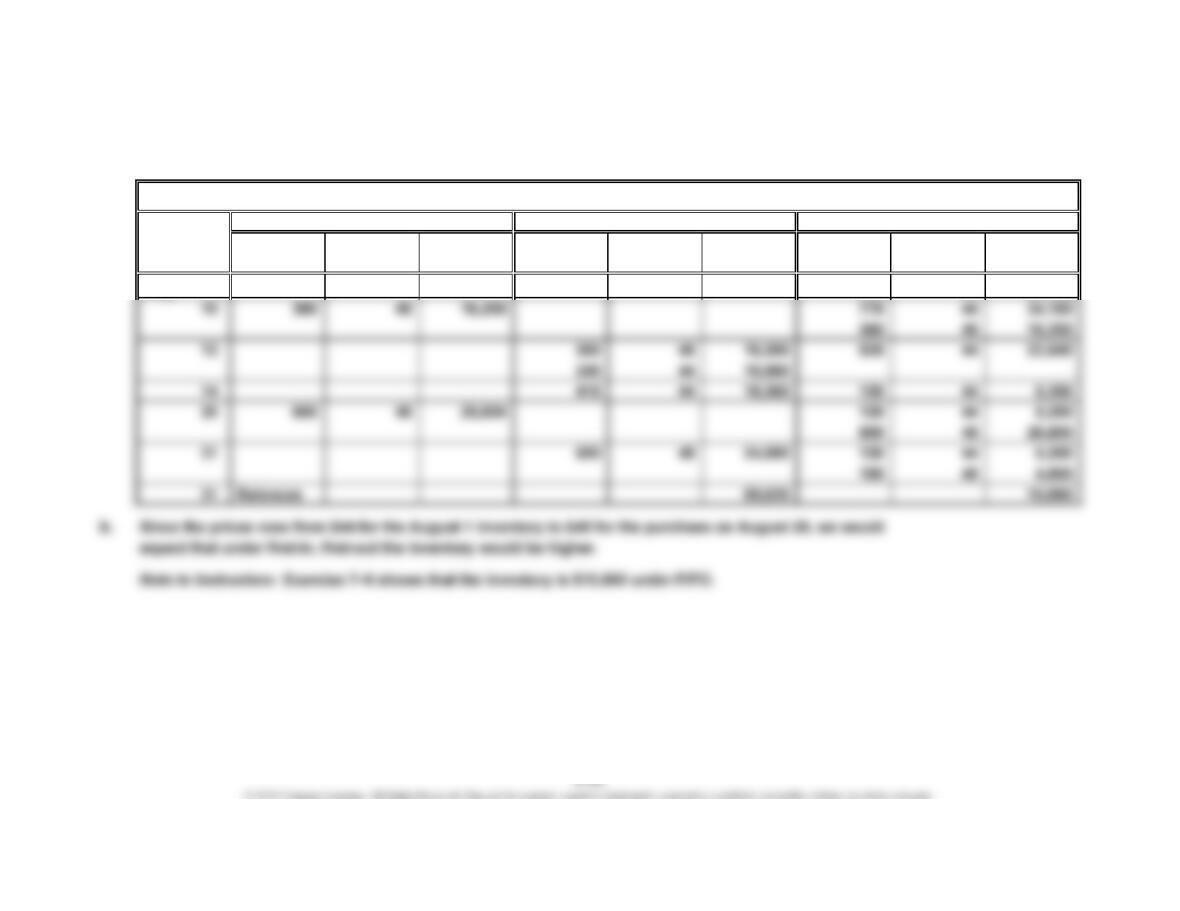
Ex. 7–5
a.
Unit Total Unit Total Unit Total
Quantity Cost Cost Quantity Cost Cost Quantity Cost Cost
Aug. 1 775 44 34,100
Date
Prepaid Cell Phones
Purchases Cost of Merchandise Sold Inventory
CHAPTER 7 Inventories
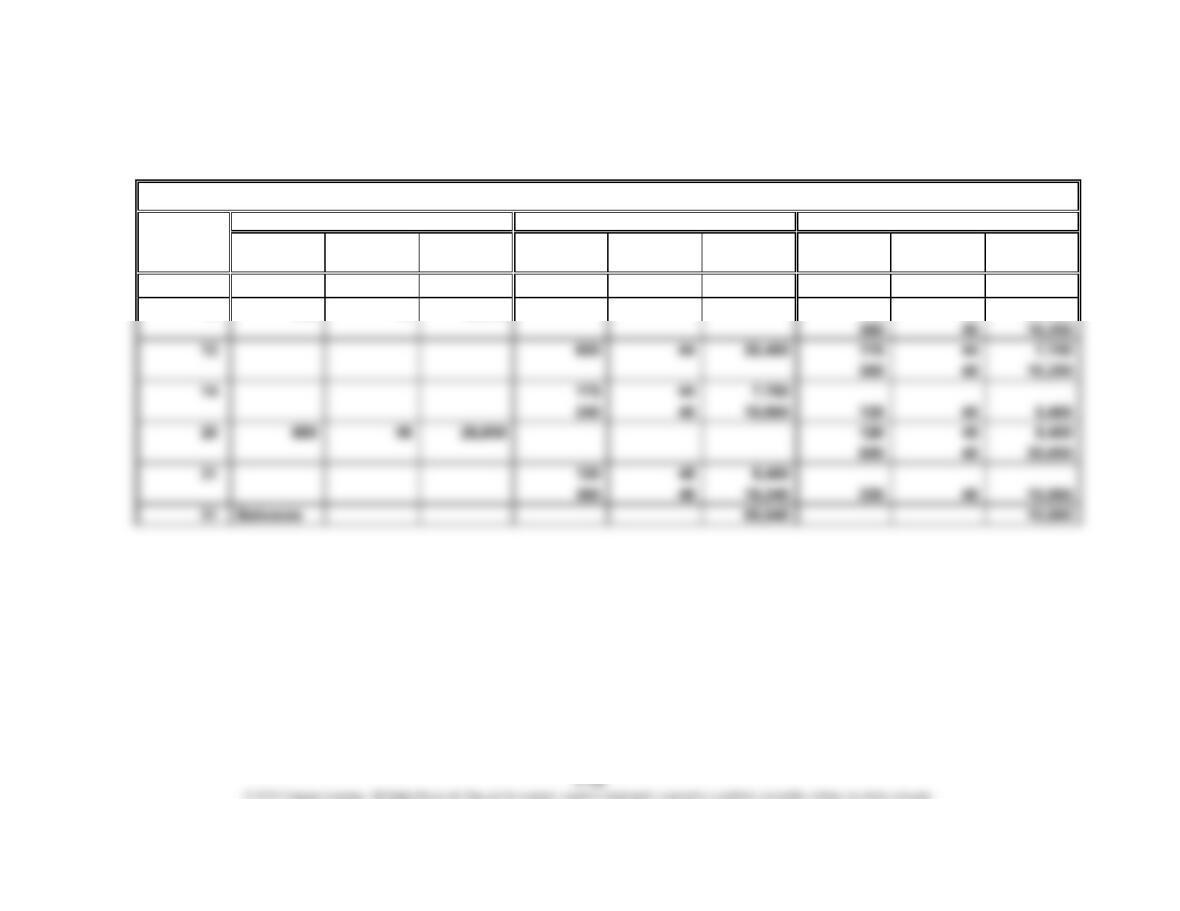
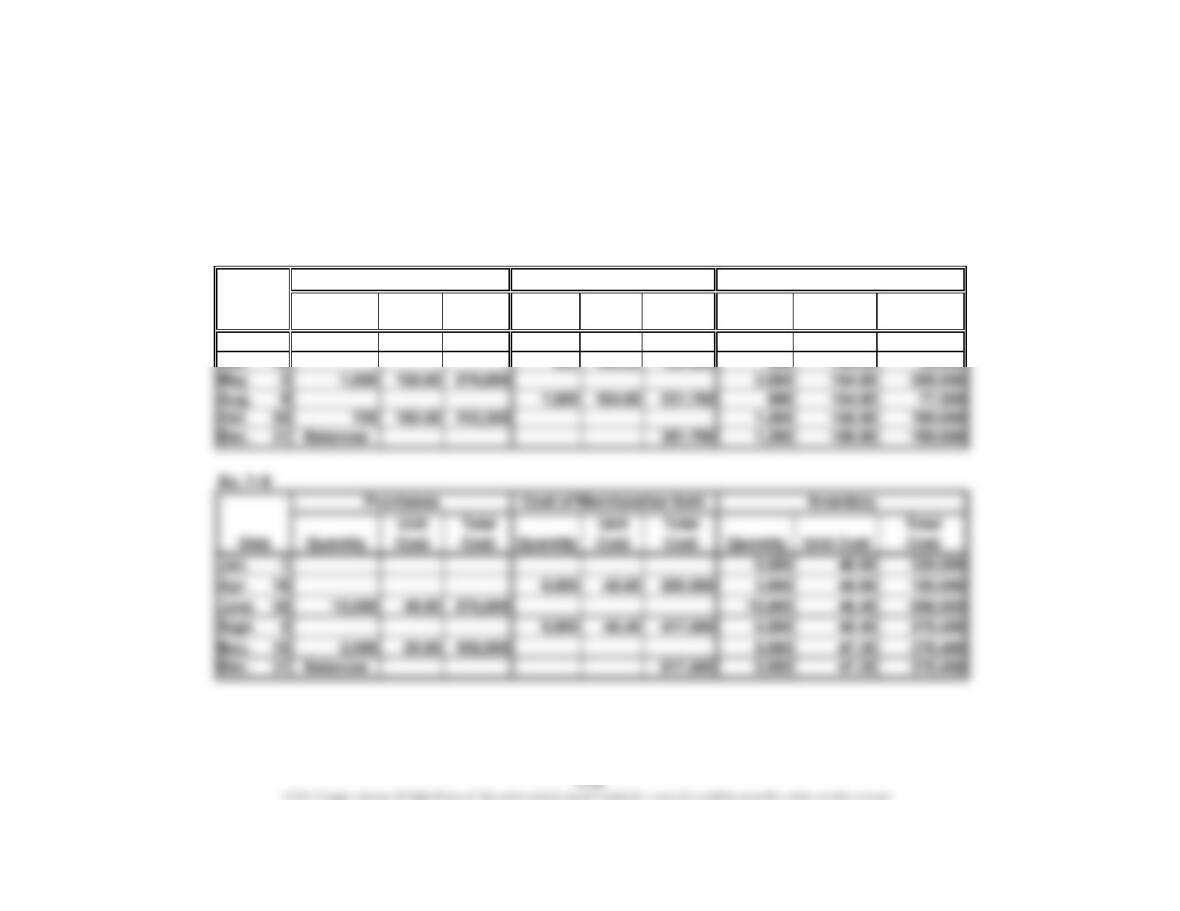
Ex. 7–6
Unit Total Unit Total Unit Total
Quantity Cost Cost Quantity Cost Cost Quantity Cost Cost
Aug. 1 775 44 34,100
10 360 45 16,200 775 44 34,100
Date
Prepaid Cell Phones
Purchases Cost of Merchandise Sold Inventory
CHAPTER 7 Inventories
Ex. 7–7
a. $22,880 ($440 × 52 units)
b. $22,000 [($400 × 12 units) + ($420 × 20 units) + ($440 × 20 units)] = $4,800 + $8,400 + $8,800
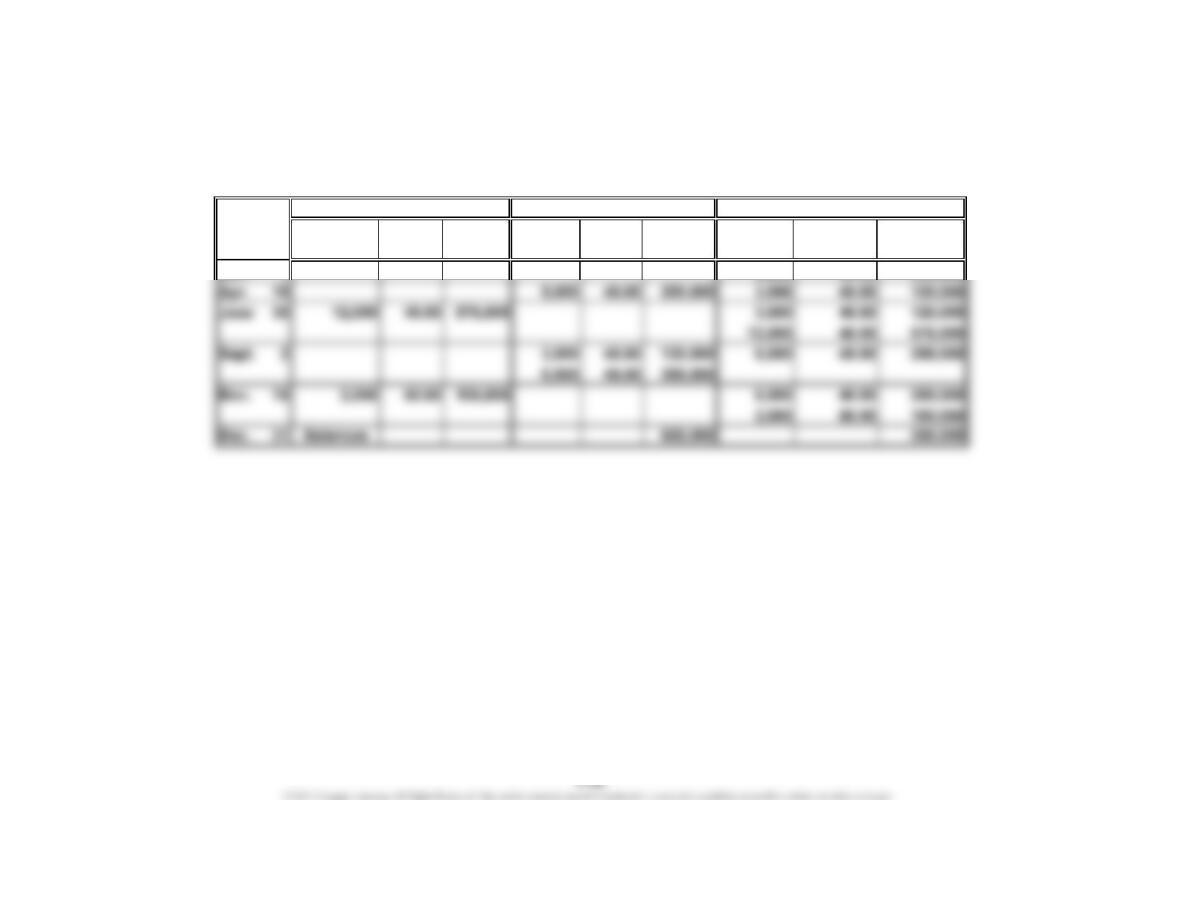
Ex. 7–8
Cost of Merchandise Sold
Unit Total Unit Total Total
Quantity Cost Cost Quantity Cost Cost Quantity Unit Cost Cost
Jan. 1 1,000 150.00 150,000
Mar. 18 800 150.00 120,000 200 150.00 30,000
Inventory
Date
Purchases
CHAPTER 7 Inventories
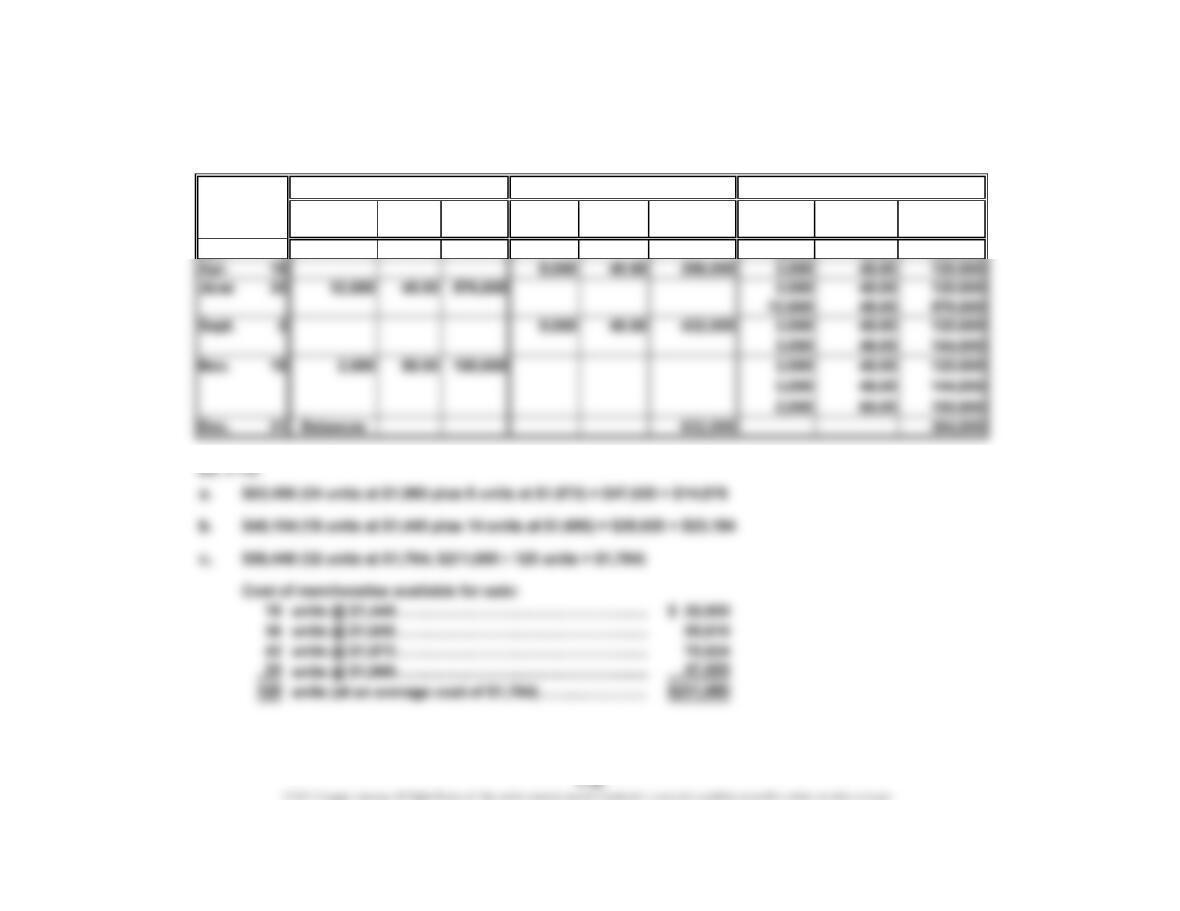
Ex. 7–10
Cost of Merchandise Sold
Unit Total Unit Total Total
Quantity Cost Cost Quantity Cost Cost Quantity Unit Cost Cost
Jan. 1 8,000 40.00 320,000
Date
InventoryPurchases
CHAPTER 7 Inventories
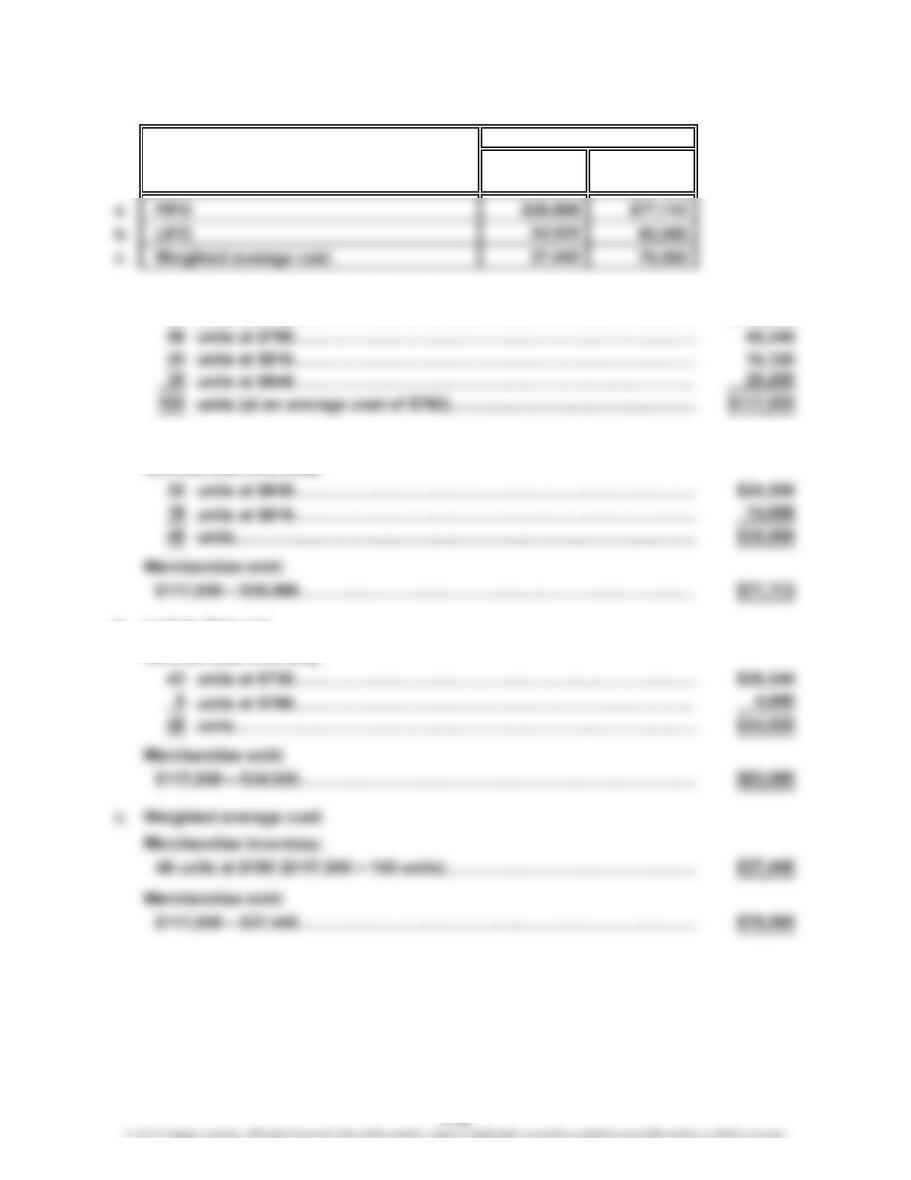
Ex. 7–11
Inventory
Unit Total Unit Total Total
Quantity Cost Cost Quantity Cost Cost Quantity Unit Cost Cost
Jan. 1 8,000 40.00 320,000
Date
Cost of Merchandise SoldPurchases
CHAPTER 7 Inventories
Ex. 7–13
Merchandise Merchandise
Inventory Method Inventory Sold
Cost of merchandise available for sale:
42 units at $720…………………………………………………………………
…
$ 30,240
…
a. First-in, first-out:
Merchandise inventory:
…
…
b. Last-in, first-out:
Merchandise inventory:
…
Cost
CHAPTER 7 Inventories
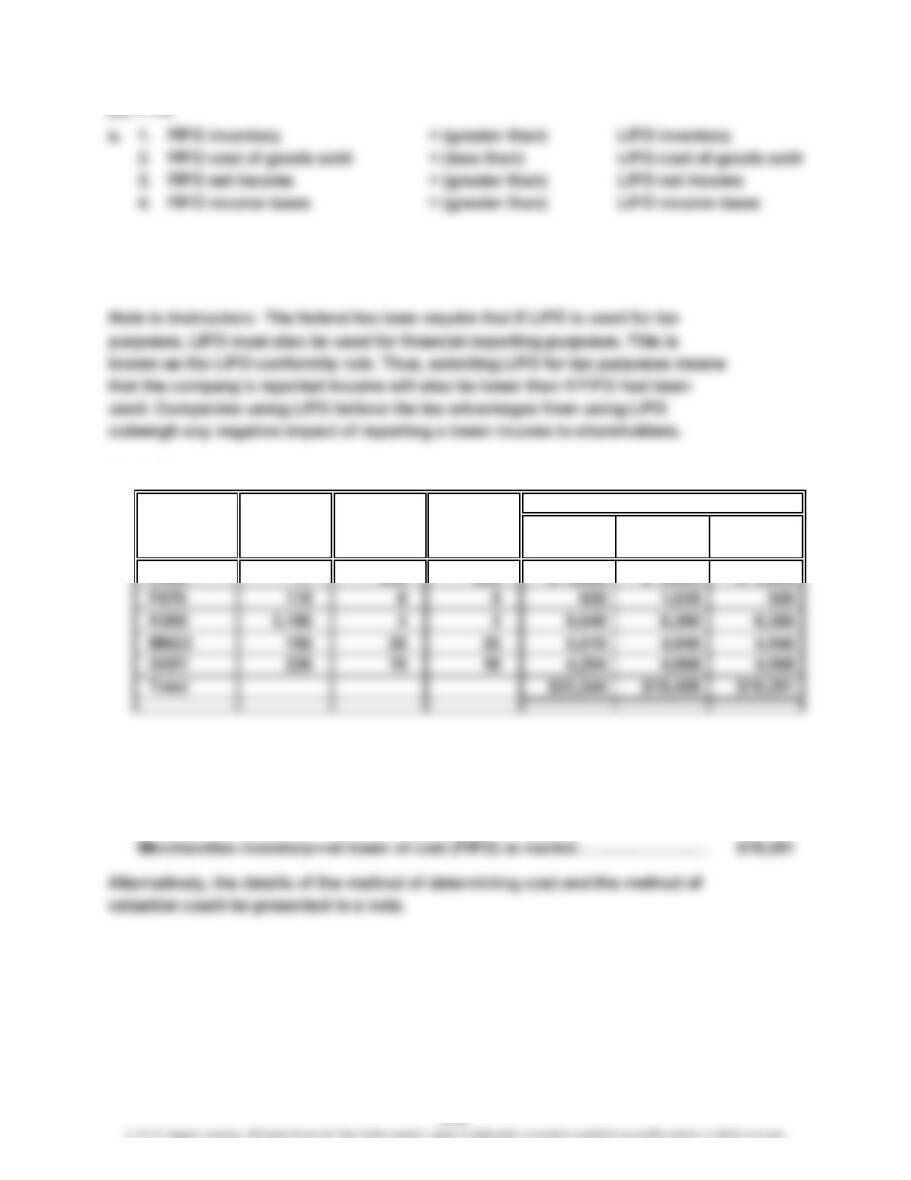
b. In periods of rising prices, the income shown on the company’s tax return
would be lower if LIFO rather than FIFO were used; thus, there is a tax advantage of
using LIFO.
Ex. 7–15
Unit Unit
Inventory Cost Market Lower of
Quantity Price Price Cost Market C or M
77 $40 $39 $ 3,080 $ 3,003 $ 3,003
Ex. 7–16
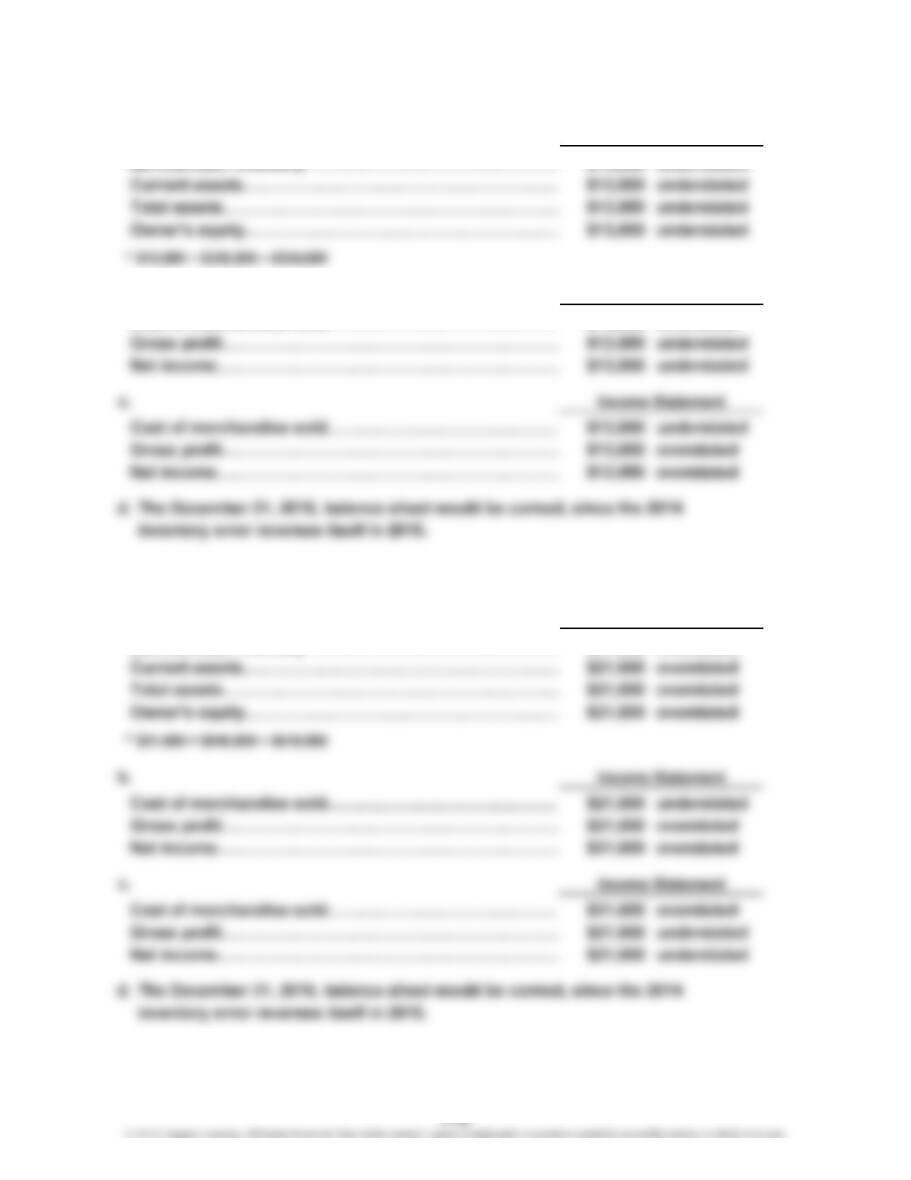
The merchandise inventory would appear in the Current Assets section, as
follows:
Commodity
C300
Total
CHAPTER 7 Inventories
Ex. 7–17
a.
Merchandise inventory*………………………………………
…
$13,850 understated
b.
Cost of merchandise sold……………………………………
…
$13,850 overstated
…
Ex. 7–18
a.
Merchandise inventory*………………………………………
…
$21,600 overstated
…
…
…
Balance Sheet
Income Statement
Balance Sheet
…
CHAPTER 7 Inventories
Ex. 7–19
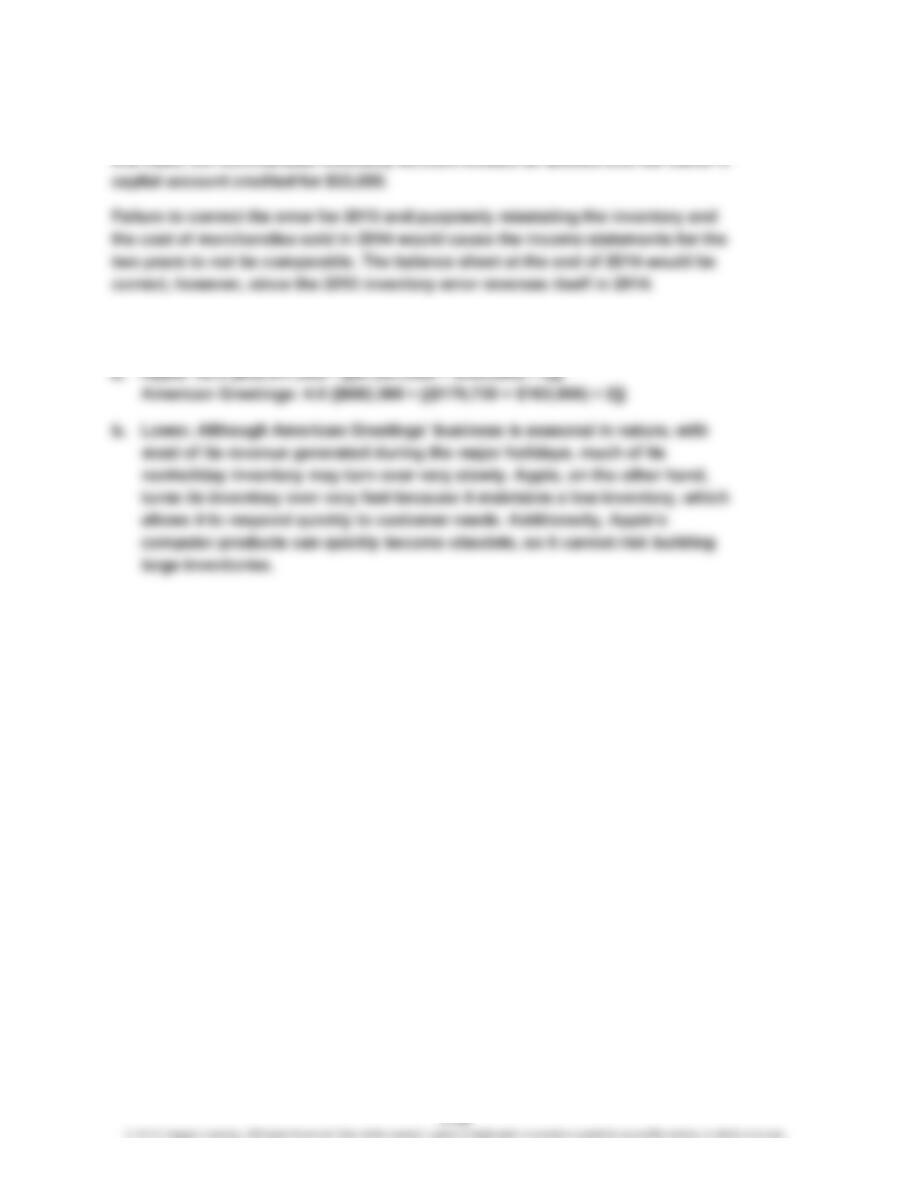
When an error is discovered affecting the prior period, it should be corrected. In
this case, the merchandise inventory account should be debited and the owner’s
Ex. 7–20
CHAPTER 7 Inventories
Ex. 7–21
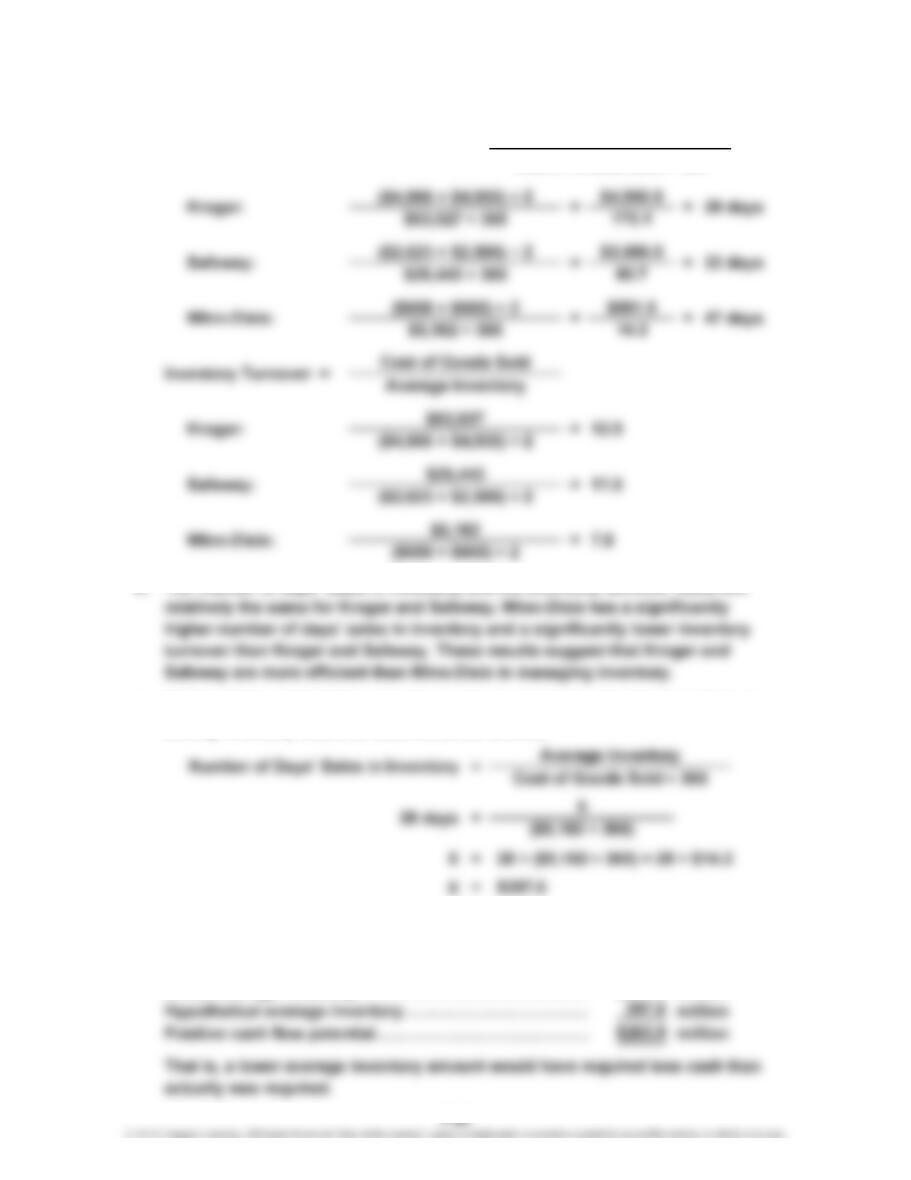
b. The number of days’ sales in inventory and the inventory turnover ratios are
c. If Winn-Dixie matched Kroger’s days’ sales in inventory, then its hypothetical
ending inventory would be determined as follows,
Thus, the additional cash flow that would have been generated is the difference
between the actual average inventory and the hypothetical average inventory,
as follows:
Actual average inventory……………………………………
…
$661.5 million
a.
Number of Days’ Sales in Inventory = Average Inventory
Cost of Goods Sold ÷ 365