Chapter 07 – Reporting and Interpreting Cost of Goods Sold and Inventory
Chapter 07
Reporting and Interpreting Cost of
Goods Sold and Inventory
ANSWERS TO QUESTIONS
1. Inventory often is one of the largest amounts listed under assets on the balance
sheet which means that it represents a significant amount of the resources
available to the business. The inventory may be excessive in amount, which is a
2. Fundamentally, inventory should include those items, and only those items,
3. The cost principle governs the measurement of the ending inventory amount.
4. Goods available for sale is the sum of the beginning inventory and the amount of
5. Beginning inventory is the stock of goods on hand (in inventory) at the start of the
Chapter 07 – Reporting and Interpreting Cost of Goods Sold and Inventory
7-2
6. (a) Average cost–This inventory costing method in a periodic inventory
system is based on a weighted-average cost for the entire period. At the
end of the accounting period the average cost is computed by dividing the
goods available for sale in units into the cost of goods available for sale
in dollars. The computed unit cost then is used to determine the cost of
7. The specific identification method of inventory costing is subject to manipulation.
Manipulation is possible because one can, at the time of each sale, select (pick
and choose) from the shelf the item that has the highest or the lowest (or some
other) unit cost with no particular rationale for the choice. The rationale may be
Chapter 07 – Reporting and Interpreting Cost of Goods Sold and Inventory
7-3
8. LIFO and FIFO have opposite effects on the inventory amount reported under
assets on the balance sheet. The ending inventory is based upon either the
oldest unit cost or the newest unit cost, depending upon which method is used.
9. LIFO versus FIFO will affect the income statement in two ways: (1) the amount of
cost of goods sold and (2) income. When the prices are rising, FIFO will give a
10. When prices are rising, LIFO causes a lower taxable income than does FIFO.
Therefore, when prices are rising, income tax is less under LIFO than FIFO. A
11. LCM is applied when market (defined as current replacement cost) is lower than
the cost of units on hand. The ending inventory is valued at market (lower),
12. When a perpetual inventory system is used, the unit cost must be known for each
item sold at the date of each sale because at that time two things happen: (a) the
units sold and their costs are removed from the perpetual inventory record and
the new inventory balance is determined; (b) the cost of goods sold is
Chapter 07 – Reporting and Interpreting Cost of Goods Sold and Inventory
7-4
ANSWERS TO MULTIPLE CHOICE
Authors’ Recommended Solution Time
(Time in minutes)
Mini-exercises
Exercises
Problems
Alternate
Problems
Cases and
Projects
No.
Time
No.
Time
No.
Time
No.
Time
No.
Time
1
5
1
15
1
30
1
30
1
20
2
5
2
20
2
30
2
40
2
20
3
5
3
3
40
3
35
3
20
4
10
4
10
4
40
4
40
4
20
5
5
5
15
5
45
5
40
6
5
6
15
6
50
6
20
7
5
7
30
7
40
7
30
8
5
8
30
8
40
8
9
10
9
30
9
35
10
30
10
20
11
15
12
20
13
15
14
20
15
15
16
20
17
20
18
20
19
25
20
20
21
25
22
25
* Due to the nature of these cases and projects, it is very difficult to estimate the
amount of time students will need to complete the assignment. As with any open-ended
project, it is possible for students to devote a large amount of time to these
Chapter 07 – Reporting and Interpreting Cost of Goods Sold and Inventory
MINI-EXERCISES
M7–1.
Type of Business
Type of Inventory Merchandising Manufacturing
Work in process X
M7–2.
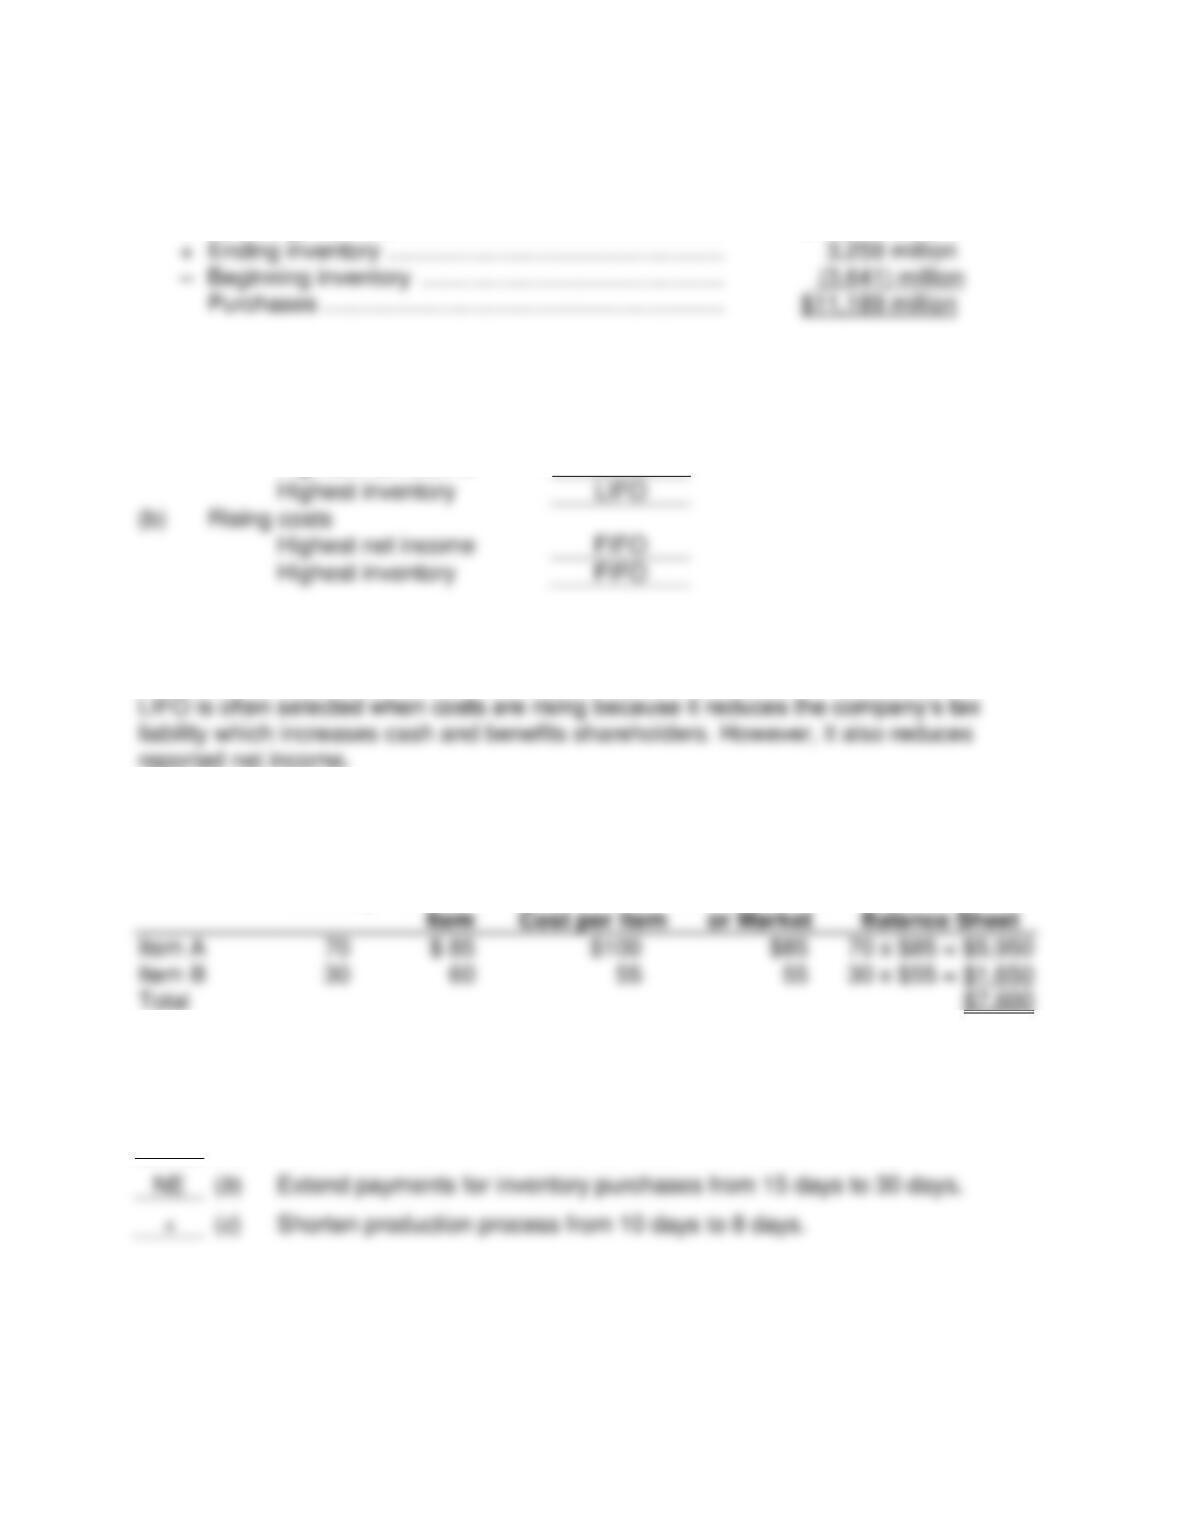
To record the purchase of 90 new shirts in accordance with the cost principle (perpetual
inventory system):
M7–3.
(1) Part of
inventory
(2) Expense
as incurred
a. Wages of factory workers
X
b. Costs of raw materials purchased
X
c. Sales salaries
d. Heat, light, and power for the factory building
X
Chapter 07 – Reporting and Interpreting Cost of Goods Sold and Inventory
7-6
M7–4.
Computation: Simply rearrange the basic inventory model (BI + P – EI = CGS):
Cost of goods sold …………………………………………. $11,571 million
M7–5.
(a)
Declining costs
Highest net income
LIFO
Highest inventory
LIFO
(b)
Rising costs
Highest net income
FIFO
Highest inventory
FIFO
M7–6.
M7–7.
Quantity
Item A
Item B
Total
Cost per
Replacement
Lower of Cost
Reported on
M7–8.
+
(a)
Parts inventory delivered daily by suppliers instead of weekly.
Extend payments for inventory purchases from 15 days to 30 days.
+
(c)
Shorten production process from 10 days to 8 days.

Chapter 07 – Reporting and Interpreting Cost of Goods Sold and Inventory
7-7
M7–9.
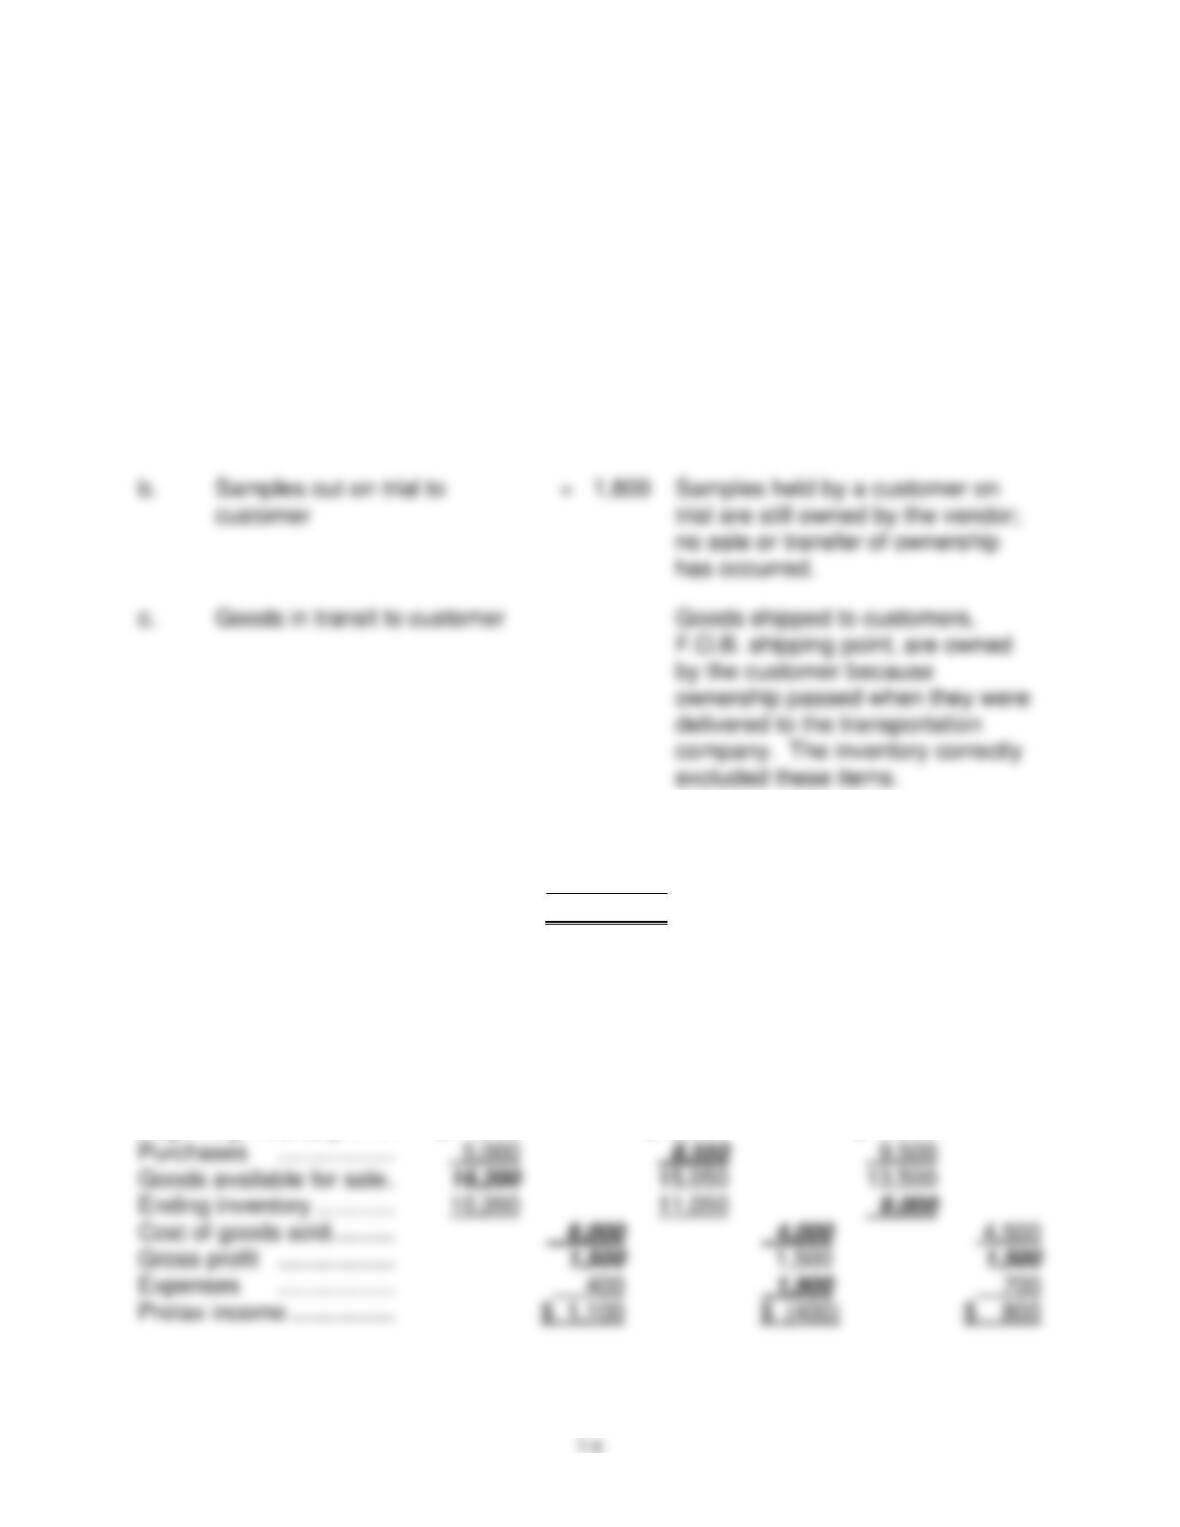
Understatement of the 2011 ending inventory by $100,000 caused 2011 pretax income
to be understated and 2012 pretax income to be overstated by the same amount.
Chapter 07 – Reporting and Interpreting Cost of Goods Sold and Inventory
EXERCISES
E7–1
Item
Amount
Explanation
Ending inventory (physical count on
December 31, 2011)
$34,500
Per physical inventory.
a.
Goods purchased and in transit
+ 700
Goods purchased and in transit,
F.O.B. shipping point, are owned
by the purchaser.
customer
trial are still owned by the vendor;
no sale or transfer of ownership
has occurred.
d.
Goods sold and in transit
+ 1,500
Goods sold and in transit, F.O.B.
destination, are owned by the seller
until they reach destination.
Correct inventory, December 31, 2011
$38,500
E7–2.
(Italics for missing amounts only.)
Case A Case B Case C
Net sales revenue ………. $7,500 $5,500 $6,000
Beginning inventory …….. $11,200 $ 6,500 $ 4,000
Chapter 07 – Reporting and Interpreting Cost of Goods Sold and Inventory
7-9
E7–3.
(Italics for missing amounts only.)
Case
Sales
Revenue
Beg.
Inven-
tory
Pur-
chases
Total
Avail-
able
Ending
Inventory
Cost of
Goods
Sold
Gross
Profit
Ex–
penses
Pretax
Income
or
(Loss)
A
$ 650
$100
$700
$800
$500
$300
$350
$200
$150
E7–4.
Computations:
Simply rearrange the cost of goods sold equation
BI + P – EI = CGS
P = CGS – BI + EI
Cost of goods sold …………………………….. $1,178,584,000
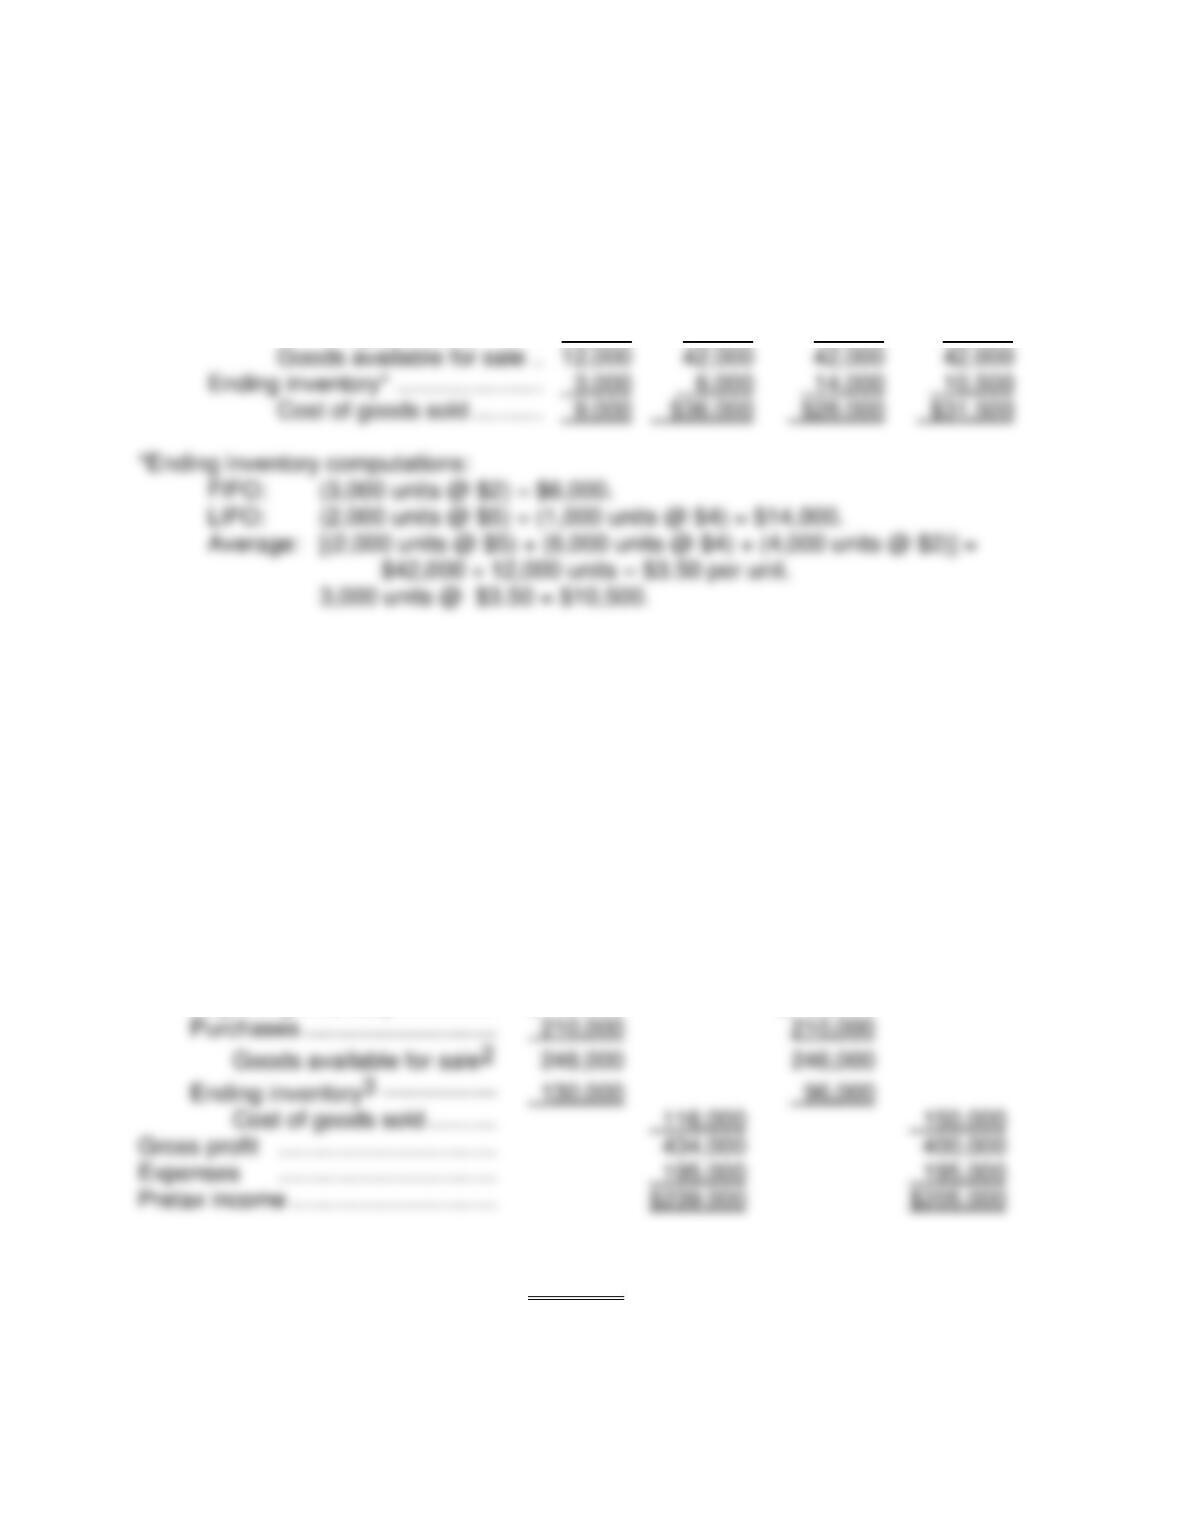
E7-5
Average
Units FIFO LIFO Cost
Cost of goods sold:
Beginning inventory ($5) …………. 2,000 10,000 10,000 10,000
Purchases (March 21) ($7) ……… 5,000 35,000 35,000 35,000
B
C
D
E
(50)
Chapter 07 – Reporting and Interpreting Cost of Goods Sold and Inventory
7-10
E7–6
Average
Units FIFO LIFO Cost
Cost of goods sold:
Beginning inventory ($5) …………. 2,000 $10,000 $10,000 $10,000
Purchases (March 21) ($4) ……… 6,000 24,000 24,000 24,000
(August 1) ($2) ………. 4,000 8,000 8,000 8,000
E7–7.
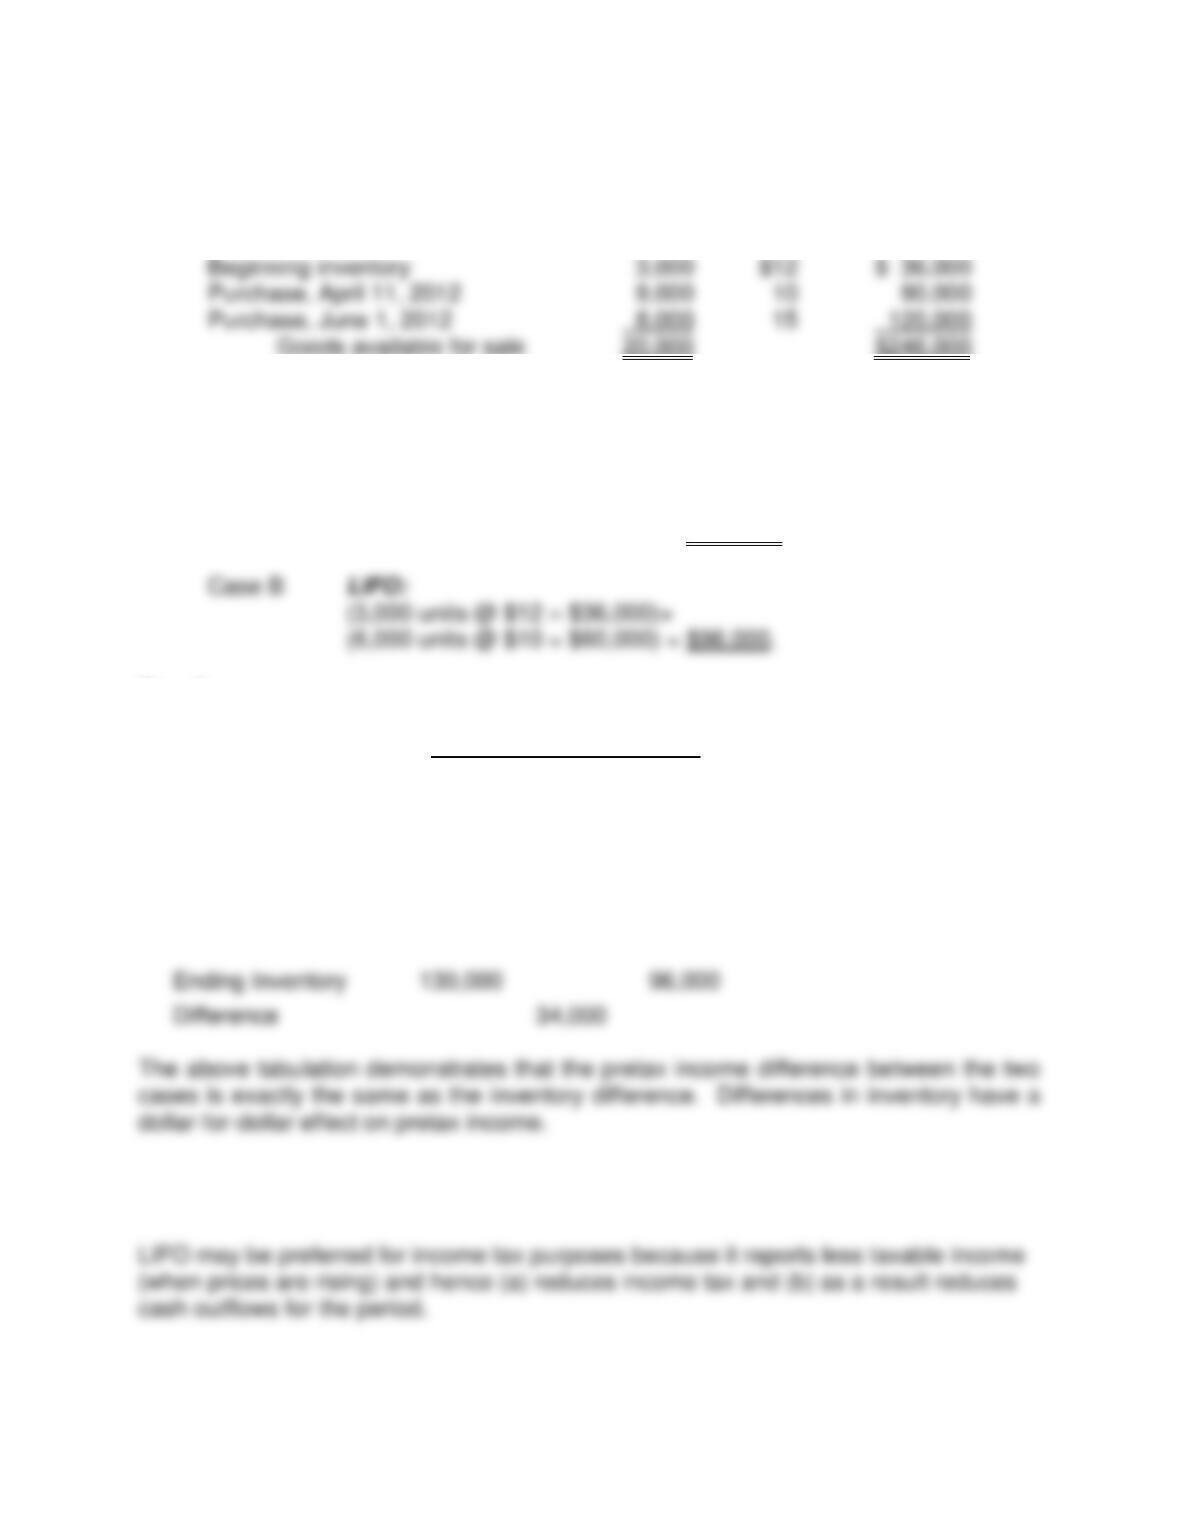
Req. 1
ELEMENT COMPANY
Income Statement
For the Year Ended December 31, 2012
Case A Case B
FIFO LIFO
Sales revenue1 ………………………… $550,000 $550,000
Cost of goods sold:
Beginning inventory ……………. $ 36,000 $ 36,000
Computations:
(1) Sales: (11,000 units @ $50) = $550,000
Chapter 07 – Reporting and Interpreting Cost of Goods Sold and Inventory
7-11
E7–7. (continued)
(2) Goods available for sale (for both cases):
Units Unit Cost Total Cost
(3) Ending inventory (20,000 available – 11,000 units sold = 9,000 units):
Case A FIFO:
(8,000 units @ $15 = $120,000) +
(1,000 units @ $10 = $10,000) = $130,000.
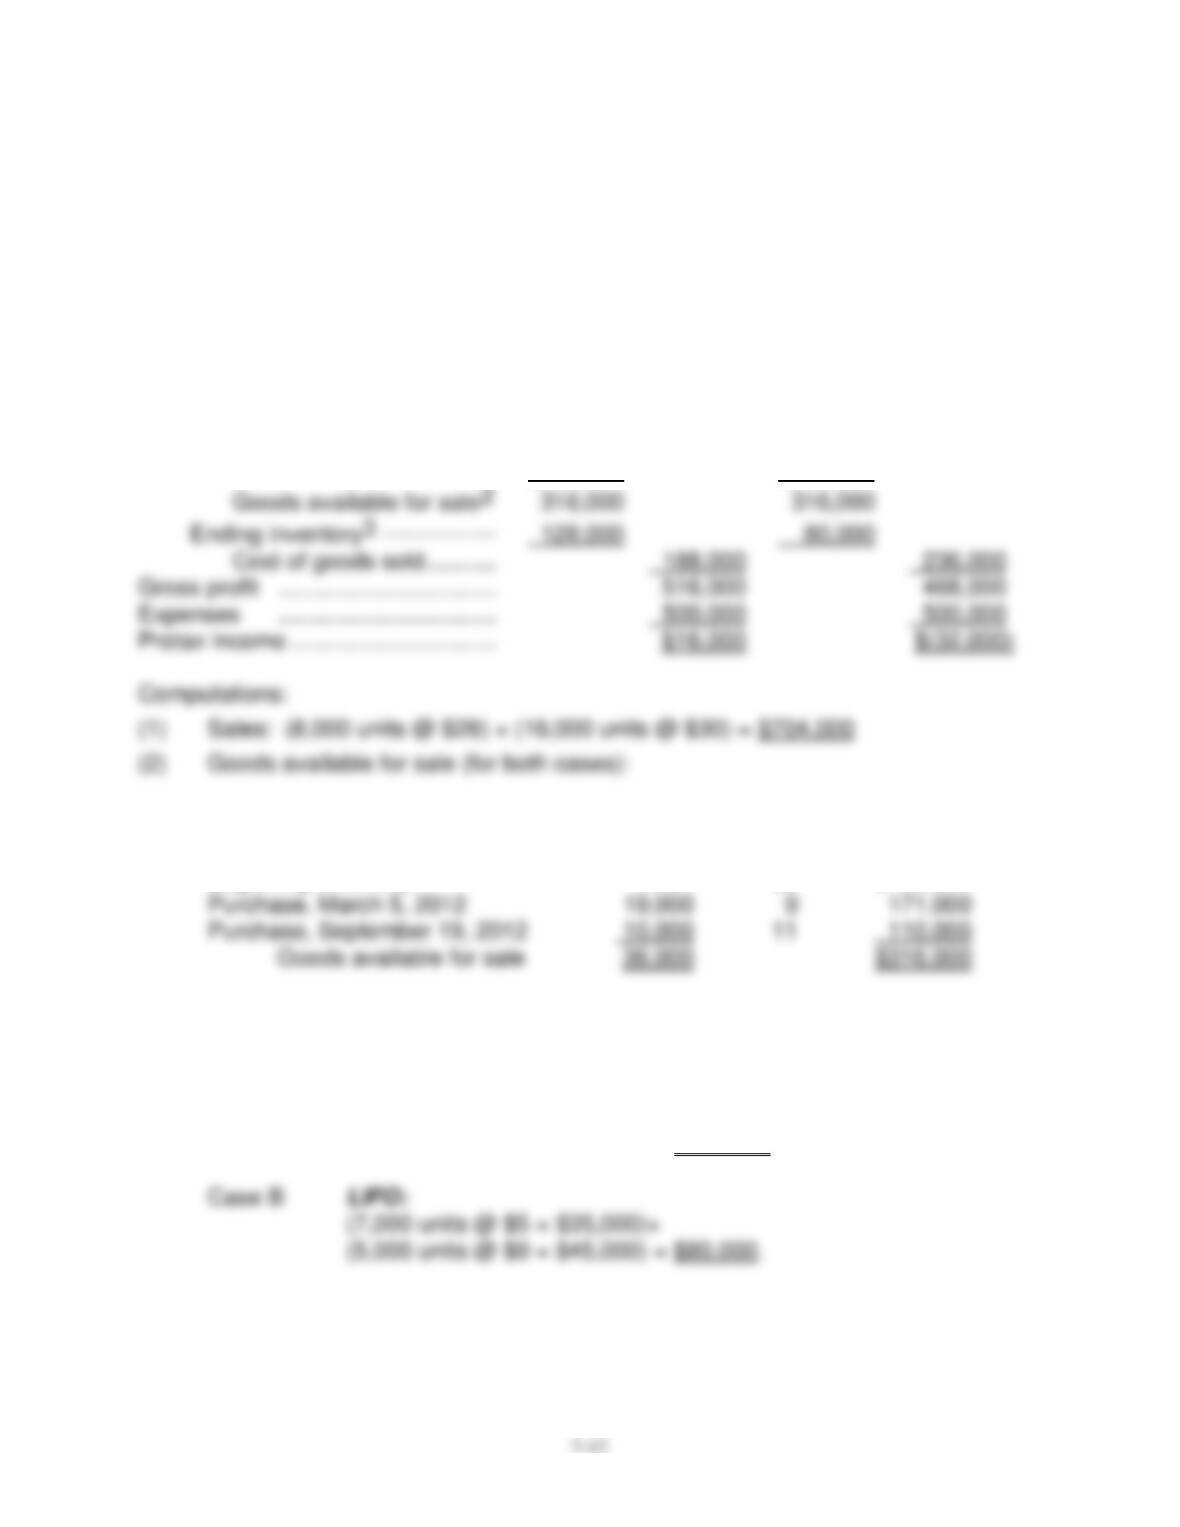
Req. 2
Comparison of Amounts
Case A Case B
FIFO LIFO
Pretax Income $239,000 $205,000
Difference $34,000
Req. 3
Chapter 07 – Reporting and Interpreting Cost of Goods Sold and Inventory
E7–8.
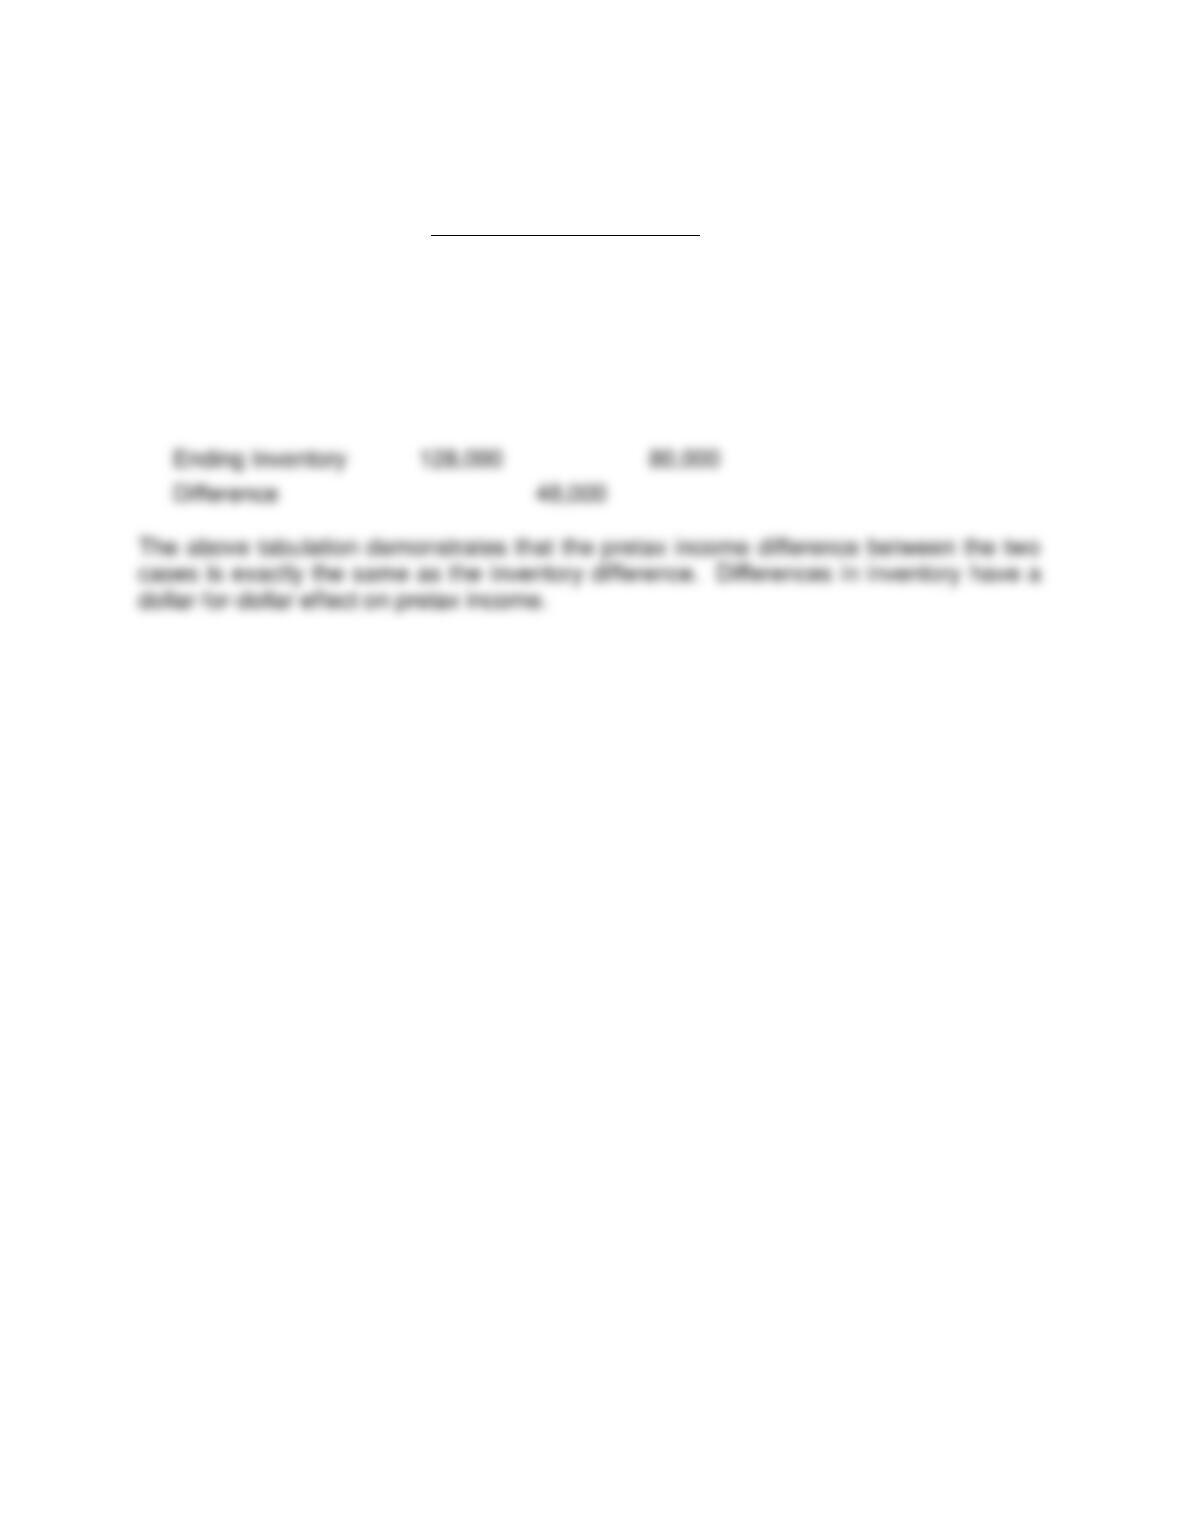
Req. 1
BECK INC.
Income Statement
For the Year Ended December 31, 2012
Case A Case B
FIFO LIFO
Sales revenue1 ………………………… $704,000 $704,000
Cost of goods sold:
Beginning inventory ……………. $ 35,000 $ 35,000
Purchases ………………………… 281,000 281,000
Units Unit Cost Total Cost
Beginning inventory 7,000 $5 $ 35,000
(3) Ending inventory (36,000 available – 24,000 units sold = 12,000 units):
Case A FIFO:
(10,000 units @ $11 = $110,000) +
(2,000 units @ $9 = $18,000) = $128,000.
Chapter 07 – Reporting and Interpreting Cost of Goods Sold and Inventory
7-13
E7–8. (continued)
Req. 2
Comparison of Amounts
Case A Case B
FIFO LIFO
Pretax Income $16,000 $(32,000)
Difference $48,000
Req. 3
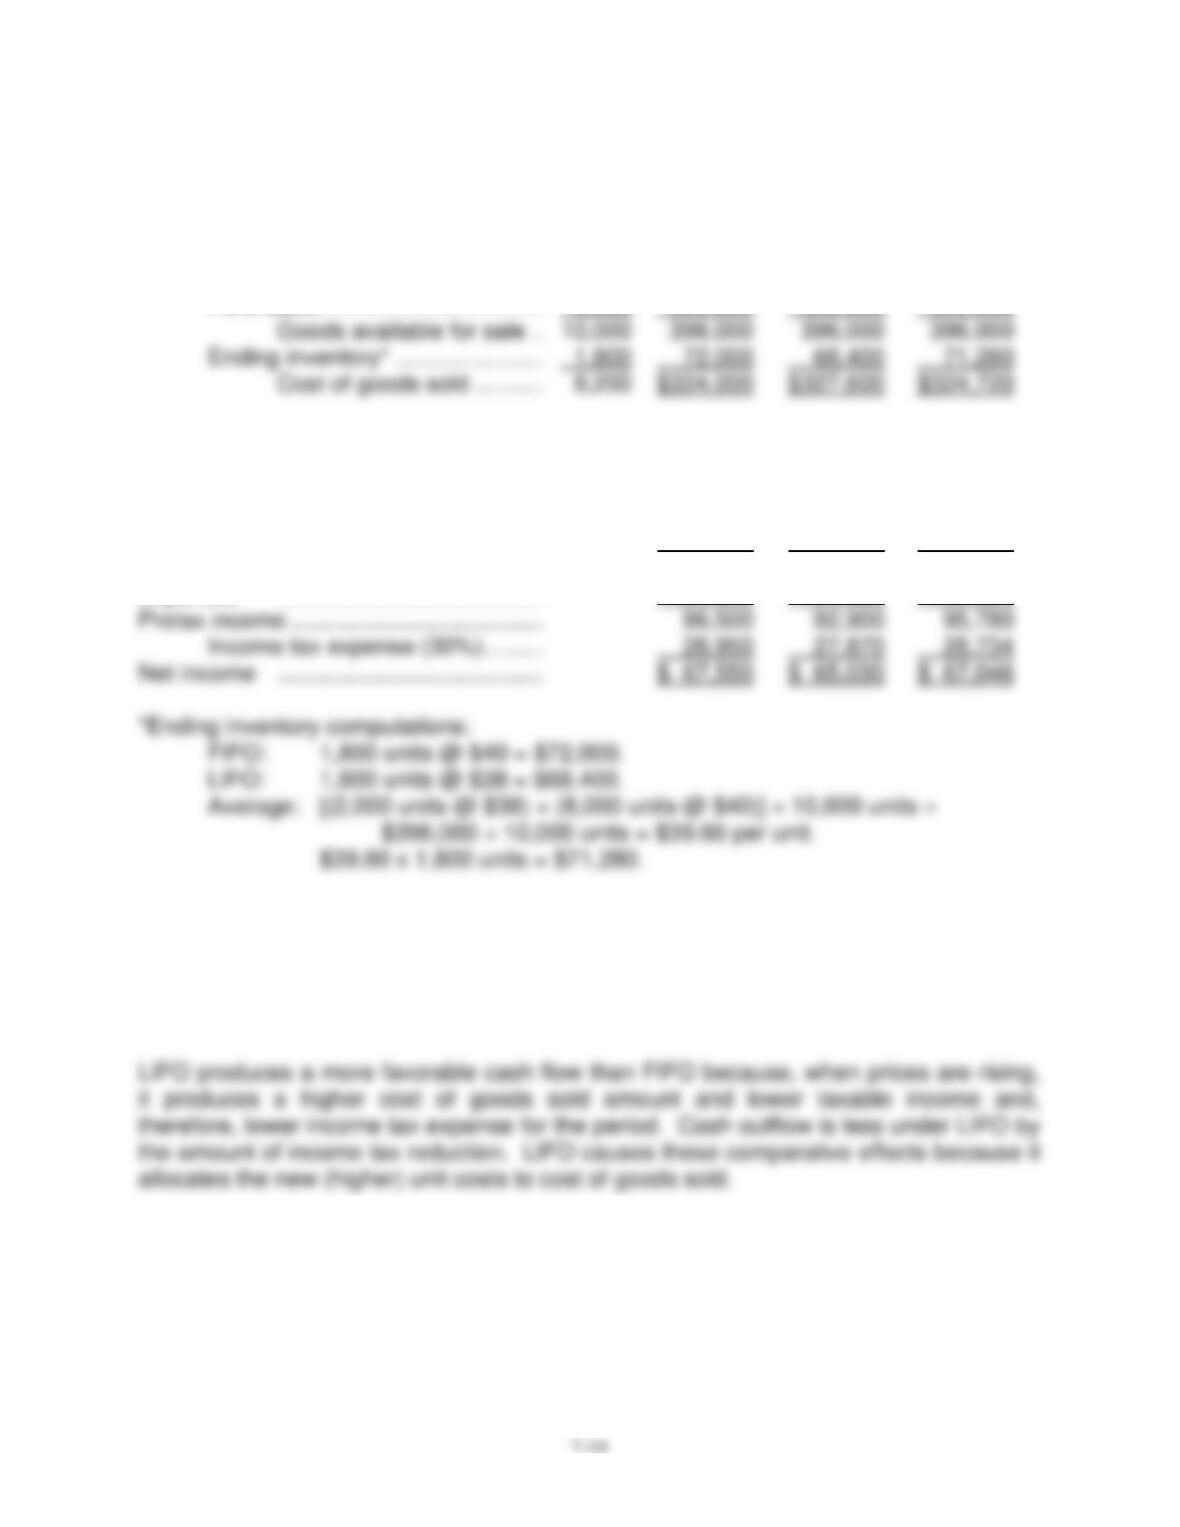
LIFO may be preferred for income tax purposes because it reports less taxable income
(when prices are rising) and hence (a) reduces income tax and (b) as a result reduces
cash outflows for the period.
Chapter 07 – Reporting and Interpreting Cost of Goods Sold and Inventory
E7–9.
Req. 1
Average
Units FIFO LIFO Cost
Cost of goods sold:
Beginning inventory ……………….. 2,000 $ 76,000 $ 76,000 $ 76,000
Purchases…………………………….. 8,000 320,000 320,000 320,000
Average
Income statement FIFO LIFO Cost
Sales revenue ………………………………… $615,000 $615,000 $615,000
Cost of goods sold…………………………... 324,000 327,600 324,720
Gross profit ………………………………….. 291,000 287,400 290,280
Expenses ………………………………….. 194,500 194,500 194,500
Req. 2
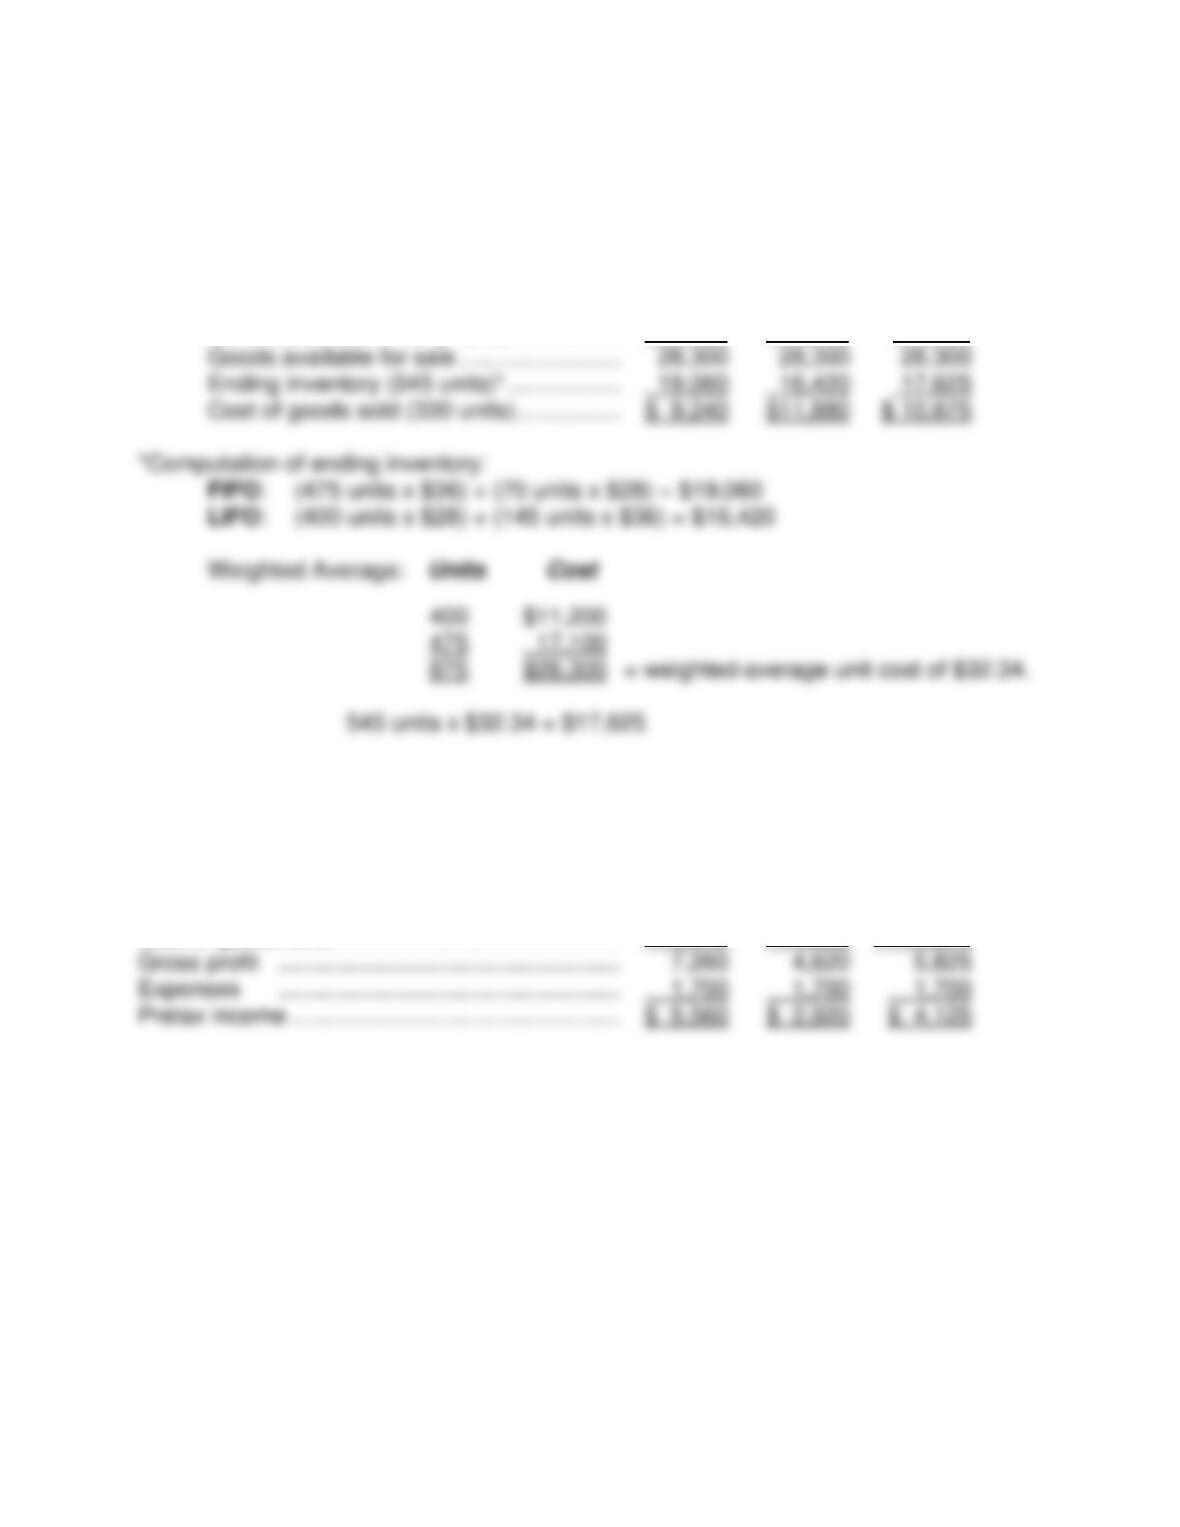
FIFO produces a more favorable (higher) net income because when prices are rising it
gives a lower cost of goods sold amount. FIFO allocates the old (lower) unit costs to
cost of goods sold.
Req. 3
When prices are falling, the opposite effect occurs–LIFO produces higher net income
and less favorable cash flow than does FIFO.
Chapter 07 – Reporting and Interpreting Cost of Goods Sold and Inventory
7-15
E7–10.
Req. 1
Average
FIFO LIFO Cost
Cost of goods sold:
Beginning inventory (400 units @ $28) … $11,200 $11,200 $11,200
Purchases (475 units @ $36) …………….. 17,100 17,100 17,100
Req. 2
Average
FIFO LIFO Cost
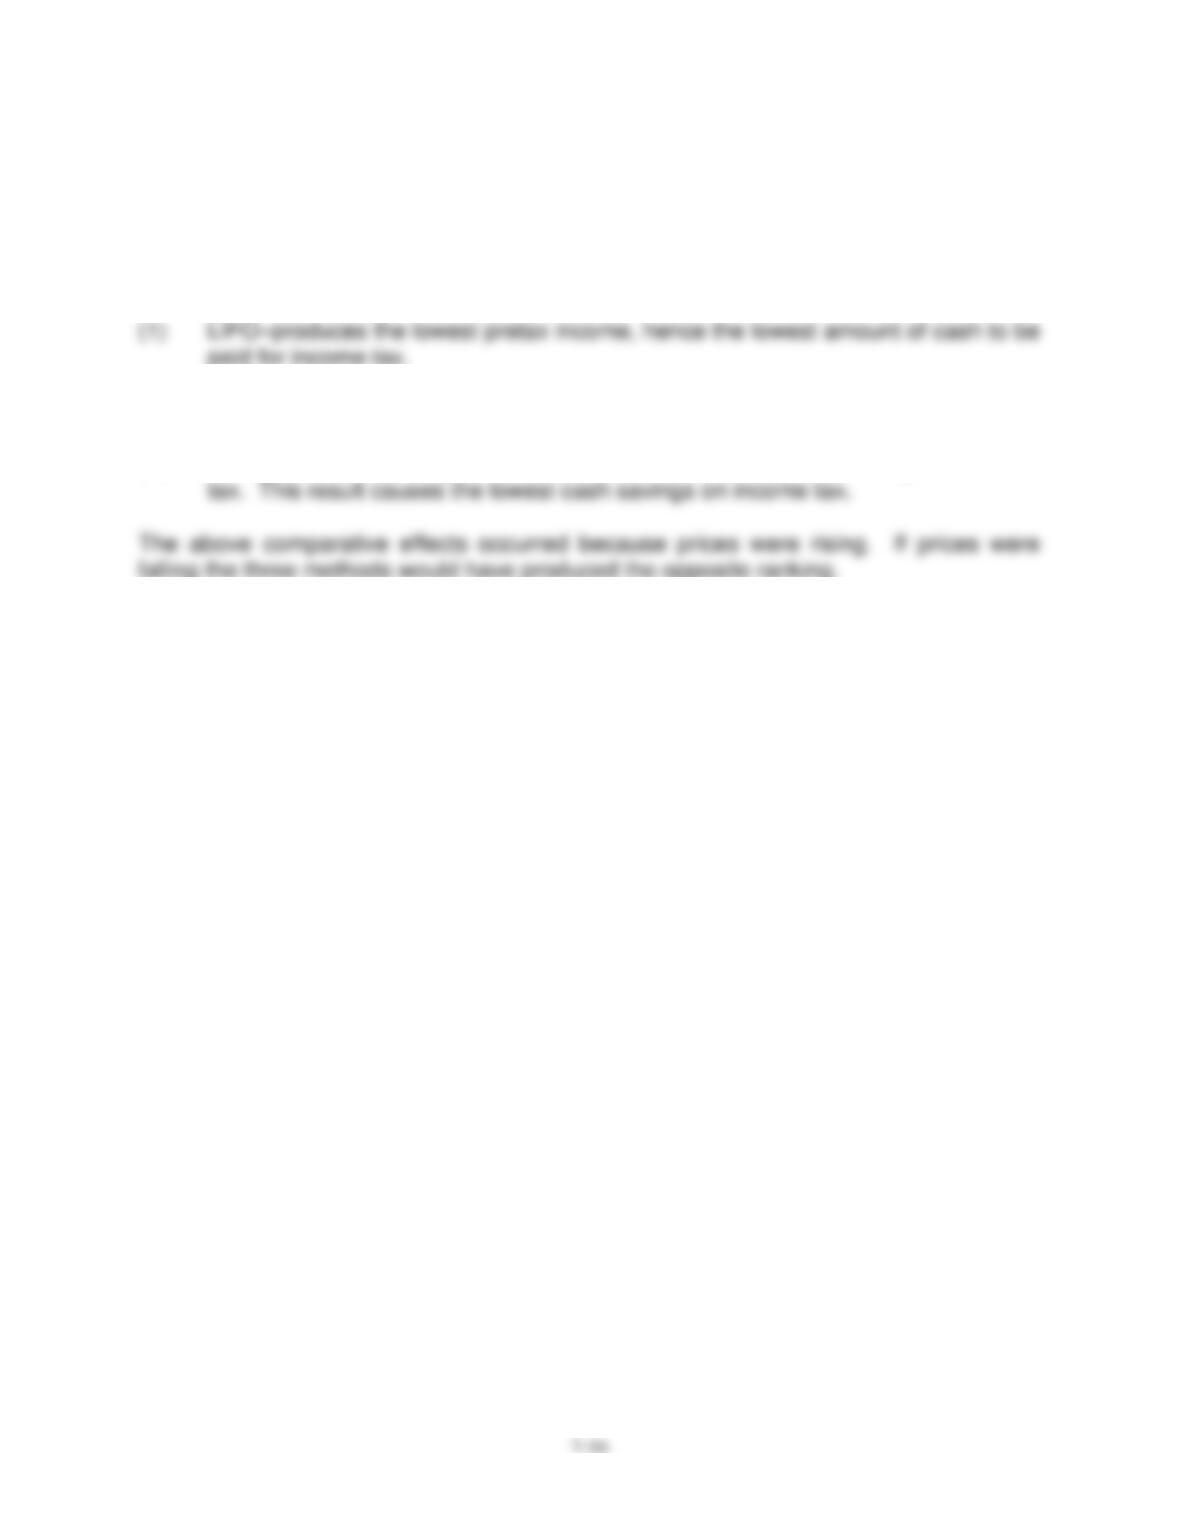
Sales revenue ($50 x 330) …………………………. $16,500 $16,500 $16,500
Cost of goods sold……………………………………… 9,240 11,880 10,675
Chapter 07 – Reporting and Interpreting Cost of Goods Sold and Inventory
E7–10. (continued)
Req. 3
Ranking in order of favorable cash flow: The higher rankings are given to the methods
that produce the lower income tax expense because the lower the income tax expense
the higher the cash savings.
(2) Weighted average–produces next lower pretax income.
(3) FIFO–produces the highest pretax income and as a result the highest income
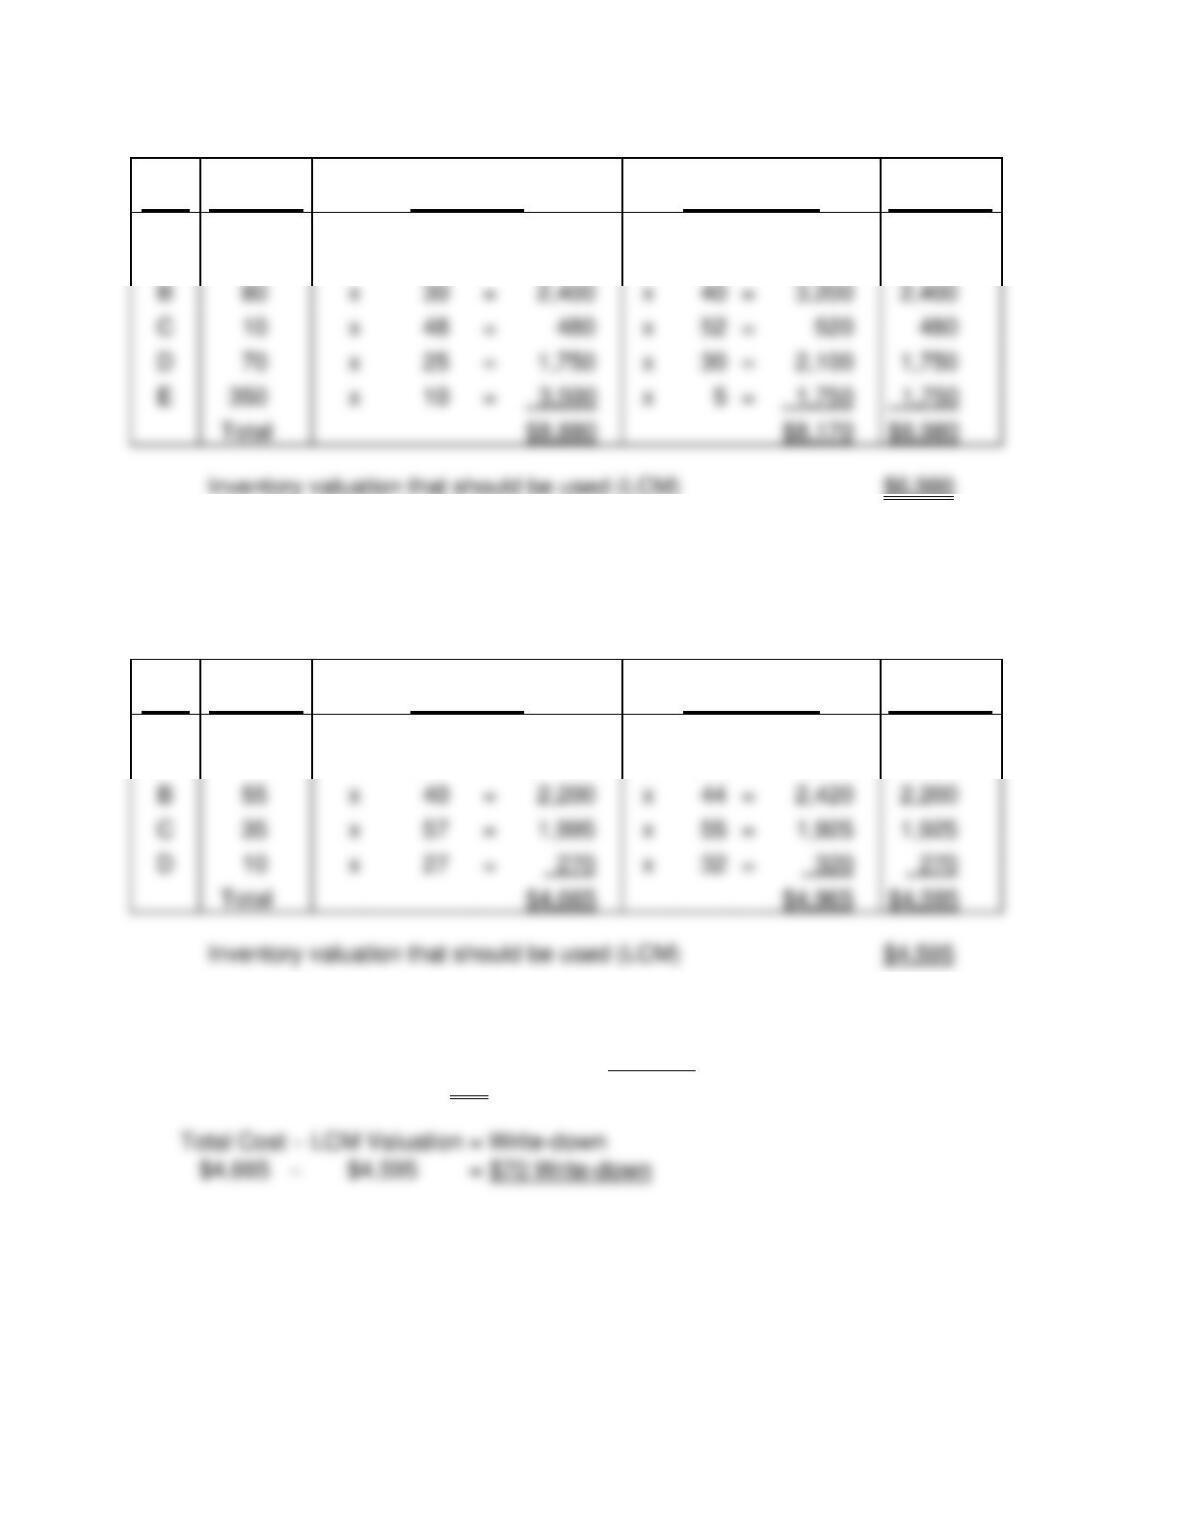
Chapter 07 – Reporting and Interpreting Cost of Goods Sold and Inventory
7-17
E7–11.
Item
Quantity
Total Cost
Total Market
LCM
Valuation
A
50
x
$15
=
$ 750
x
$12
=
$600
$600
E7–12.
Req. 1
Item
Quantity
Total Cost
Total Market
LCM
Valuation
A
20
x
$10
=
$ 200
x
$15
=
$300
$200
C
35
x
=
x
=
1,925
D
x
=
x
=
$4,665
$4,595
Req. 2
The write-down to lower of cost or market will increase cost of goods sold expense by
the amount of the write-down, $70:
B
80
x
=
x
=
3,200
C
10
x
=
480
x
=
520
480
D
70
x
=
x
=
2,100
E
x
=
x
=

Chapter 07 – Reporting and Interpreting Cost of Goods Sold and Inventory
E7–13.
Req. 1
Inventory turnover
=
Cost of Goods Sold
=
$50,144
=
48.99
Average Inventory
($1,180+$867)/2
Average days to sell inventory = 365 / inventory turnover = 365 / 48.99 = 7.5 days
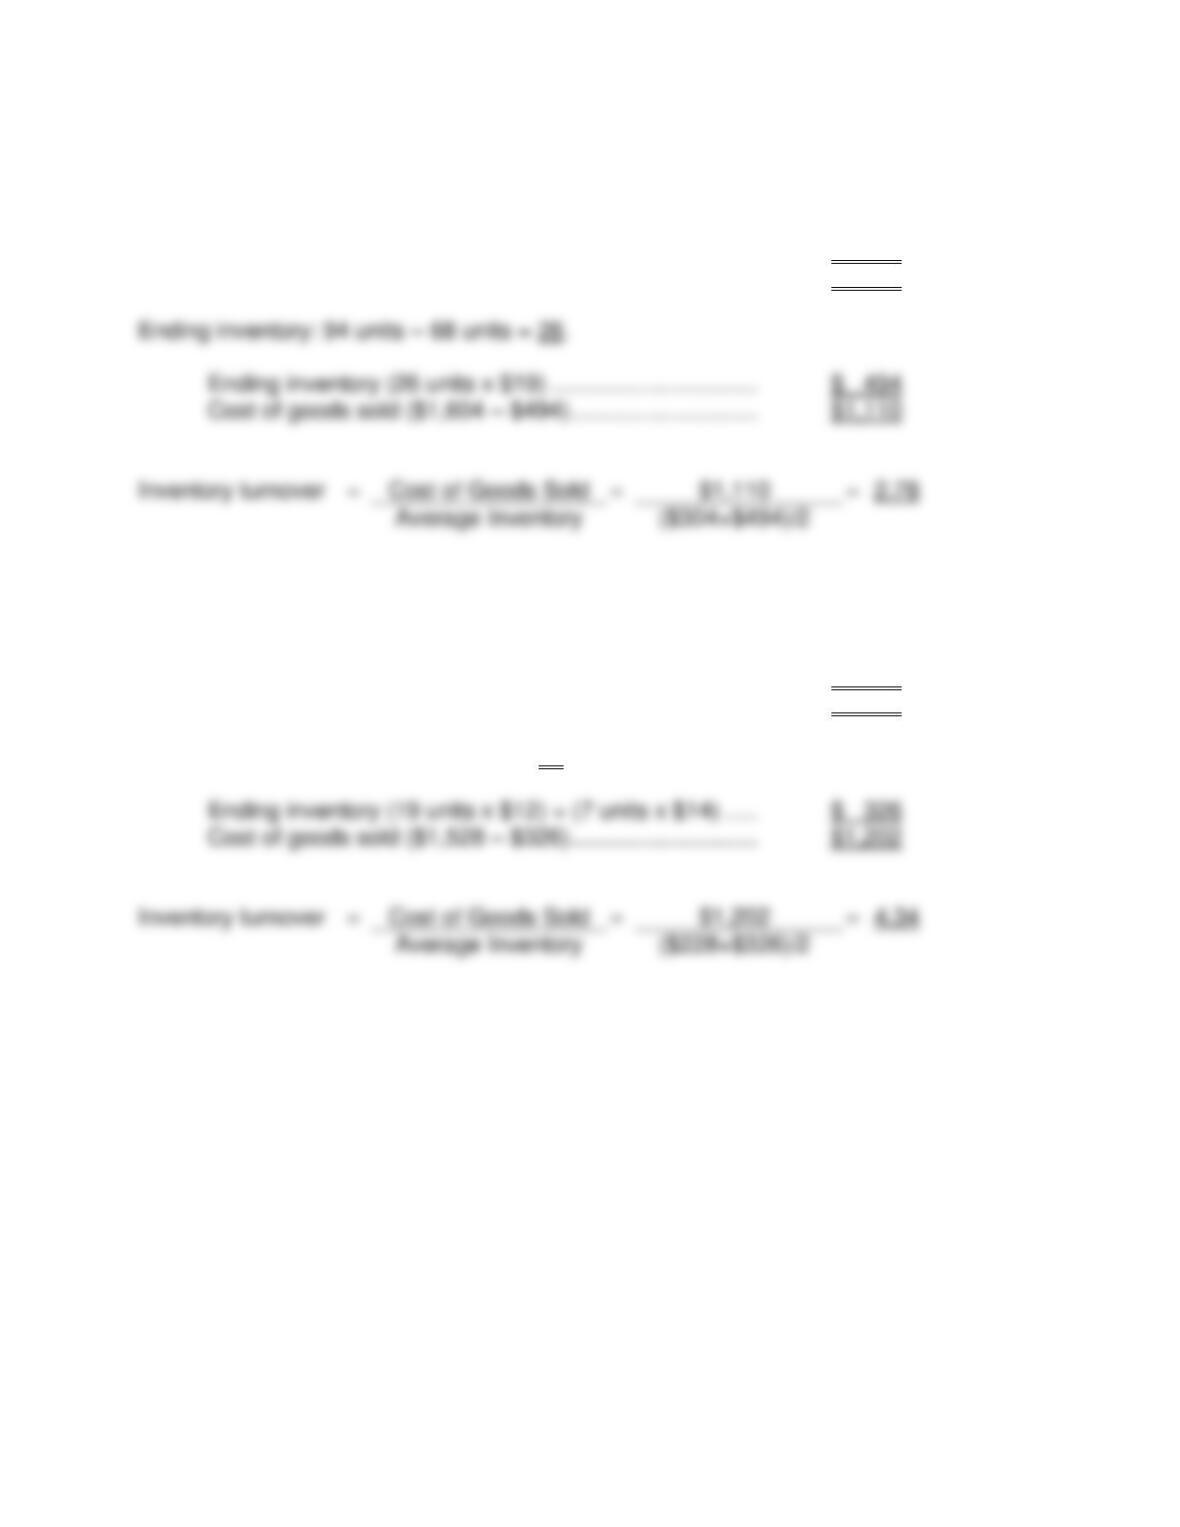
Req. 2
Chapter 07 – Reporting and Interpreting Cost of Goods Sold and Inventory
7-19
E7–14.
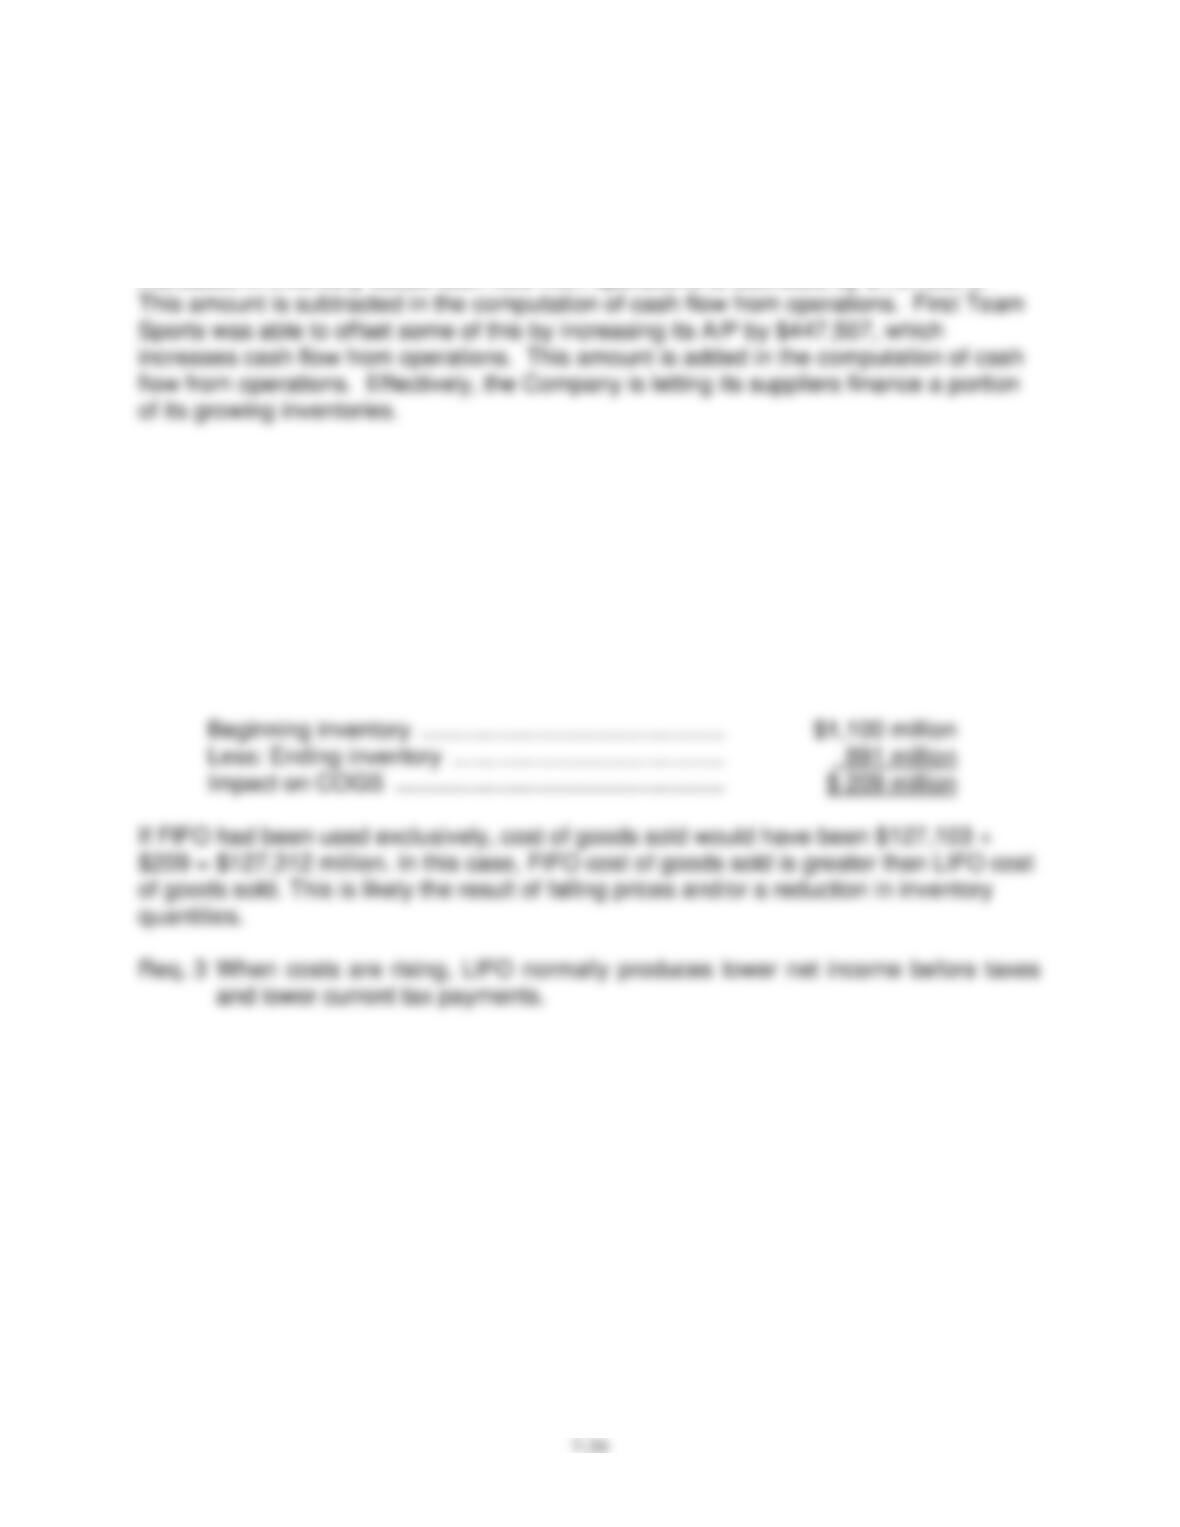
CASE A – FIFO:
Goods available for sale for FIFO:
Units (19 + 25 + 50) …………………………………………….. 94
Amount ($304 + 350 + 950) ………………………………….. $1,604
CASE B – LIFO:
Goods available for sale for LIFO:
Units (19 + 25 + 50) …………………………………………….. 94
Amount ($228 + 350 + 950) ………………………………….. $1,528
Ending inventory: 94 units – 68 units = 26.
The FIFO inventory turnover ratio is normally thought to be a more accurate indicator
when prices are changing because LIFO can include very old inventory prices in ending
inventory balances.
Chapter 07 – Reporting and Interpreting Cost of Goods Sold and Inventory
E7–15.
Current Year Previous Year Change
Inventory 22,813,850 – 20,838,171 = 1,975,679
A/P 9,462,883 – 9,015,376 = 447,507
Increases in inventory cause cash flow from operations to decrease by $1,975,679.
E7–16.
Req. 1 The reported ending inventory for Ford was $8,618 million. If FIFO were used
exclusively, the ending inventory would have been $891 million higher than
reported, or $9,509 million.
Req. 2 The restated cost of goods sold amount must reflect the restatement of both
beginning and ending inventory: