Chapter 13
Analyzing and Interpreting
Financial Statements
QUESTIONS
1. Financial reporting includes the entire process of preparing and issuing financial
2. With comparative statements, financial statement items for two or more successive
4. The nature of a company’s business, the composition of its current assets, and the
5. A 2-to-1 current ratio may not be adequate if the company’s current assets consist of
7. When evaluated in light of a company’s credit terms, the number of days’ sales
8. A high accounts receivable turnover implies that accounts are collected quickly,
9. Users are interested in the capital structure of a company, as measured by debt and
10. Inventory turnover reflects on the efficiency of inventory management. That is, a
11. Since management is responsible for a company’s performance, all ratios that are
12. Almost all companies have some liabilities. Since total assets equals total liabilities
14. Profit margin: Net Income / Sales ($ millions)
15. Equity ratio: Total Equity / Total Assets ($ in millions)
16. Debt ratio: Total Liabilities / Total Assets (₩ in millions)
17. Return on total assets: Net Income / Average Total Assets (₩ in millions)
QUICK STUDY
Quick Study 13-1 (5 minutes)
is a. Income statement
Quick Study 13-2 (10 minutes)
Quick Study 13-3 (15 minutes)
2016
2015
Dollar
Change
Percent
Change
Quick Study 13-4 (5 minutes)
Trend percents
Quick Study 13-5 (5 minutes)
Common-size percents
Quick Study 13-6 (10 minutes)
Ratio
2016
2015
Change
1. Profit Margin Ratio …………………………..
9%
8%
Favorable
3. Gross Margin Ratio ………………………….
Unfavorable
5. Accounts Receivable Turnover ………..
Unfavorable
7. Inventory Turnover ………………………….
Favorable
8. Dividend Yield …………………………..…….
Favorable
Quick-Study 13–7 (15 minutes)
Tesla has a greater amount of working capital. This by itself does not
indicate whether the company is more capable of meeting its current
Quick Study 13-8A (5 minutes)
This material error should be reported on the statement of retained
Quick Study 13-9 (10 minutes)
a. Although ratio analysis can eliminate currency differences, it cannot
eliminate differences in the application of GAAP under different
b. A key advantage to using horizontal and vertical analyses when
EXERCISES
Exercise 13-1 (10 minutes)
Exercise 13-2 (5 minutes)
1. Profit Margin (f); Total Asset Turnover (e) —in either order
Exercise 13-3 (20 minutes)
2016
2015
2014
2013
2012
Sales ………………………………….
189
181
168
156
100
201
192
182
169
100
Exercise 13-4 (25 minutes)
2016
2015
Sales …………………………………………….
100.0%
100.0%
Analysis: Overall, this company’s situation has worsened. This is evident from
Exercise 13-5 (25 minutes)
Answer: Net income decreased.
Supporting calculations: When the sum of each year’s common-size cost of
goods sold and total expenses is subtracted from the common-size sales
percent, the net income percent is as follows:
Exercise 13-6 (20 minutes)
Simon Company
Common-Size Comparative Balance Sheets
December 31, 2014-2016
At December 31
2016
2015*
2014
Assets
Cash ………………………………………………………….
6.1%
8.0%
10.0%
Liabilities and Equity
24.8%
13.6%
Long-term notes payable secured by
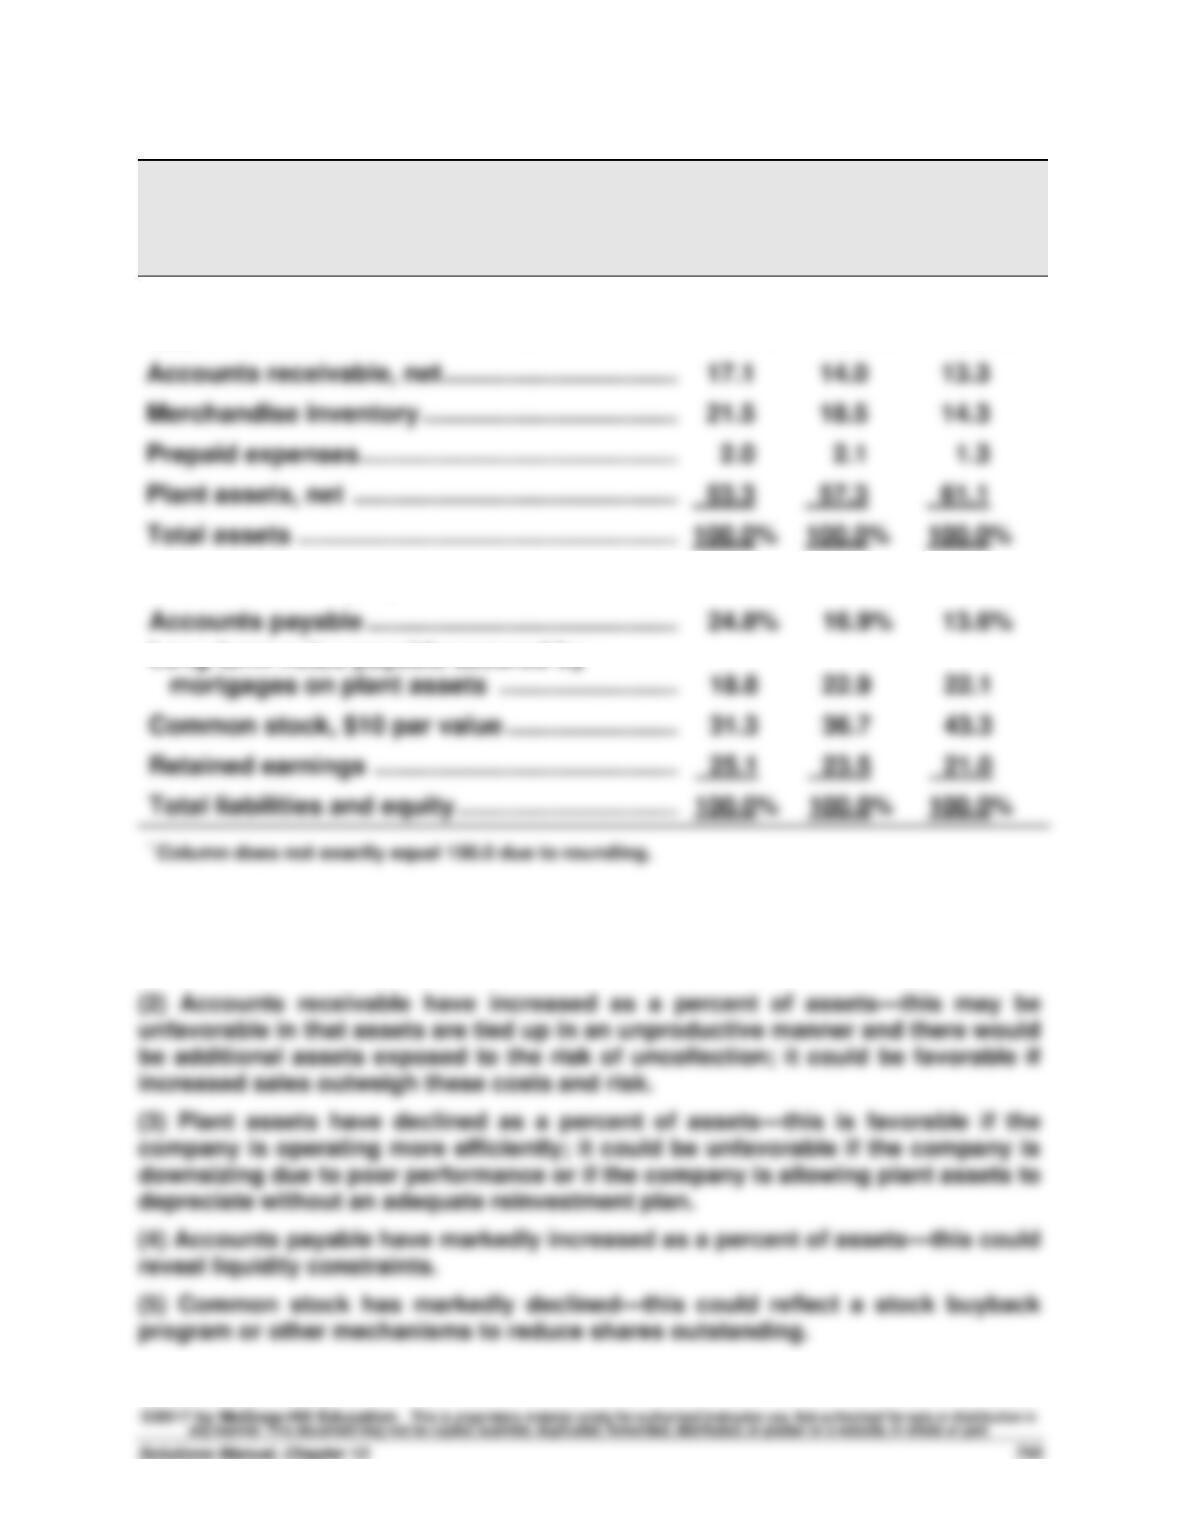
Analysis: Several observations can be made.
(1) Cash as a percent of assets has declined—this is favorable provided sufficient
cash is available for operations.
Exercise 13-7 (25 minutes)
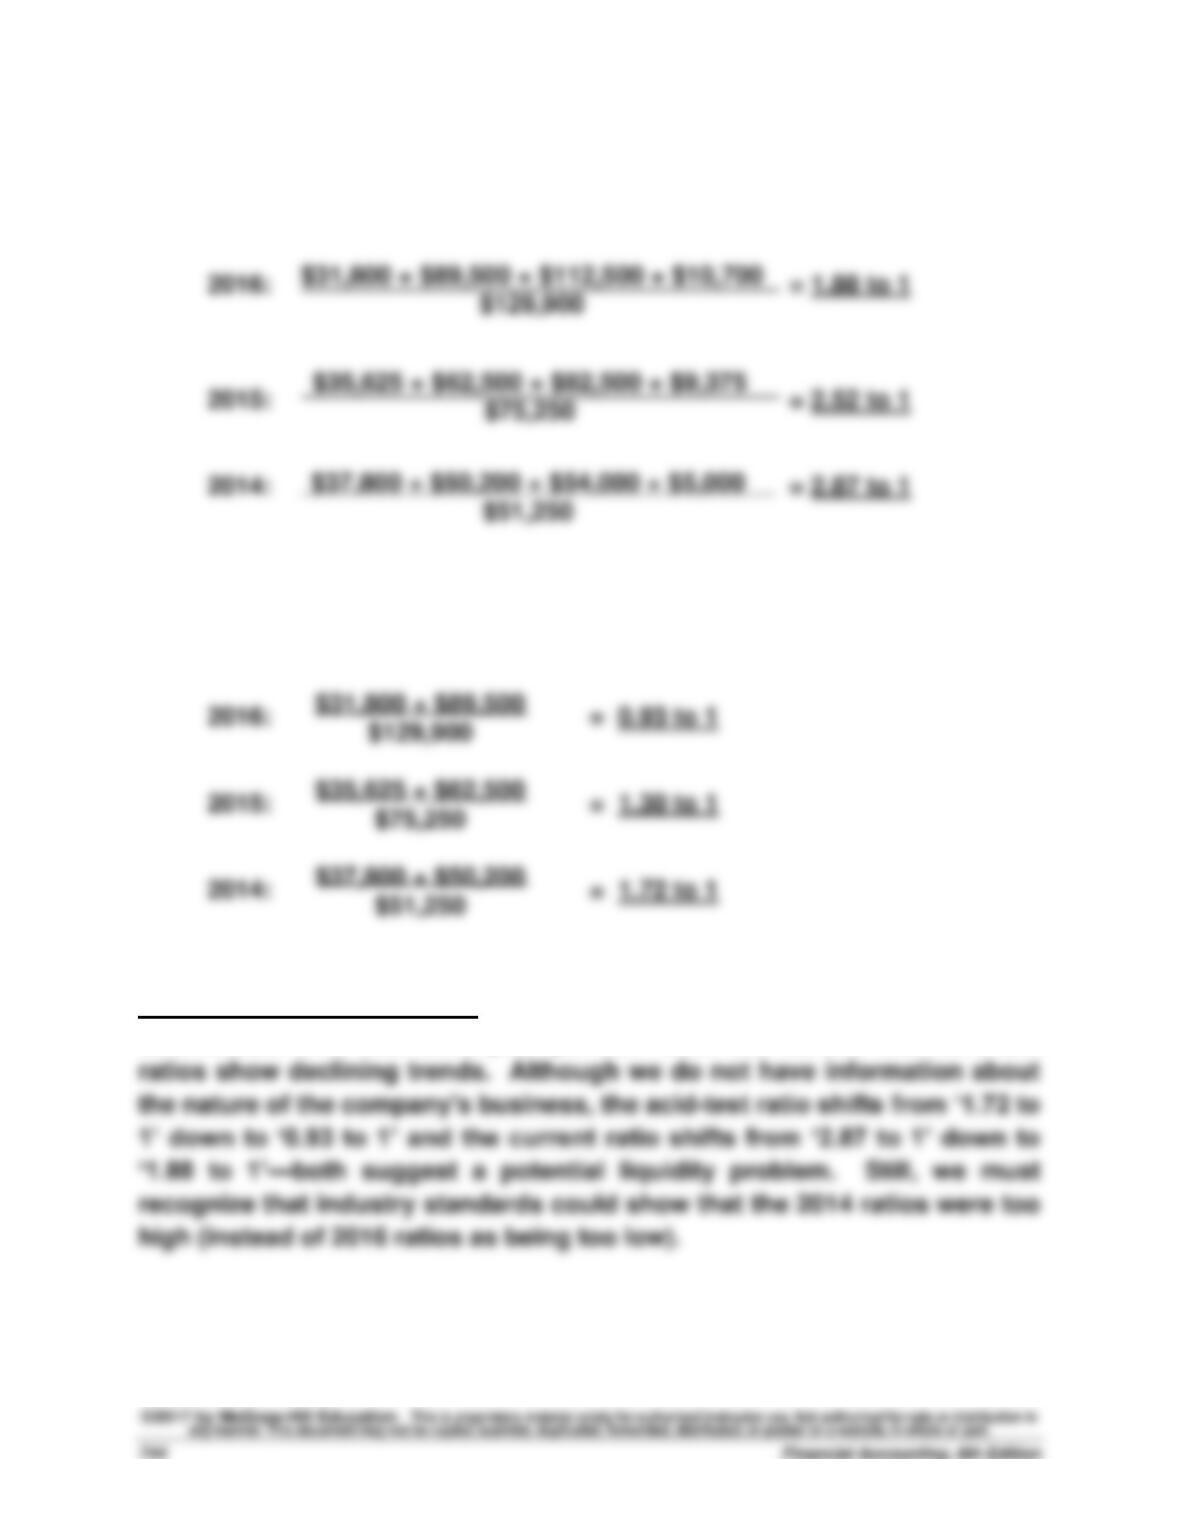
1. Current ratio
2. Acid-test ratio
Analysis and Interpretation: Simon’s short-term liquidity position has
deteriorated over this three-year period. Both the current and acid-test
Exercise 13-8 (25 minutes)
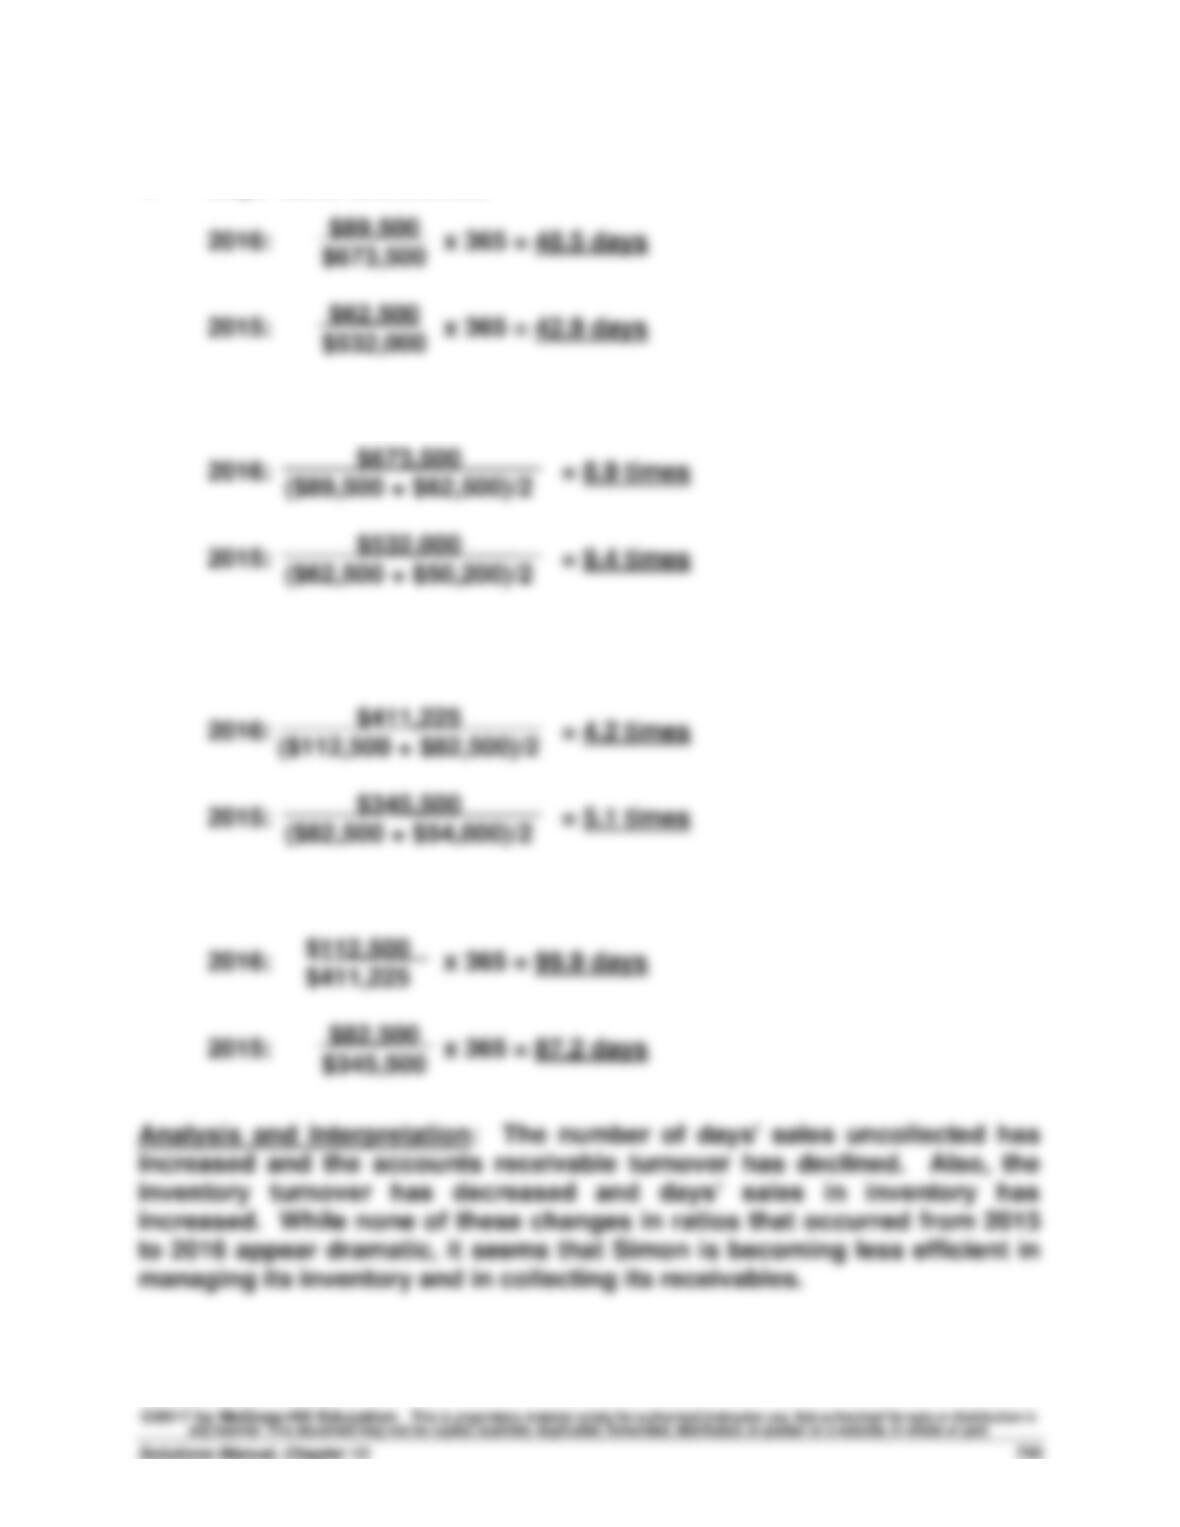
1. Days’ sales uncollected
2. Accounts receivable turnover
3. Inventory turnover
4. Days’ sales in inventory
Exercise 13-9 (25 minutes)
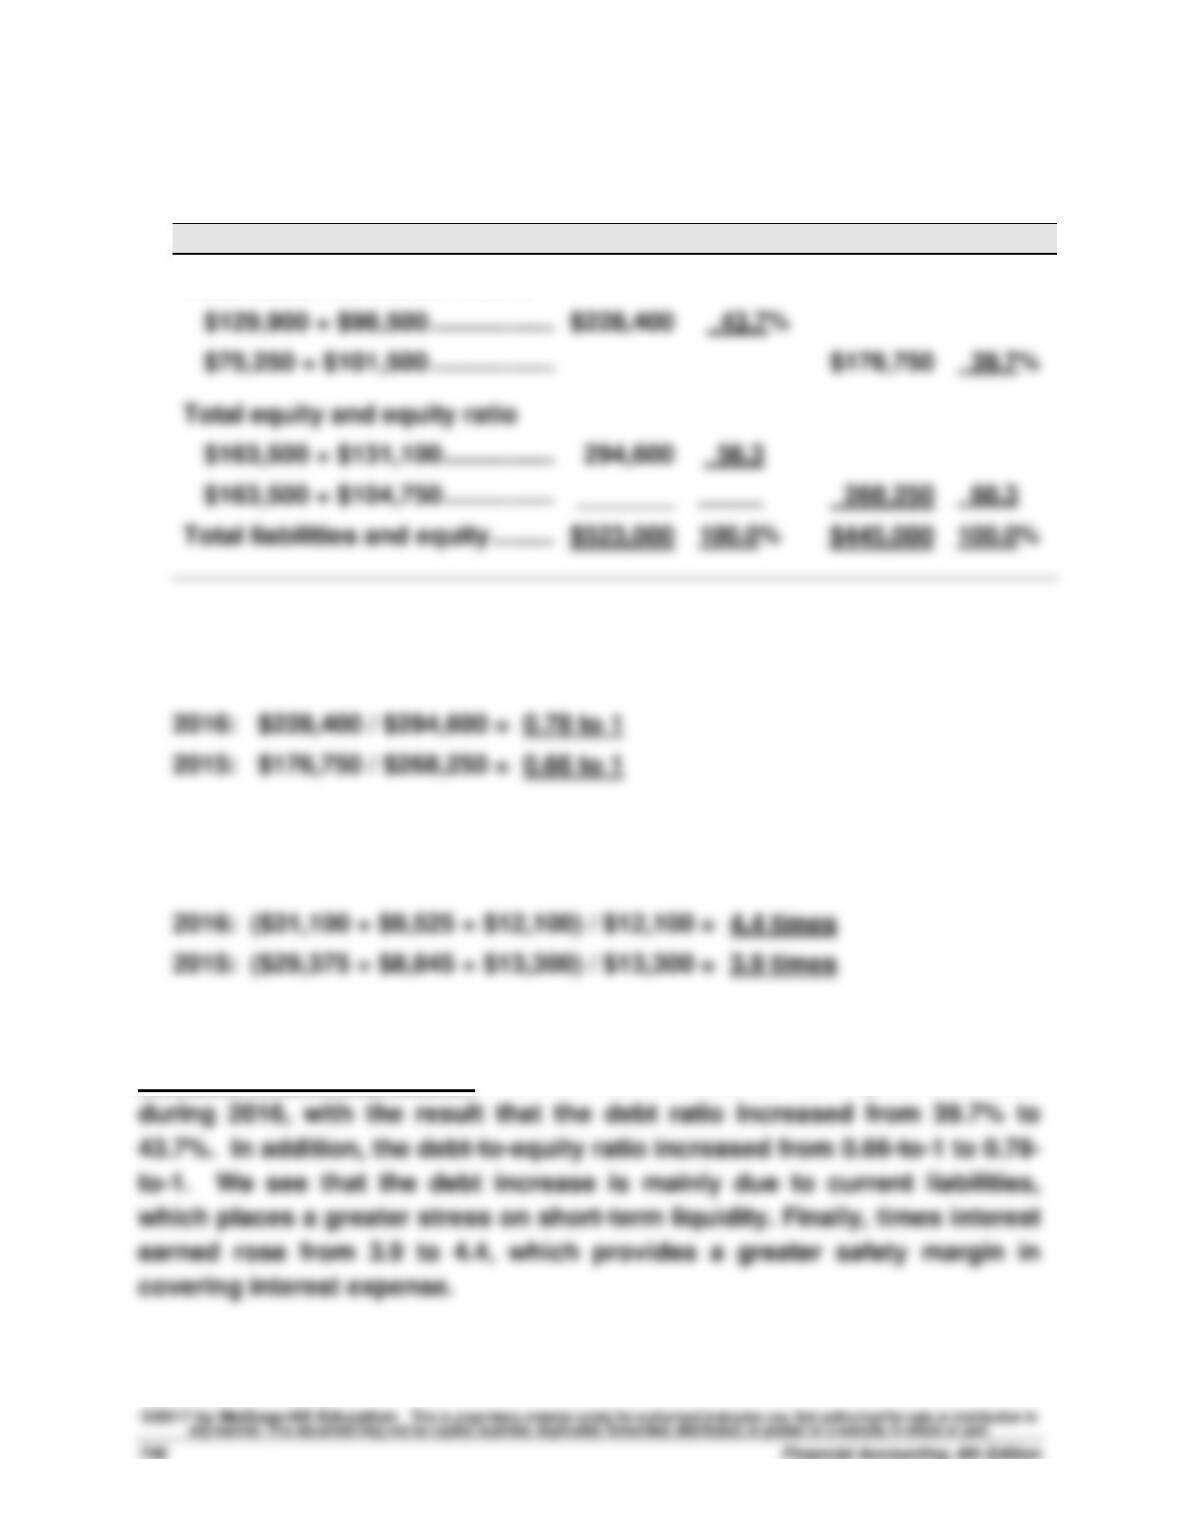
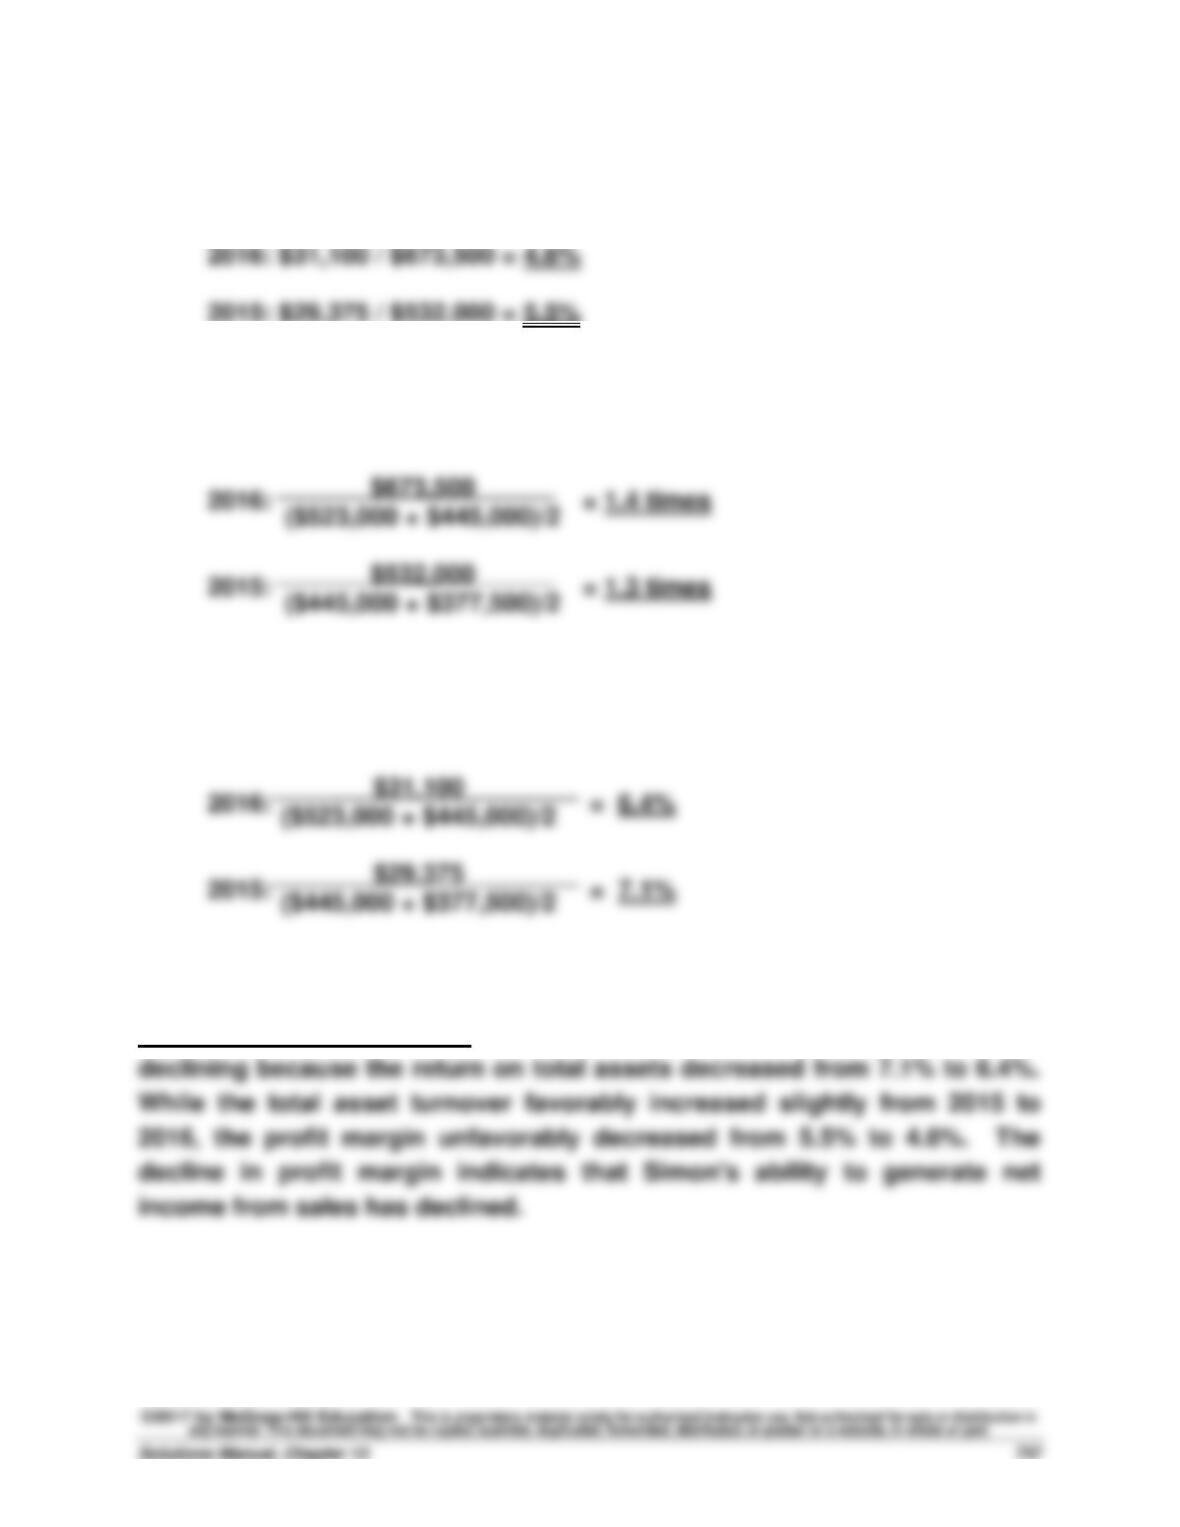
1. Debt and equity ratios
2016
2015
Total liabilities and debt ratio
Total equity and equity ratio
2. Debt–to-equity ratio
3. Times interest earned
Analysis and Interpretation: Simon added debt to its capital structure
Exercise 13-10 (30 minutes)
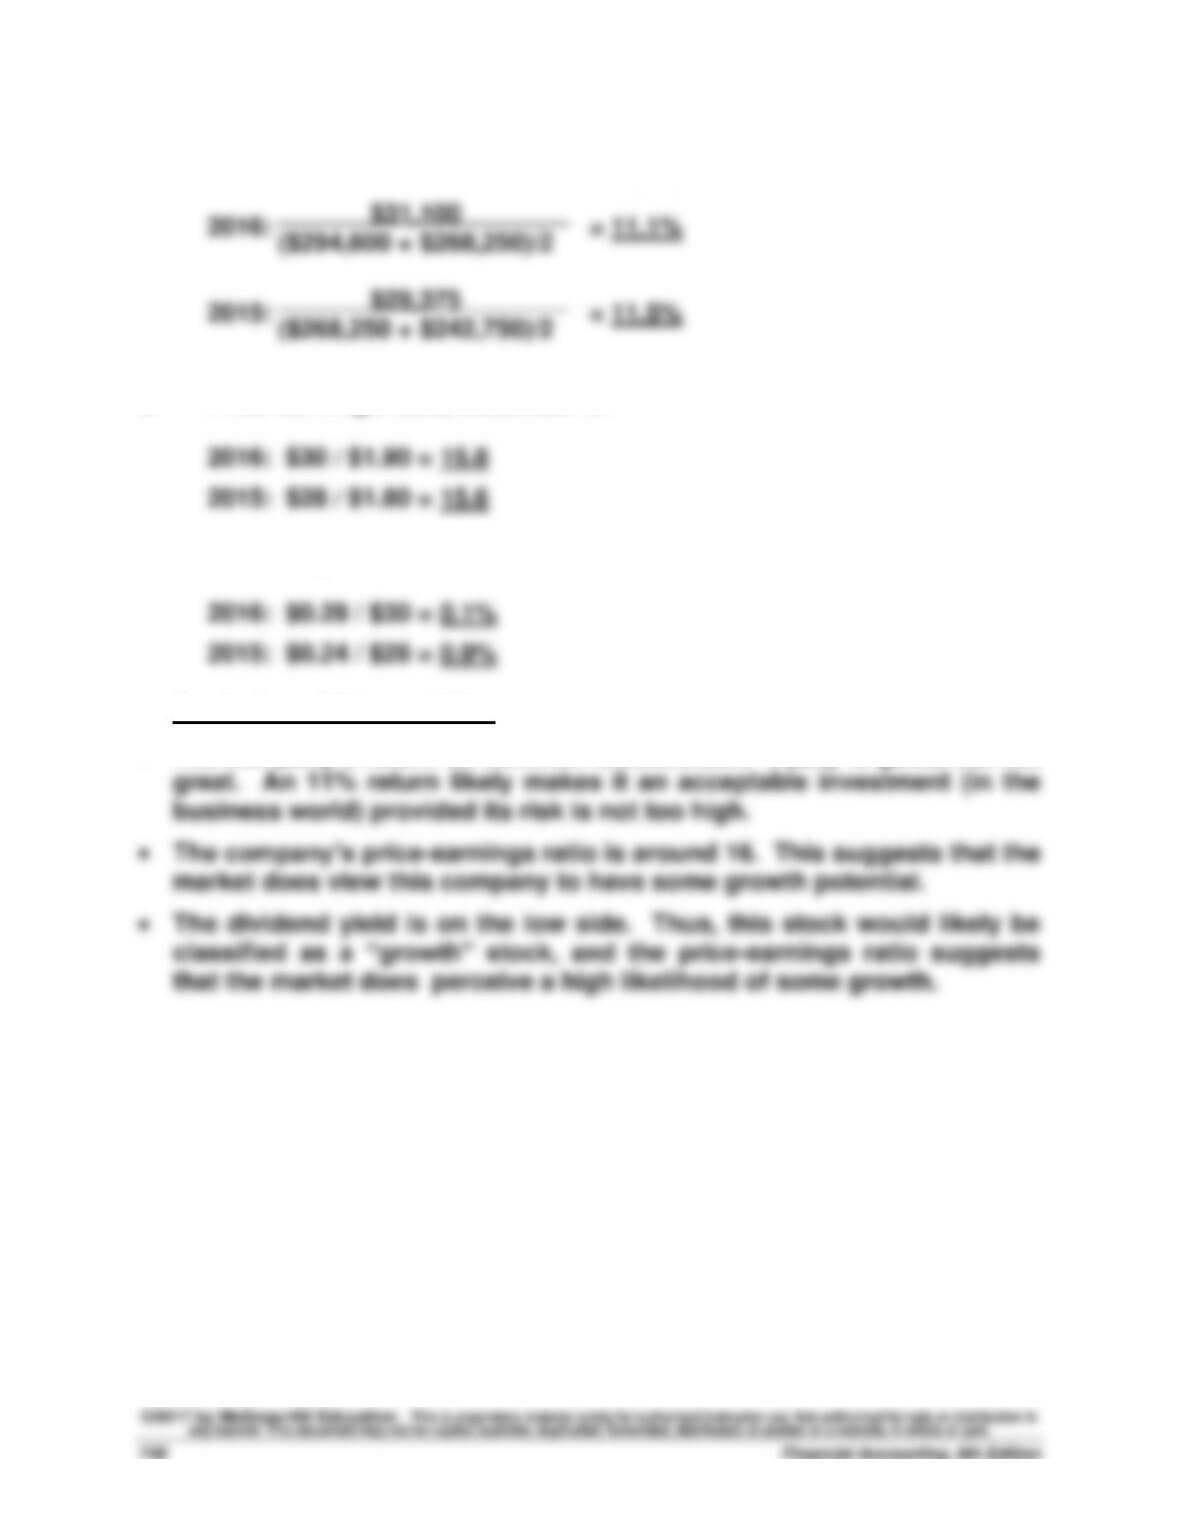
1. Profit margin
2. Total asset turnover
3. Return on total assets
Analysis and Interpretation: Simon’s operating efficiency appears to be
Exercise 13-11 (20 minutes)
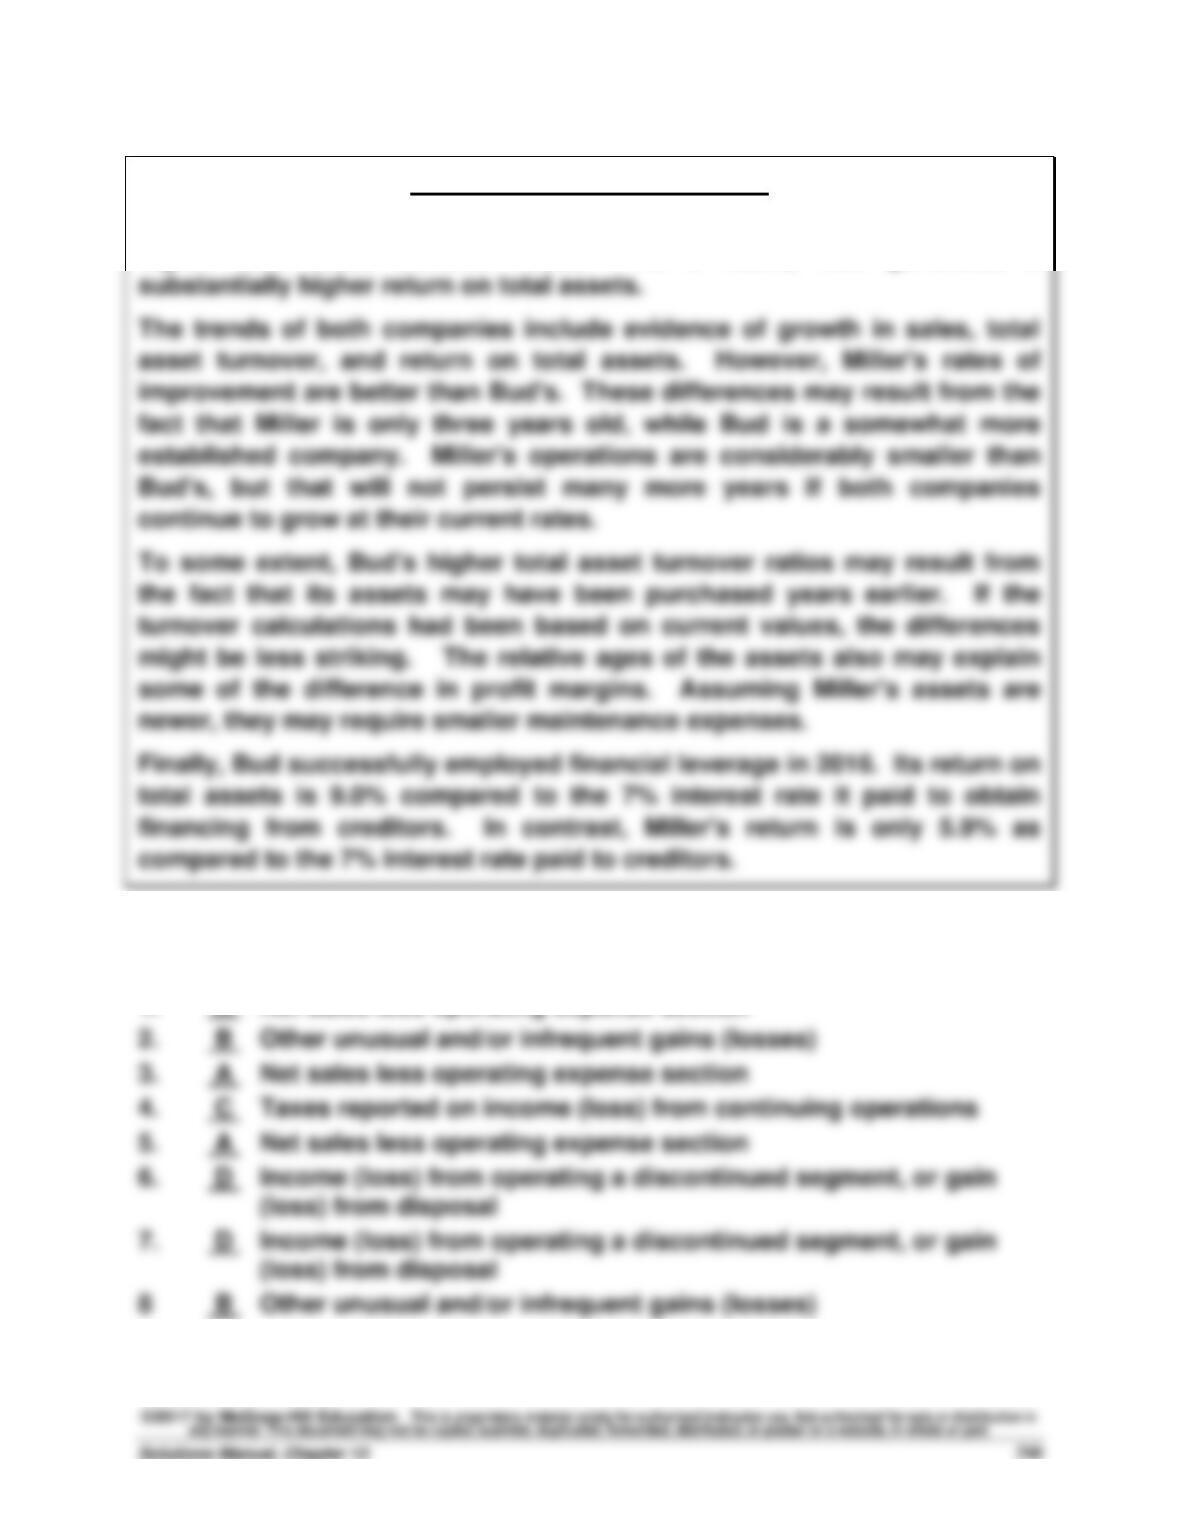
1. Return on common stockholders’ equity
2. Price-earnings ratio, December 31
3. Dividend yield
Analysis and interpretation
• The company’s return on common stockholders’ equity is good, but not
Exercise 13–12 (30 minutes)
COMPARATIVE ANALYSIS REPORT
Miller’s profit margins are higher than Bud‘s. However, Bud has markedly
higher total asset turnover ratios. As a result, Bud generates a
Exercise 13–13A (10 minutes)
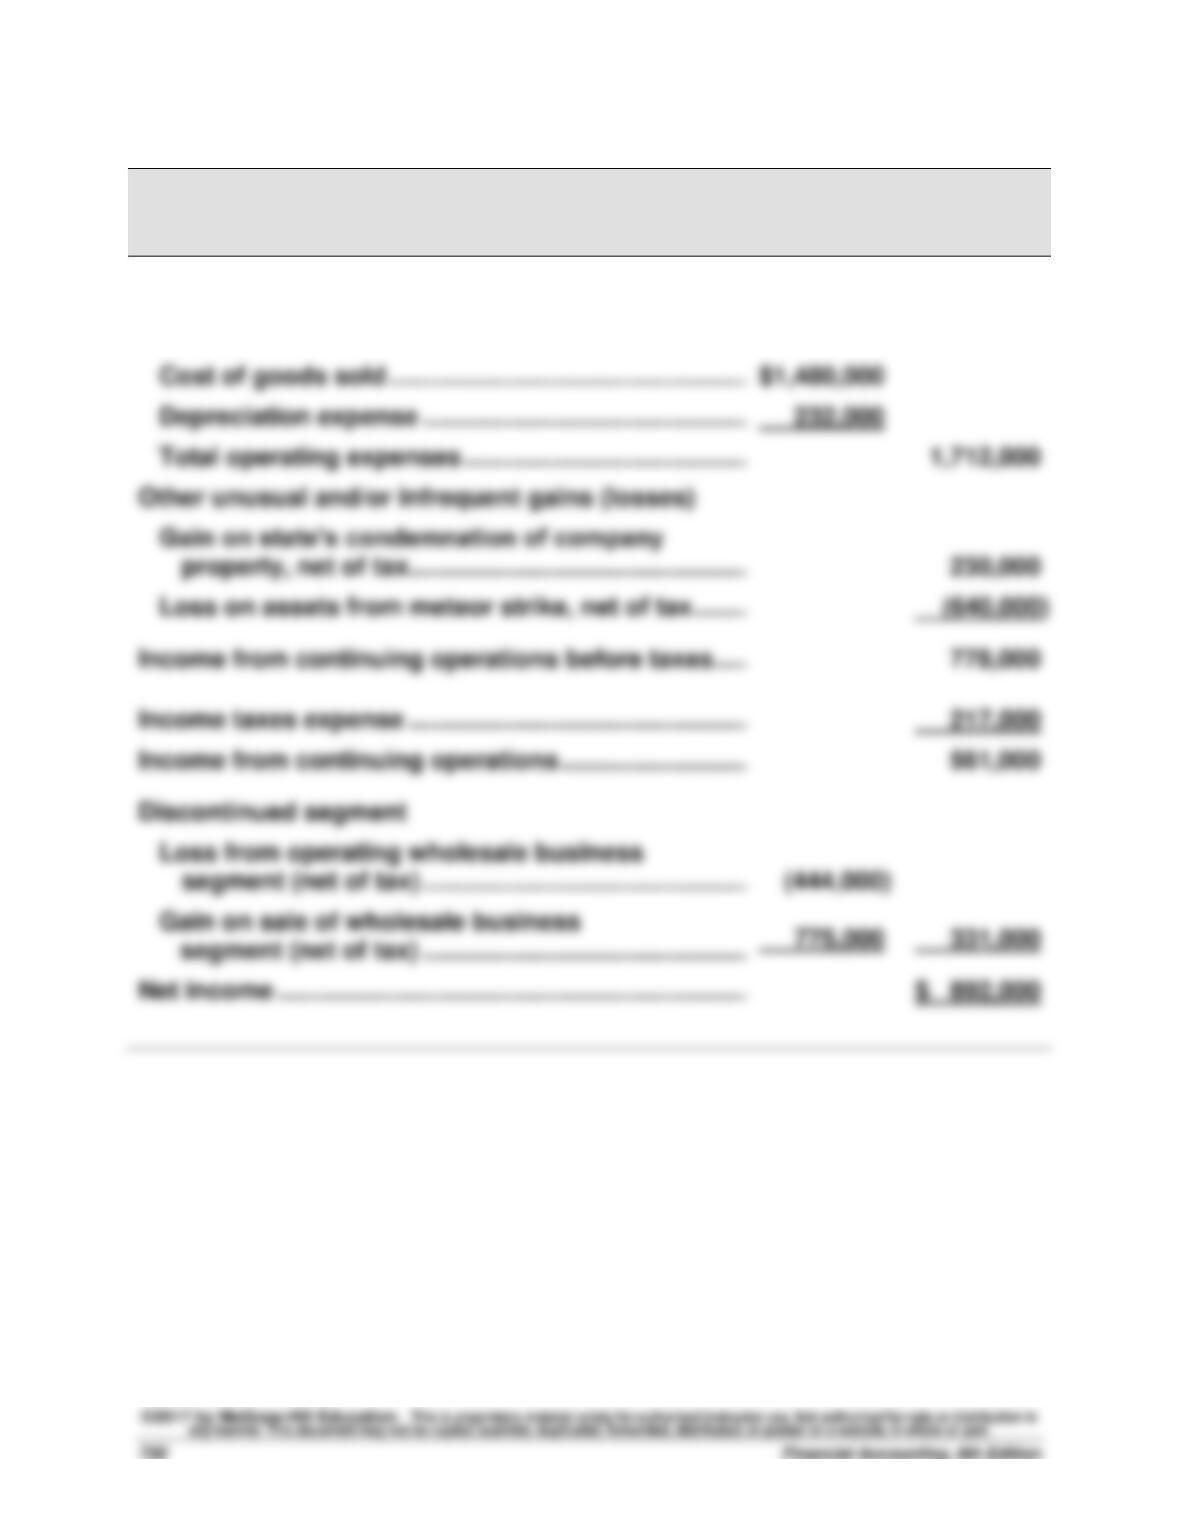
1. A Net sales less operating expense section
Exercise 13-14 (15 minutes)
RANDA MERCHANDISING, INC.
Income Statement
For Year Ended December 31, 2016
Net sales ………………………………………………………………..
$2,900,000
Expenses
$1,480,000
Exercise 13-15 (15 minutes)
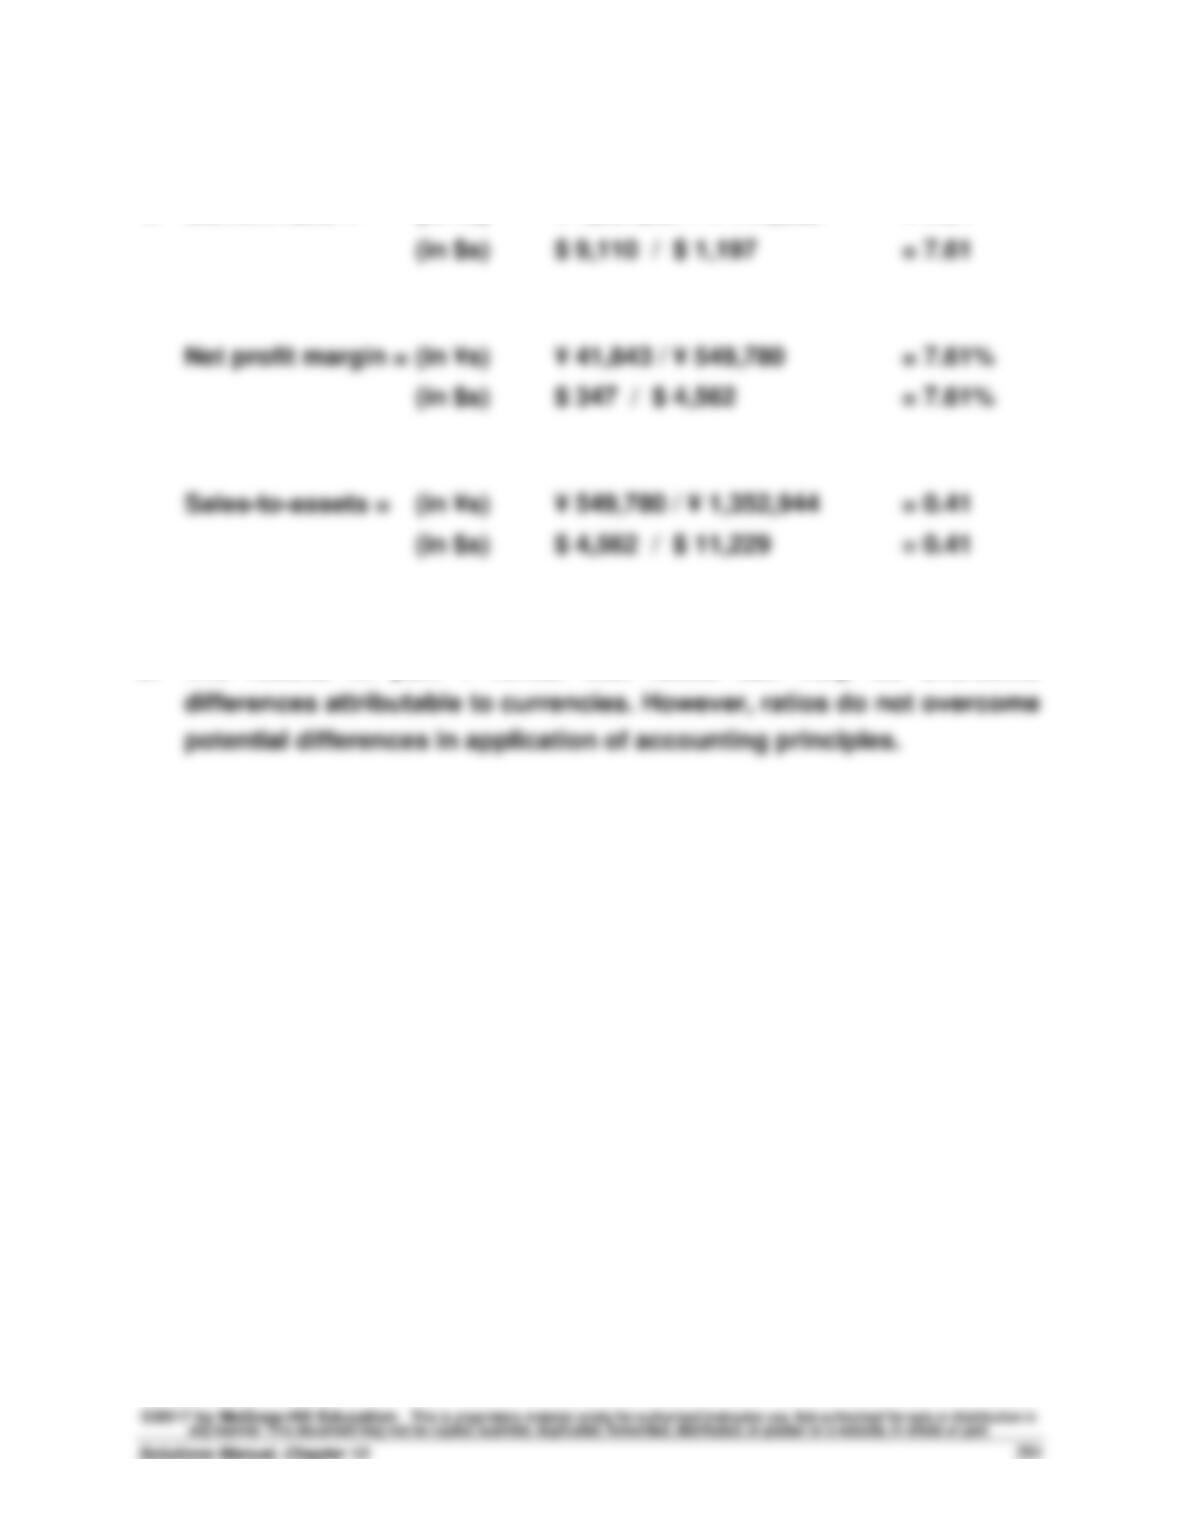
1. Current ratio = (in ¥s) ¥ 1,097,597 / ¥ 144,232 = 7.61
2. The results in part 1 reveal that ratios can help us overcome
PROBLEM SET A
Problem 13-1A (120 minutes)
Part 1
HAROUN COMPANY
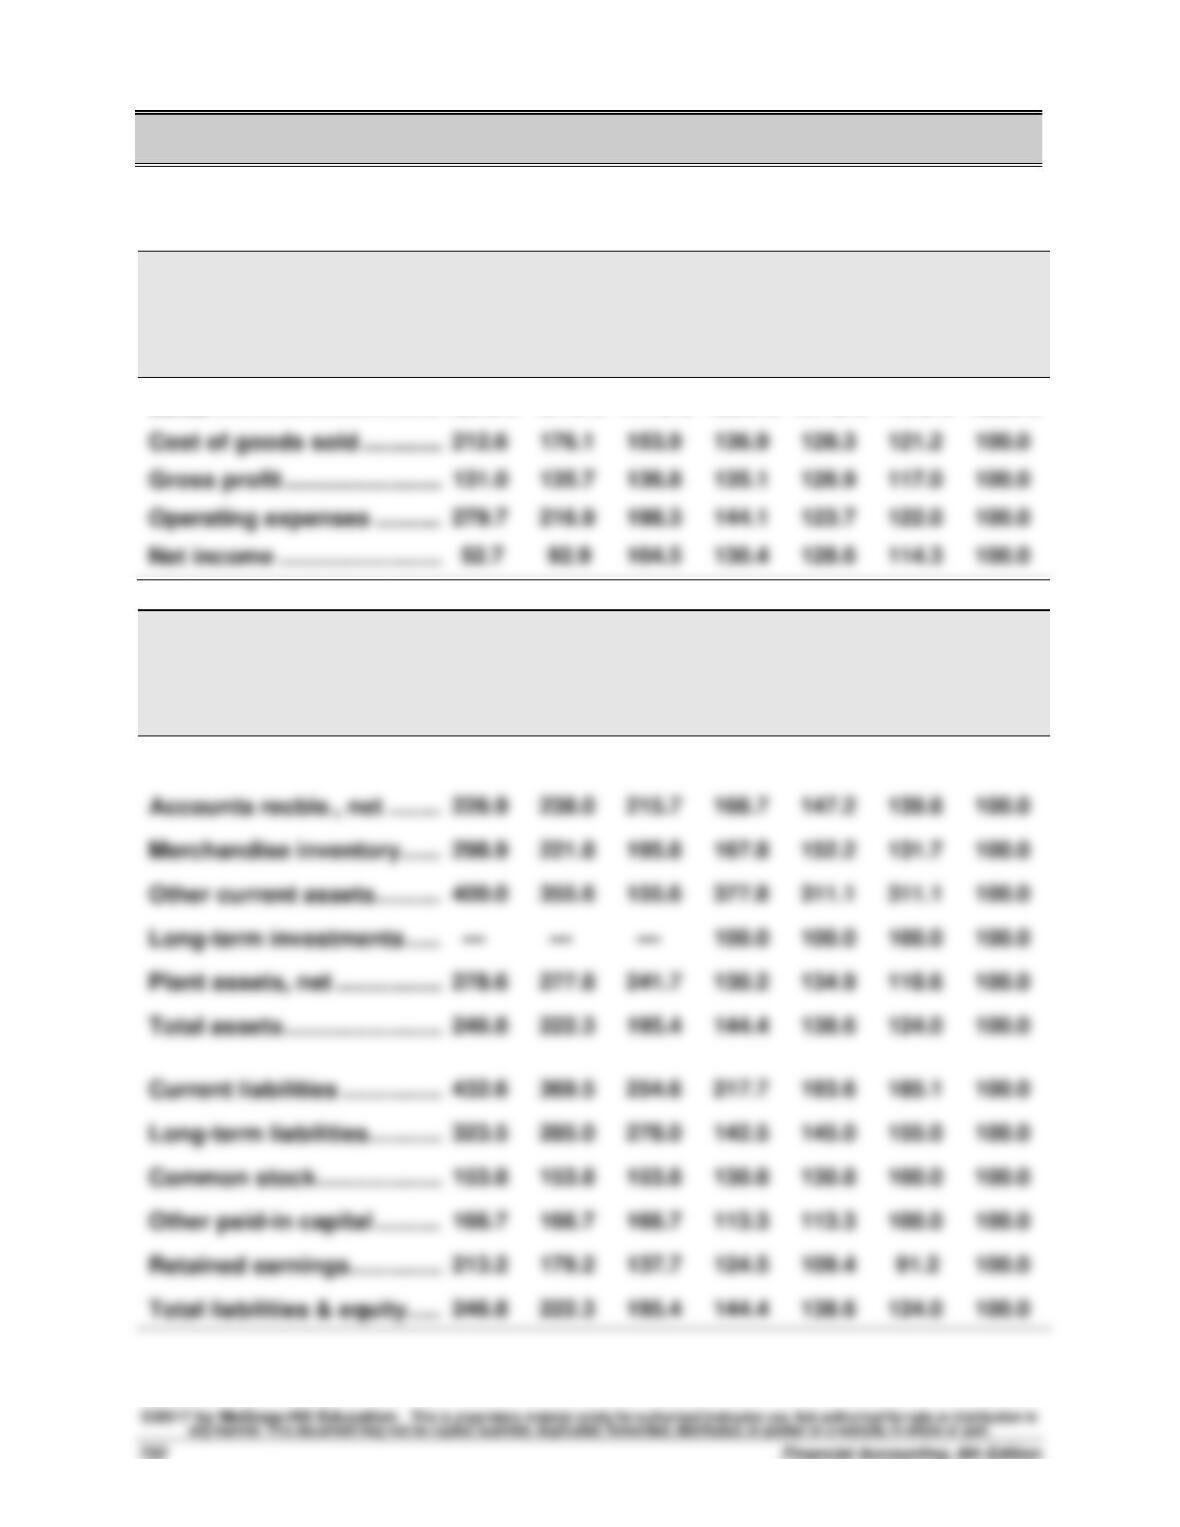
Income Statement Trends
For Years Ended December 31, 2016-2010
2016
2015
2014
2013
2012
2011
2010
Sales ……………………………….
182.5%
161.2%
147.6%
136.2%
127.8%
119.6%
100.0%
Cost of goods sold …………..
Gross profit ……………………..
Operating expenses …………
HAROUN COMPANY
Balance Sheet Trends
December 31, 2016-2010
2016
2015
2014
2013
2012
2011
2010
Cash ………………………………..
65.2%
87.6%
92.1%
94.4%
98.9%
96.6%
100.0%
Accounts recble., net ……….
Merchandise inventory ……..
Other current assets …………
Plant assets, net ………………
Total assets ……………………..
Current liabilities ……………..
Common stock …………………
Other paid-in capital …………
Retained earnings…………….
Total liabilities & equity …….
Problem 13-1A (concluded)
Part 2
Analysis and Interpretation
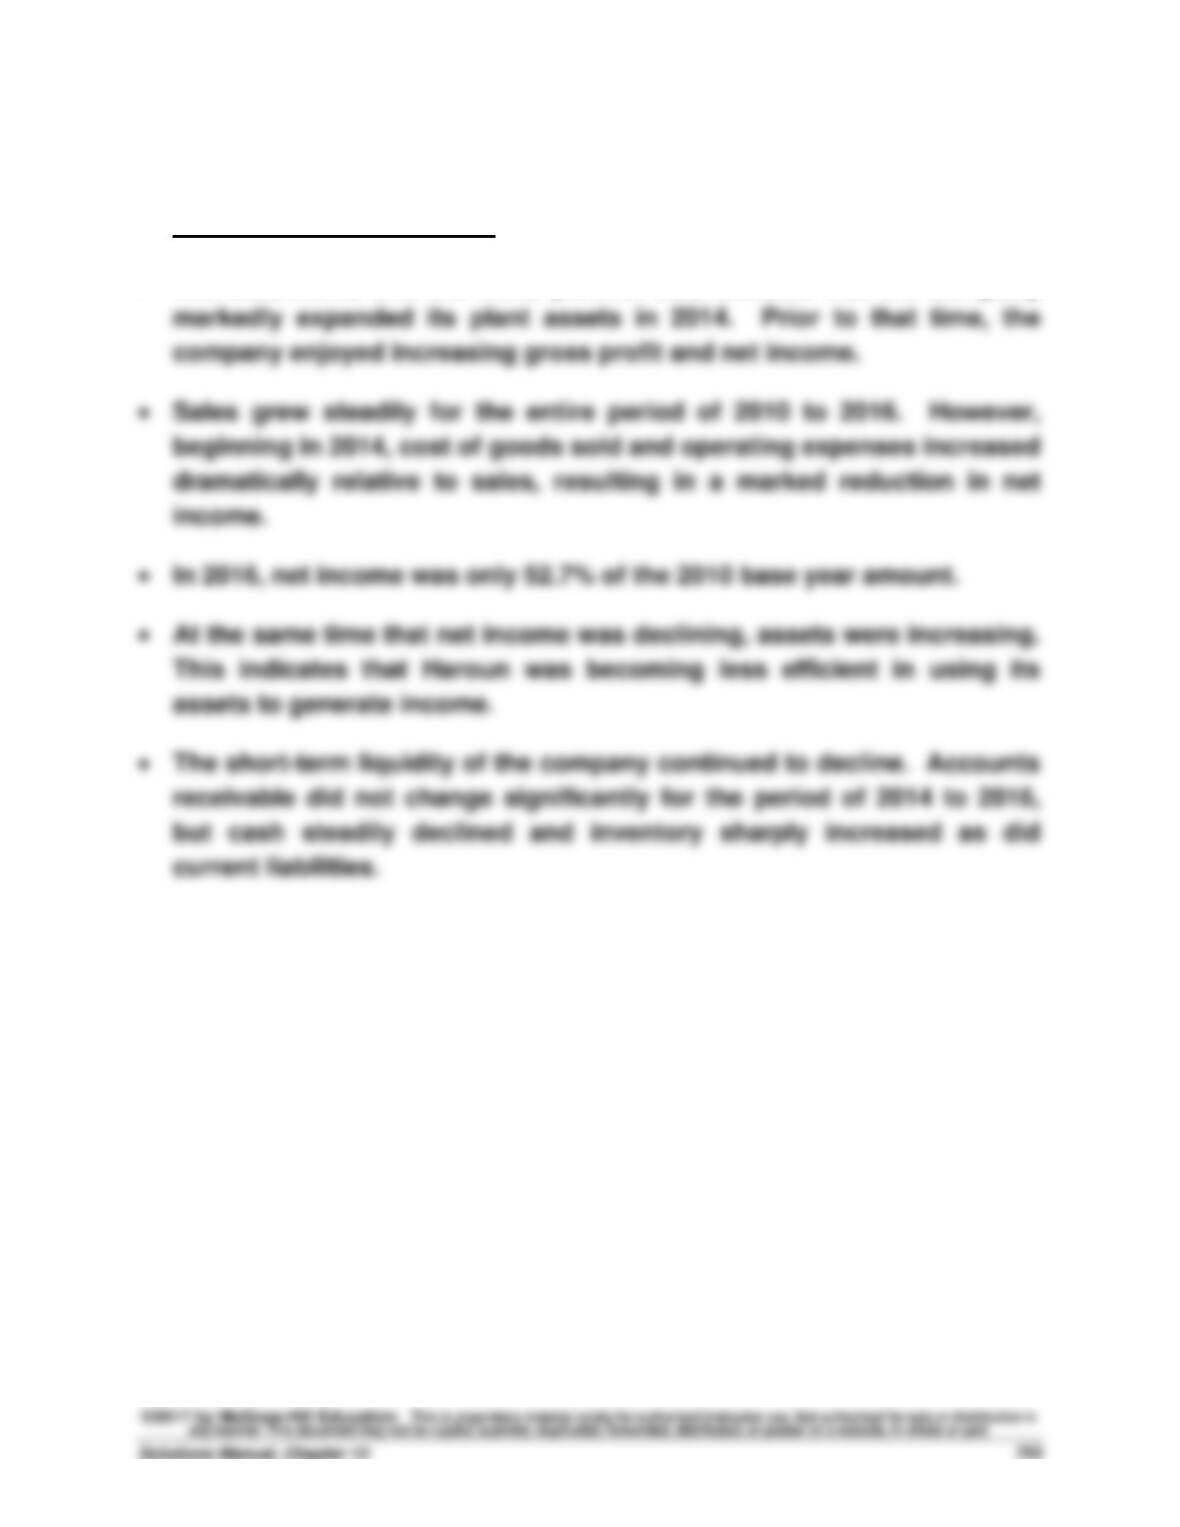
• The statements and the trend percent data indicate that the company
Problem 13-2A (60 minutes)
Part 1
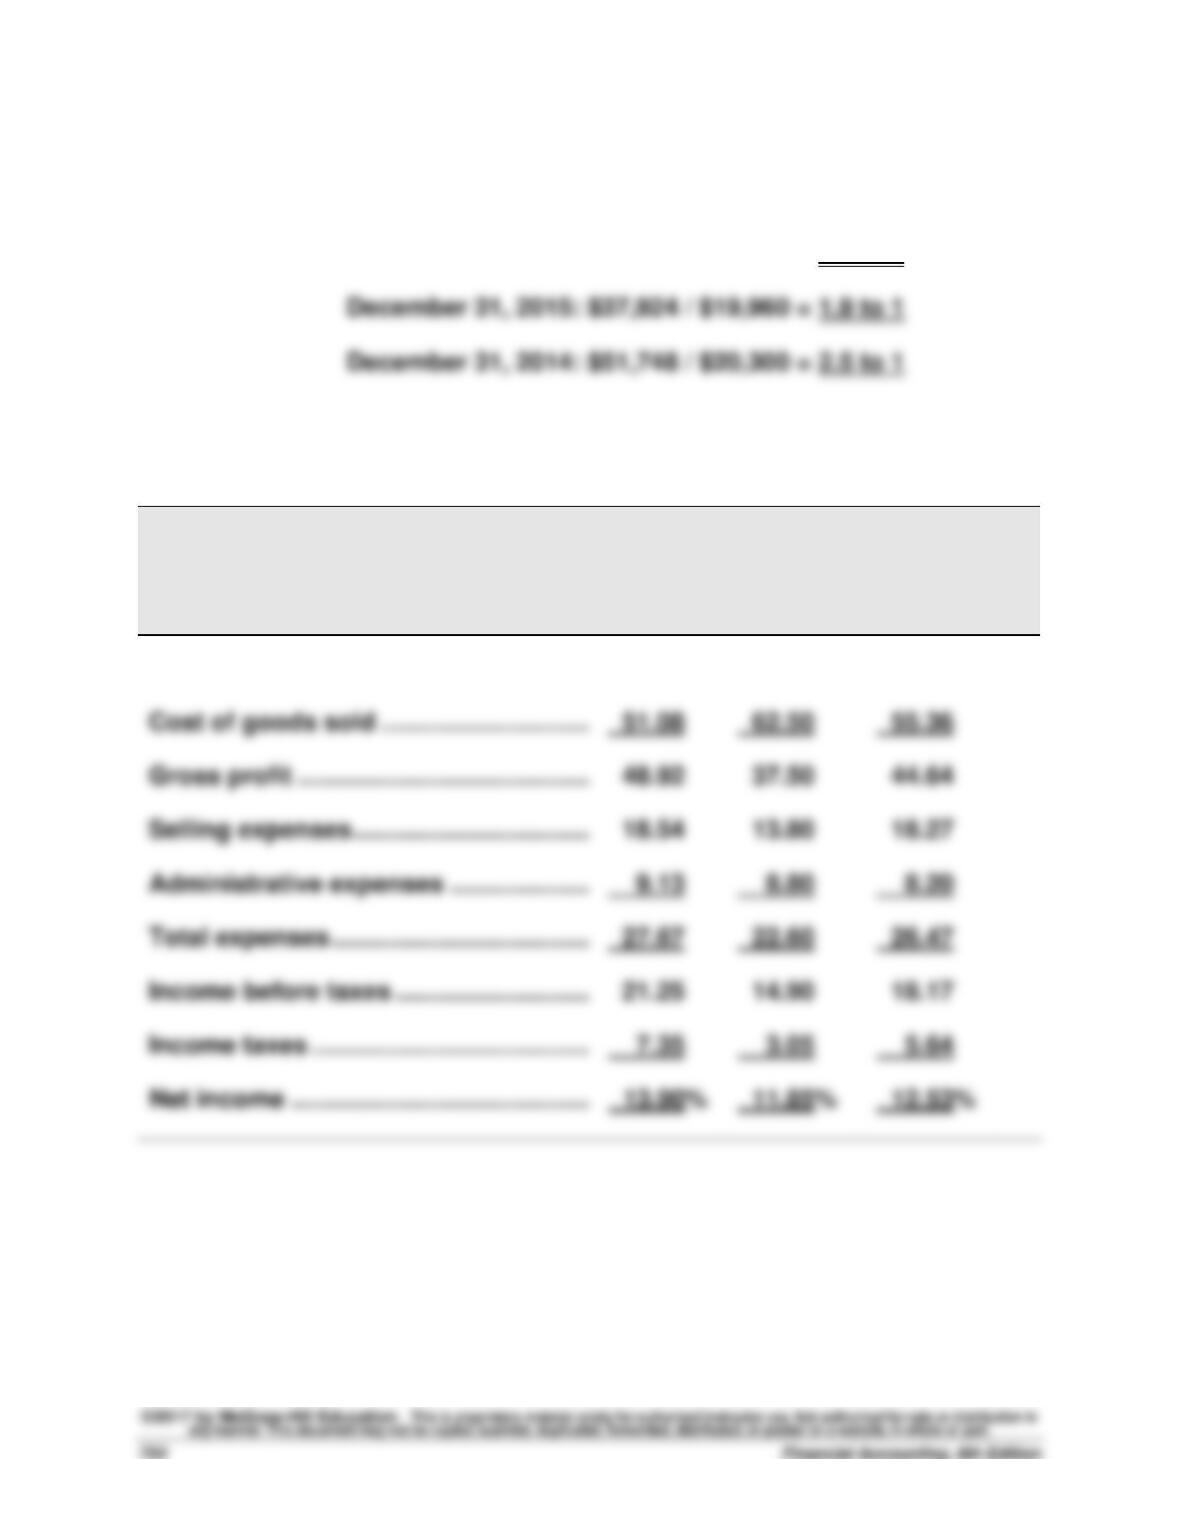
Current ratio: December 31, 2016: $52,390 / $22,800 = 2.3 to 1
Part 2
KORBIN COMPANY
Common-Size Comparative Income Statements
For Years Ended December 31, 2016, 2015, and 2014
2016
2015
2014
Sales ……………………………………………………
100.00%
100.00%
100.00%