Chapter 07 – Reporting and Interpreting Cost of Goods Sold and Inventory
7-21
E7–17.
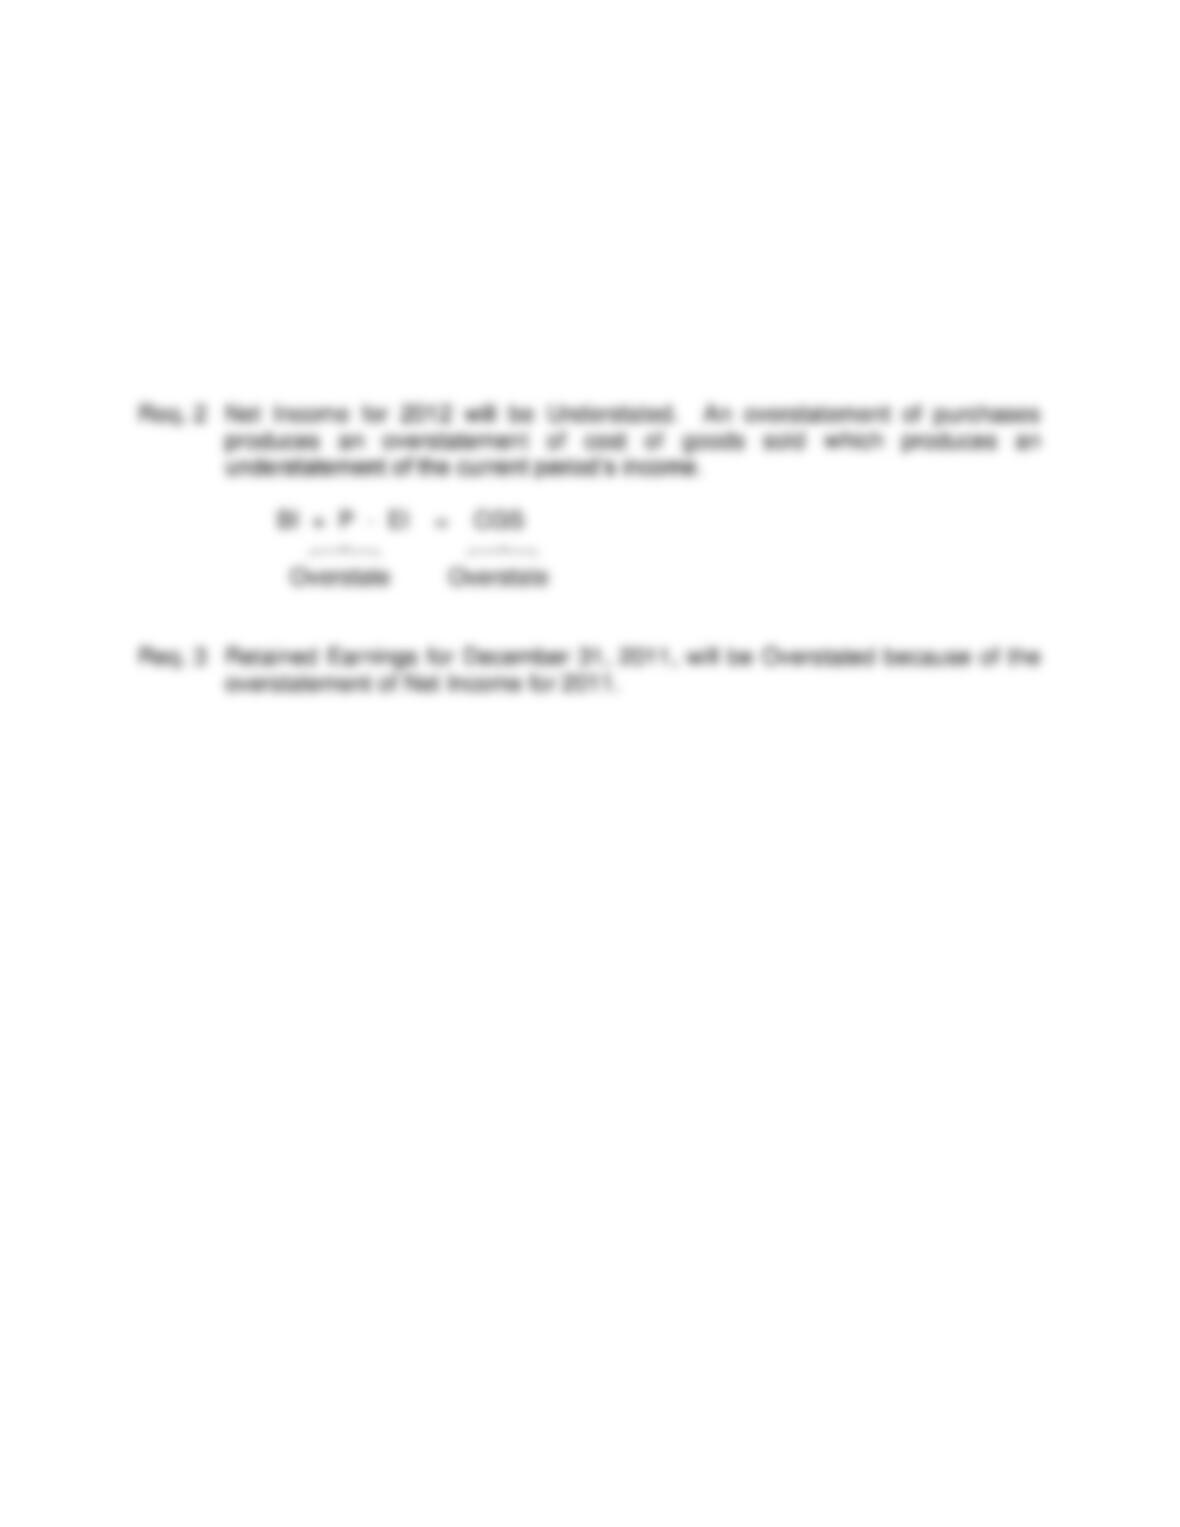
Req. 1 Net Income for 2011 will be Overstated. An understatement of purchases
produces an understatement of cost of goods sold which produces an
overstatement of the current period’s income.
BI + P – EI = CGS
Understate Understate
Req. 4 Retained Earnings for December 31, 2012, will be Correct because the
overstatement of Net Income for 2011 and understatement of Net Income for
2012 will offset one another.
Chapter 07 – Reporting and Interpreting Cost of Goods Sold and Inventory
E7–18.
Req. 1
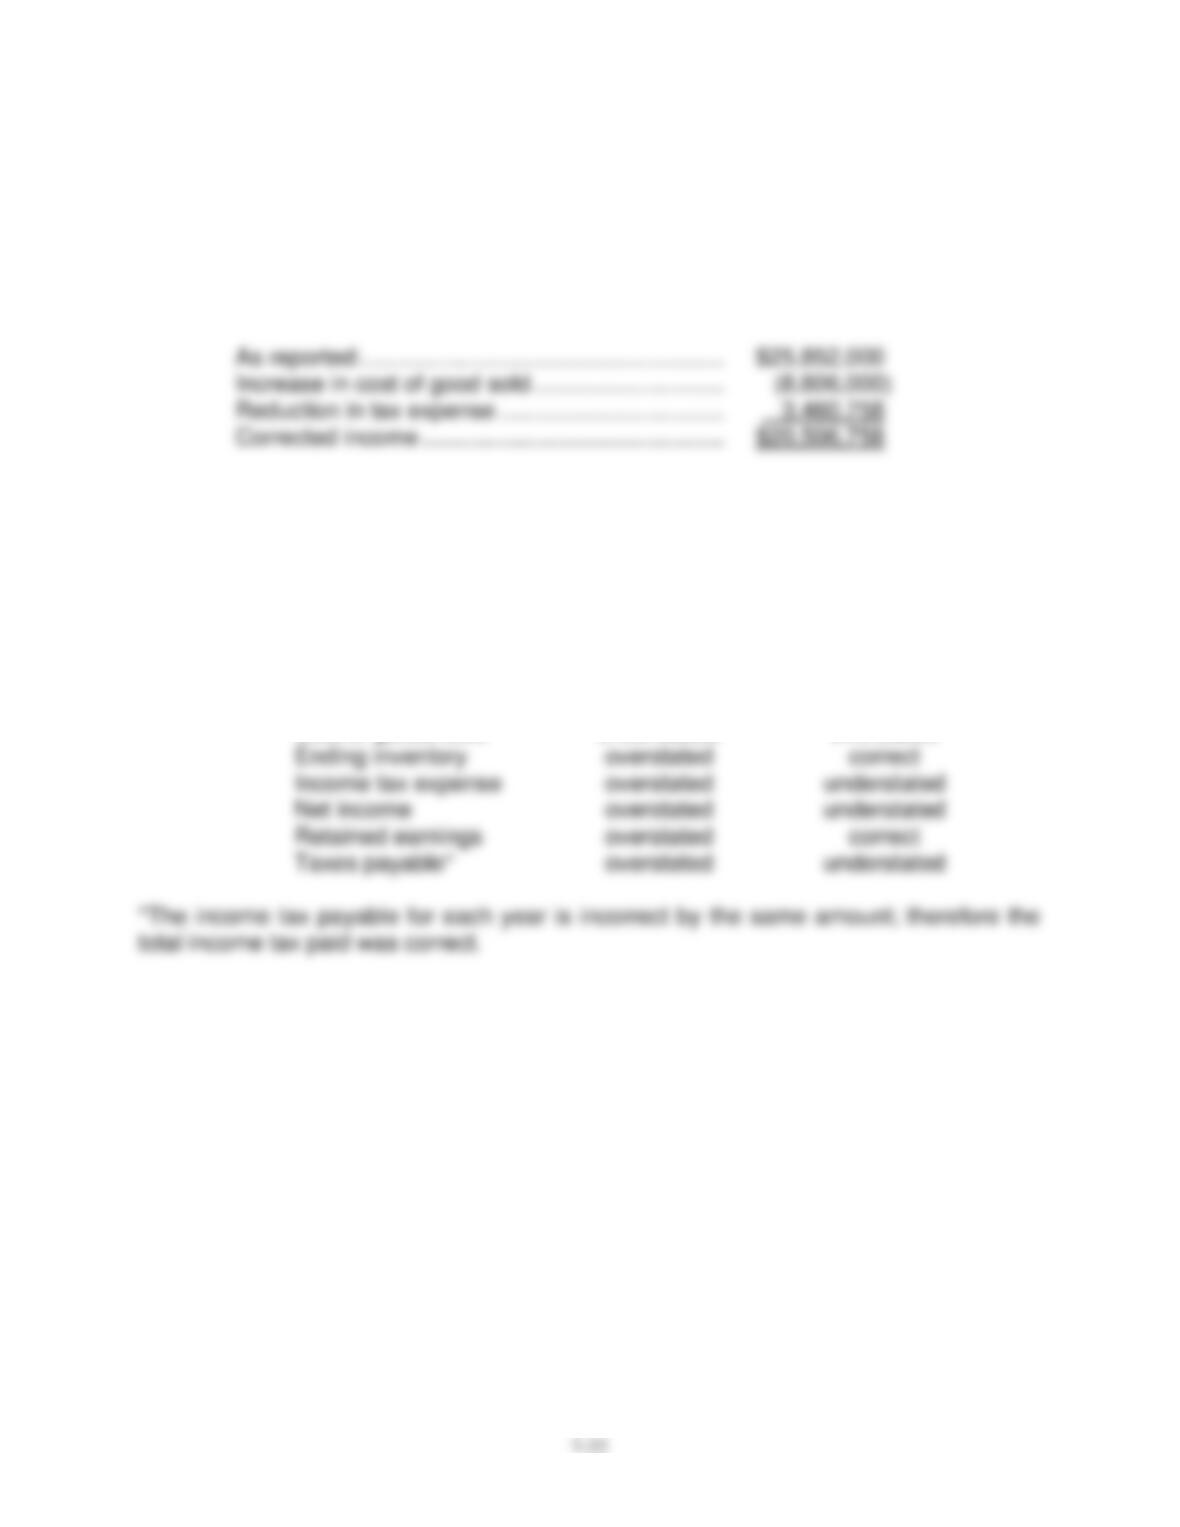
When the ending inventory is overstated, cost of goods sold is understated which in turn
results in an overstatement of net income. Gibson’s income from operations should be
reduced by $8,806,000 and tax expense should be reduced by $3,460,758 (i.e.,
$8,806,000 x 0.393). Therefore, net income should be:
Req. 2
The incorrect accounts can be summarized as follows:
(a) Year of (b) Subsequent
Account Error Year
Beginning inventory correct overstated
Cost of goods sold understated overstated
Chapter 07 – Reporting and Interpreting Cost of Goods Sold and Inventory
7-23
E7–19.
Req. 1
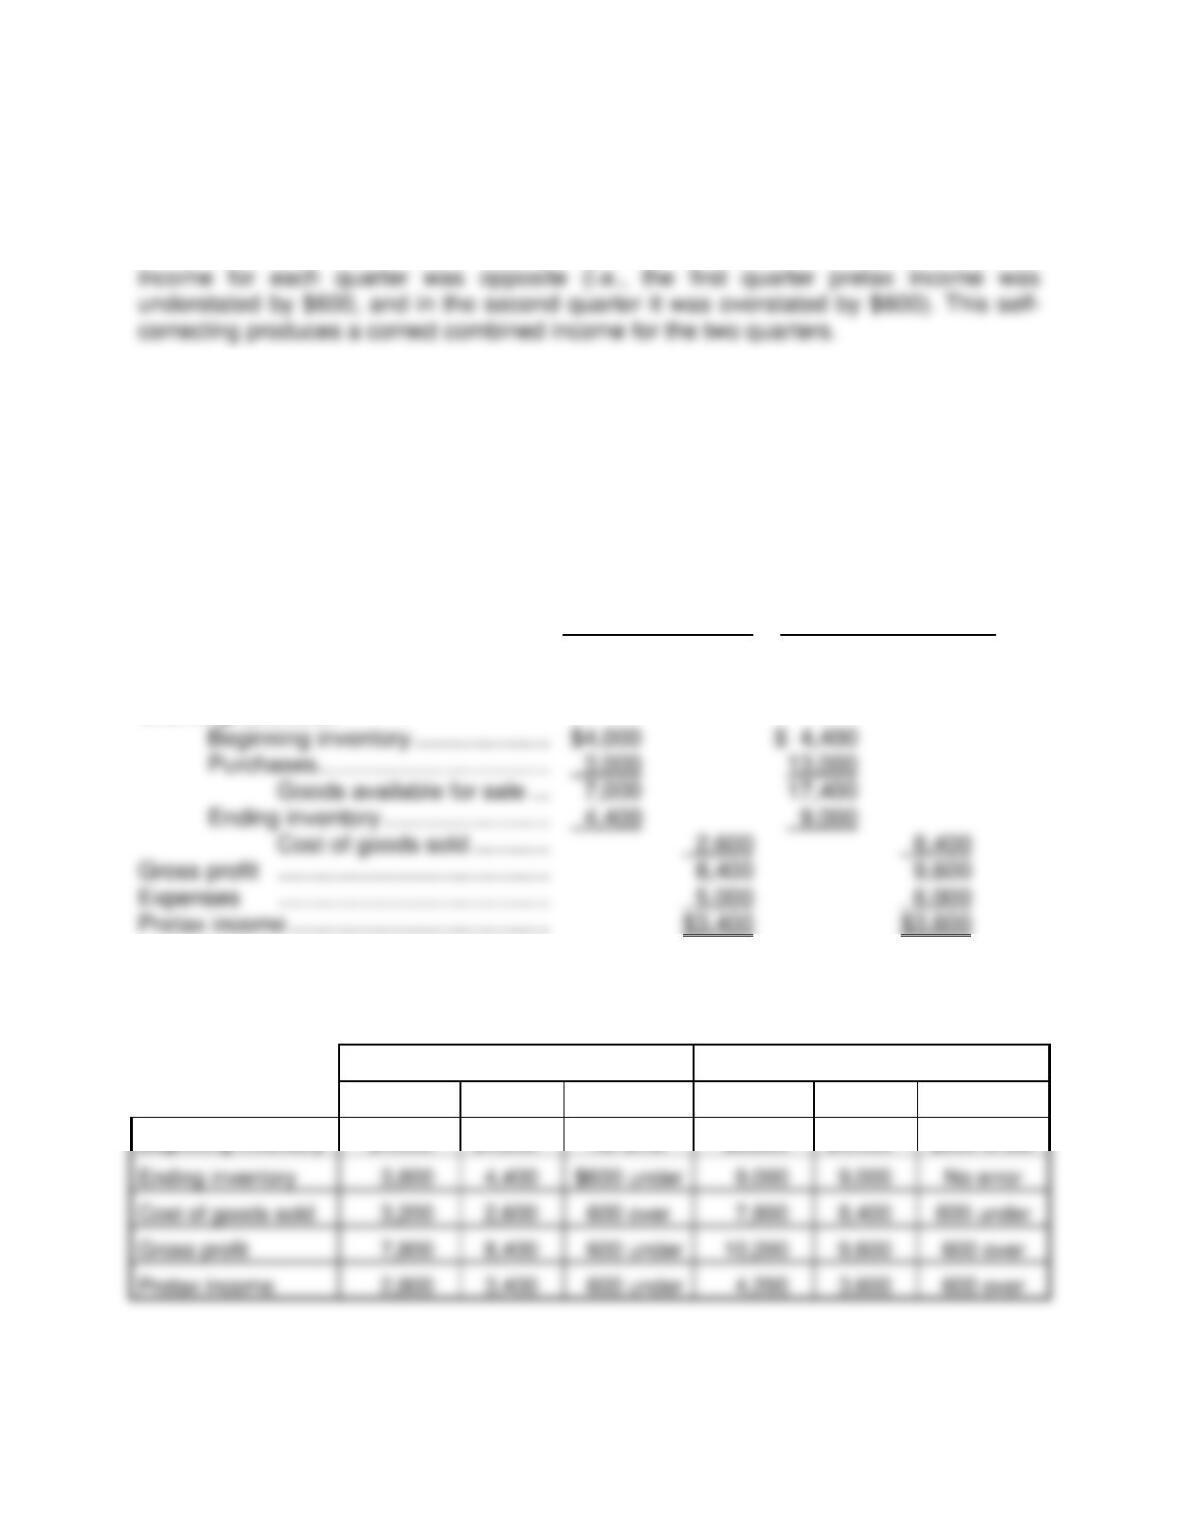
The $600 understatement of ending inventory produced pretax income amounts that
were incorrect by the amount of $600 for each quarter. However, the effect on pretax
Req. 2
The error caused the pretax income for each quarter to be incorrect [see (1) above];
therefore, it produced incorrect EPS amounts for each quarter.
Req. 3
First Quarter Second Quarter
Sales revenue …………………………………. $11,000 $18,000
Cost of goods sold:
Req. 4
1st Quarter
2nd Quarter
Incorrect
Correct
Error
Incorrect
Correct
Error
Beginning inventory
$4,000
$4,000
No error
$3,800
$4,400
$600 under
Ending inventory
3,800
$600 under
No error
Cost of goods sold
Gross profit
10,200
Pretax income
Chapter 07 – Reporting and Interpreting Cost of Goods Sold and Inventory
E7–20. (Supplement A)
Req. 1
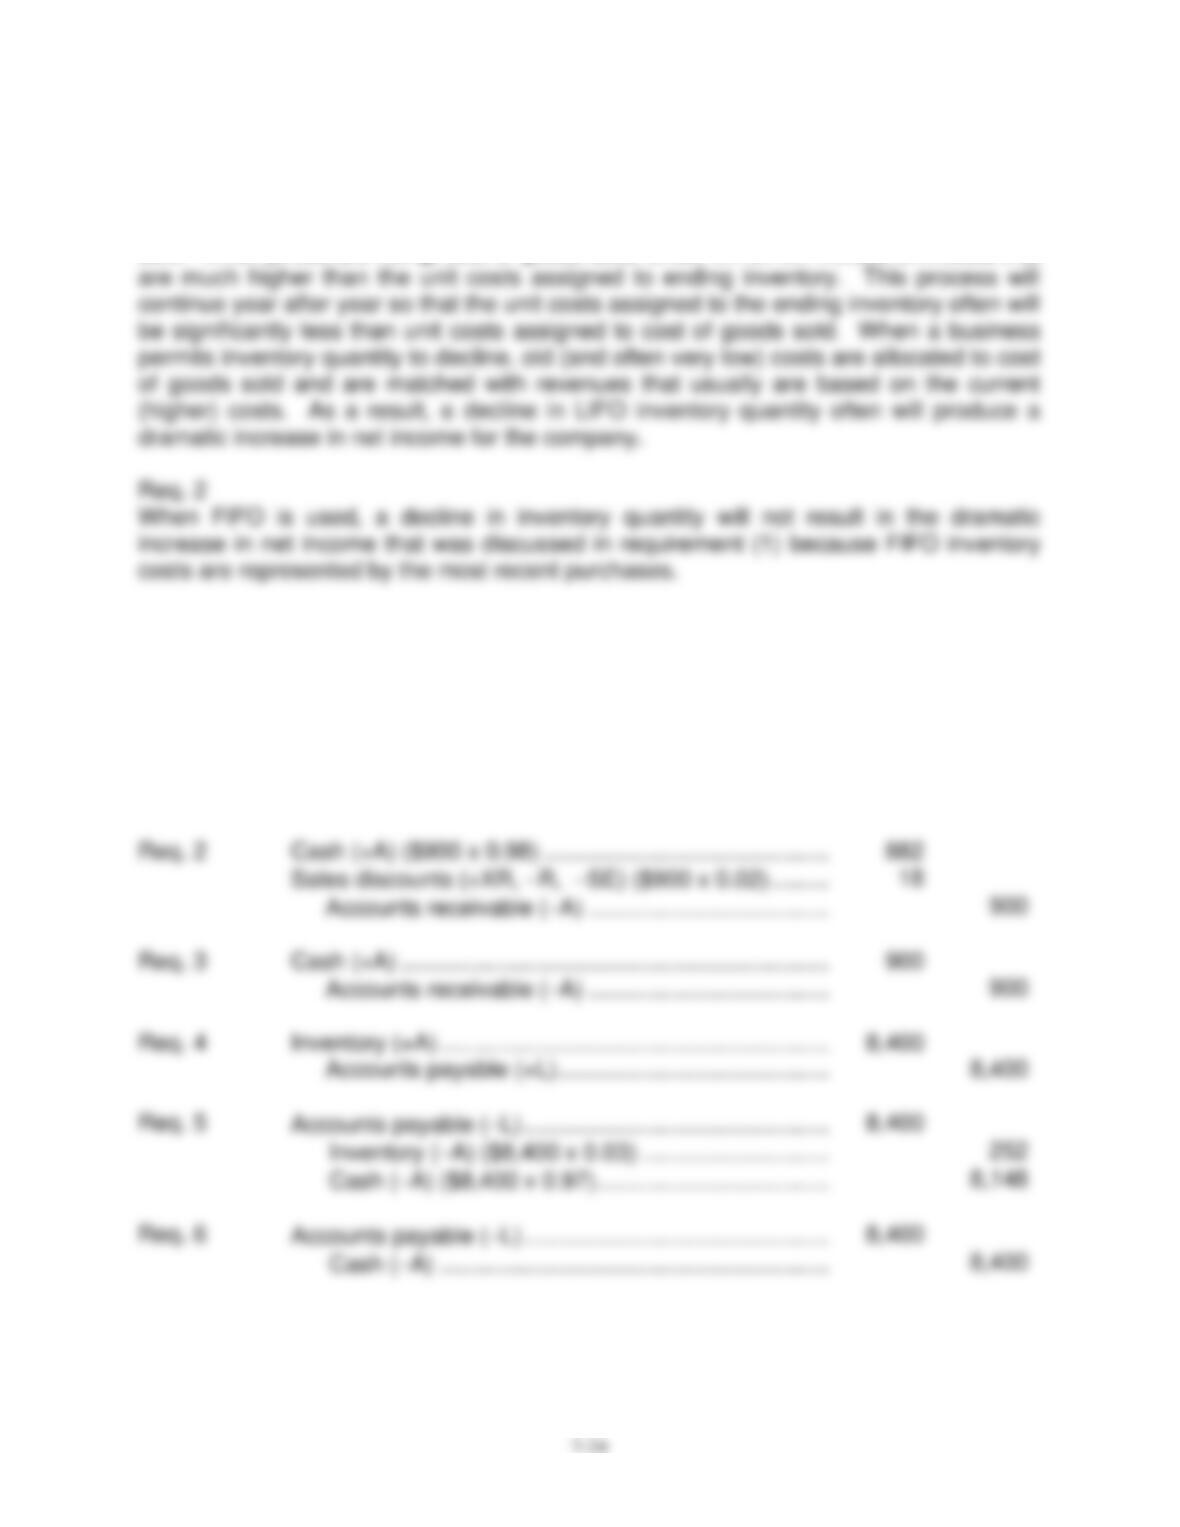
This actual footnote from ConocoPhillips illustrates the impact of “dipping into a LIFO
layer.” Under LIFO, the cost of recently purchased items is assigned to cost of goods
sold. When prices are rising, cost of goods sold, under LIFO, will include unit costs that
E7–21. (Supplement B)
Req. 1
Accounts receivable (+A) ……………………………………………
900
Sales (+R, +SE) ……………………………………………………
900
Cost of goods sold (+E, −SE) ………………………………………
600
Inventory (−A) ……………………………………………………….
600
Req. 2
Cash (+A) ($900 x 0.98) ……………………………………………..
Sales discounts (+XR, −R, −SE) ($900 x 0.02) ………………
Req. 3
Cash (+A) …………………………………………………………………
900
Req. 4
Inventory (+A) ……………………………………………………….
Accounts payable (+L)……………………………………………
Accounts payable (−L) …………………………..……………………
Req. 6
Accounts payable (−L) …………………………..……………………
Chapter 07 – Reporting and Interpreting Cost of Goods Sold and Inventory
7-25
E7–22. (Supplement C)
CASE A: Perpetual inventory system:
January 14
Accounts receivable (+A) …………………………………………….
950
Sales (+R, +SE) (20 units at $47.50) ………………………..
950
Cost of goods sold (+E, −SE) ………………………………………
400
Inventory (−A) (20 units at $20) …………………………..
400
CASE B: Periodic inventory system:
January 14
Accounts receivable (+A) …………………………………………….
950
Sales (+R, +SE) (20 units at $47.50) ………………………..
950
April 9
Purchases (+A) (15 units at $20) …………………………..
Accounts payable (+L)……………………………………………
September 2
Accounts receivable (+A) …………………………………………….
Sales (+R, +SE) (45 units at $50) …………………………..
End of year
Cost of goods sold (+E, −SE) (goods avail. for sale) ……….
Purchases (−A) …………………………………………………….
300
Inventory (−A) (Beginning: 100 units at $20) …………….
Inventory (+A) (Ending: 50 units at $20) ……………………….
1,000
Cost of goods sold (−E, +SE) ………………………………….
Calculation of cost of goods sold:
Beginning inventory (100 units at $20)
$2,000
Add purchases
300
Goods available for sale
2,300
Ending inventory (physical count—50 units at $20)
1,000
Cost of goods sold
$1,300
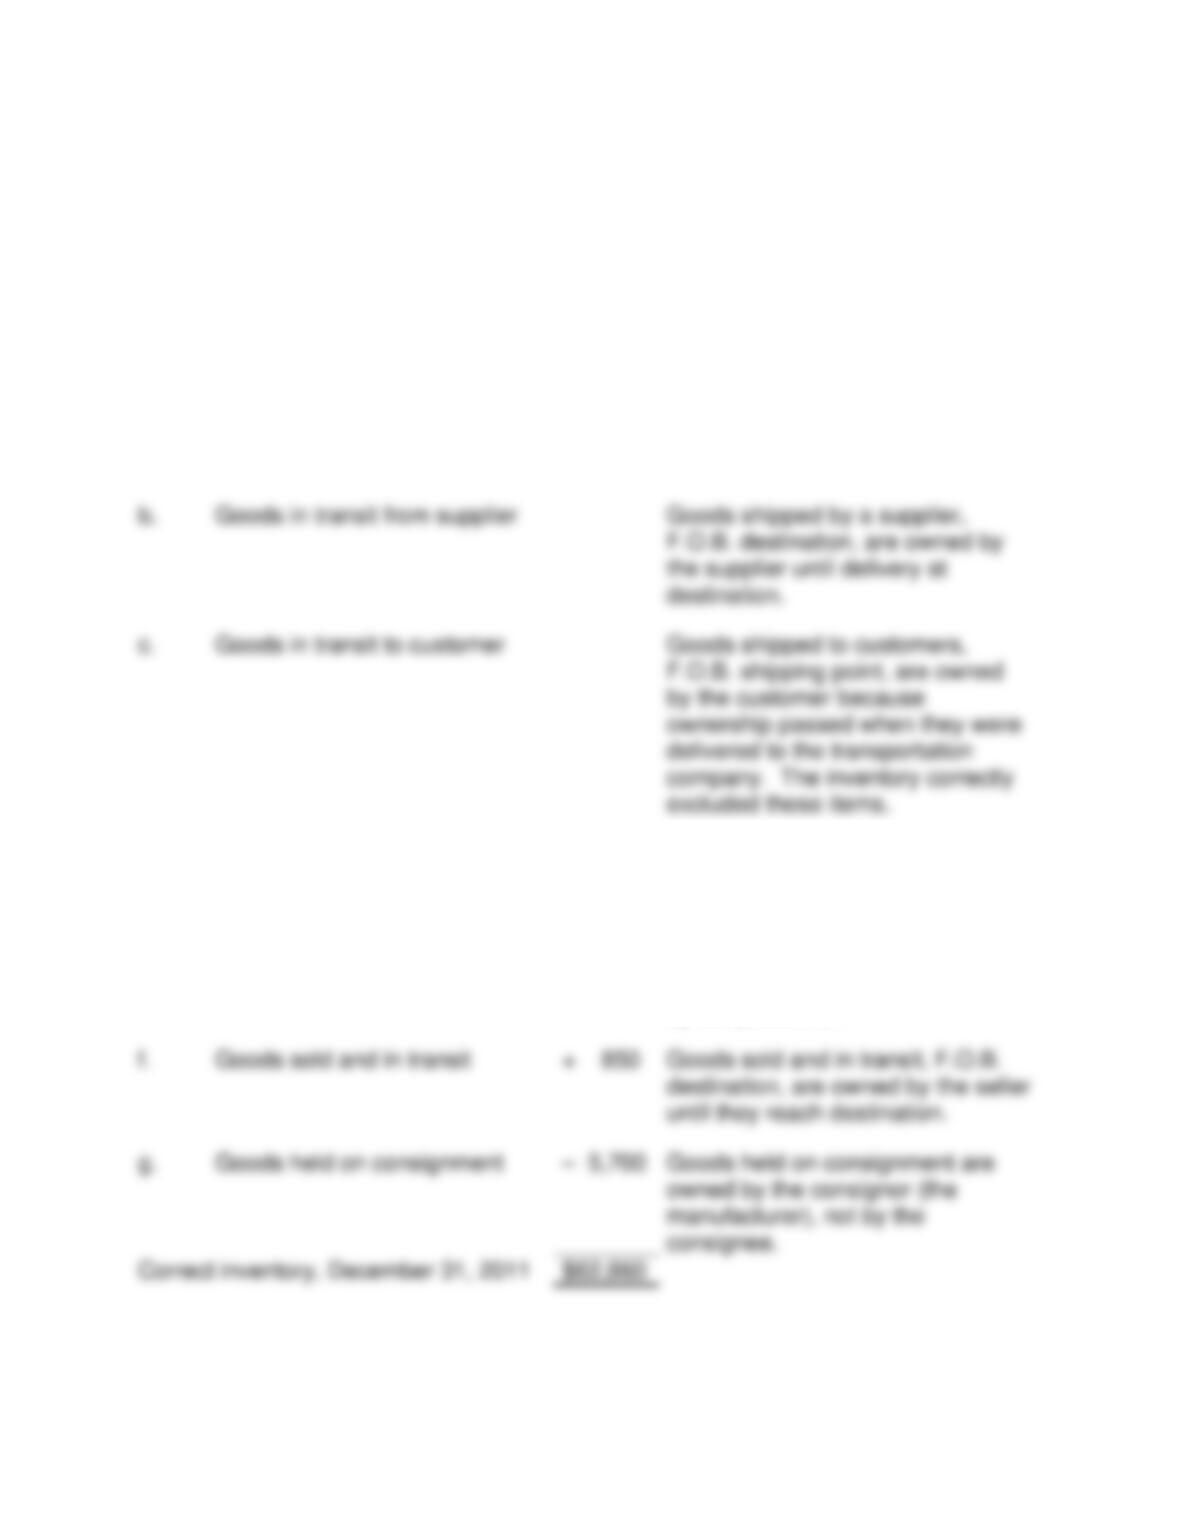
April 9
Inventory (+A) (15 units at $20) ……………………………………
Accounts payable (+L)……………………………………………
September 2
Accounts receivable (+A) …………………………………………….
Sales (+R, +SE) (45 units at $50) …………………………..
Cost of goods sold (+E, −SE) ………………………………………
900
Inventory (−A) (45 units at $20) …………………………..
900
End of year
No year-end adjusting entry needed.
Chapter 07 – Reporting and Interpreting Cost of Goods Sold and Inventory
7-26
PROBLEMS
P7–1.
Item
Amount
Explanation
Ending inventory (physical count on
December 31, 2011)
$65,000
Per physical inventory.
a.
Goods out on trial to customer
+ 750
Goods held by a customer on trial
are still owned by the vendor; no
sale or transfer of ownership has
occurred.
d.
Goods held for customer pickup
– 1,590
The goods sold, but held for
customer pickup, are owned by the
customer. Ownership has passed.
e.
Goods purchased and in transit
+ 3,550
Goods purchased and in transit,
F.O.B. shipping point, are owned
by the purchaser.
Goods sold and in transit
+ 850
Goods sold and in transit, F.O.B.
destination, are owned by the seller
until they reach destination.
g.
Goods held on consignment
Goods held on consignment are
owned by the consignor (the
manufacturer), not by the
consignee.
Correct inventory, December 31, 2011
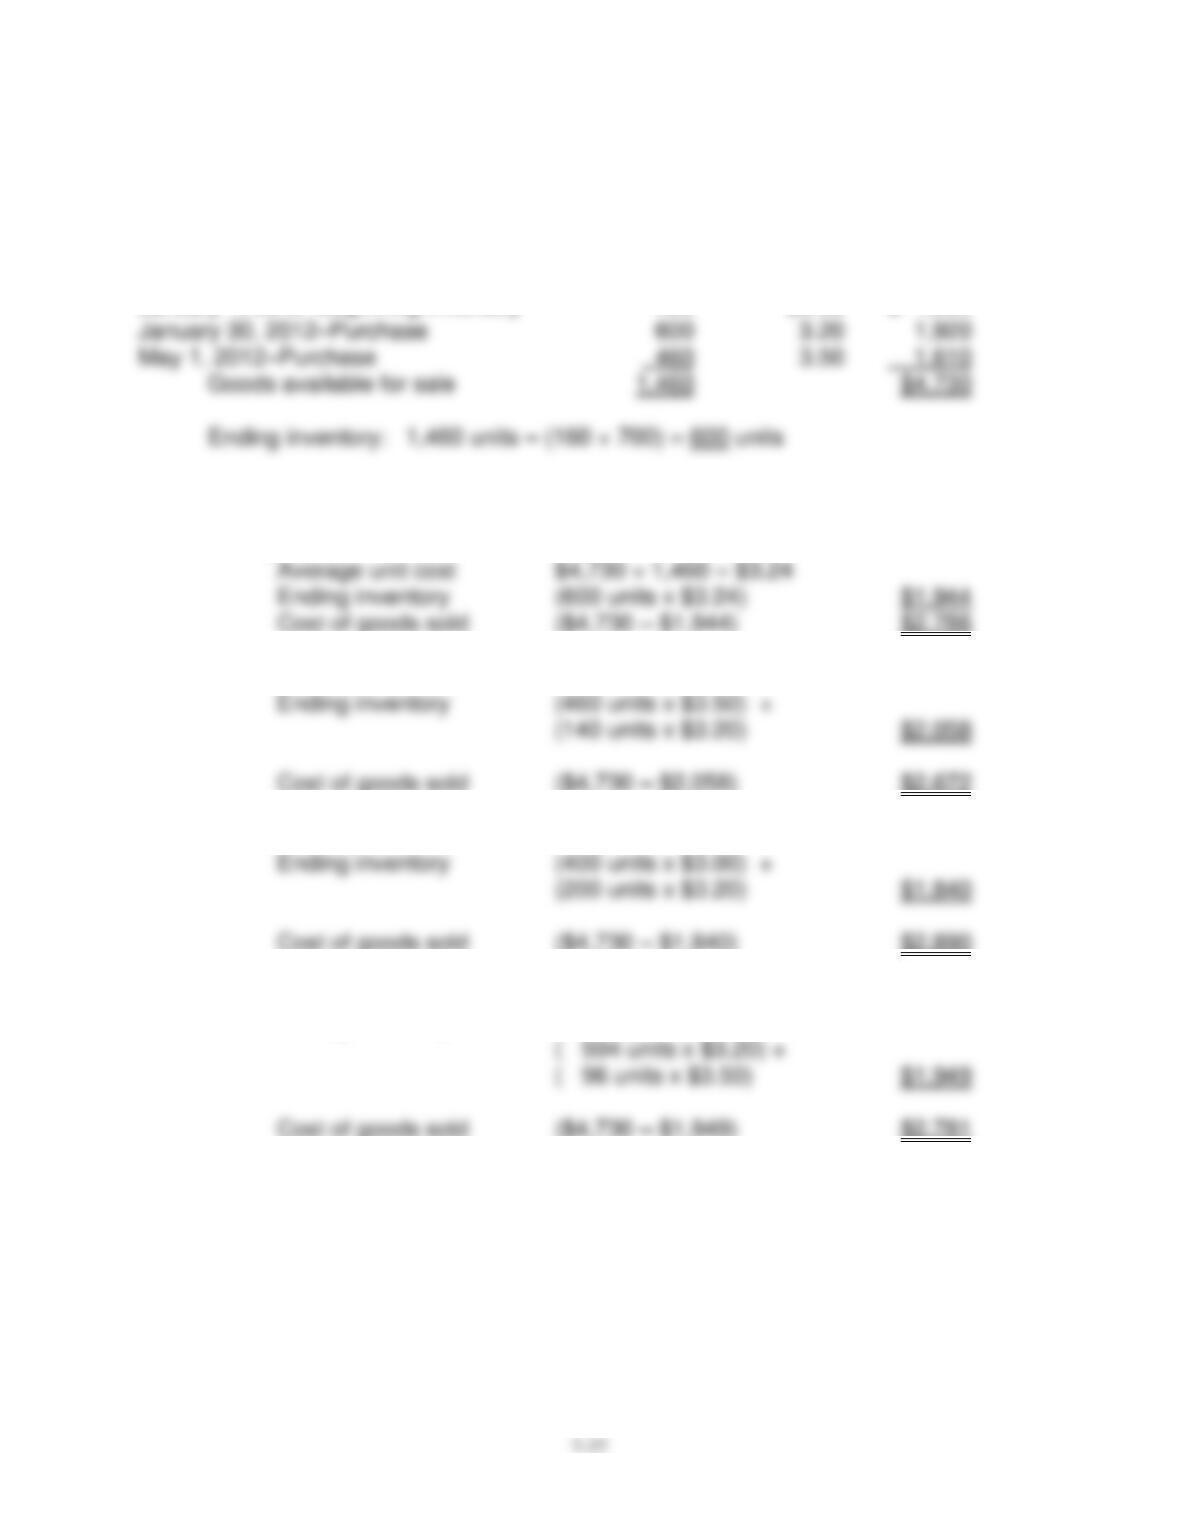
b.
Goods in transit from supplier
Goods shipped by a supplier,
F.O.B. destination, are owned by
the supplier until delivery at
destination.
excluded these items.
Chapter 07 – Reporting and Interpreting Cost of Goods Sold and Inventory
P7–2.
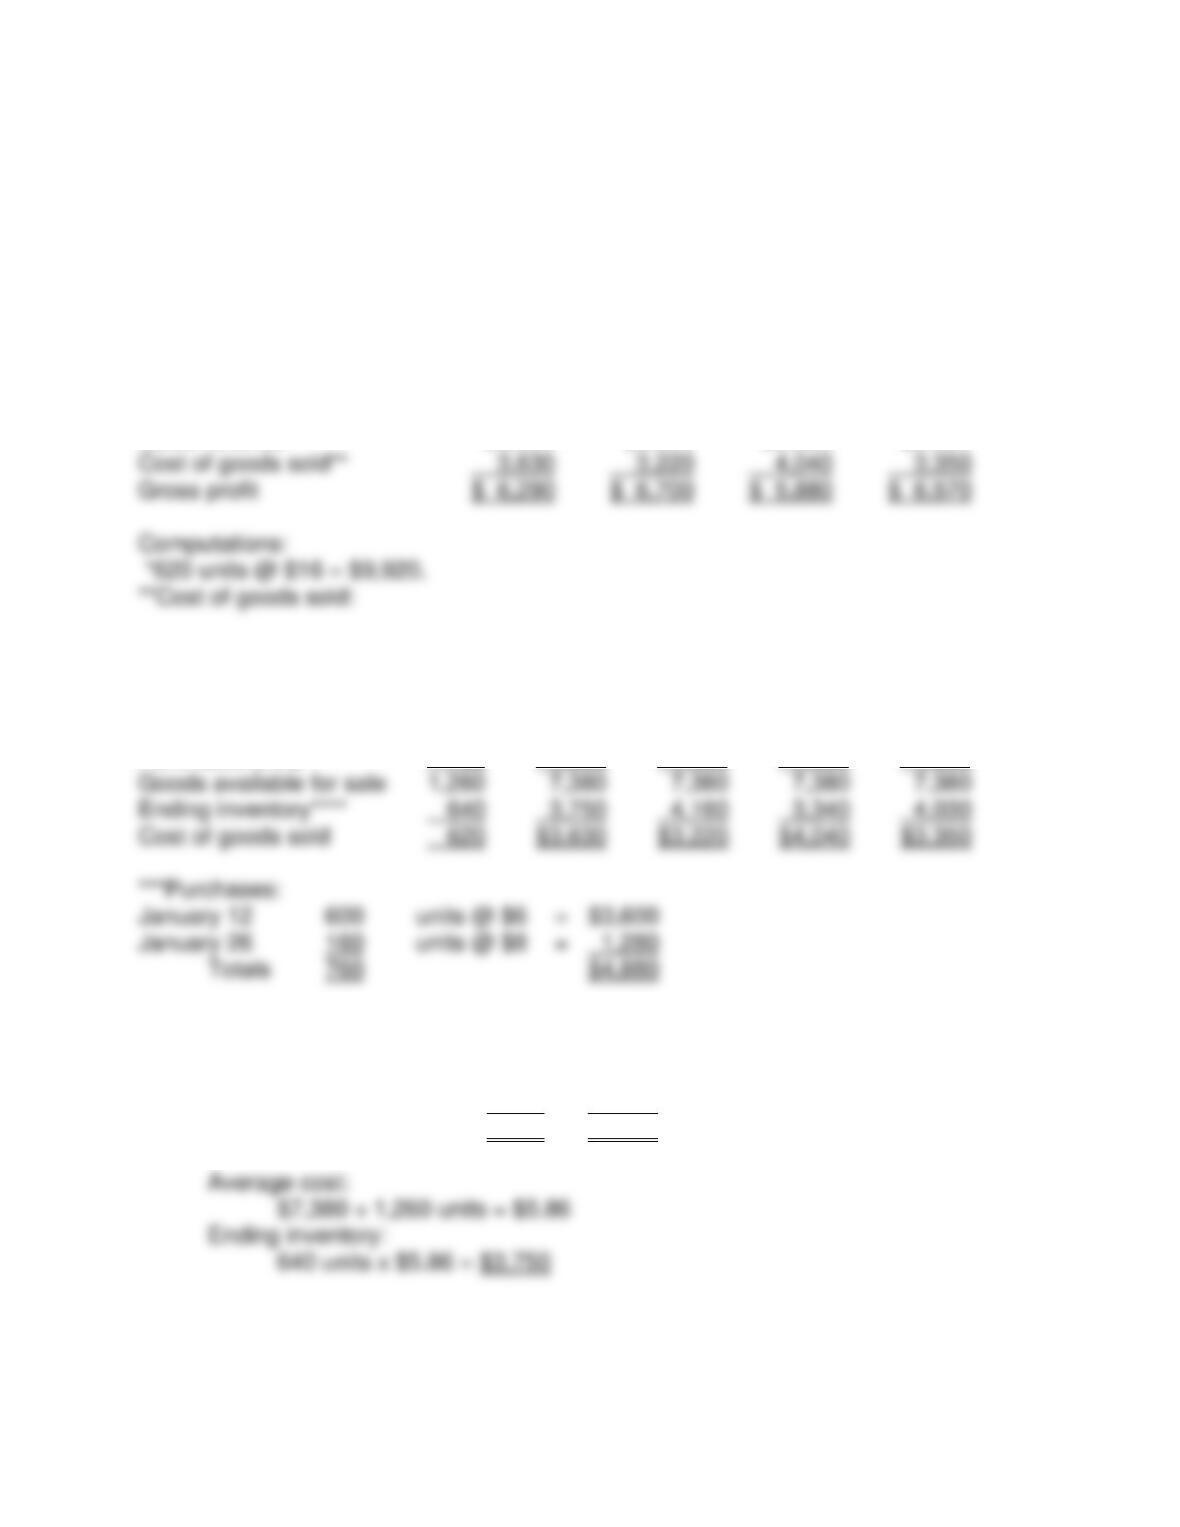
a) Goods available for sale for all methods:
Unit Total
Units Cost Cost
January 1, 2012–Beginning inventory 400 $3.00 $ 1,200
b) and c)
1. Average cost:
2. First-in, first-out:
3. Last-in, first-out:
4. Specific identification:
Ending inventory ( 0 units x $3.00) +
Chapter 07 – Reporting and Interpreting Cost of Goods Sold and Inventory
7-28
P7–3.
Req. 1
DONNER COMPANY
Partial Income Statement
For the Month Ended January 31, 2011
(a) (b) (c) (d)
Average Specific
Cost FIFO LIFO Identification
Sales revenue* $9,920 $9,920 $9,920 $9,920
Average Specific
Units Cost FIFO LIFO Identification
Beginning inventory 500 $2,500 $2,500 $2,500 $2,500
Purchases (net)*** 760 4,880 4,880 4,880 4,880
****Ending inventory:
a. Average cost: Units Amount
Beginning inventory 500 $2,500
Purchases (per above) 760 4,880
1,260 $7,380
Chapter 07 – Reporting and Interpreting Cost of Goods Sold and Inventory
P7–3. (continued)
Req. 1 (continued)
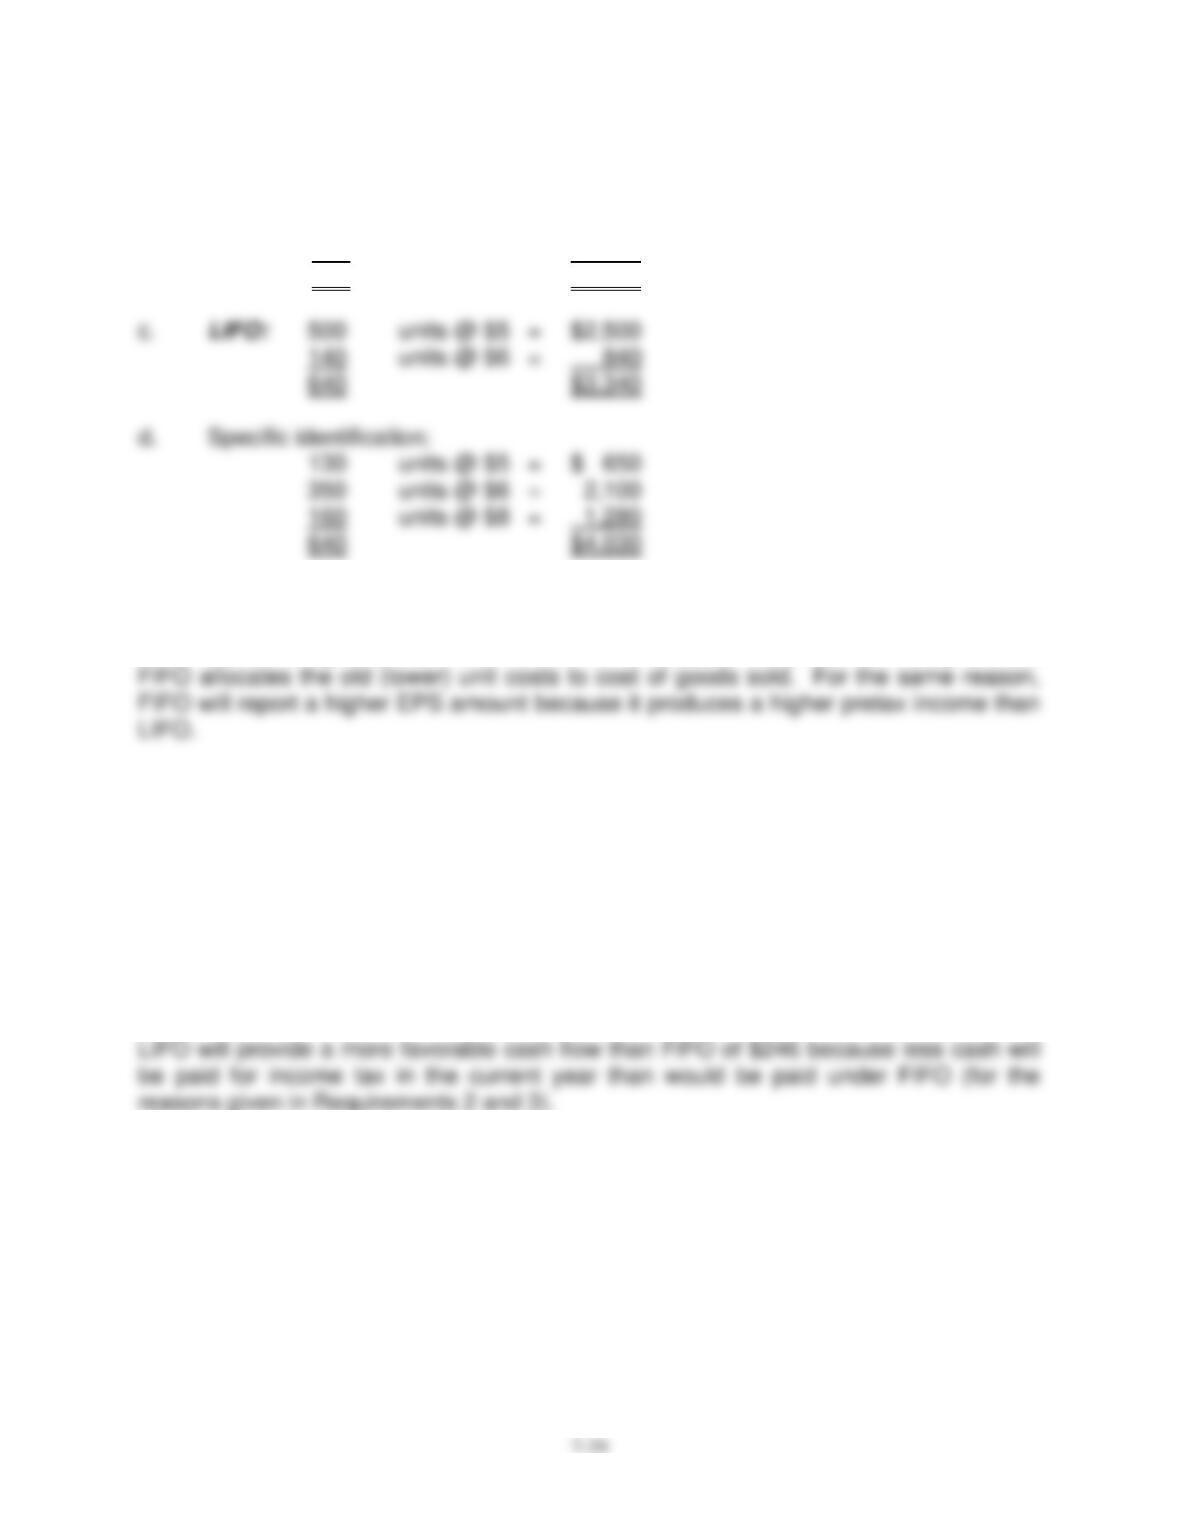
b. FIFO: 160 units @ $8 = $1,280
480 units @ $6 = 2,880
640 $4,160
Req. 2
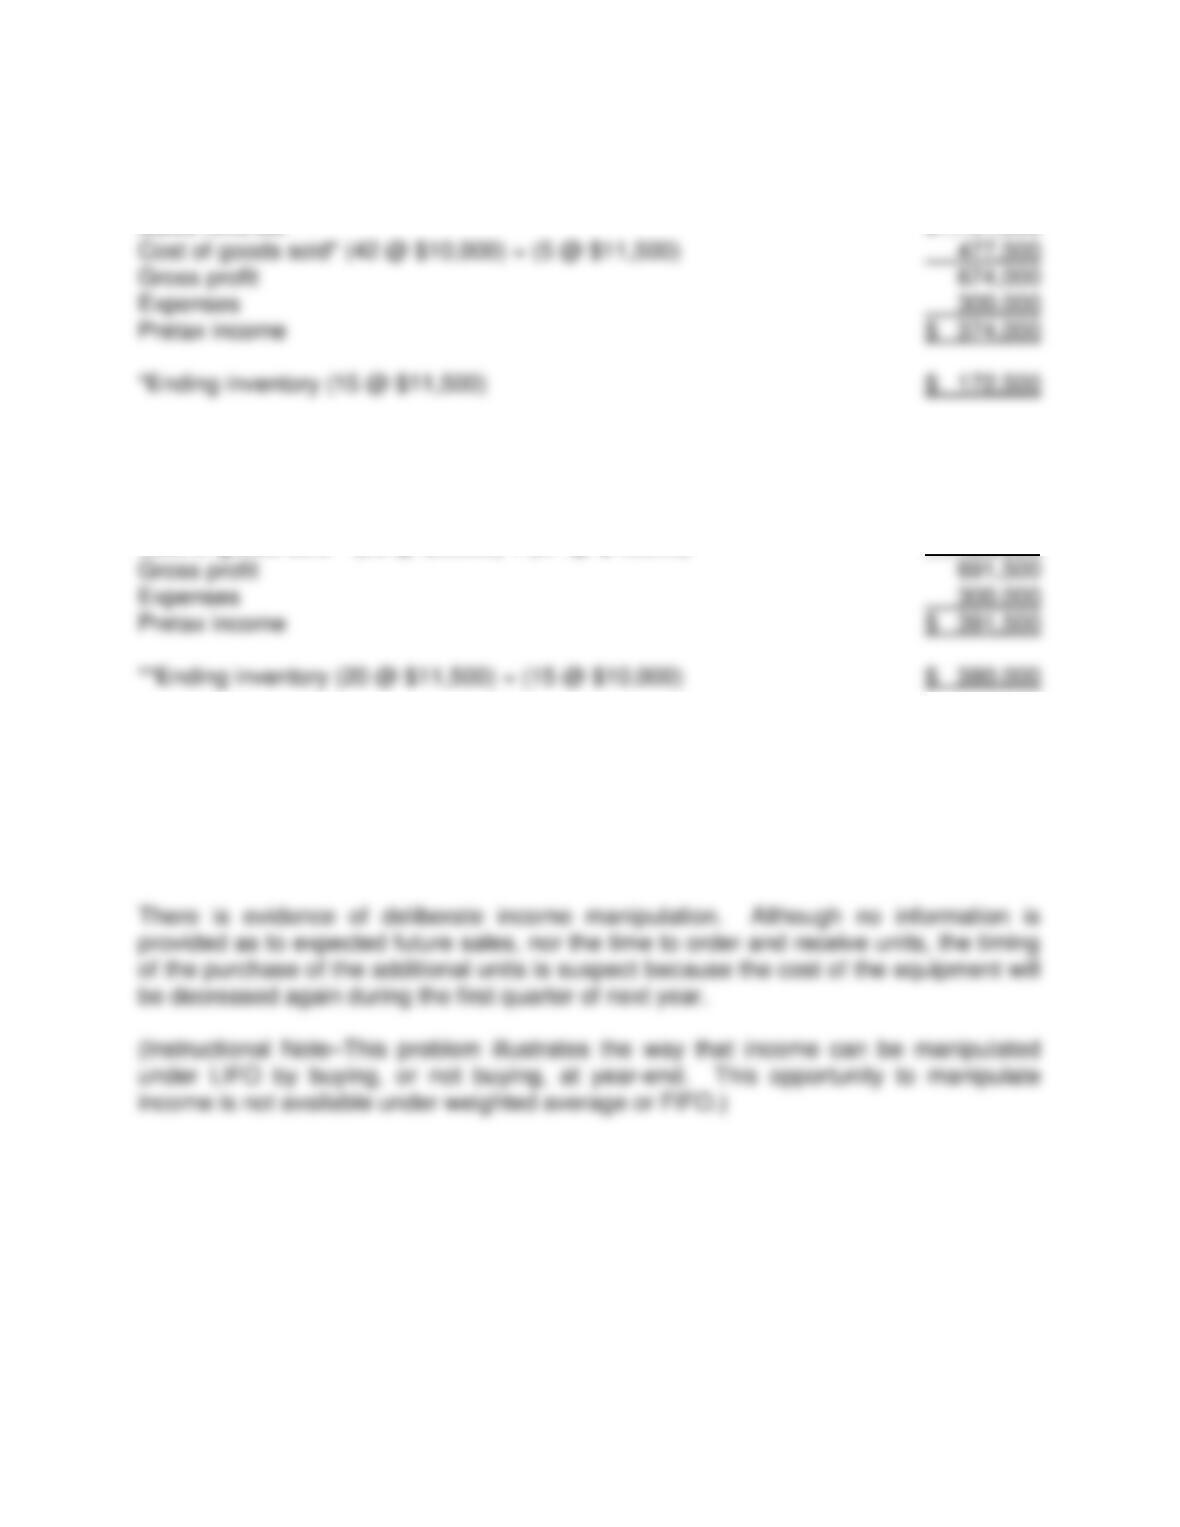
FIFO reports a higher pretax income than LIFO because (1) prices are rising and (2)
Req. 3
Because LIFO reports a lower pretax income than FIFO for the reasons given in
Requirement (2), the former will derive less income tax by ($6,700 – $5,880) x 30% =
$246.
Req. 4
Chapter 07 – Reporting and Interpreting Cost of Goods Sold and Inventory
7-30
P7–4.
Req. 1
Sales revenue $1,151,500
Req. 2
Sales revenue $1,151,500
Cost of goods sold** (20 @ $9,500) + (27 @ $10,000) 460,000
Req. 3
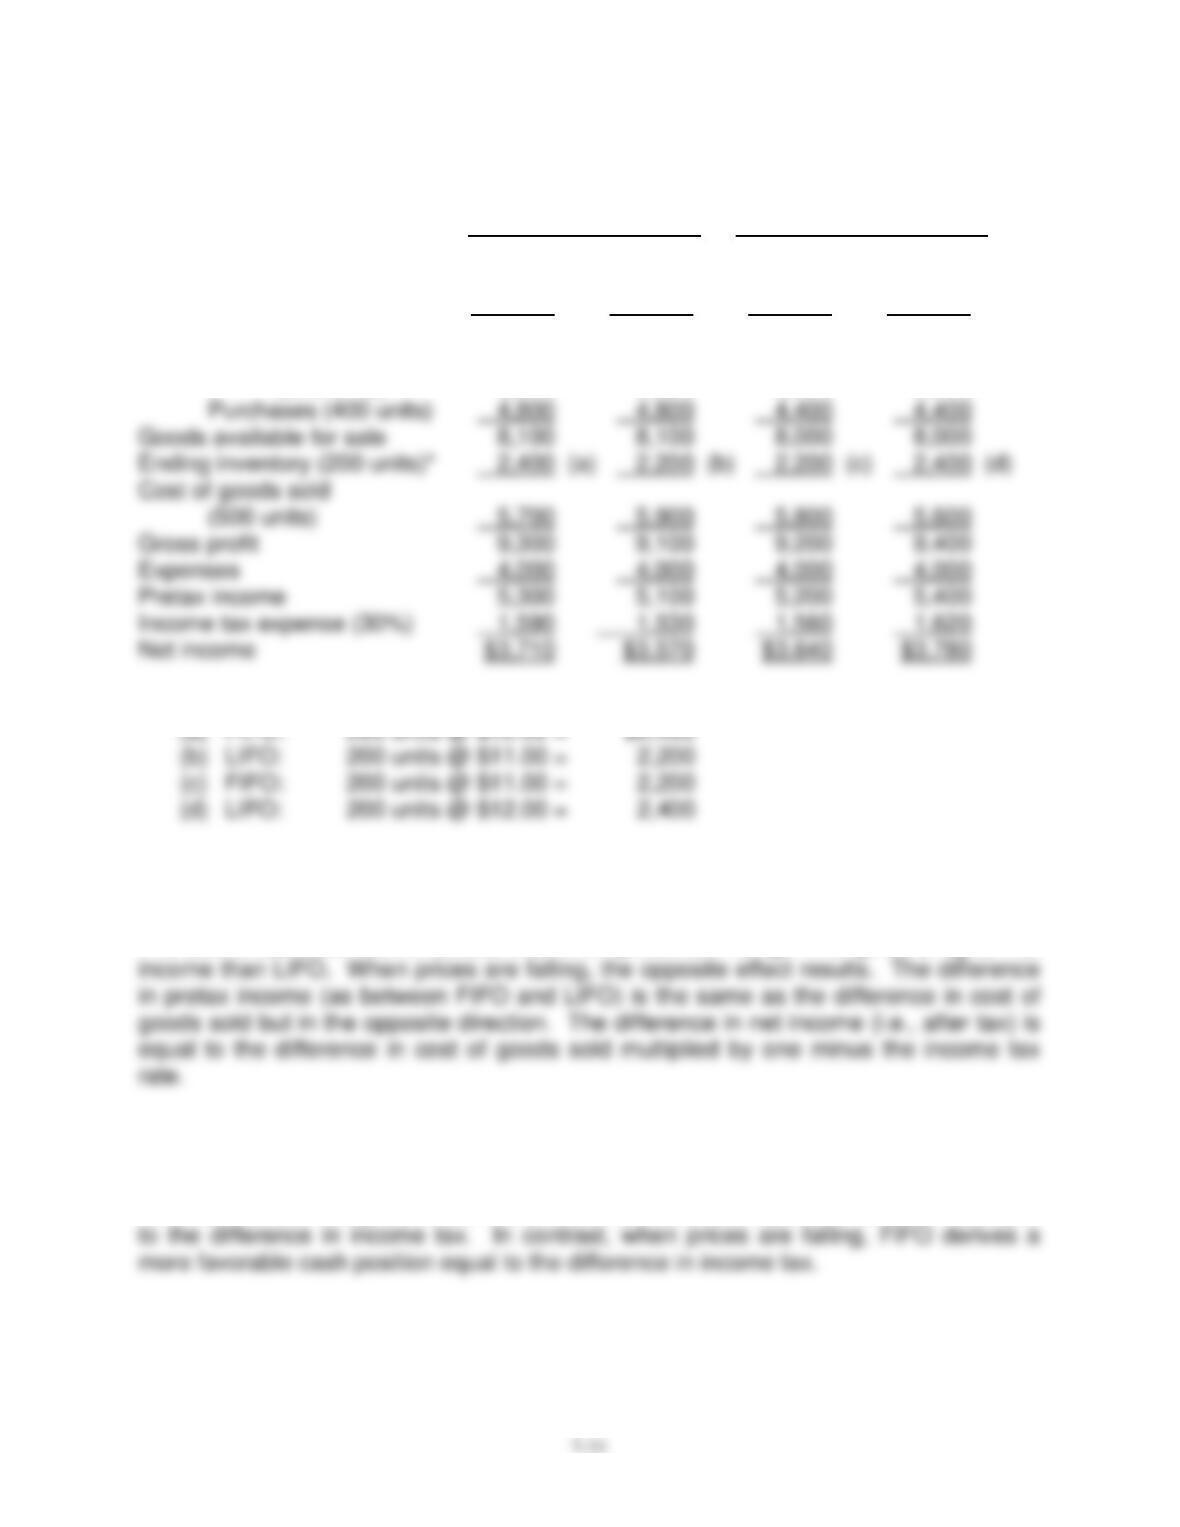
Pretax income increased by $17,500 because of the decision to purchase the additional
units at the end of the year. This decision provided lower cost units to allocate to cost of
goods sold, which increased pretax income.
Chapter 07 – Reporting and Interpreting Cost of Goods Sold and Inventory
P7–5.
Req. 1
Prices Rising Prices Falling
A B C D
FIFO LIFO FIFO LIFO
Sales revenue (500 units) $15,000 $15,000 $15,000 $15,000
Cost of goods sold:
Beginning inventory
(300 units) 3,300 3,300 3,600 3,600
*Inventory computations:
Req. 2
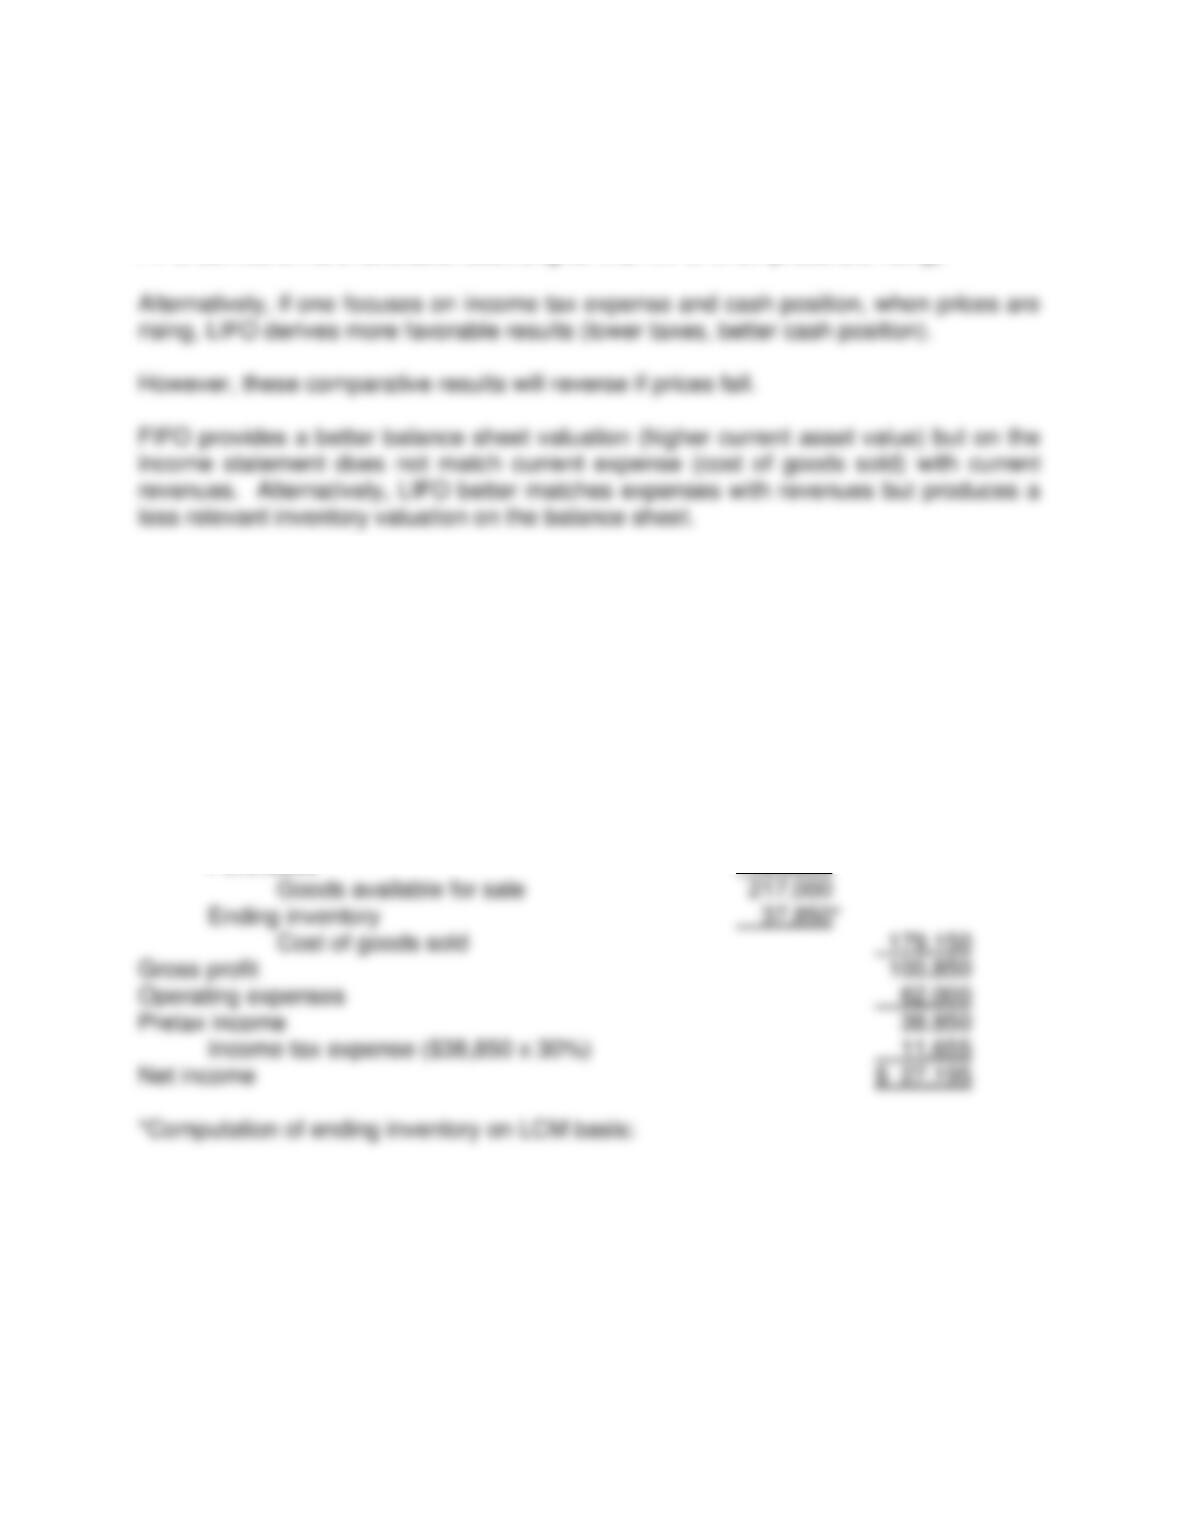
The above tabulation demonstrates that when prices are rising, FIFO gives a higher net
Req. 3
When prices are rising, LIFO derives a more favorable cash position (than FIFO) equal
Chapter 07 – Reporting and Interpreting Cost of Goods Sold and Inventory
7-32
P7–5. (continued)
Req. 4
Either method can be defended reasonably. If one focuses on current income and EPS,
FIFO derives a more favorable result (higher than LIFO when prices are rising).
P7–6.
Req. 1
HARVEY COMPANY
Income Statement (LCM basis)
For the Year Ended December 31, 2011
Sales revenue $280,000
Cost of goods sold:
Beginning inventory $ 33,000
Purchases 184,000
Chapter 07 – Reporting and Interpreting Cost of Goods Sold and Inventory
7-33
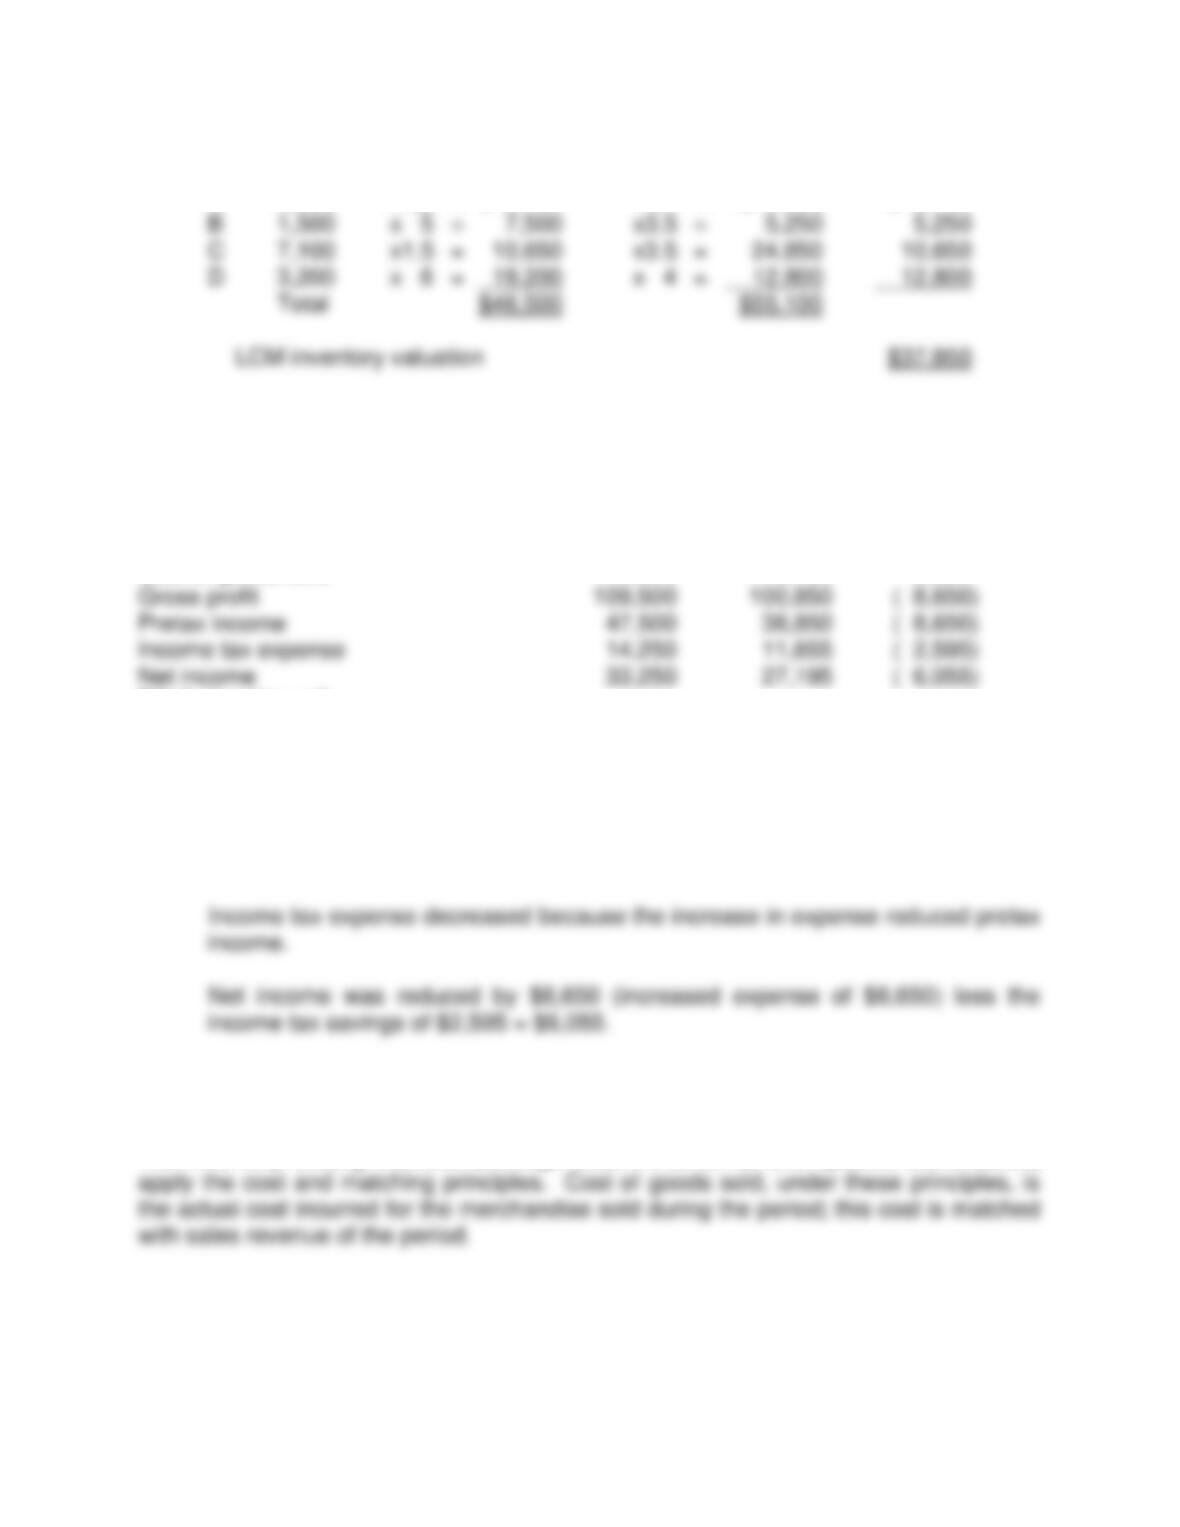
Replacement
Item Quantity Original Cost Cost (Market) LCM Valuation
A 3,050 x $3 = $ 9,150 x $4 = $12,200 $ 9,150
Req. 2
Amount of
FIFO LCM Change
Item Changed Cost Basis Basis (Decrease)
Ending inventory $ 46,500 $ 37,850 ($8,650)
Cost of goods sold 170,500 179,150 8,650
P7–6. (continued)
Req. 2 (continued)
Analysis
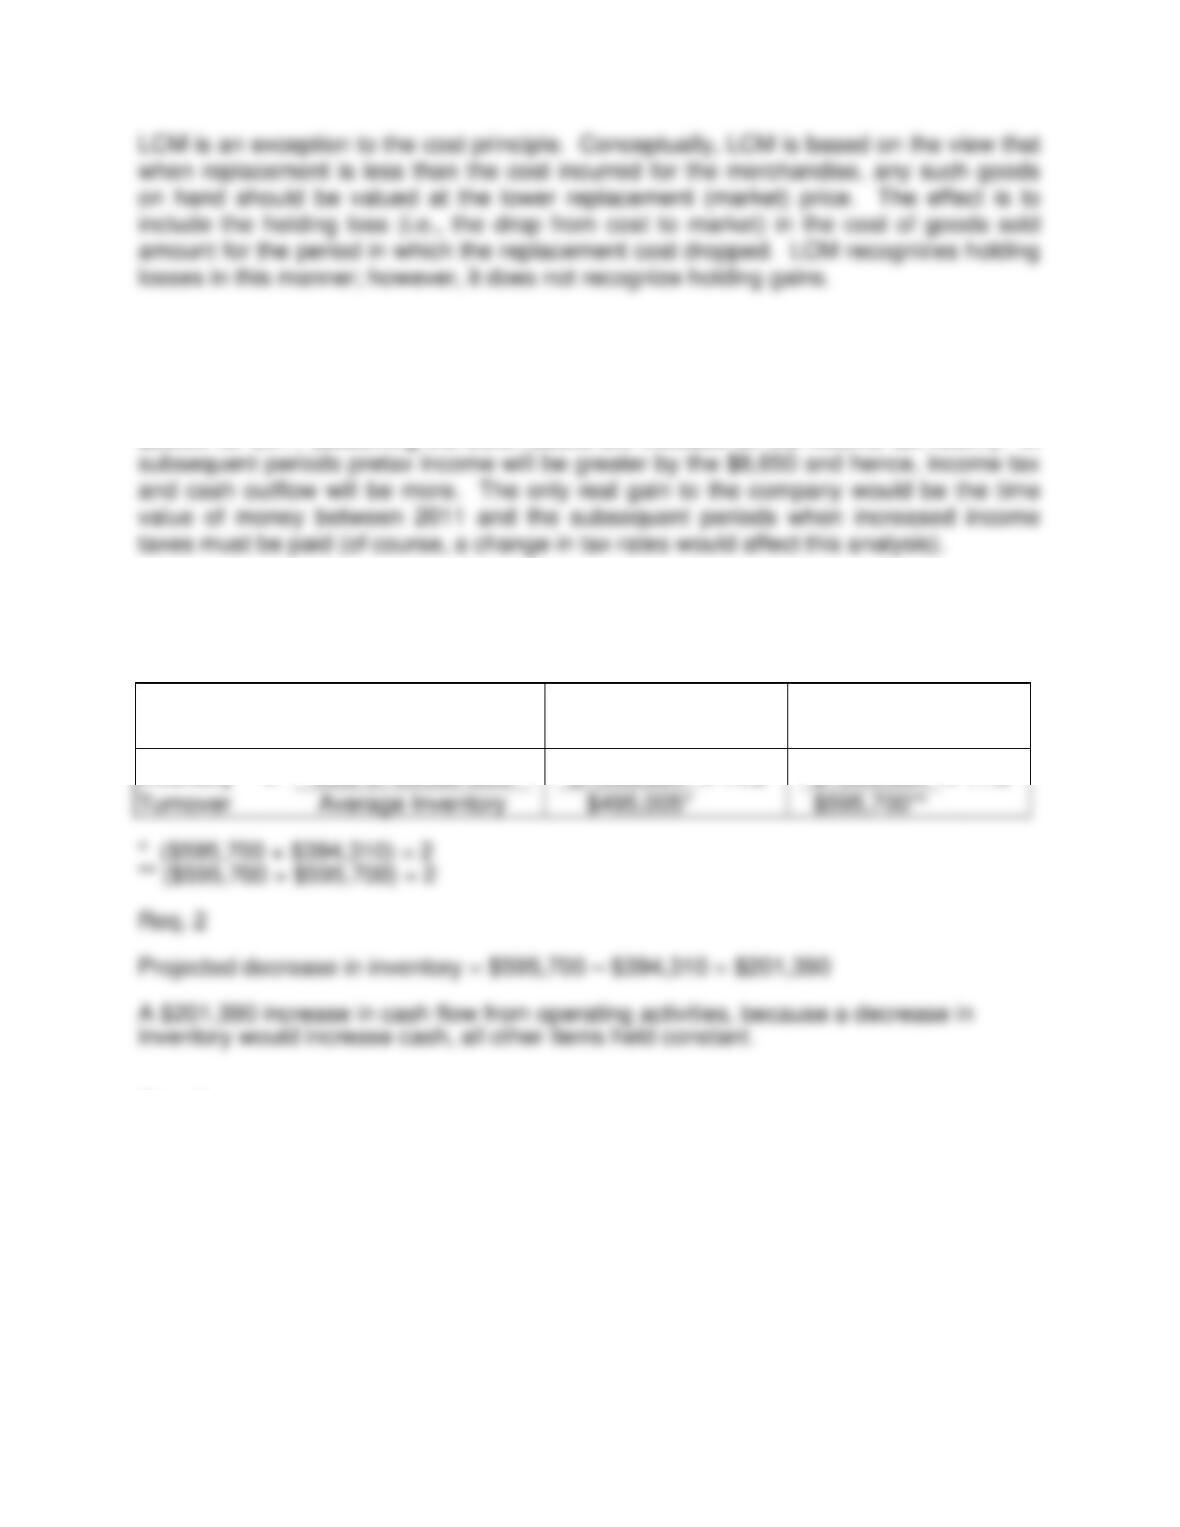
Ending inventory, cost of goods sold, gross profit, and pretax income each
changed by the change in the valuation of the ending inventory.
Req. 3
The inventory costing methods (average cost, FIFO, LIFO, and specific identification)
Chapter 07 – Reporting and Interpreting Cost of Goods Sold and Inventory
7-34
Req. 4
LCM reduced pretax income and income tax expense. There was a cash savings of
$2,595 for 2011 (assuming the LCM results are included on the income tax return). In
P7–7.
Req. 1
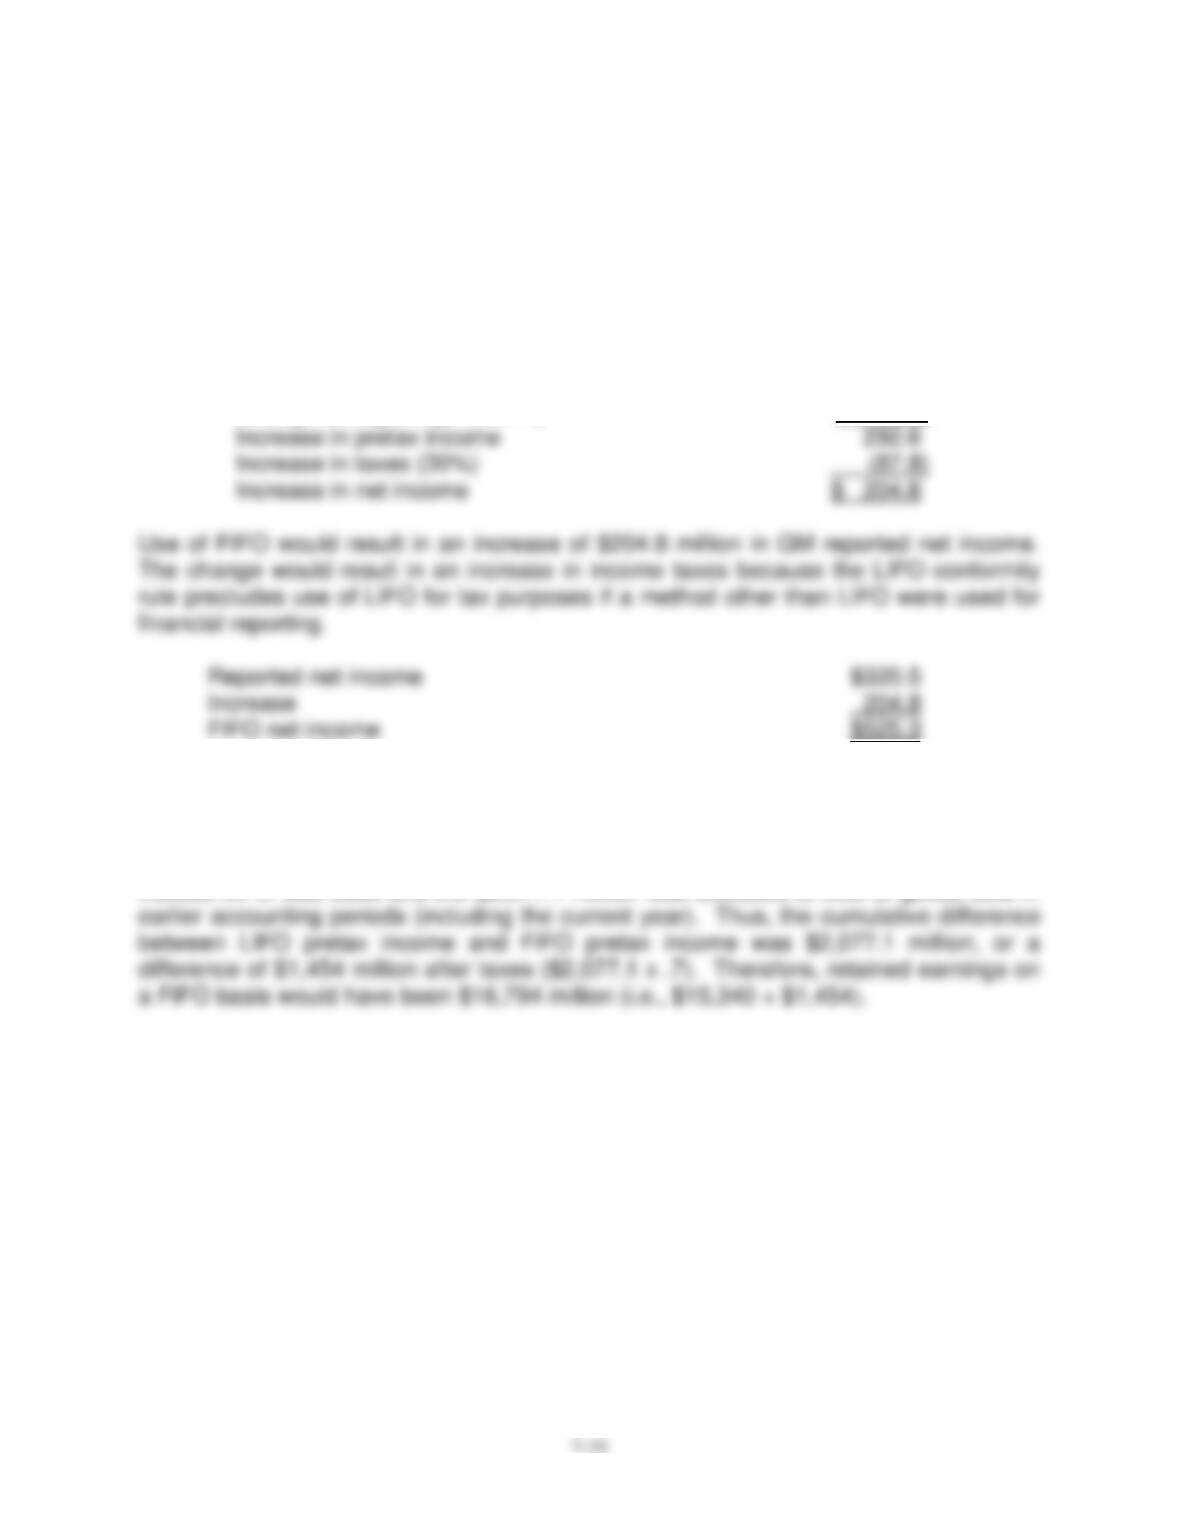
Projected
change
No change from
beginning of year
Inventory
=
Cost of Goods Sold
$7,008,984
=
14.2
$7,008,984
=
11.8
Turnover
Req. 3
An increase in the inventory turnover ratio indicates an increase in the number of times
average inventory was produced and sold during the period. A higher ratio indicates that
inventory moves more quickly through the production process to the ultimate customer.
As a consequence, the company can maintain less inventory on hand, all other things
being equal. This can benefit the company because less money is tied up in inventory
and as a result, cash flow from operations will be higher. The excess cash can be
invested, earning interest income, or used to reduce borrowings, reducing interest
expense.
Chapter 07 – Reporting and Interpreting Cost of Goods Sold and Inventory
P7–8.
Req. 1
A change that increases beginning inventory will decrease net income while a change
that increases ending inventory will increase net income.
Impact on GM net
income (in millions)
Change in ending inventory $2,077.1
Change in beginning inventory (1,784.5)
Req. 2
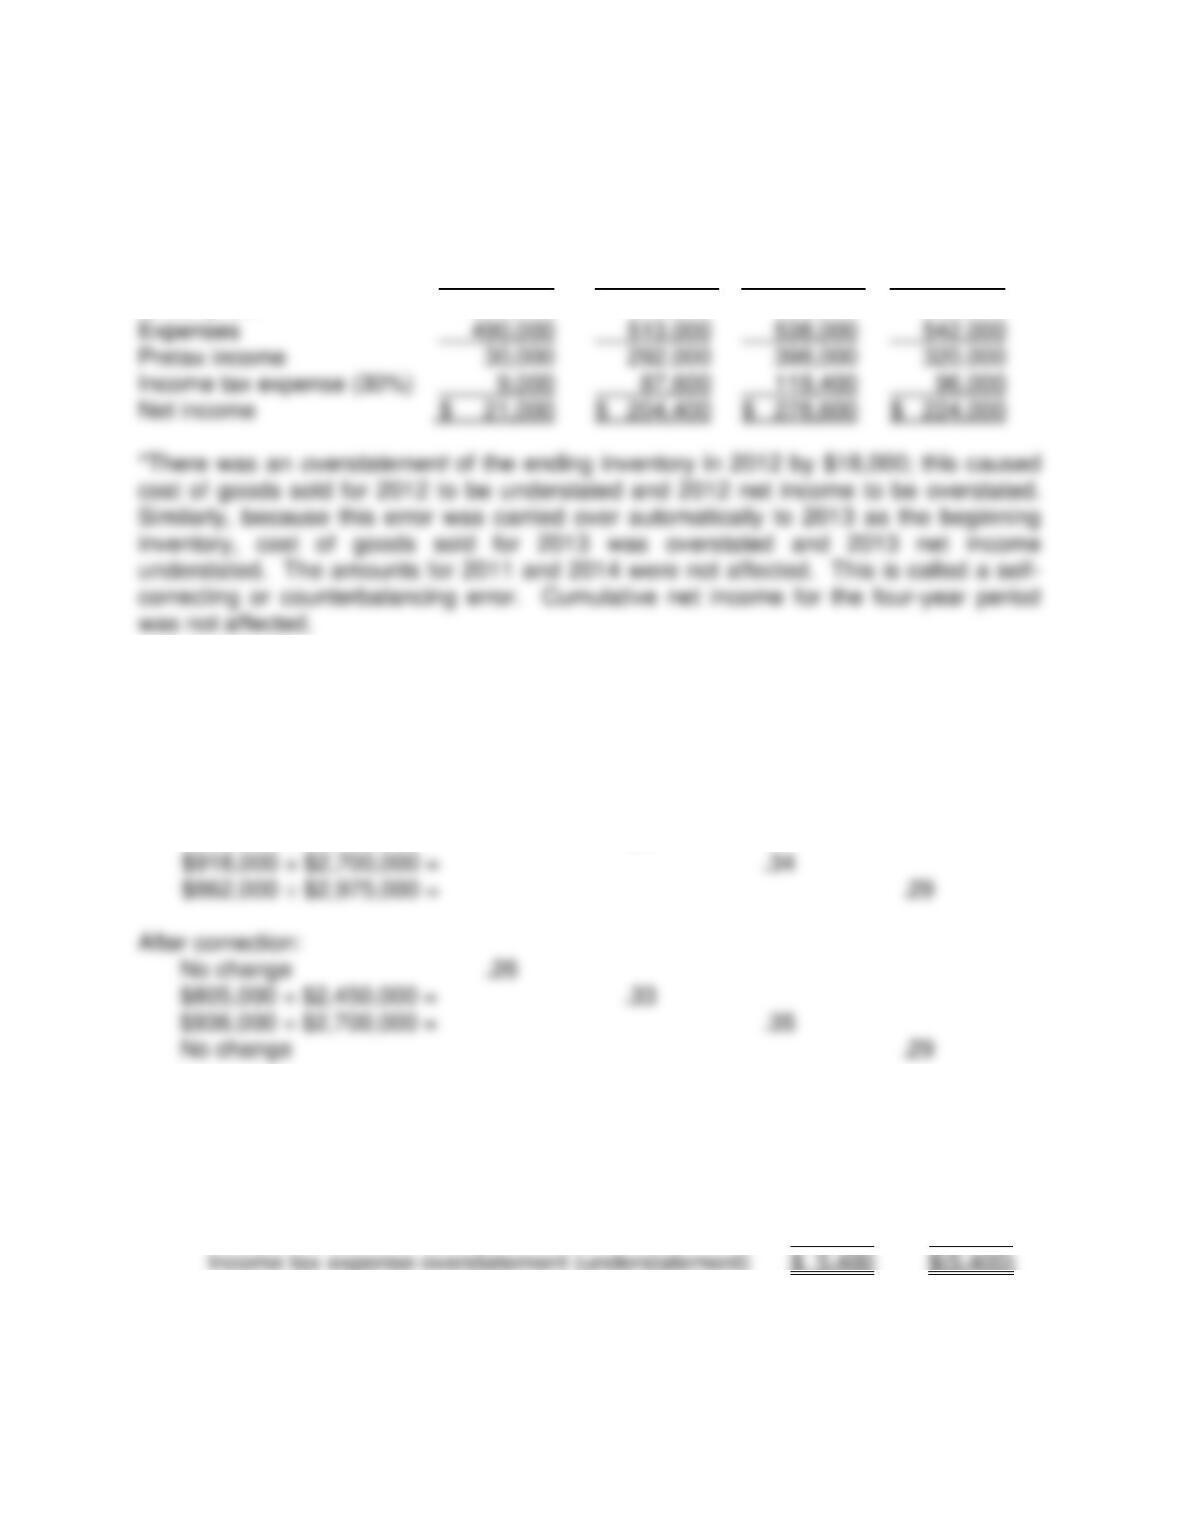
If FIFO had been used, the ending inventory would have been $2,077.1 million higher.
Instead LIFO was used and the $2,077.1 million was allocated to cost of goods sold in
Req. 3
The reduction in taxes (compared to FIFO) was $87.8 million (calculated in Req. 1).
Chapter 07 – Reporting and Interpreting Cost of Goods Sold and Inventory
7-36
P7–9.
Req. 1
2011 2012 2013 2014
Sales revenue $2,025,000 $2,450,000 $2,700,000 $2,975,000
Cost of goods sold 1,505,000 1,645,000* 1,764,000* 2,113,000
Gross profit 520,000 805,000 936,000 862,000
Req. 2
2011 2012 2013 2014
Gross profit ratio (gross profit ÷ sales):
Before correction:
$520,000 ÷ $2,025,000 = .26
$823,000 ÷ $2,450,000 = .34
Req. 3
The effect of the error on income tax expense was:
2012 2013
Income tax expense reported $93,000 $114,000
Correct income tax expense 87,600 119,400