116 Chapter 7 Inventories
If the physical inventory count is understated, too much shrinkage will be recorded. This will understate
Merchandise Inventory on the Balance Sheet and overstate Cost of Merchandise Sold on the Income
Statement.
If the physical inventory count is overstated, the accountant will not record enough shrinkage. This will
overstate Merchandise Inventory on the Balance Sheet and understate Cost of Merchandise Sold.
GROUP LEARNING ACTIVITY — Inventory Errors
TM 7-4 presents information concerning a business that has made an error in counting its ending
inventory. Divide the class into small groups and ask them to determine the effect of this error. Corrected
financial statements are shown on TM 7-5.
WRITING EXERCISE — Effect of Misstatements of Inventory on Financial
Statements
Ask your students to write a response to the following question (also on TM 7-6):
Why is it important to be accurate when taking a physical inventory count?
Possible response: If inventory is understated, total assets will be understated. On the income statement,
OBJECTIVE 7
Describe and illustrate the inventory turnover and the number of days’ sales in inventory in
analyzing the efficiency and effectiveness of inventory management.
The text presents various financial analyses of inventory and interpretations that may be made from them.
This will allow students to better understand the ways financial data related to inventory may be used and
evaluated after they have studied procedures for recording and reporting inventory transactions.
Chapter 7 Inventories 117
KEY TERMS
Inventory Turnover
Number of Days’ Sales in Inventory
SUGGESTED APPROACH
The following Lecture Aid will help you in presenting the inventory ratios to your students. Follow that
information with a short Demonstration Problem.
The textbook compares the inventory turnover and number of days’ sales in inventory for BestBuy and
Zale Corporation. Use the text material to stress that the differences in these two retailers can be clearly
seen in their inventory ratios.
LECTURE AID — Financial Ratios Related to Inventories
Inventory turnover measures efficiency in managing inventories by comparing a company’s average
inventory to the total inventory sold. The formula is as follows:
Inventory Cost of Merchandise Sold
Turnover = Average Inventory
In effect, this ratio measures how many times during a year a company purchased and sold its average
inventory balance. For example, if a company usually carries an average of $100 in inventory and its sales
were $800 during a year, that company sold (or turned over) its average inventory eight times.
The ratio uses average inventory instead of the ending balance in the inventory account in order to smooth
out any seasonal fluctuations in inventory balances. In determining this average, it is ideal to average
inventory balances at the end of each month for a year. However, in many cases, monthly data are not
available, so the beginning and end of the year inventory amounts are averaged.
118 Chapter 7 Inventories
DEMONSTRATION PROBLEM — Inventory Ratios
Use the following data to calculate inventory turnover and number of days’ sales in inventory:
The inventory turnover would be computed as follows:
INTERNET ACTIVITY — Inventory Turnover
Instruct your students to search the Web using “Inventory Turnover” as their search criteria. At the time
this manual was written, the following site offered some interesting information:
http://www.effectiveinventory.com/article2.html
On this site, Effective Inventory Management, Inc., shares insights on the inventory turnover formula.
APPENDIX
Estimate the cost of inventory, using the retail method and the gross profit method.
KEY TERMS
Gross Profit Method
Retail Inventory Method
Chapter 7 Inventories 119
SUGGESTED APPROACH
Begin by reviewing the reasons that a company may need to estimate its inventory. Reasons for
estimating inventory include the following:
2. Determining inventory lost in a disaster, such as a fire, flood, tornado, hurricane, or earthquake.
3. Perpetual inventory records are not maintained.
LECTURE AID — Gross Profit Method of Estimating Inventory
The gross profit method is based on the following equation.
Beginning Inventory
+ Cost of Merchandise Purchased
Merchandise Available for Sale
– Cost of Merchandise Sold
Ending Inventory
If you know the beginning inventory, cost of merchandise purchased, and cost of merchandise sold, you
can determine the ending inventory that should be on hand. The problem is this: What if you do not know
your cost of merchandise sold? For example, cost of merchandise sold is not tracked under the periodic
inventory system. If a fire has destroyed your business, you may no longer have the accounting records
that showed your cost of merchandise sold. Explain that you can calculate cost of merchandise sold using
the following methodology:
GROUP LEARNING ACTIVITY — Gross Profit Method of Estimating
Inventory
TM 7-20 presents information your students can use in solving a gross profit method problem. Divide the
class into small groups and ask them to solve this problem using the previous equations. The solution is
shown on TM 7-21. After your students have solved this problem, remind them that the gross profit
method works best with companies that have a stable markup on merchandise.
120 Chapter 7 Inventories
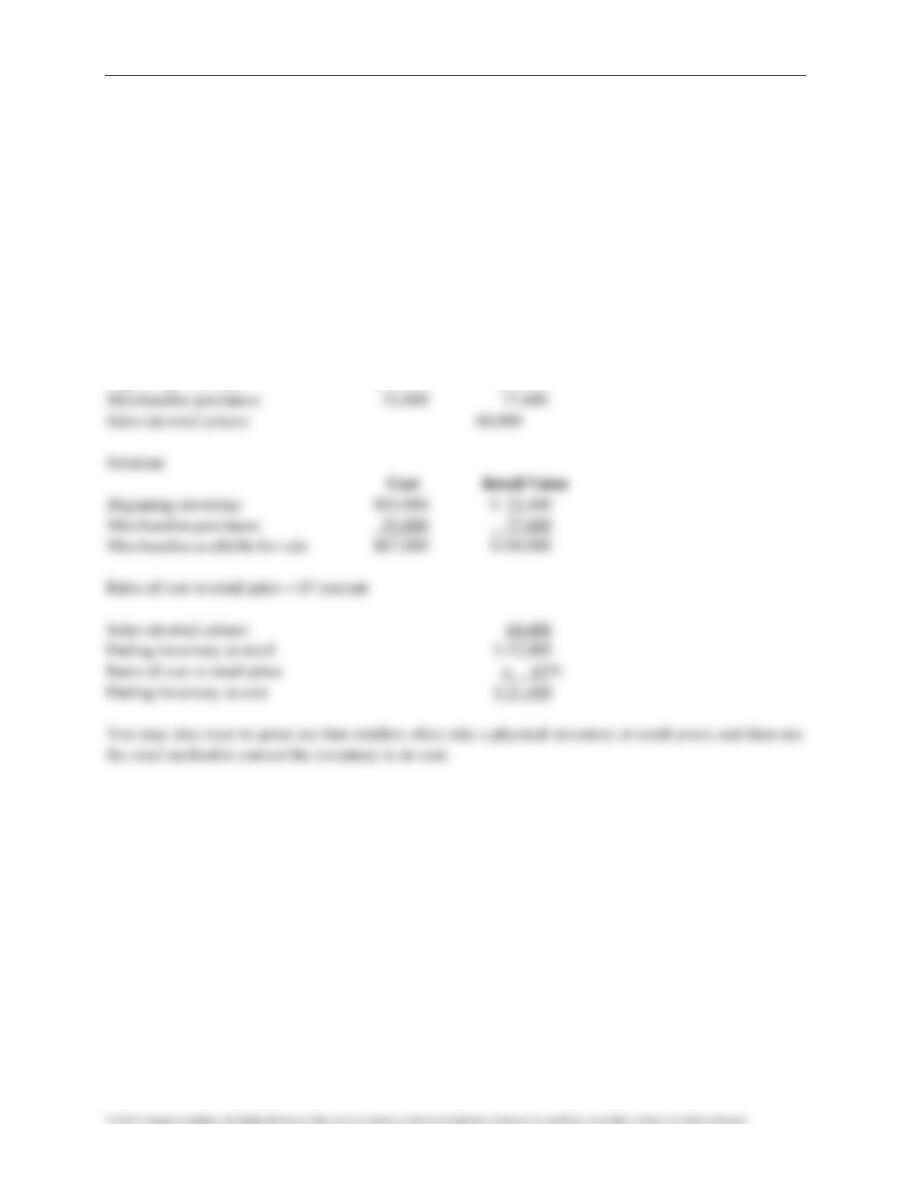
DEMONSTRATION PROBLEM — Retail Method of Estimating Inventory
The retail method can be used successfully by merchandisers who do not use a stable gross profit
percentage. One step in the retail method is to determine the markup on merchandise by comparing the
cost of inventory items to their retail value.
To use the retail method, a merchandiser must track his or her beginning inventory and all inventory
purchases, both at their cost and their retail value.
Example: Malarky Enterprises has the following data for the current year of operations. Use these data to
estimate Malarky’s ending inventory.
Cost Retail Value
Beginning inventory $15,000 $22,400
DIFFICULTY BUSPROG AICPA ACBSP BLOOM’S TIME
Problem
Learning
Objective
Description Primary Functional Primary
Spread-
sheet
GL
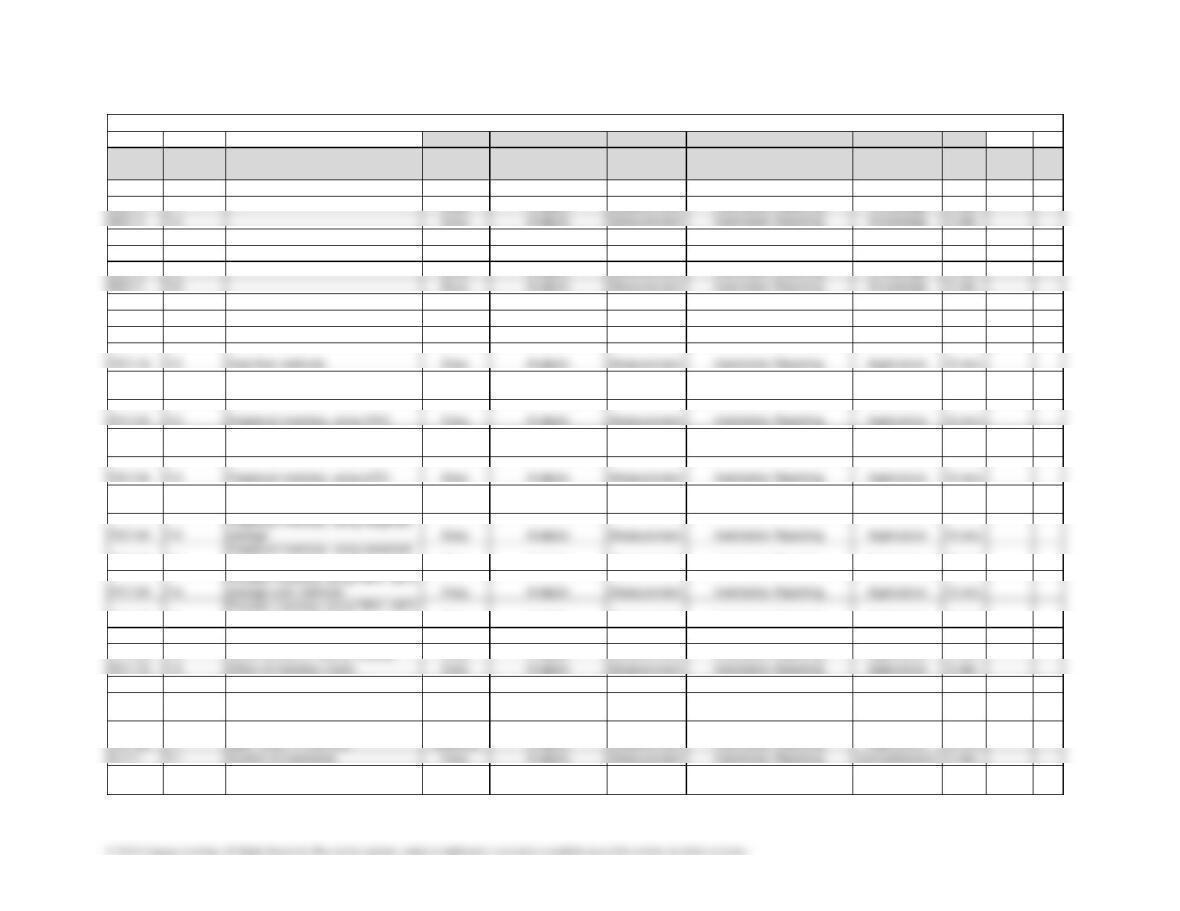
DQ7-1 7-1 Easy Analytic Measurement Inventories Reporting Knowledge 5 min.
DQ7-2 7-1 Easy Analytic Measurement Inventories Reporting Knowledge 5 min.
DQ7-3 7-2 Easy Analytic Measurement Inventories Reporting Knowledge 5 min.
DQ7-4 7-5 Easy Analytic Measurement Inventories Reporting Knowledge 5 min.
DQ7-5 7-5 Easy Analytic Measurement Inventories Reporting Knowledge 5 min.
DQ7-6 7-5 Easy Analytic Measurement Inventories Reporting Knowledge 5 min.
DQ7-7 7-6 Easy Analytic Measurement Inventories Reporting Knowledge 5 min.
DQ7-8 7-6 Easy Analytic Measurement Inventories Reporting Knowledge 5 min.
DQ7-9 7-6 Easy Analytic Measurement Inventories Reporting Knowledge 5 min.
DQ7-10 7-6 Easy Analytic Measurement Inventories Reporting Knowledge 5 min.
PE7-1B 7-2 Cost flow methods Easy Analytic Measurement Inventories Reporting Application 15 min.
PE7-2A 7-3 Perpetual inventory using FIFO Easy Analytic Measurement Inventories Reporting Application 10 min.
PE7-2B 7-3 Perpetual inventory using FIFO Easy Analytic Measurement Inventories Reporting Application 10 min.
PE7-3A 7-3 Perpetual inventory using LIFO Easy Analytic Measurement Inventories Reporting Application 10 min.
PE7-3B 7-3 Perpetual inventory using LIFO Easy Analytic Measurement Inventories Reporting Application 10 min.
PE7-4A 7-3
Easy Analytic Measurement Inventories Reporting Application 10 min.
PE7-4B 7-3
average
Easy Analytic Measurement Inventories Reporting Application 10 min.
PE7-5A 7-4
Easy Analytic Measurement Inventories Reporting Application 15 min.
PE7-5B 7-4
average cost methods
Easy Analytic Measurement Inventories Reporting Application 15 min.
PE7-6A 7-6 Lower-of-cost-or-market method Easy Analytic Measurement Inventories Reporting Application 5 min.
PE7-6B 7-6 Lower-of-cost-or-market method Easy Analytic Measurement Inventories Reporting Application 5 min.
PE7-7A 7-6 Effect of inventory errors Easy Analytic Measurement Inventories Reporting Application 5 min.
PE7-7B 7-6 Effect of inventory errors Easy Analytic Measurement Inventories Reporting Application 5 min.
PE7-8A 7-7
Inventory turnover and number of
days’ sales in inventory
Moderate Analytic Measurement Inventories Reporting Application 10 min.
PE7-8B 7-7
Inventory turnover and number of
days’ sales in inventory
Moderate Analytic Measurement Inventories Reporting Application 10 min.
Ex7-1 7-1 Control of inventories Easy Analytic Measurement Inventories Reporting Comprehension 5 min.
Ex7-2 7-1 Control of inventories Easy Analytic Measurement Inventories Reporting Comprehension 10 min.
HOMEWORK CHART WITH LEARNING OUTCOMES TAGGING
DIFFICULTY BUSPROG AICPA ACBSP BLOOM’S TIME
Problem
Learning
Objective
Description Primary Functional Primary
Spread-
sheet
GL
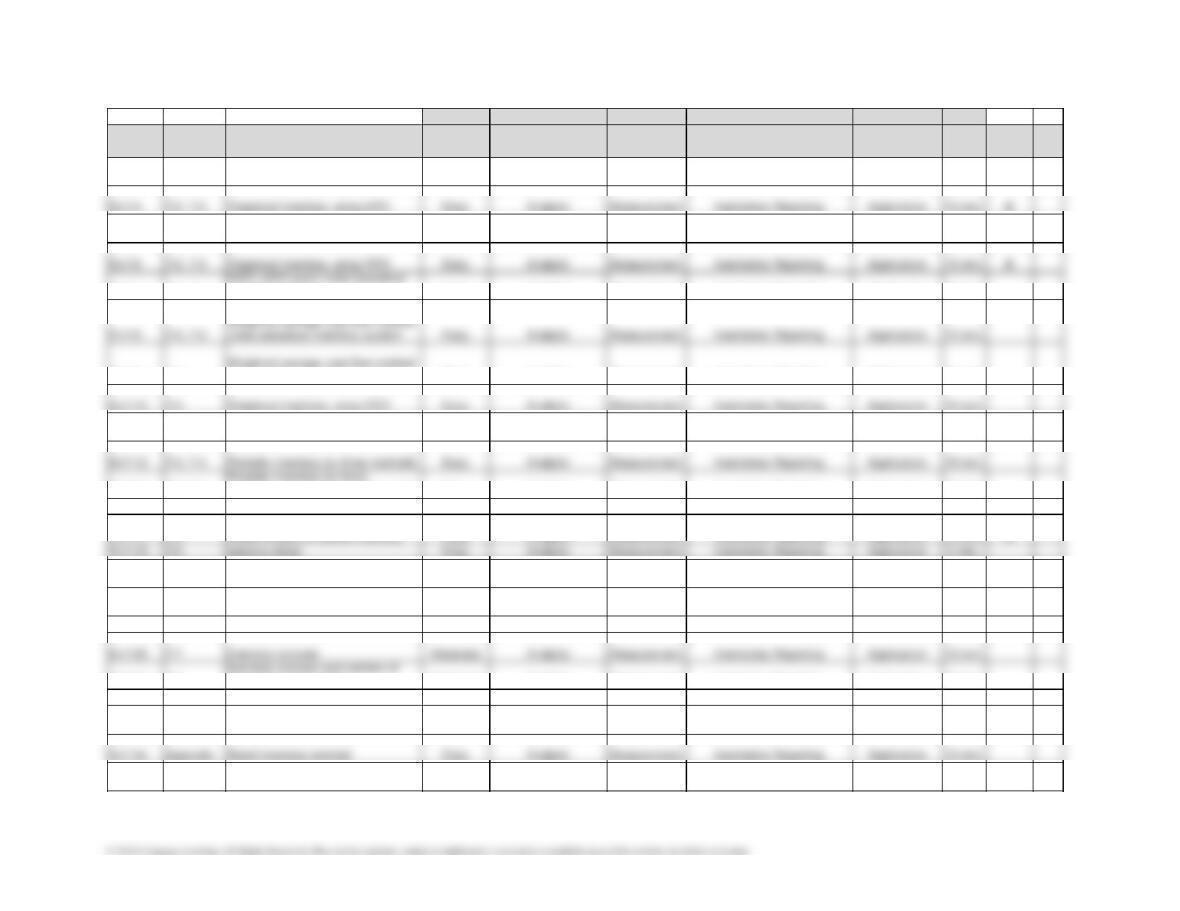
Ex7-3 7-2, 7-3 Perpetual inventory using FIFO Easy Analytic Measurement Inventories Reporting Application 15 min.
Ex7-4 7-2, 7-3 Perpetual inventory using LIFO Easy Analytic Measurement Inventories Reporting Application 15 min. X
Ex7-5 7-2, 7-3 Perpetual inventory using LIFO Easy Analytic Measurement Inventories Reporting Application 15 min. x
Ex7-6 7-2, 7-3 Perpetual inventory using FIFO Easy Analytic Measurement Inventories Reporting Application 15 min. X
Ex7-7 7-2, 7-3
inventory system
Easy Analytic Measurement Inventories Reporting Application 15 min.
Ex7-8 7-2, 7-3
under perpetual inventory system
Easy Analytic Measurement Inventories Reporting Application 15 min.
Ex7-9 7-3
under perpetual inventory system
Easy Analytic Measurement Inventories Reporting Application 15 min.
Ex7-10 7-3 Perpetual inventory using FIFO Easy Analytic Measurement Inventories Reporting Application 15 min.
Ex7-11 7-3 Perpetual inventory using LIFO Easy Analytic Measurement Inventories Reporting Application 15 min.
Ex7-12 7-2, 7-4 Periodic inventory by three methods Easy Analytic Measurement Inventories Reporting Application 15 min.
Ex7-13 7-2, 7-4
methods; cost of merchandise sold
Easy Analytic Measurement Inventories Reporting Application 20 min.
Ex7-14 7-5 Comparing inventory methods Easy Analytic Measurement Inventories Reporting Application 5 min.
Ex7-15 7-6 Lower-of-cost-or-market inventory Easy Analytic Measurement Inventories Reporting Application 10 min. X
balance sheet
Easy Analytic Measurement Inventories Reporting Application 5 min.
Ex7-17 7-6 Effect of errors in physical inventory Easy Analytic Measurement Inventories Reporting Application 5 min.
Ex7-18 7-6 Effect of errors in physical inventory Easy Analytic Measurement Inventories Reporting Application 5 min.
Ex7-19 7-6 Error in inventory Moderate Analytic Measurement Inventories Reporting Application 5 min.
Ex7-20 7-7 Inventory turnover Moderate Analytic Measurement Inventories Reporting Application 10 min.
Ex7-21 7-7
days’sales in inventory
Moderate Analytic Measurement Inventories Reporting Application 15 min.
Ex7-22 Appendix Retail inventory method Easy Analytic Measurement Inventories Reporting Application 5 min.
Ex7-23 Appendix Retail Inventory method Easy Analytic Measurement Inventories Reporting Application 10 min.
Ex7-25 Appendix Retail inventory method Easy Analytic Measurement Inventories Reporting Application 10 min. X
DIFFICULTY BUSPROG AICPA ACBSP BLOOM’S TIME
Problem
Learning
Objective
Description Primary Functional Primary
Spread-
sheet
GL
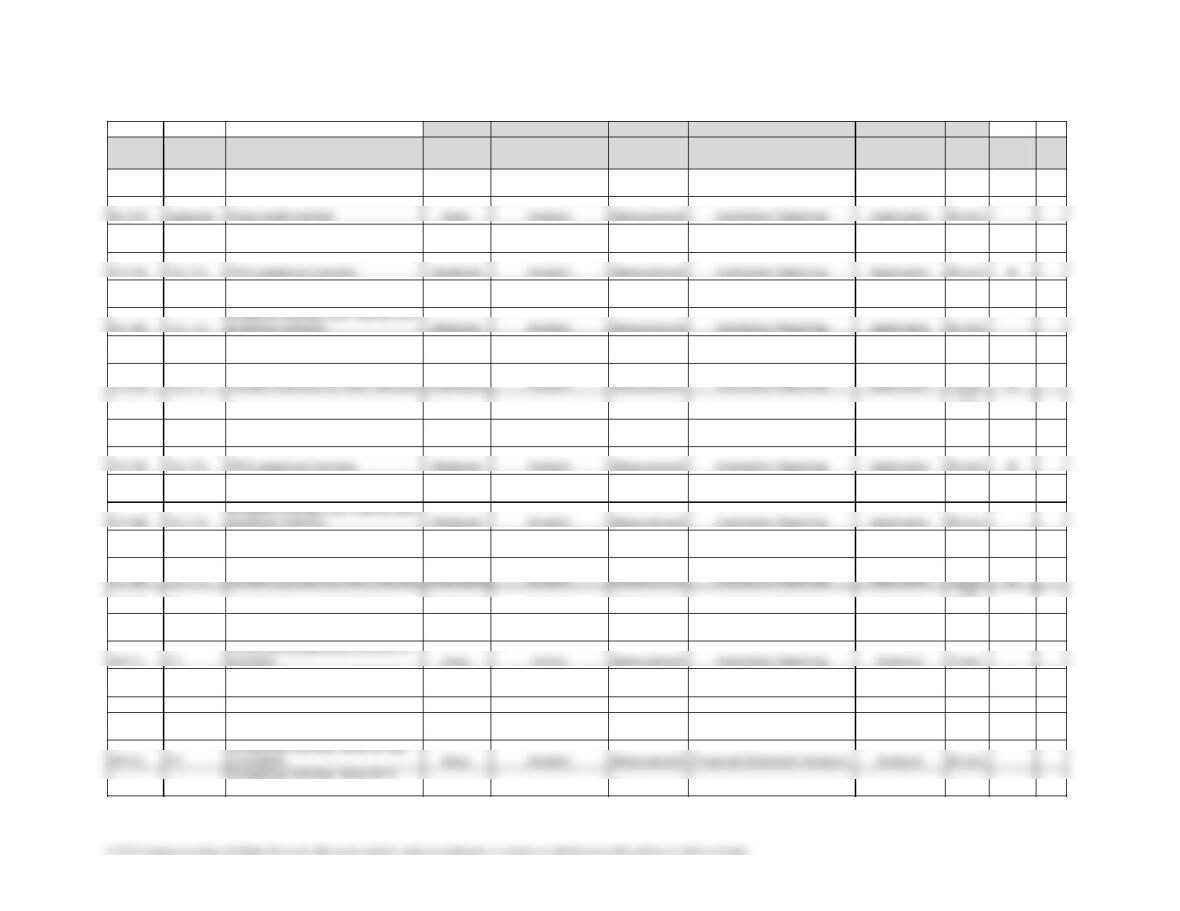
Ex7-26 Appendix Gross profit inventory method Easy Analytic Measurement Inventories Reporting Application 10 min.
Ex7-27 Appendix Gross profit method Easy Analytic Measurement Inventories Reporting Application 10 min.
Ex7-28 Appendix Gross profit method Easy Analytic Measurement Inventories Reporting Application 10 min.
Pr7-1A 7-2, 7-3 FIFO perpetual inventory Moderate Analytic Measurement Inventories Reporting Application 45 min. X
Pr7-2A 7-2, 7-3 LIFO perpetual inventory Moderate Analytic Measurement Inventories Reporting Application 45 min. X
Pr7-3A 7-2, 7-3
Pr7-4A 7-2, 7-3 Periodic inventory by three methods Moderate Analytic Measurement Inventories Reporting Application 1 hour
Pr7-5A 7-2, 7-4 Periodic inventory by three methods Challenging Analytic Measurement Inventories Reporting Application
1.5
Pr7-6A 7-6 Lower-of-cost-or-market inventory Challenging Analytic Measurement Inventories Reporting Application
hours
Pr7-7A Appendix Retail method; gross profit method Challenging Analytic Measurement Inventories Reporting Application
1.5
hours
Pr7-1B 7-2, 7-3 FIFO perpetual inventory Moderate Analytic Measurement Inventories Reporting Application 45 min. X
Pr7-2B 7-2, 7-3 LIFO perpetual inventory Moderate Analytic Measurement Inventories Reporting Application 45 min. X
Pr7-3B 7-2, 7-3
Pr7-4B 7-2, 7-3 Periodic inventory by three methods Moderate Analytic Measurement Inventories Reporting Application 1 hour
Pr7-5B 7-2, 7-4 Periodic inventory by three methods Challenging Analytic Measurement Inventories Reporting Application
hours
1.5
Pr7-6B 7-6 Lower-of-cost-or-market inventory Challenging Analytic Measurement Inventories Reporting Application
hours
Pr7-7B Appendix Retail method; gross profit method Challenging Analytic Measurement Inventories Reporting Application
1.5
hours
CP7-2 7-3, 7-4 LIFO and inventory flow Easy Analytic Measurement Inventories Reporting Comprehension 10 min.
CP7-3 7-3, 7-4 Costing inventory Challenging Analytic Measurement Inventories Reporting Application 1 hour
CP7-4 7-7 Inventory ratios for Dell and HP Moderate Analytic Measurement Financial Statement Analysis Analysis 30 min.
CP7-6 7-7
companies
Moderate Analytic Measurement Financial Statement Analysis Analysis 15 min.