CHAPTER 7 Inventories
Prob. 7-2B (Concluded)
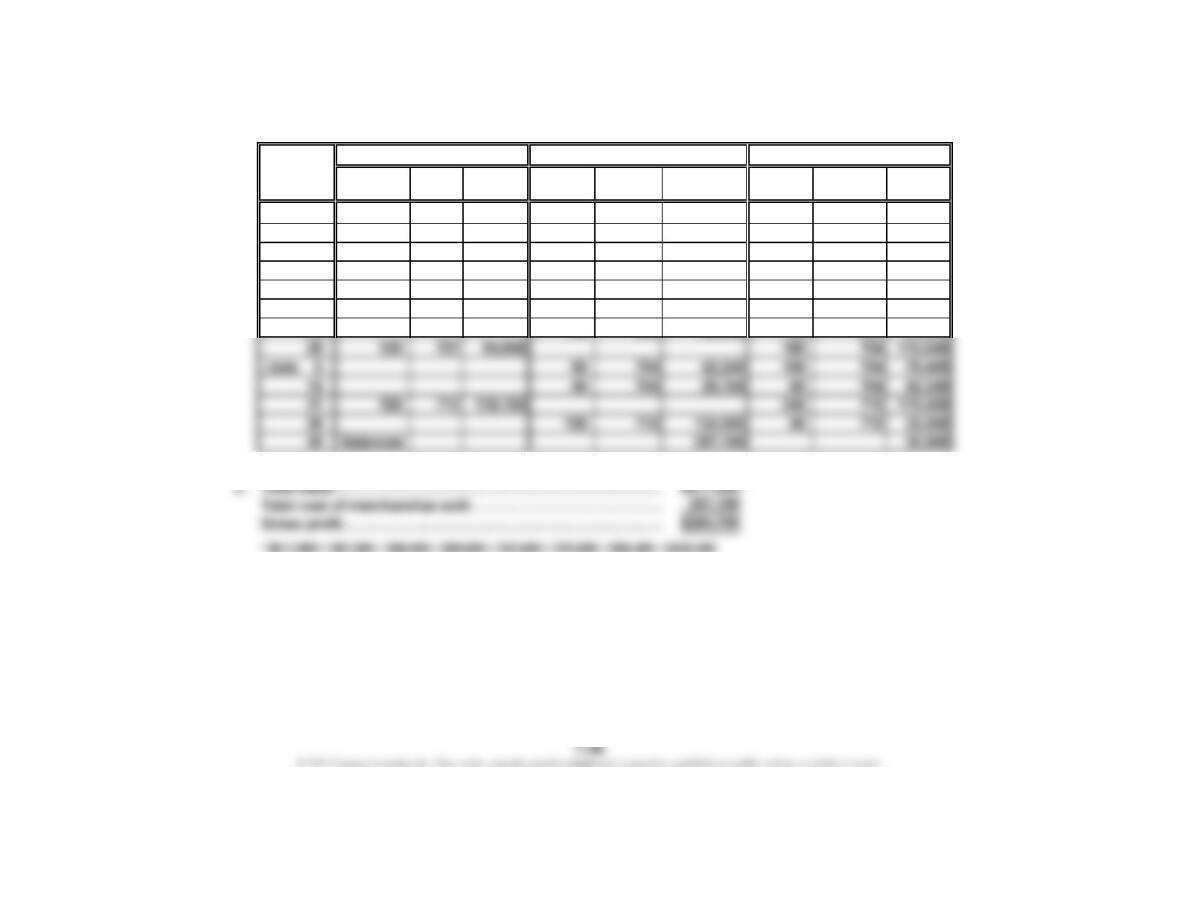
2. Total sales………………………………………………………………………
…
$611,800
Total cost of merchandise sold……………………………………………
…
358,730
Gross profit……………………………………………………………………
…
$253,070
*
CHAPTER 7 Inventories
Prob. 7-3B
1.
Unit Total Total Total
Quantity Cost Cost Quantity Unit Cost Cost Quantity Unit Cost Cost
Apr. 3 40 670 26,800
8 120 690 82,800 160 685 109,600
11 60 685 41,100 100 685 68,500
30 50 685 34,250 50 685 34,250
May 8 100 700 70,000 150 695 104,250
10 80 695 55,600 70 695 48,650
3. $35,500 (50 units × $710)
Date
Purchases Cost of Merchandise Sold Inventory
CHAPTER 7 Inventories
Prob. 7-4B
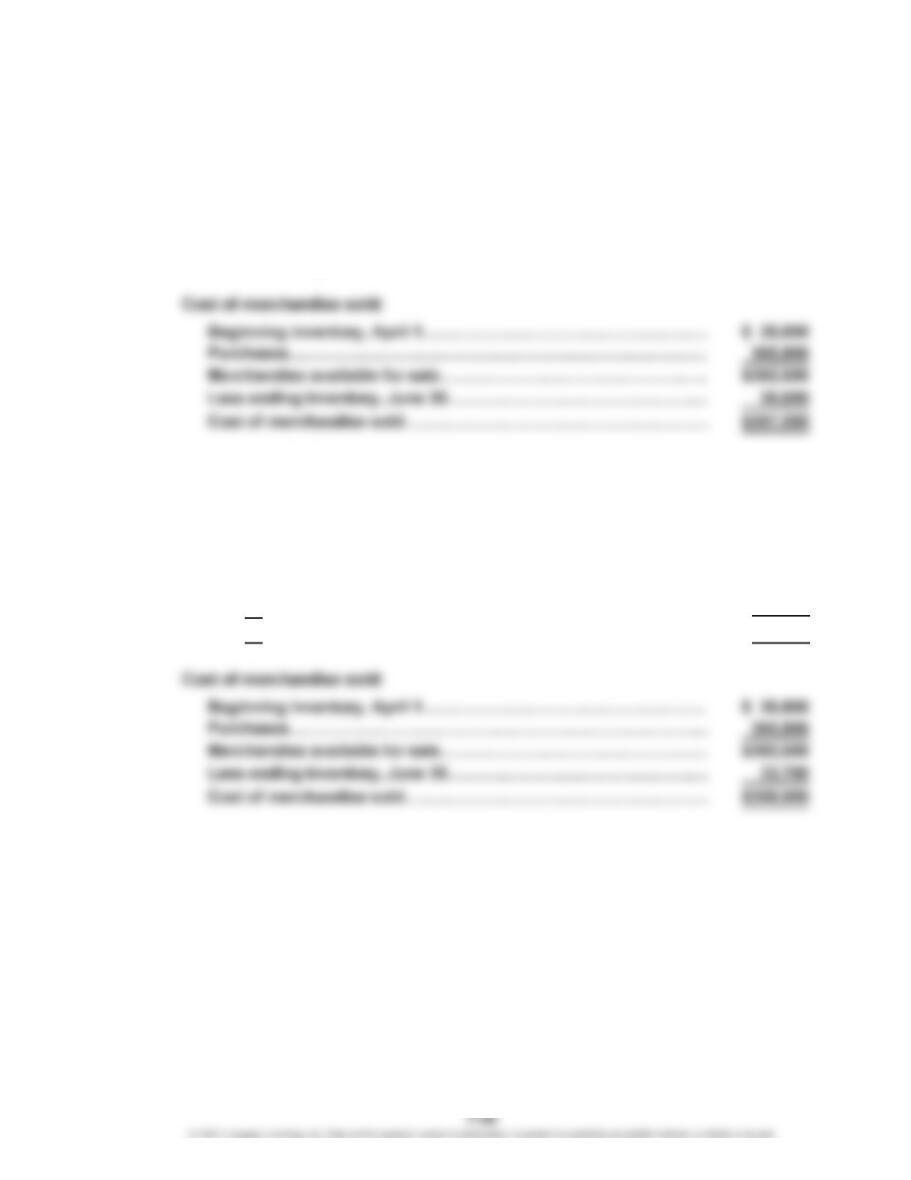
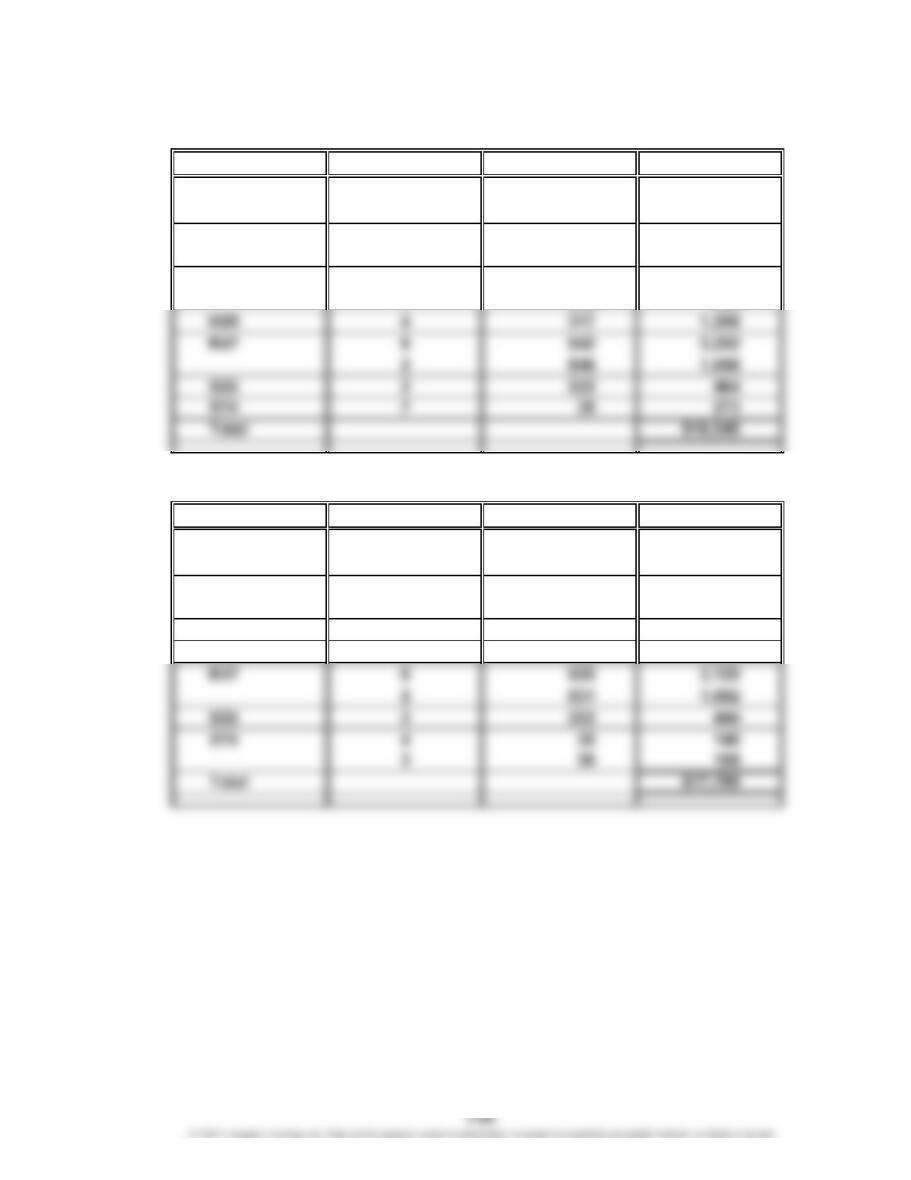
1. First-In, First-Out Method
Merchandise inventory, June 30……………………………………….
…
$ 35,600
Cost of merchandise sold………………………………………..………
…
357,000
Supporting computations
Merchandise inventory:
50 units @ $712………………………………………………………
…
$ 35,600
2. Last-In, First-Out Method
Merchandise inventory, June 30………………………………………… $ 33,700
Cost of merchandise sold…………………………………….…………
…
358,900
Supporting computations
Merchandise inventory:
40 units @ $670………………………………………………………
…
$26,800
10 unit @ $690………………………………………………………
…
6,900
50 units………………………………………………………………… $33,700
…
…
…
CHAPTER 7 Inventories
Prob. 7-4B (Continued)
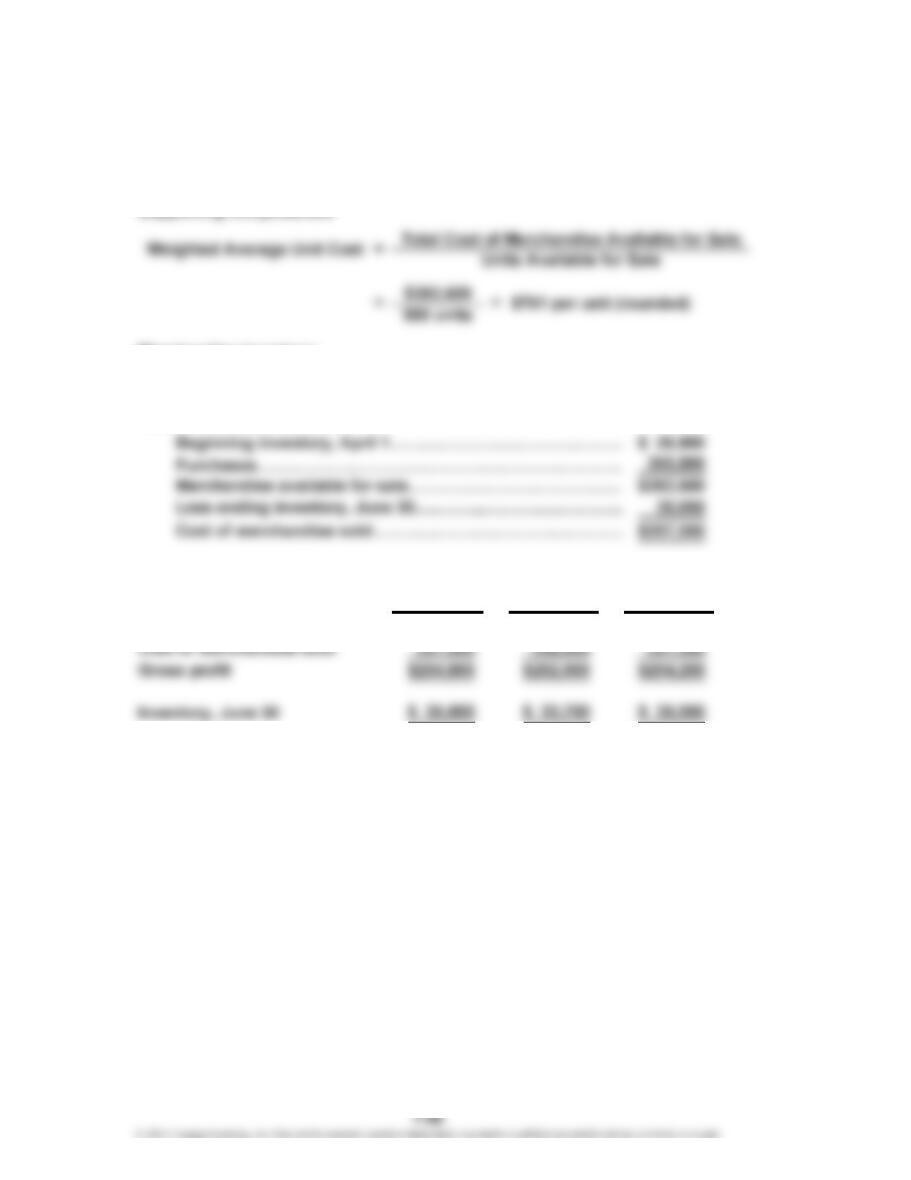
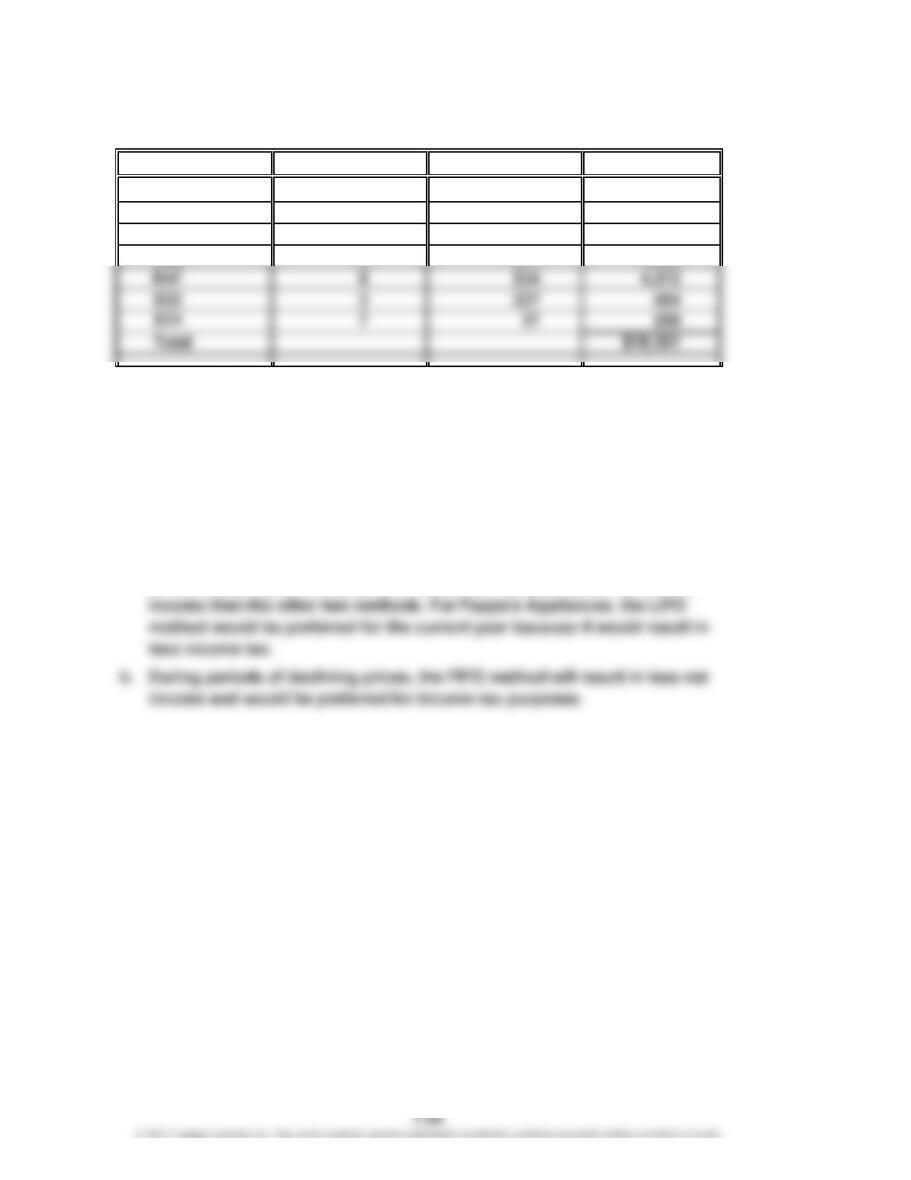
3. Weighted Average Cost Method
Merchandise inventory, June 30………………………………
…
$ 35,050
Cost of merchandise sold………………………………………
…
357,550
Merchandise inventory:
50 units × $701 = $35,050 (rounded)
Cost of merchandise sold:
…
4. Weighted
FIFO LIFO Average
Sales $611,800 $611,800 $611,800
CHAPTER 7 Inventories
Prob. 7-5B
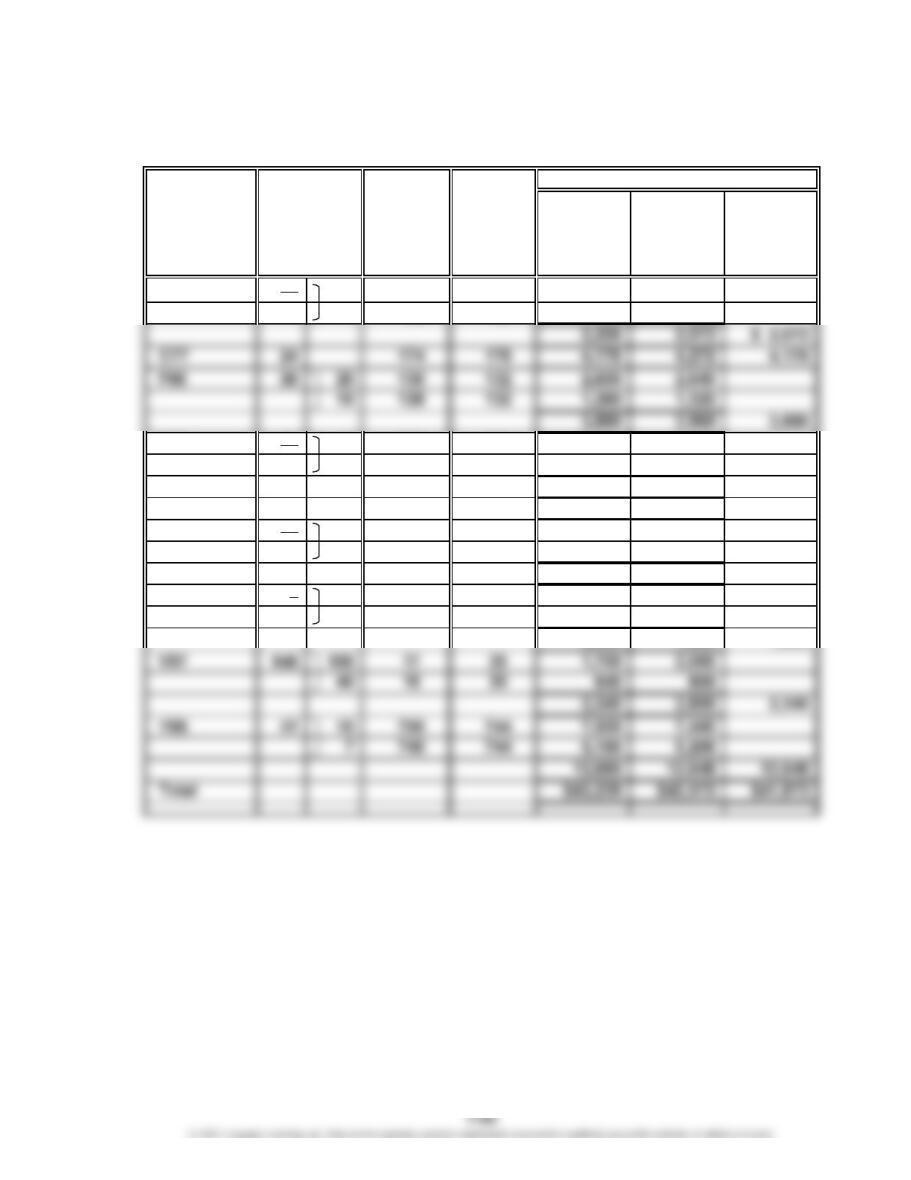
1. First-In, First-Out Method
Model Quantity Unit Cost Total Cost
C55 3 $1,070 $ 3,210
1 1,060 1,060
D11 6 675 4,050
5 666 3,330
F32 1 280 280
2. Last-In, First-Out Method
Model Quantity Unit Cost Total Cost
C55 3 $1,040 $ 3,120
1 1,054 1,054
D11 9 639 5,751
2 645 1,290
F32 2 240 480
H29 4 305 1,220
CHAPTER 7 Inventories
Prob. 7-5B (Concluded)
3. Weighted Average Cost Method
Quantity Unit Cost*Total Cost
4 $1,056 $ 4,224
11 654 7,194
2 252 504
*Computations of unit costs:
C55: $1,056 = [(3 × $1,040) + (3 × $1,054) + (3 × $1,060) + (3 × $1,070)] ÷ (3 + 3 + 3 + 3)
D11: $654 = [(9 × $639) + (7 × $645) + (6 × $666) + (6 × $675)] ÷ (9 + 7 + 6 + 6)
F32: $252 = [(5 × $240) + (3 × $260) + (1 × $260) + (1 × $280)] ÷ (5 + 3 + 1 + 1)
H29: $311 = [(6 × $305) + (3 × $310) + (3 × $316) + (4 × $317)] ÷ (6 + 3 + 3 + 4)
K47: $534 = [(6 × $520) + (8 × $531) + (4 × $549) + (6 × $542)] ÷ (6 + 8 + 4 + 6)
S33: $227 = [(4 × $222) + (4 × $232)] ÷ (4 + 4)
X74: $37 = [(4 × $35) + (6 × $36) + (8 × $37) + (7 × $39)] ÷ (4 + 6 + 8 + 7)
4. a. During periods of rising prices, the LIFO method will result in a lower cost
of inventory, a greater amount of cost of merchandise sold, and less net
Model
C55
D11
F32
CHAPTER 7 Inventories
Prob. 7-6B
Market
Value per
Cost Unit (Net
Inventory per Realizable
Item Unit Value) Cost Market LCM
A54 37 30 $ 60 $ 56 $ 1,800 $ 1,680
7 58 56 406 392
H83 21 6 547 545 3,282 3,270
15 540 545 8,100 8,175
11,382 11,445 11,382
K12 375 6 5 2,250 1,875 1,875
Q58 90 75 25 18 1,875 1,350
15 26 18 390 270
2,265 1,620 1,620
S36 8 5 256 235 1,280 1,175
3 260 235 780 705
Quantity
Inventory Sheet
December 31
Inventory
Total
CHAPTER 7 Inventories
Appendix Prob. 7-7B
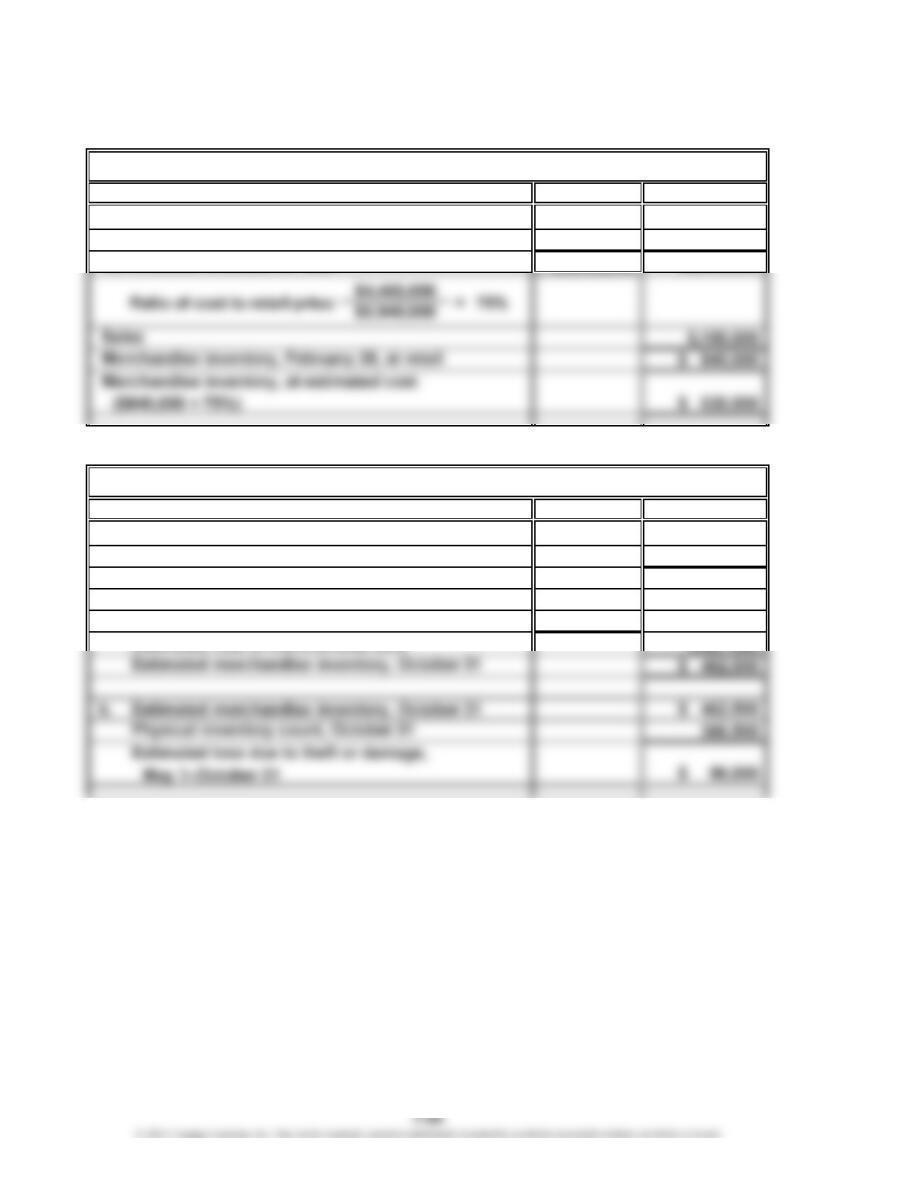
1.
Cost Retail
Merchandise inventory, February 1 $ 400,000 $ 615,000
Net purchases 4,055,000 5,325,000
Merchandise available for sale $4,455,000 $5,940,000
2.
Cost
a. Merchandise inventory, May 1 $ 400,000
Net purchases 3,150,000
Merchandise available for sale $3,550,000
Sales $4,750,000
Less estimated gross profit ($4,750,000 × 35%) 1,662,500
Jaffe Co.
Coronado Co.
CHAPTER 7 Inventories
CP 7-1
1. In the short run, Sizemo Electroniks may benefit slightly from the inflated inventory
values and higher earnings. However, at some point in the future, the inventory
2. The users of Sizemo’s financial statements are harmed by this decision, as it does
not result in financial statements that fairly present the company’s financial results.
3. No. Tina is acting unethically by instructing Jay to ignore a lower-of-cost-or-market
adjustment intentionally. As Jay’s supervisor, Tina has a responsibility to ensure
her employees behave ethically and apply GAAP correctly. Jay is behaving
unethically by knowingly applying GAAP incorrectly. He should have reported the
incident to Tina’s supervisor.
CP 7-2
Because the title to merchandise shipped FOB shipping point passes to the buyer
when the merchandise is shipped, the shipments made before midnight, October 31,
CASES & PROJECTS
CHAPTER 7 Inventories
CP 7-3
A sample solution based on Nike Inc.’s Form 10-K for the fiscal year ended May 31,
2018, follows:
1. a. Inventory costs consist primarily of product cost from the company’s suppliers,
as well as inbound freight, import duties, taxes, insurance and logistics, and
other handling fees.
b. Inventories are stated at lower of cost and net realizable value, and valued on
either an average or specific identification cost basis.
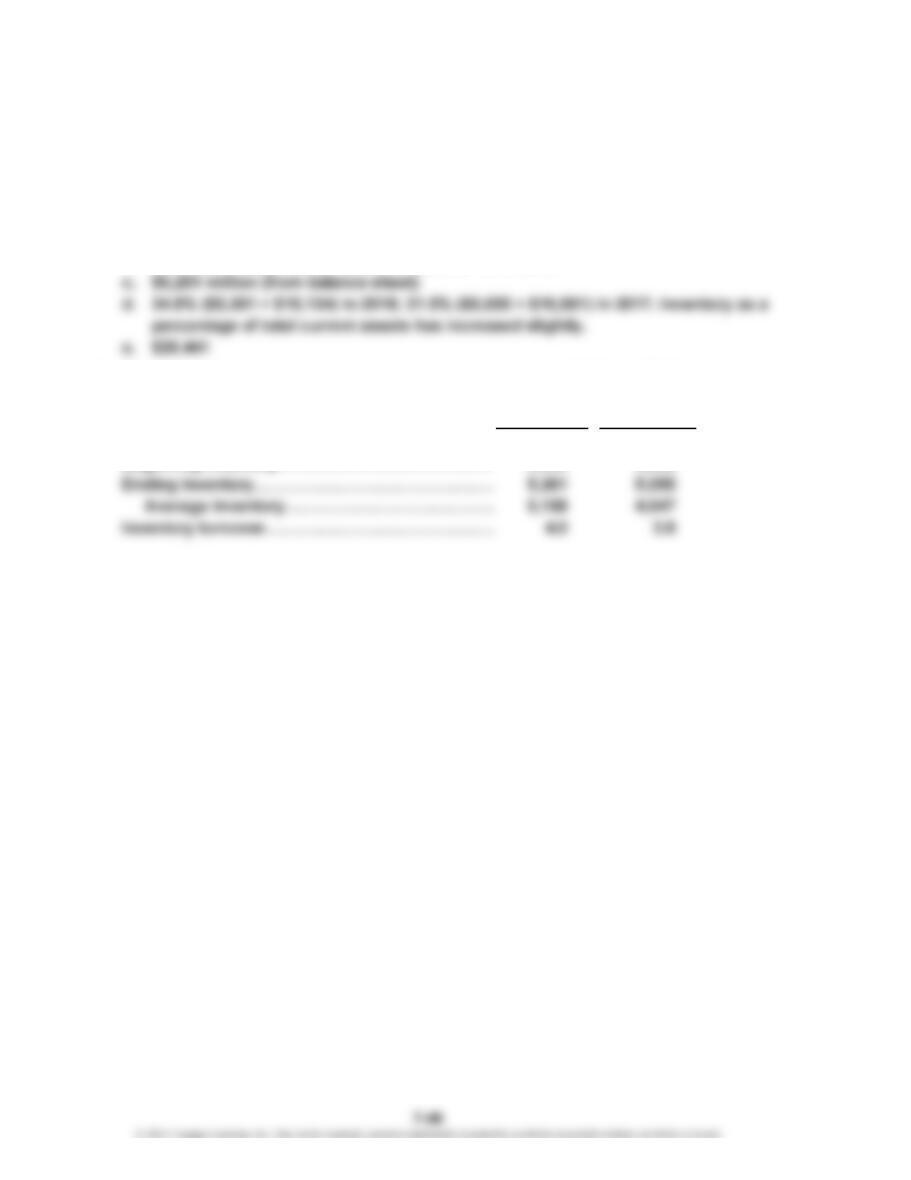
2. The company’s inventory turnover has improved between 2017 and 2018.
2018 2017
Cost of merchandise sold…………………………… $20,441 $19,038
CP 7-4
Memo
To: Ms. Connie Kilmer
President, Golden Eagle Company
From: A+ Student
Re: Comparison of LIFO and FIFO inventory methods
LIFO and FIFO are alternative methods of applying unit cost to the units that are sold
during the year and those units that remain in ending inventory at the end of the
year. The LIFO method is often viewed as the best basis for reflecting income from
operations. This is because the LIFO method matches the most current cost of
During periods of rising prices, such as for Golden Eagle Company, the LIFO method
will also result in less net income than FIFO. Because taxes are levied as a
percentage of net income, Golden Eagle Company would pay a lower income tax
under the LIFO method.
While the LIFO method is often viewed as the best method for matching revenues and
expenses, the FIFO method is often consistent with the physical movement of
merchandise in a business, since most businesses tend to dispose of commodities in
the order of their acquisition. To the extent that this is the case, the FIFO method
approximates the results that will be attained by a specific identification of costs.
CHAPTER 7 Inventories
CP 7-4 (Concluded)
Supporting computations:
The cost of ending inventory under the last-in, first-out and first-in, first-out methods
is as follows:
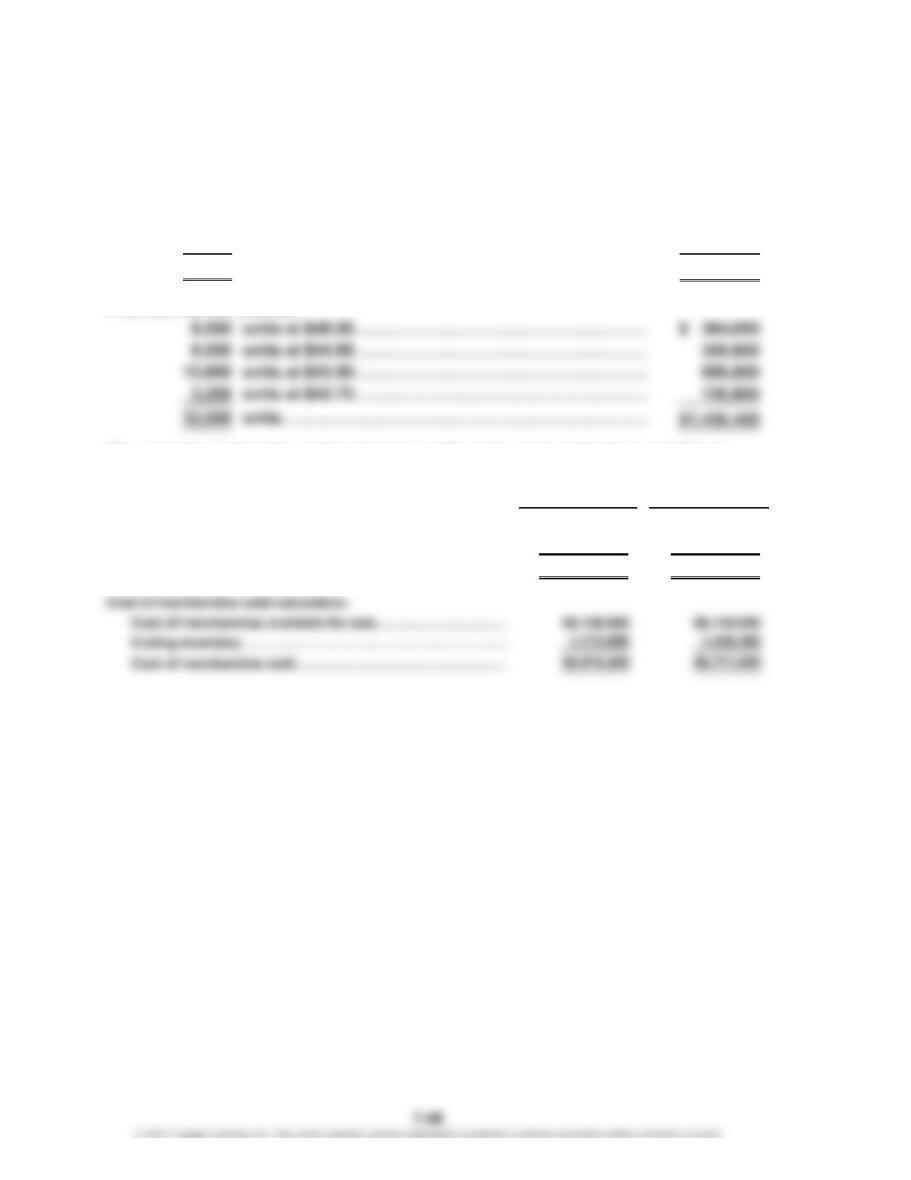
Last-in, first-out method:
31,000 units at $36.60………………………………………………
…
$1,134,600
1,000 units at $39.00………………………………………………
…
39,000
32,000 units…………………………………………………………
…
$1,173,600
The cost of merchandise sold and gross profit under each method are as follows:
FIFO LIFO
Sales…………………………………………………………
.
$10,000,000 $10,000,000
Cost of merchandise sold (see below)………………
…
6,974,400 6,711,600
Gross profit………………………………………………… $ 3,025,600 $ 3,288,400
…
…
…
…
…
CHAPTER 7 Inventories
CP 7-5
In developing a response to Paula’s concerns, you should probably emphasize
the practical need for an assumption concerning the flow of cost of merchandise
purchased and sold. That is, when identical goods are frequently purchased, it may
not be practical to specifically identify each item of inventory. If all the identical goods
were purchased at the same price, it wouldn’t make any difference for financial
reporting purposes which goods Musick Foods assumed were sold first, second, etc.
However, in most cases, goods are purchased over time at different prices, and hence,
a need arises to determine which goods are sold so that the price (cost) of those
CHAPTER 7 Inventories
CP 7-6
a. Target Corp.
b. Target Corp.
Amazon.com
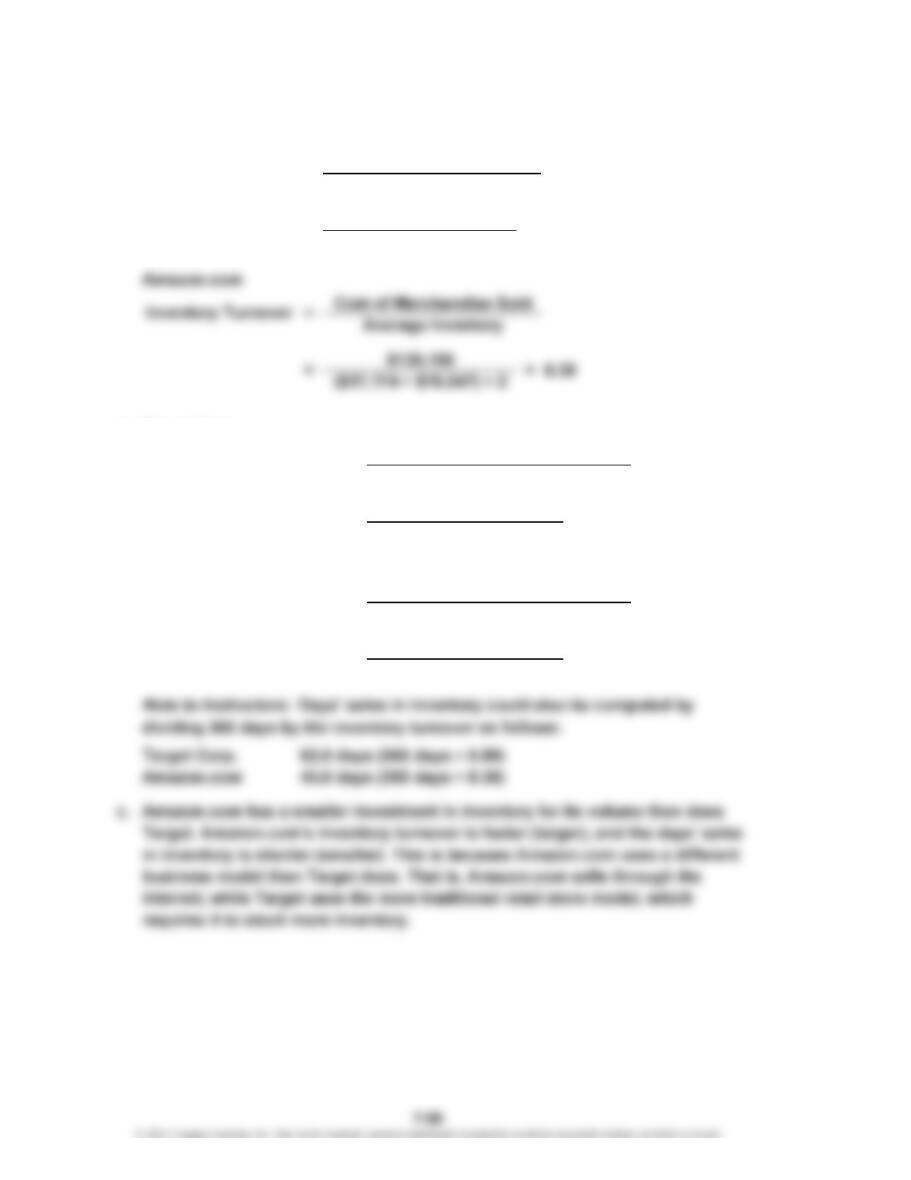
=Inventory Turnover Cost of Merchandise Sold
Average Inventory
5.89= $53,299
($9,497 + $8,597) ÷ 2 =
=Days’ Sales in Inventory
Average Inventory
Cost of Merchandise Sold ÷ 365
62.0 days
($9,497 + $8,597) ÷ 2
$53,299 ÷ 365
=($17,174 + $16,047) ÷ 2 = 43.6 days
$139,156 ÷ 365
==
Days’ Sales in Inventory = Average Inventory
Cost of Merchandise Sold ÷ 365
CHAPTER 7 Inventories
CP 7-7
a.
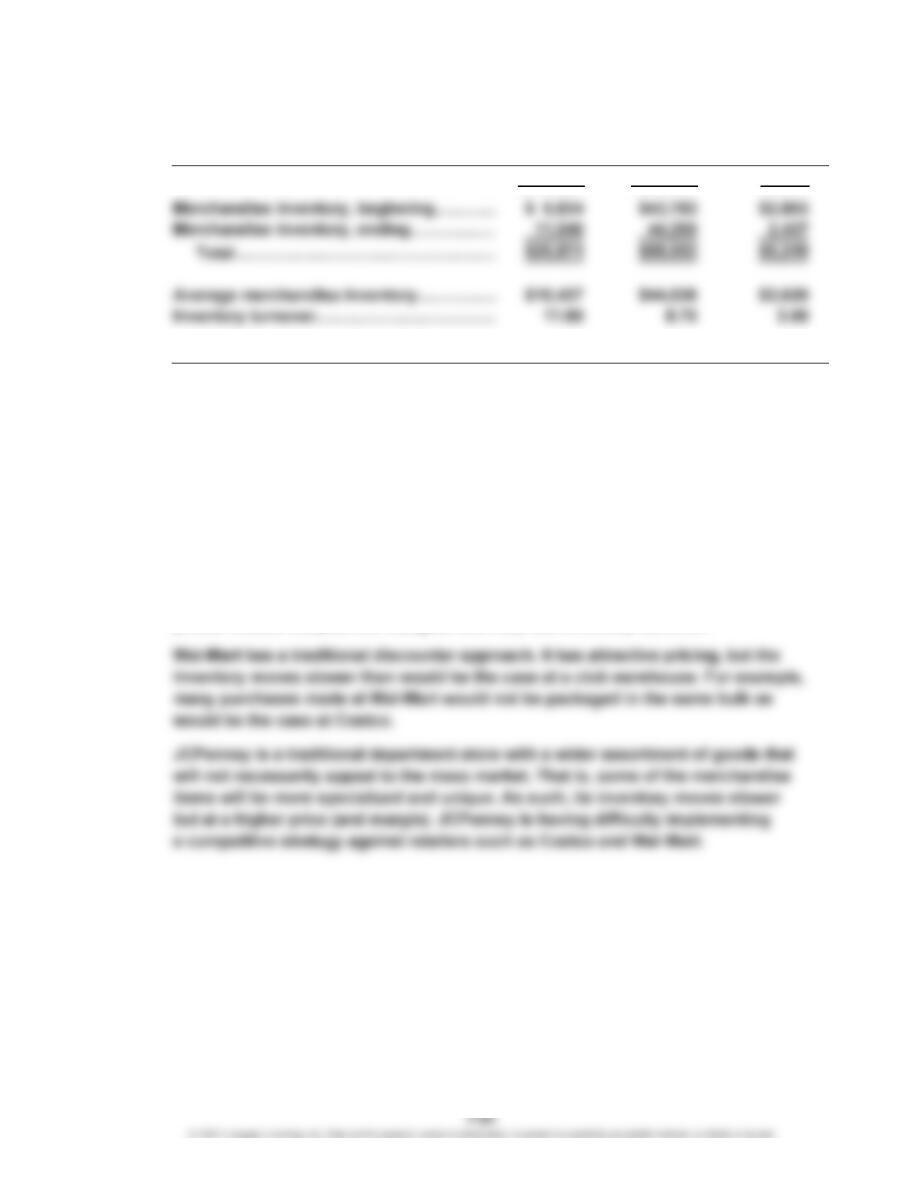
Costco Wal-Mart JCPenney
Cost of merchandise sold………………………. $123,152 $385,301 $7,870
b. Costco Wal-Mart JCPenney
Average merchandise inventory
[from part (a)]………………………………………. $10,437 $44,026 $2,620
Cost of merchandise sold………………………. $123,152 $385,301 $7,870
Average daily cost of merchandise sold….
.
$337.4 $1,055.6 $21.6
Days’ sales in inventory…………………………. 30.9 41.7 121.3
c. Both the inventory turnover ratio and the days’ sales in inventory reflect the
merchandising approaches of the three companies.
Costco is a club warehouse. Its approach is to hold only mass appeal items that are
sold quickly off the shelf. Most items are sold in bulk quantities at very attractive
prices. Costco couples thin margins with very fast inventory turnover.
.
.