CHAPTER 7 Inventories
Ex. 7-21 (Concluded)
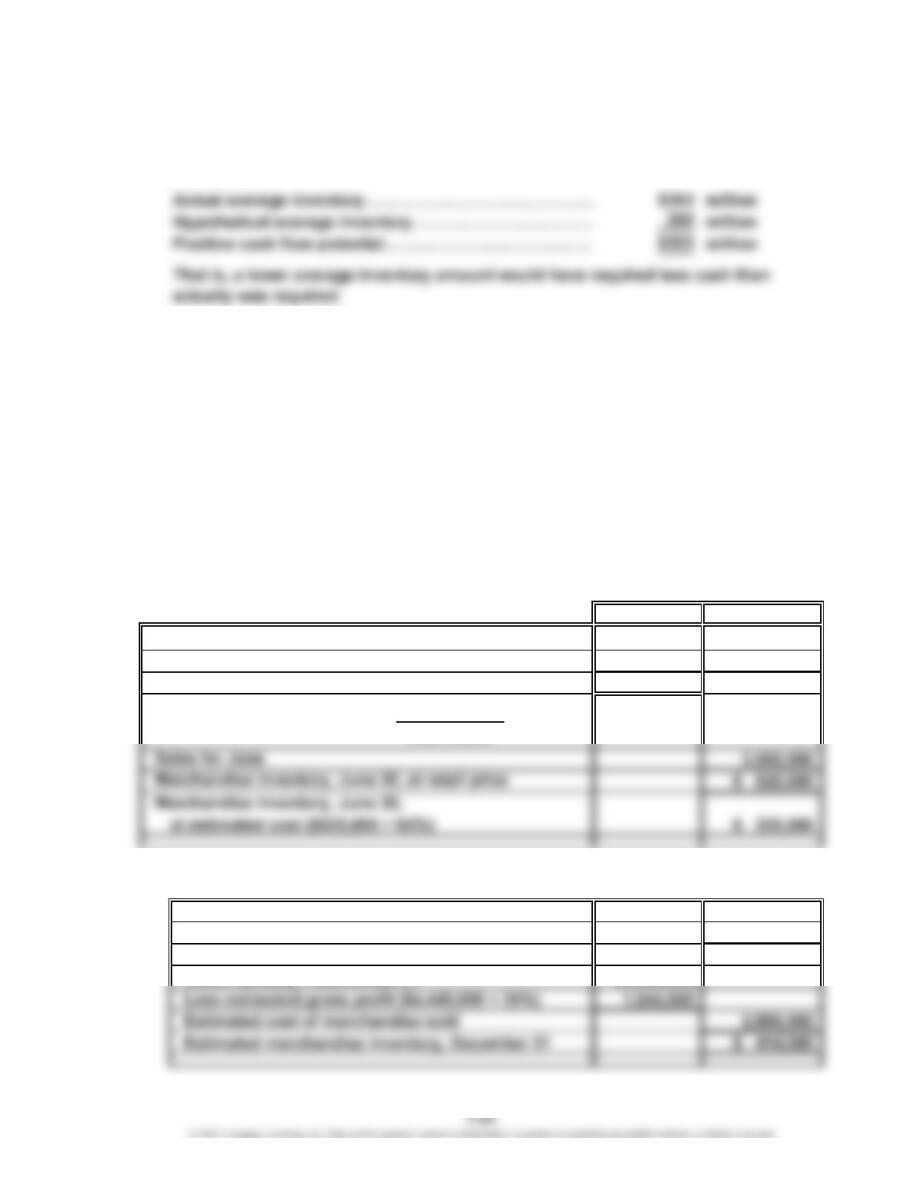
Thus, the additional cash flow that would have been generated is the difference
between the actual average inventory and the hypothetical average inventory,
as follows:
Appendix Ex. 7-22
$666,900 ($1,235,000 × 54%)
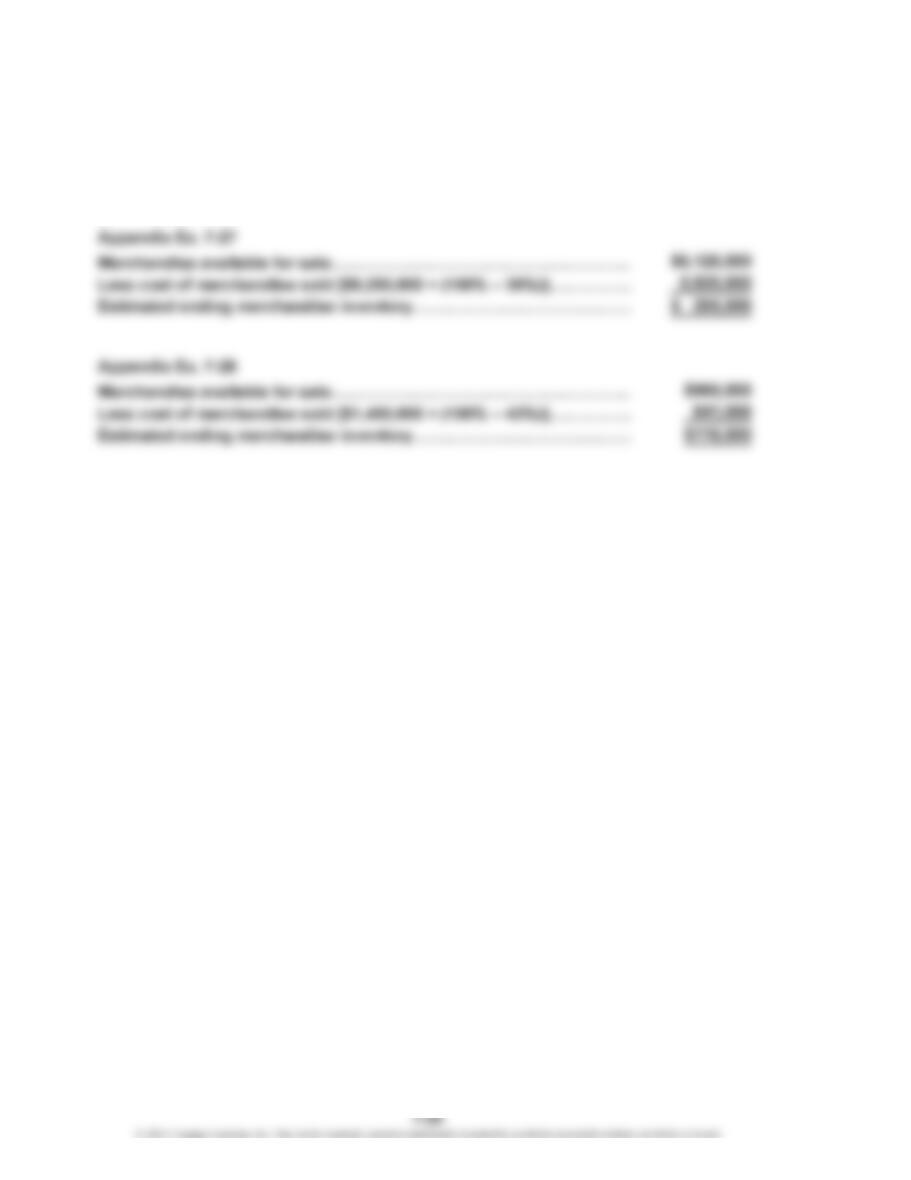
Appendix Ex. 7-23
$241,804 ($396,400 × 61%)
Appendix Ex. 7-24
$511,500 ($775,000 × 66%)
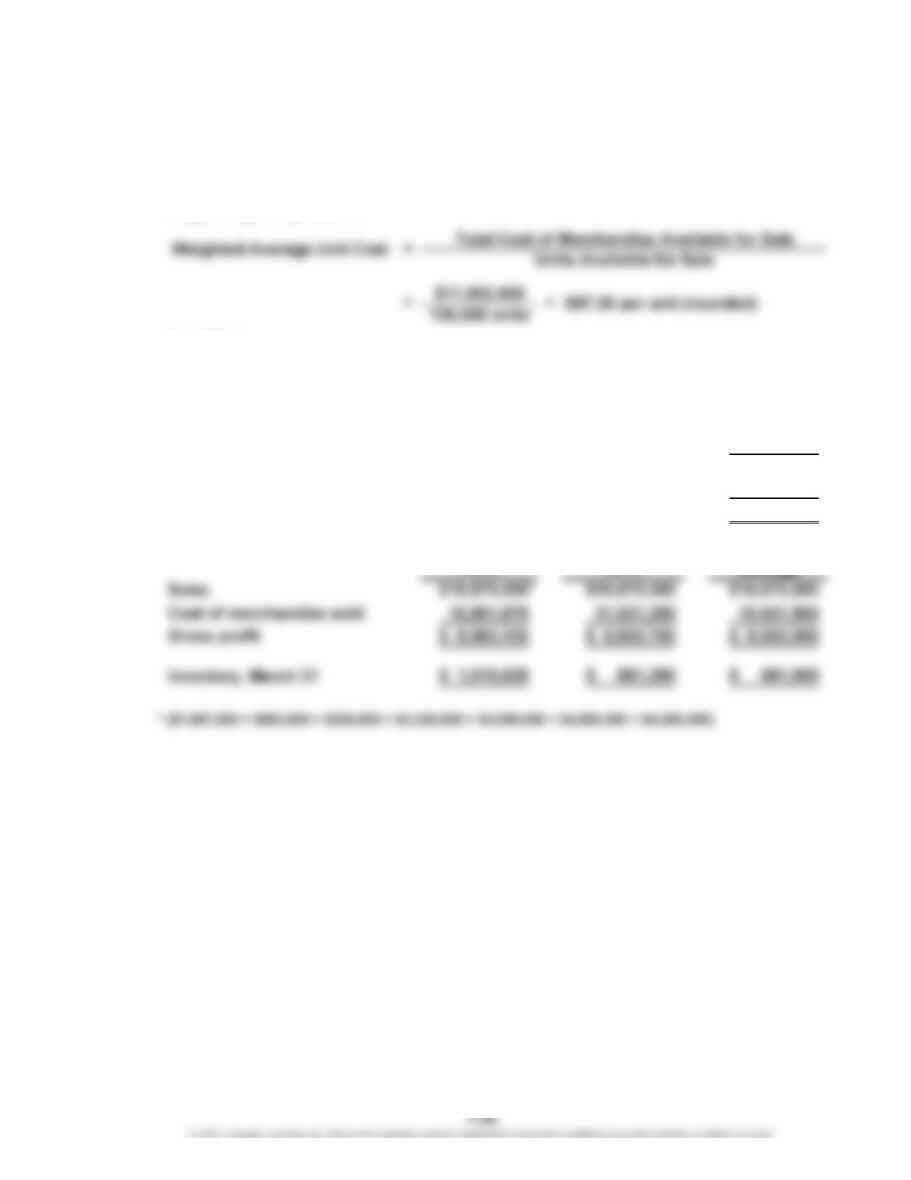
Appendix Ex. 7-25
Cost Retail
Merchandise inventory, June 1 $ 165,000 $ 275,000
Purchases in June (net) 2,361,500 3,800,000
Merchandise available for sale $2,526,500 $4,075,000
$2,526,500
Appendix Ex. 7-26
a. Merchandise inventory, January 1 $ 350,000
Purchases (net), January 1–December 31 2,950,000
Merchandise available for sale $3,300,000
Ratio of cost to retail price: = 62%
CHAPTER 7 Inventories
Appendix Ex. 7-26 (Concluded)
b. The gross profit method is useful for estimating inventories for monthly or
quarterly financial statements. It is also useful in estimating the cost of
merchandise destroyed by fire or other disasters.
CHAPTER 7 Inventories
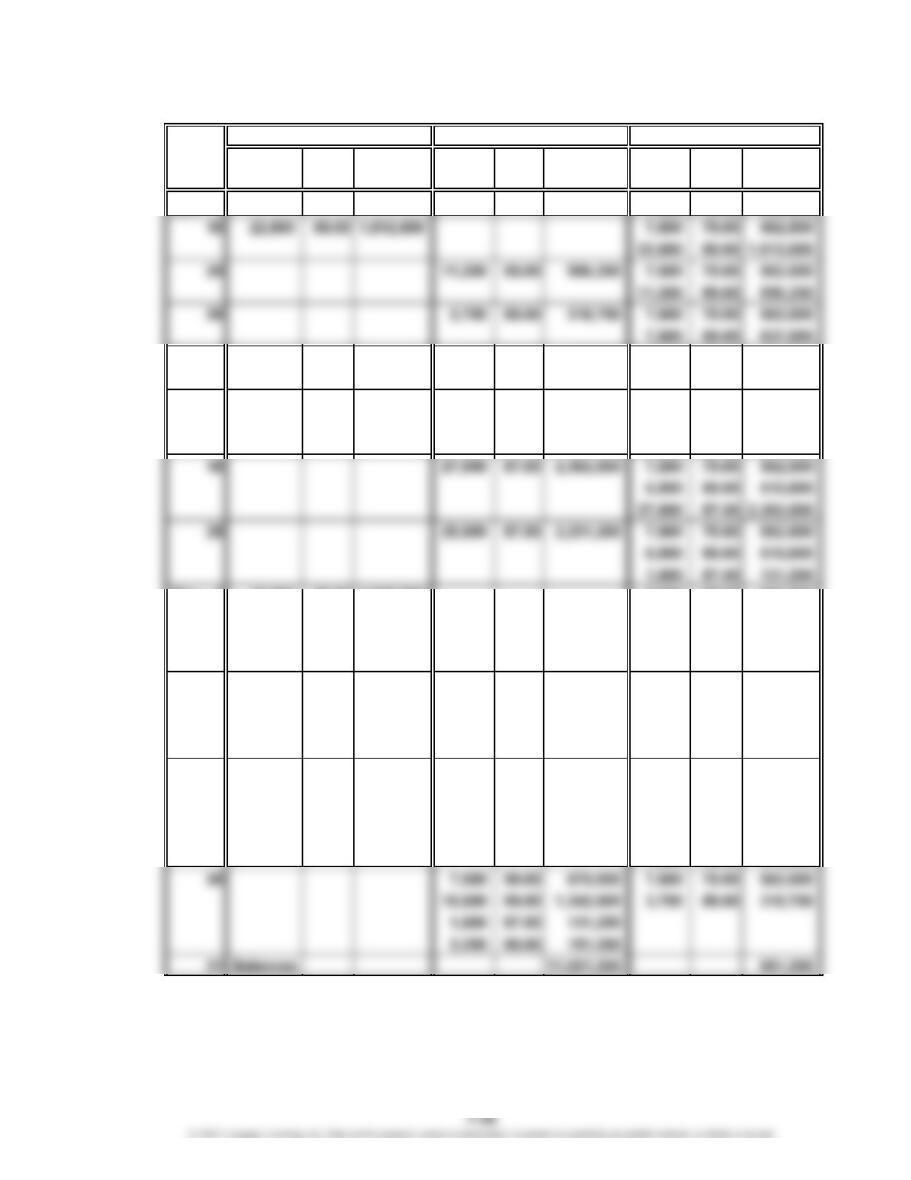
Prob. 7-1A
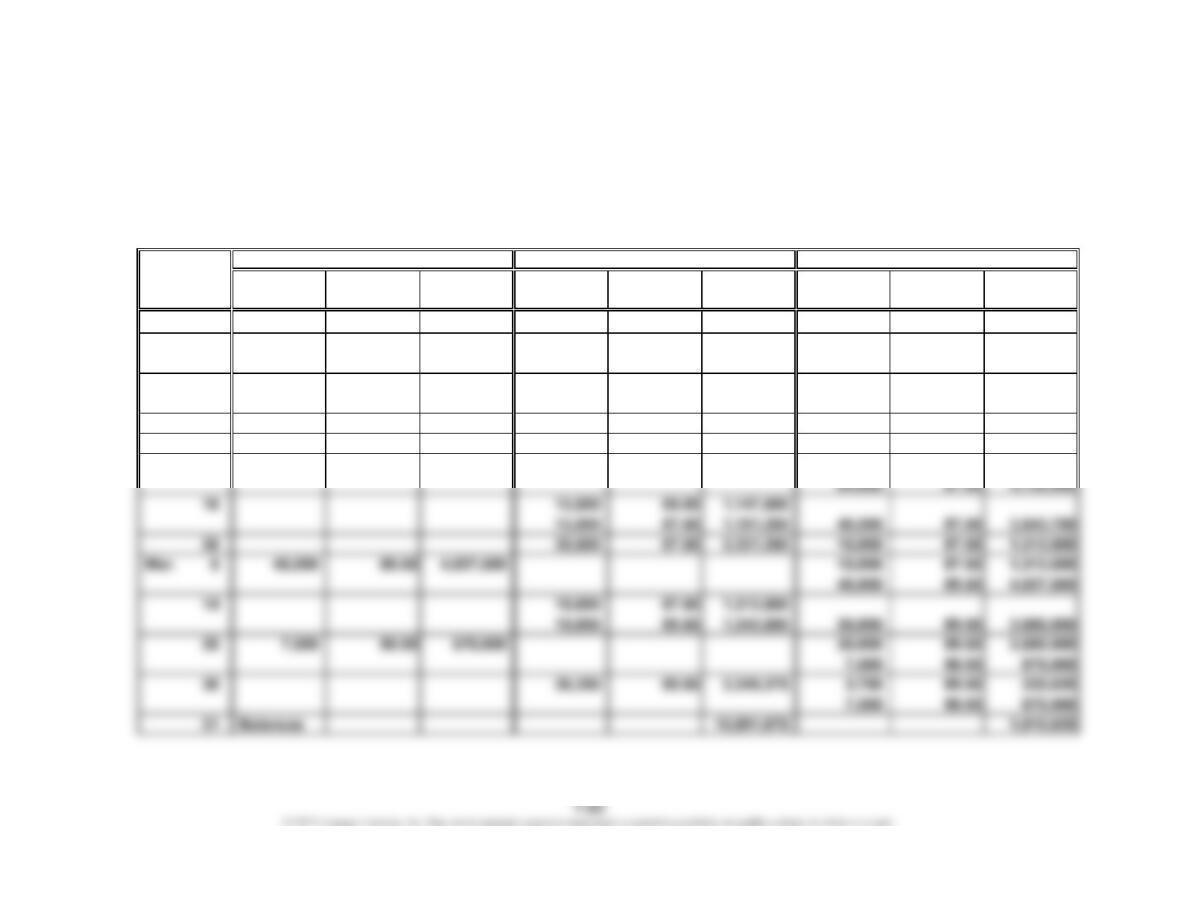
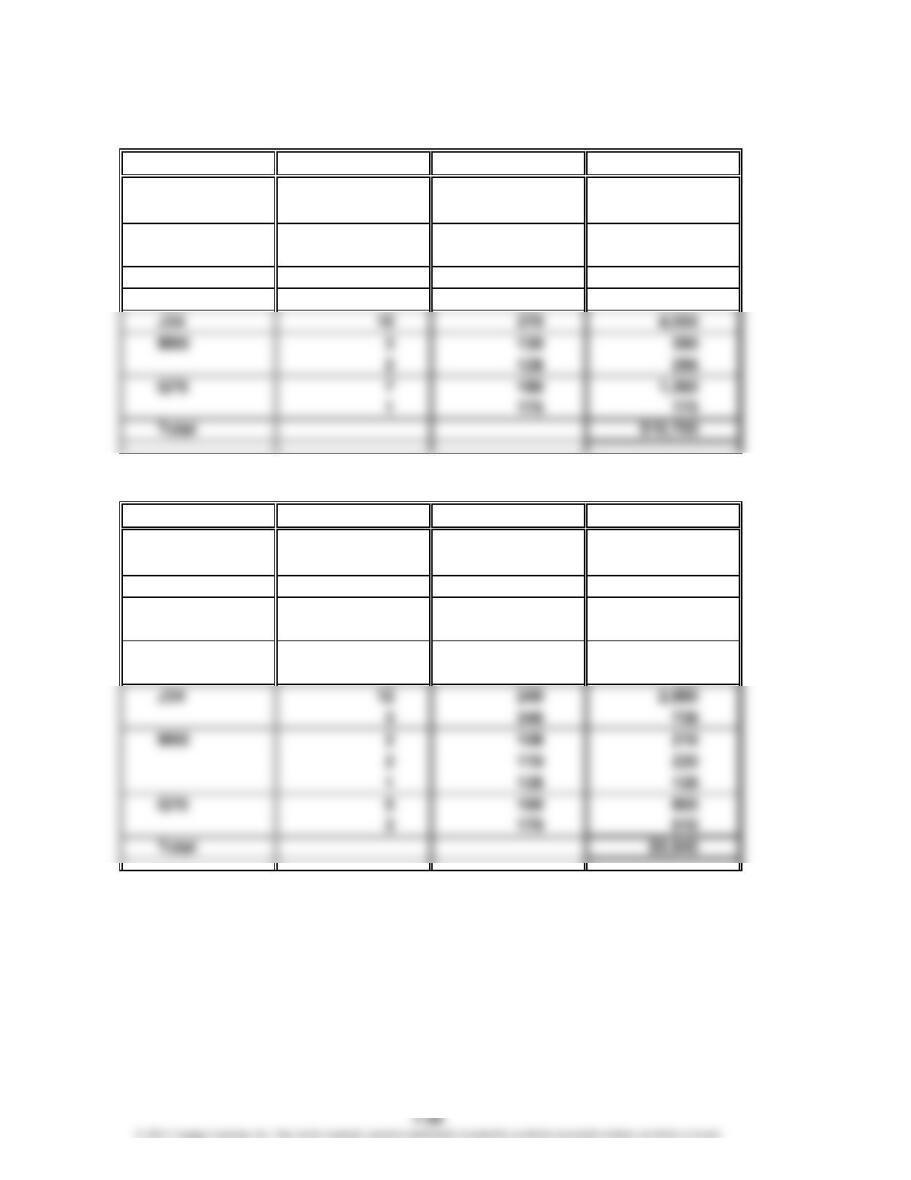
1.
Unit Total Unit Total Unit Total
Quantity Cost Cost Quantity Cost Cost Quantity Cost Cost
Jan. 1 7,500 75.00 562,500
10 22,500 85.00 1,912,500 7,500 75.00 562,500
22,500 85.00 1,912,500
28 7,500 75.00 562,500
3,750 85.00 318,750 18,750 85.00 1,593,750
30 3,750 85.00 318,750 15,000 85.00 1,275,000
Feb. 5 1,500 85.00 127,500 13,500 85.00 1,147,500
10 54,000 87.50 4,725,000 13,500 85.00 1,147,500
PROBLEMS
Date
Purchases Cost of Merchandise Sold Inventory
CHAPTER 7 Inventories
Prob. 7-1A (Concluded)
2. Accounts Receivable 19,875,000
Sales 19,875,000
Cost of Merchandise Sold 10,891,875
Merchandise Inventory 10,891,875
* $19,875,000 = $1,687,500 + $562,500 + $225,000 + $4,320,000 + $4,080,000 + $4,800,000 + $4,200,000
3. $8,983,125 ($19,875,000 – $10,891,875)
4. $1,010,625 ($335,625 + $675,000)
*
CHAPTER 7 Inventories
Prob. 7-2A
1.
Unit Total Unit Total Unit Total
Quantity Cost Cost Quantity Cost Cost Quantity Cost Cost
Feb. 5 1,500 85.00 127,500 7,500 75.00 562,500
6,000 85.00 510,000
10 54,000 87.50 4,725,000 7,500 75.00 562,500
6,000 85.00 510,000
54,000 87.50 4,725,000
Mar. 5 45,000 89.50 4,027,500 7,500 75.00 562,500
6,000 85.00 510,000
1,500 87.50 131,250
45,000 89.50 4,027,500
14 30,000 89.50 2,685,000 7,500 75.00 562,500
6,000 85.00 510,000
1,500 87.50 131,250
15,000 89.50 1,342,500
25 7,500 90.00 675,000 7,500 75.00 562,500
6,000 85.00 510,000
1,500 87.50 131,250
15,000 89.50 1,342,500
Cost of Merchandise Sold Inventory
Date
Purchases
CHAPTER 7 Inventories
Prob. 7-2A (Concluded)
2. Total sales………………………………………………………………………
…
$19,875,000
Total cost of merchandise sold………………………………………………
…
11,021,250
Gross profit………………………………………………………………………
…
$ 8,853,750
* Total Sales = $19,875,000 = $1,687,500 + $562,500 + $225,000 + $4,320,000 + $4,080,000 +
*
CHAPTER 7 Inventories
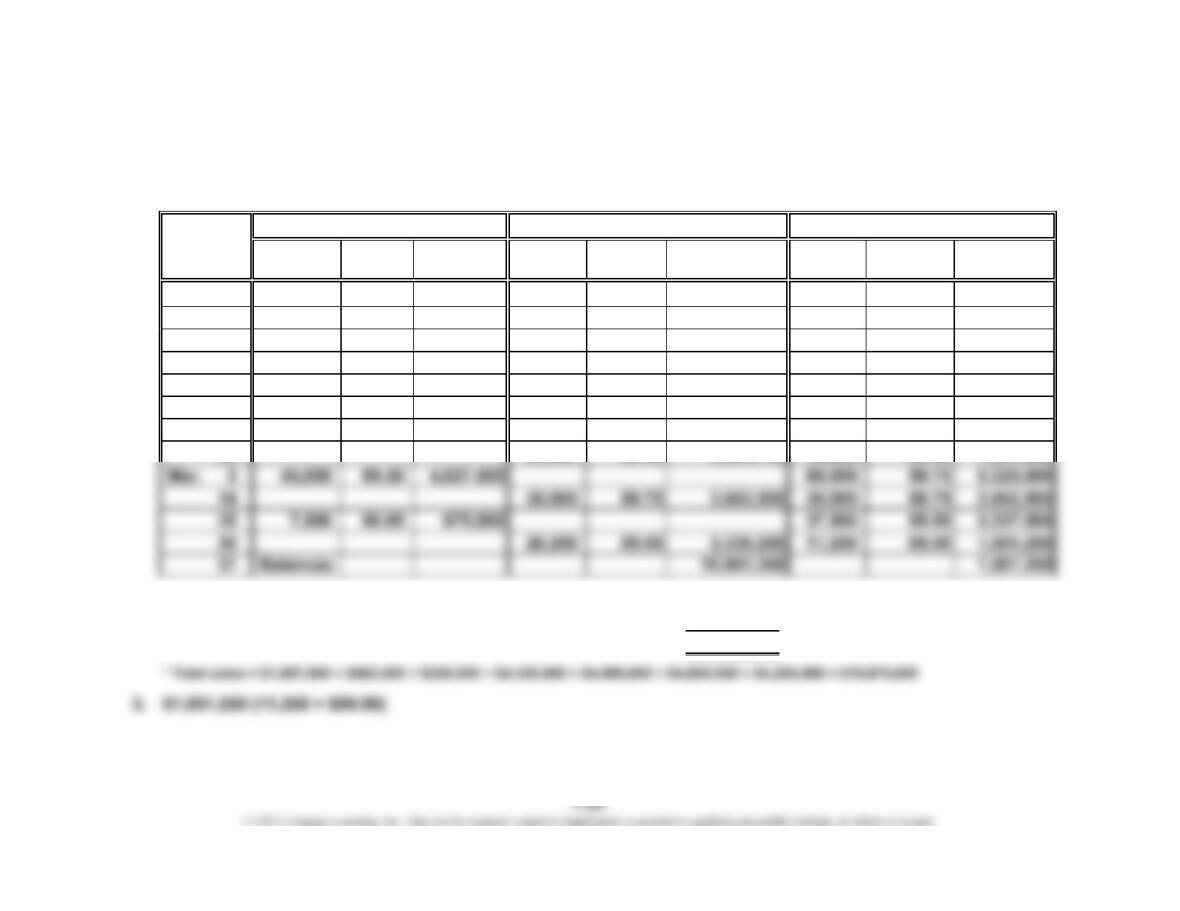
Prob. 7-3A
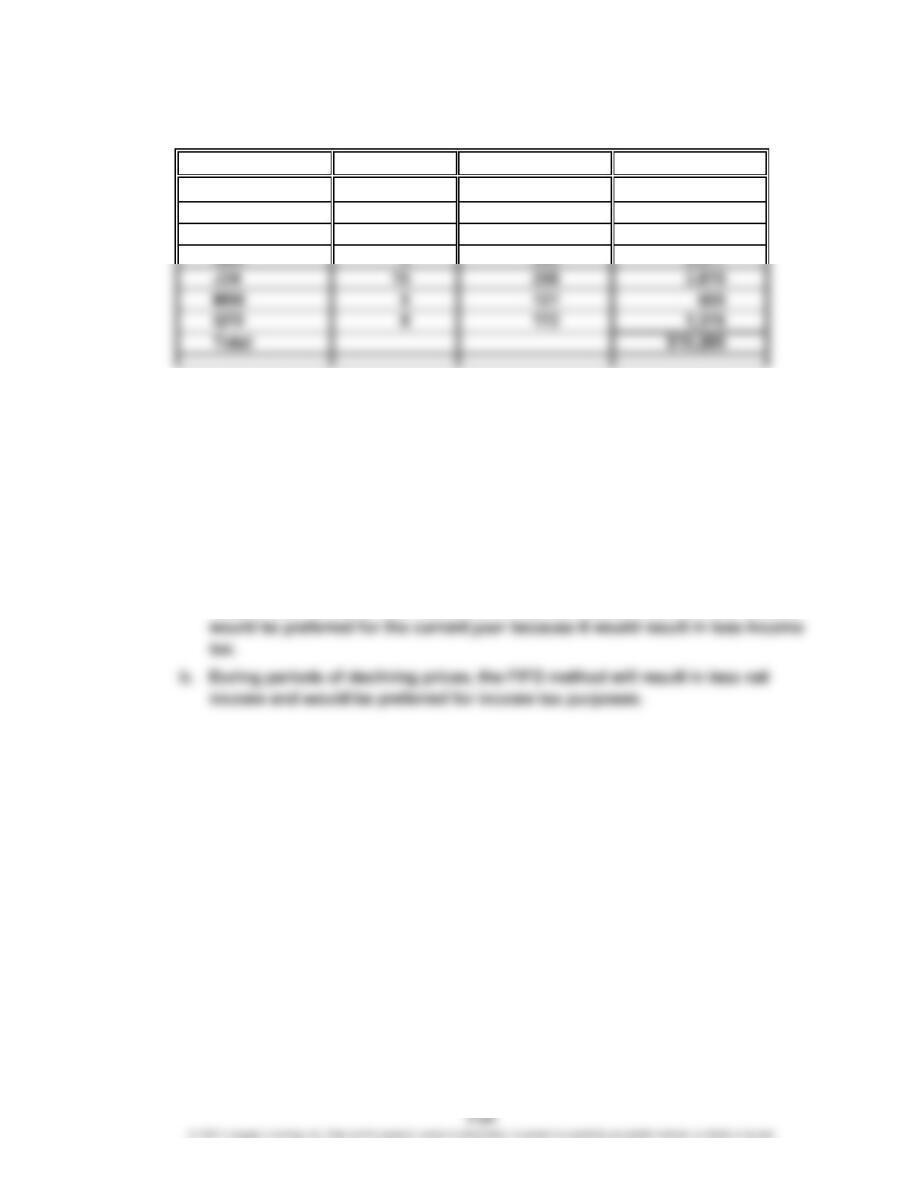
1.
Unit Total Total Total
Quantity Cost Cost Quantity Unit Cost Cost Quantity Unit Cost Cost
Jan. 1 7,500 75.00 562,500
10 22,500 85.00 1,912,500 30,000 82.50 2,475,000
28 11,250 82.50 928,125 18,750 82.50 1,546,875
30 3,750 82.50 309,375 15,000 82.50 1,237,500
Feb. 5 1,500 82.50 123,750 13,500 82.50 1,113,750
10 54,000 87.50 4,725,000 67,500 86.50 5,838,750
16 27,000 86.50 2,335,500 40,500 86.50 3,503,250
2. Total sales………………………………………………………………
…
$19,875,000
Total cost of merchandise sold………………………………………
…
10,901,250
Gross profit………………………………………………………………
…
$ 8,973,750
Cost of Merchandise Sold Inventory
Date
Purchases
*
CHAPTER 7 Inventories
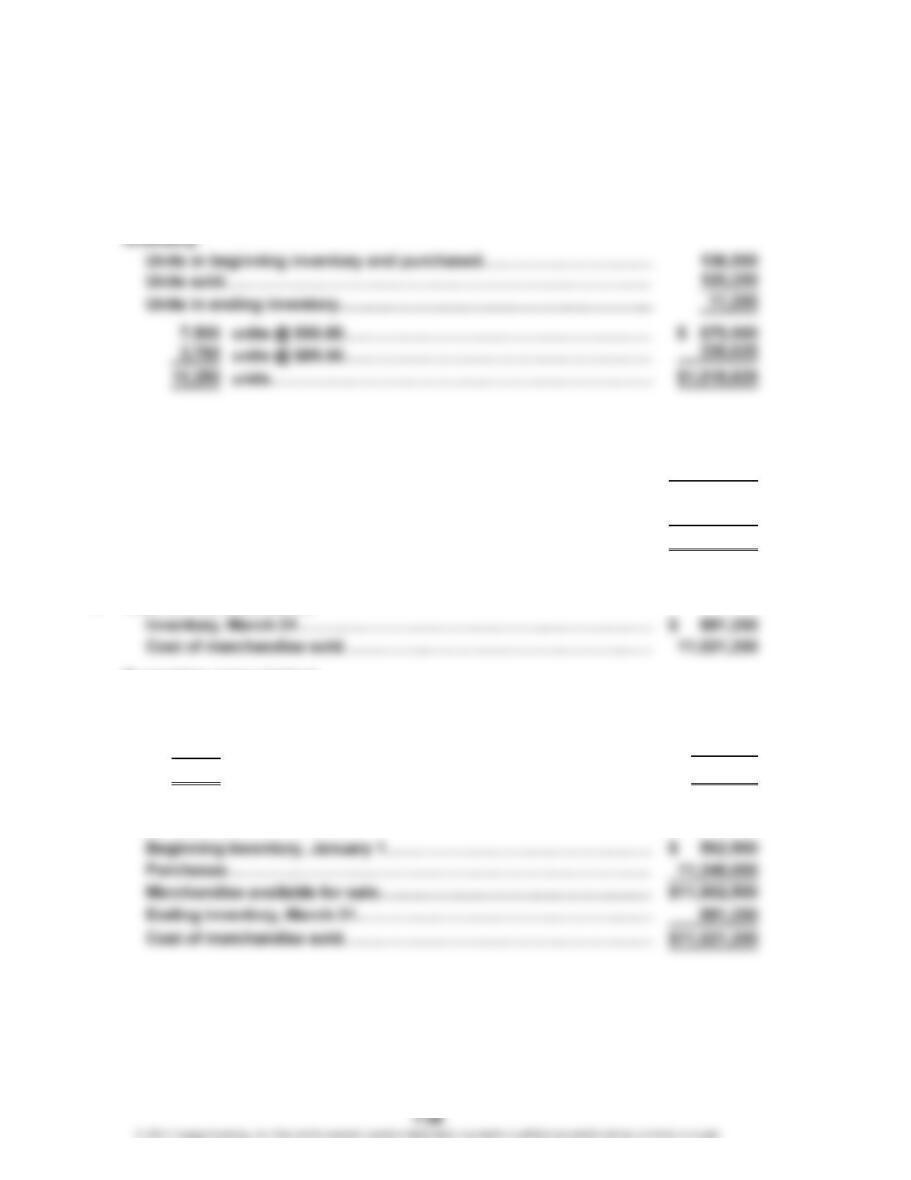
Prob. 7-4A
1. First-In, First-Out Method
Merchandise inventory, March 31………………………………………
…
$ 1,010,625
Cost of merchandise sold………………………………………..………
…
10,891,875
Supporting computations
Cost of merchandise sold:
Beginning inventory, January 1…………………………………………
…
$ 562,500
Purchases……………………………………………………………………
…
11,340,000
Merchandise available
f
or sale……………………………………………
$11
,
902
,5
00
Ending inventory, March 31………………………………………………
…
1,010,625
Cost of merchandise sold……………………………………………..…
…
$10,891,875
* $1,912,500 + $4,725,000 + $4,027,500 + $675,000
2. Last-In, First-Out Method
…
Supporting computations
Inventory:
7,500 units @ $75.00…………………………………………………
…
$562,500
3,750 units @ $85.00…………………………………………………
…
318,750
11,250 units…………………………………………………….………
…
$881,250
Cost of merchandise sold:
…
…
f
$11
902
00
…
*
…
…
…
CHAPTER 7 Inventories
Prob. 7-4A (Concluded)
3. Weighted Average Cost Method
Inventory, March 31………………………………………………………… $ 981,000
Cost of merchandise sold…………………………………………………
…
10,921,500
Supporting computations
Inventory:
11,250 units × $87.20 = $981,000
Cost of merchandise sold:
Beginning inventory, January 1…………………………………………………..
.
$ 562,500
Purchases………………………………………………………………………………….
.
11,340,000
Merchandise available for sale……………………………………………………. $11,902,500
Ending inventory, March 31……………………………….……………………….. 981,000
Cost of merchandise sold…………………………………………………………… $10,921,500
4. Weighted
CHAPTER 7 Inventories
Prob. 7-5A
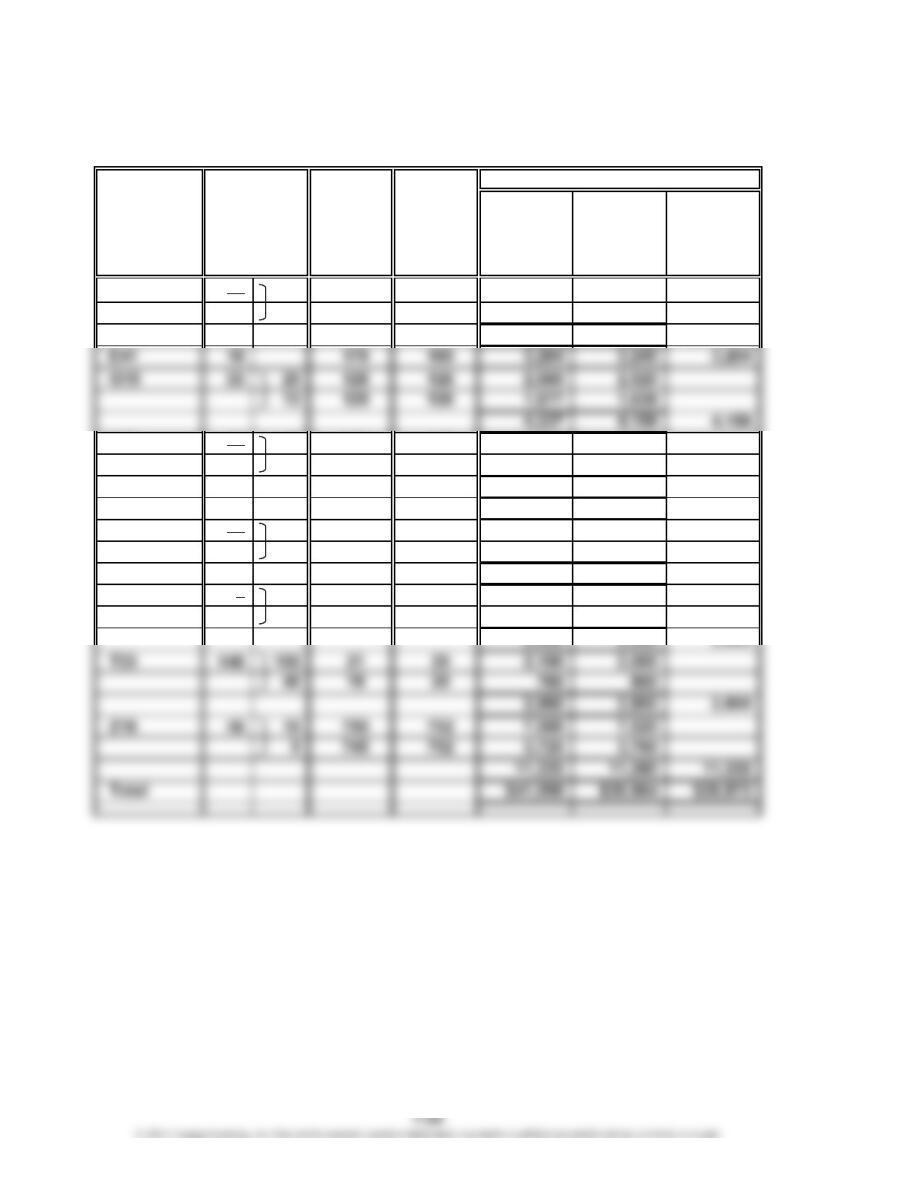
1. First-In, First-Out Method
Model Quantity Unit Cost Total Cost
A10 4 $ 76 $ 304
2 70 140
B15 6 184 1,104
2 170 340
E60 5 70 350
G83 9 259 2,331
2. Last-In, First-Out Method
Model Quantity Unit Cost Total Cost
A10 4 $ 64 $ 256
2 70 140
B15 8 176 1,408
E60 3 75 225
2 65 130
G83 7 242 1,694
2 250 500
CHAPTER 7 Inventories
Prob. 7-5A (Concluded)
3. Weighted Average Cost Method
Quantity Unit Cost*Total Cost
6 $ 70 $ 420
8 174 1,392
5 69 345
*Computations of unit costs:
A10: $70 = [(4 × $64) + (4 × $70) + (4 × $76)] ÷ (4 + 4 + 4)
B15: $174 = [(8 × $176) + (4 × $158) + (3 × $170) + (6 × $184)] ÷ (8 + 4 + 3 + 6)
E60: $69 = [(3 × $75) + (3 × $65) + (15 × $68) + (9 × $70)] ÷ (3 + 3 + 15 + 9)
G83: $253 = [(7 × $242) + (6 × $250) + (5 × $260) + (10 × $259)] ÷ (7 + 6 + 5 + 10)
J34: $258 = [(12 × $240) + (10 × $246) + (16 × $267) + (16 × $270)] ÷ (12 + 10 + 16 + 16)
M90: $121 = [(2 × $108) + (2 × $110) + (3 × $128) + (3 × $130)] ÷ (2 + 2 + 3 + 3)
Q70: $172 = [(5 × $160) + (4 × $170) + (4 × $175) + (7 × $180)] ÷ (5 + 4 + 4 + 7)
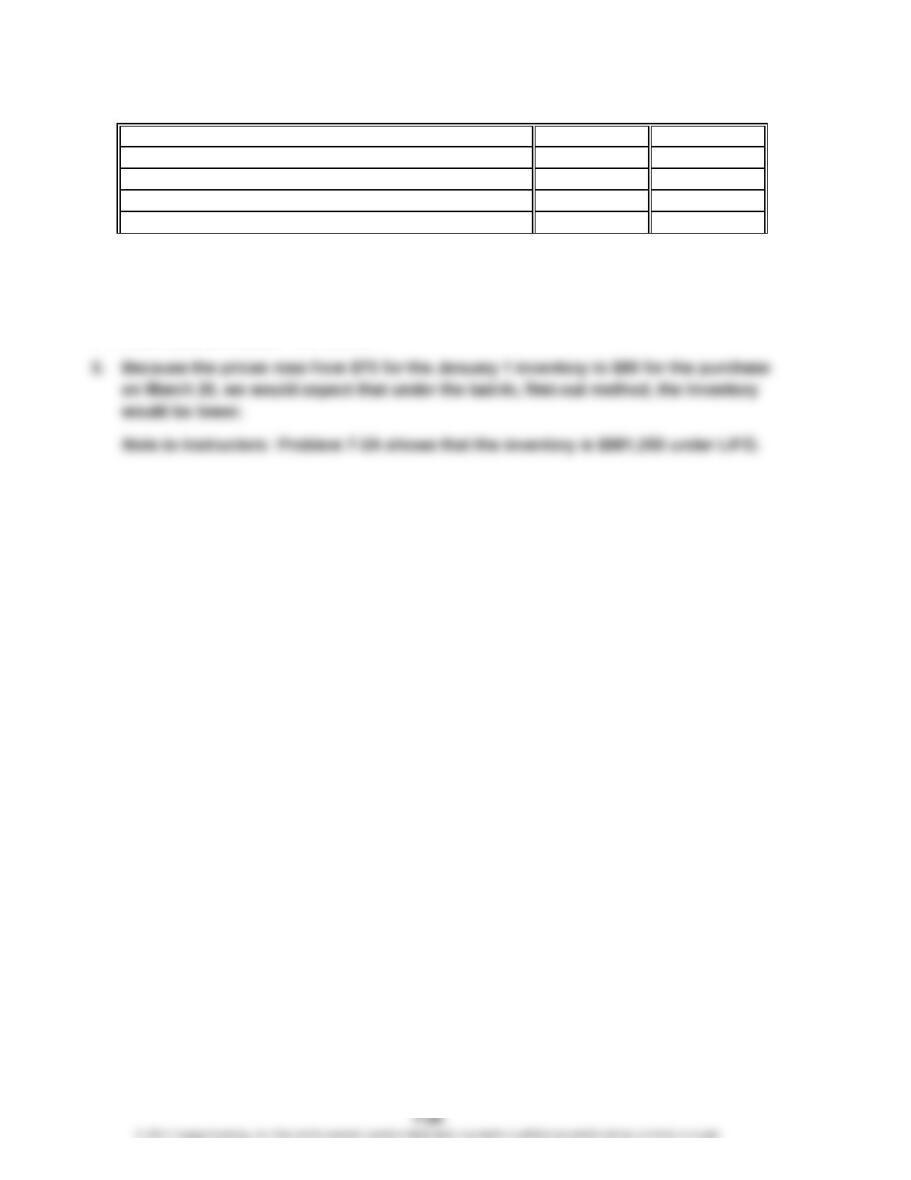
4. a. During periods of rising prices, the LIFO method will result in a lower cost
of inventory, a greater amount of cost of merchandise sold, and less net
income than the other two methods. For Dymac Appliances, the LIFO method
Model
A10
B15
E60
CHAPTER 7 Inventories
Prob. 7-6A
Market
Value per
Cost Unit (Net
Inventory per Realizable
Item Unit Value) Cost Market LCM
B12 38 30 $ 60 $ 57 $ 1,800 $ 1,710
8 59 57 472 456
2,272 2,166 $ 2,166
L88 18 10 563 550 5,630 5,500
8 560 550 4,480 4,400
10,110 9,900 9,900
N94 400 8 7 3,200 2,800 2,800
P24 90 80 22 18 1,760 1,440
10 21 18 210 180
1,970 1,620 1,620
R66 8 5 248 250 1,240 1,250
3 260 250 780 750
Quantity
Inventory Sheet
December 31
Inventory
Total
CHAPTER 7 Inventories
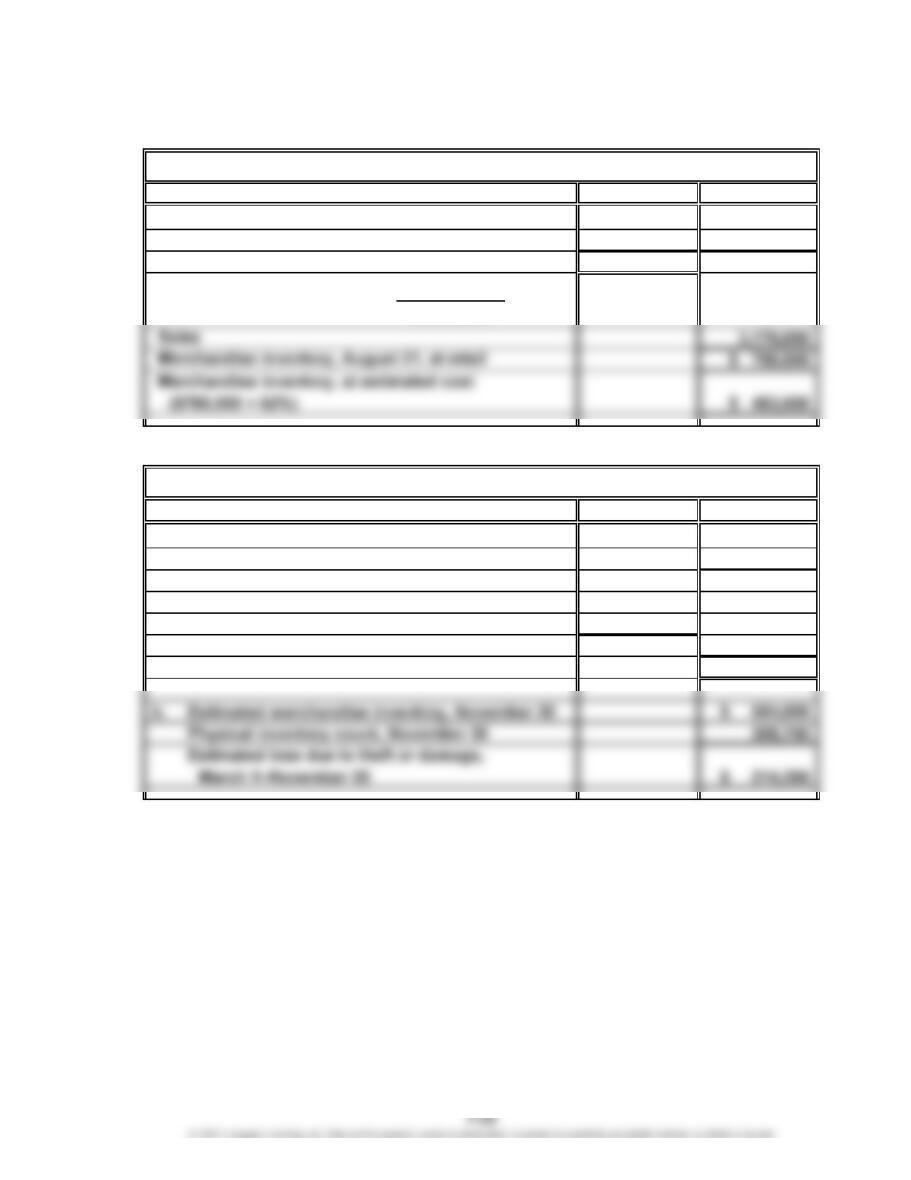
Appendix Prob. 7-7A
1.
Cost Retail
Merchandise inventory, August 1 $ 300,000 $ 575,000
Net purchases 2,149,000 3,375,000
Merchandise available for sale $2,449,000 $3,950,000
$2,449,000
$3,950,000
2.
Cost
a. Merchandise inventory, March 1 $ 880,000
Net purchases 9,500,000
Merchandise available for sale $10,380,000
Sales $15,800,000
Less estimated gross profit ($15,800,000 × 38%) 6,004,000
Estimated cost of merchandise sold 9,796,000
Estimated merchandise inventory, November 30 $ 584,000
Celebrity Tan Co.
Ranchworks Co.
Ratio of cost to retail price: = 62%
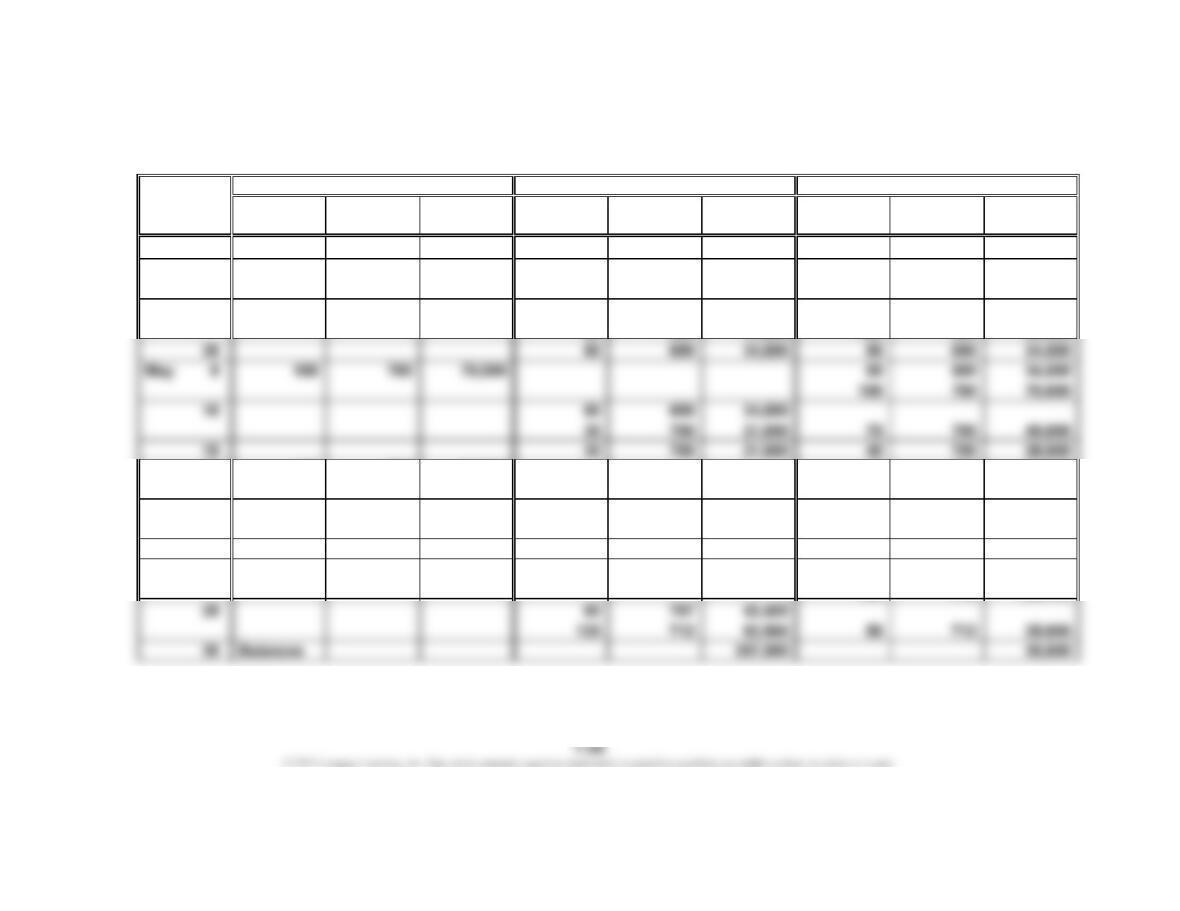
CHAPTER 7 Inventories
Prob. 7-1B
1.
Unit Total Unit Total Unit Total
Quantity Cost Cost Quantity Cost Cost Quantity Cost Cost
Apr. 3 40 670 26,800
8 120 690 82,800 40 670 26,800
120 690 82,800
11 40 670 26,800
28 120 707 84,840 40 700 28,000
120 707 84,840
June 5 40 700 28,000
20 707 14,140 100 707 70,700
16 40 707 28,280 60 707 42,420
21 180 712 128,160 60 707 42,420
180 712 128,160
Date
Purchases Cost of Merchandise Sold Inventory
CHAPTER 7 Inventories
Prob. 7-1B (Concluded)
2. Accounts Receivable 611,800
Sales 611,800
Cost of Merchandise Sold 357,000
Merchandise Inventory 357,000
* $611,800 = $67,200 + $56,000 + $89,600 + $33,600 + $75,600 + $50,400 + $239,400
3. $254,800 ($611,800 – $357,000)
4. $35,600 (50 units × $712)
*
CHAPTER 7 Inventories
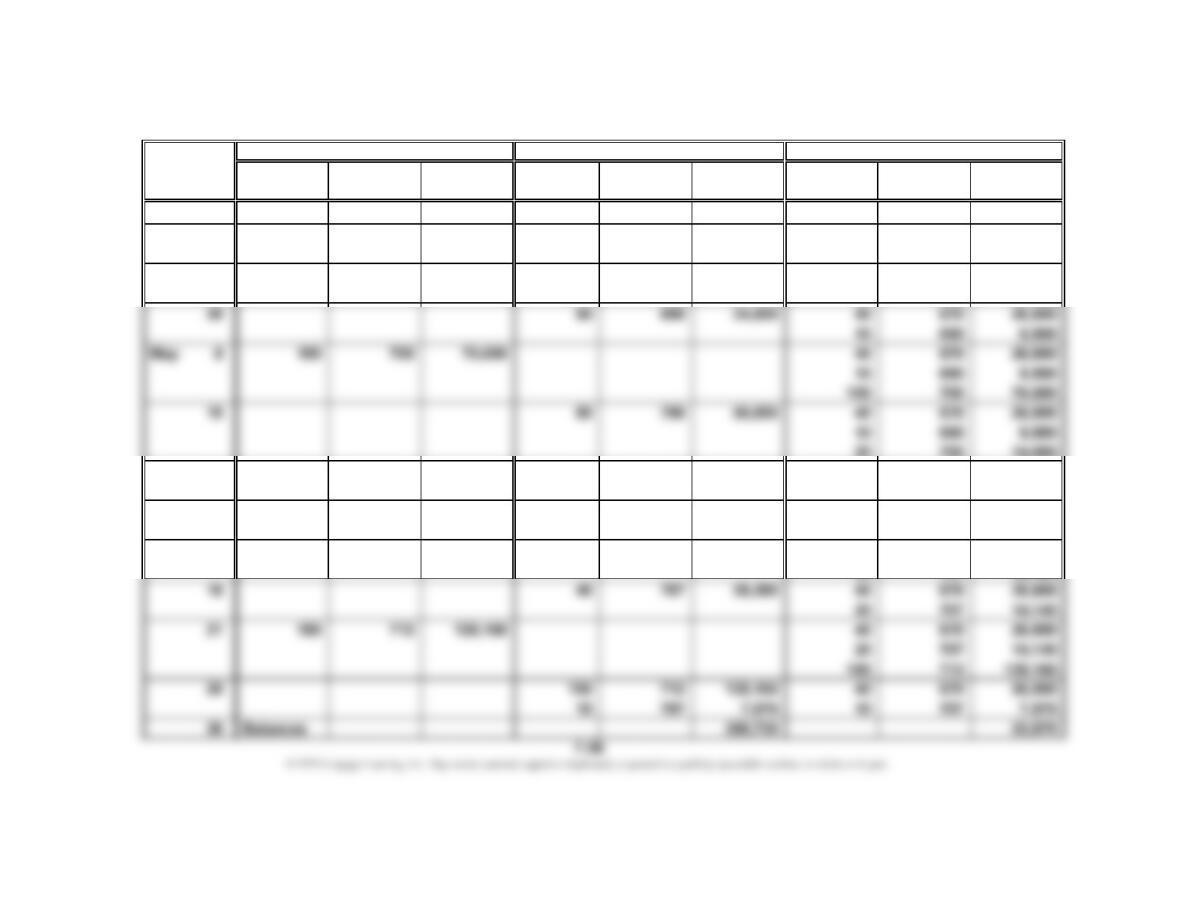
Prob. 7-2B
1.
Unit Total Unit Total Unit Total
Quantity Cost Cost Quantity Cost Cost Quantity Cost Cost
Apr. 3 40 670 26,800
8 120 690 82,800 40 670 26,800
120 690 82,800
11 60 690 41,400 40 670 26,800
60 690 41,400
20 700 14,000
19 20 700 14,000
10 690 6,900 40 670 26,800
28 120 707 84,840 40 670 26,800
120 707 84,840
June 5 60 707 42,420 40 670 26,800
Date
Purchases Cost of Merchandise Sold Inventory