
Financial Accounting, 9/e 7-41
P7–7.
Req. 1
Projected
change
No change from
beginning of year
Inventory
=
Cost of Goods Sold
$7,283,566
=
15.1
$7,283,566
=
12.5
Turnover
Average Inventory
$483,555*
$582,500**
Req. 3
An increase in the inventory turnover ratio indicates an increase in the number of times
average inventory was produced and sold during the period. A higher ratio indicates that
inventory moves more quickly through the production process to the ultimate customer.
As a consequence, the company can maintain less inventory on hand, all other things
P7–8.
Req. 1
A change that increases beginning inventory will decrease net income while a change
that increases ending inventory will increase net income.
Impact on International Paper net
income (in millions)
Change in ending inventory $350
Change in beginning inventory (334)
Req. 2
If FIFO had been used, the ending inventory would have been $350 million higher.
Instead LIFO was used and the $350 million was allocated to cost of goods sold in
earlier accounting periods (including the current year). Thus, the cumulative difference
between LIFO pretax income and FIFO pretax income was $350 million or a difference
of $245 million after taxes ($350 x .7). Therefore, retained earnings on a FIFO basis
would have been $3,575 million (i.e., $245 + $3,330).
Req. 3
Financial Accounting, 9/e 7-43
P7–9.
Req. 1
2016 2017 2018 2019
Sales revenue $2,025,000 $2,450,000 $2,700,000 $2,975,000
Cost of goods sold 1,505,000 1,645,000* 1,764,000* 2,113,000
Gross profit 520,000 805,000 936,000 862,000
Expenses 490,000 513,000 538,000 542,000
Req. 2
2016 2017 2018 2019
Gross profit ratio (gross profit ÷ sales):
Before correction:
$520,000 ÷ $2,025,000 = 0.26
Req. 3
The effect of the error on income tax expense was:
2017 2018
Income tax expense reported $93,000 $114,000
Correct income tax expense 87,600 119,400
7-44 Solutions Manual
P7–10. (Supplement A)
Req. 1 Pretax operating profit (loss) for the current year had FIFO accounting been
employed instead of LIFO.
Req. 2 Since prices are rising, LIFO liquidations increase net income before taxes.
The change in pretax operating profit during the current year is given in the
Financial Accounting, 9/e 7-45
ALTERNATE PROBLEMS
AP7−1.
a) Goods available for sale for all methods:
1. Average cost:
Average unit cost $53,475 ÷ 1,550=$34.50.
Ending inventory (730 units x $34.50) $25,185
Cost of goods sold1 ($53,475 – $25,185) $28,290
1 Direct computation of Cost of goods sold: (820 units @ $34.50) = $28,290
3. Last-in, first-out:
Ending inventory (390 units x $32) +
(340 units x $34.25) $24,125
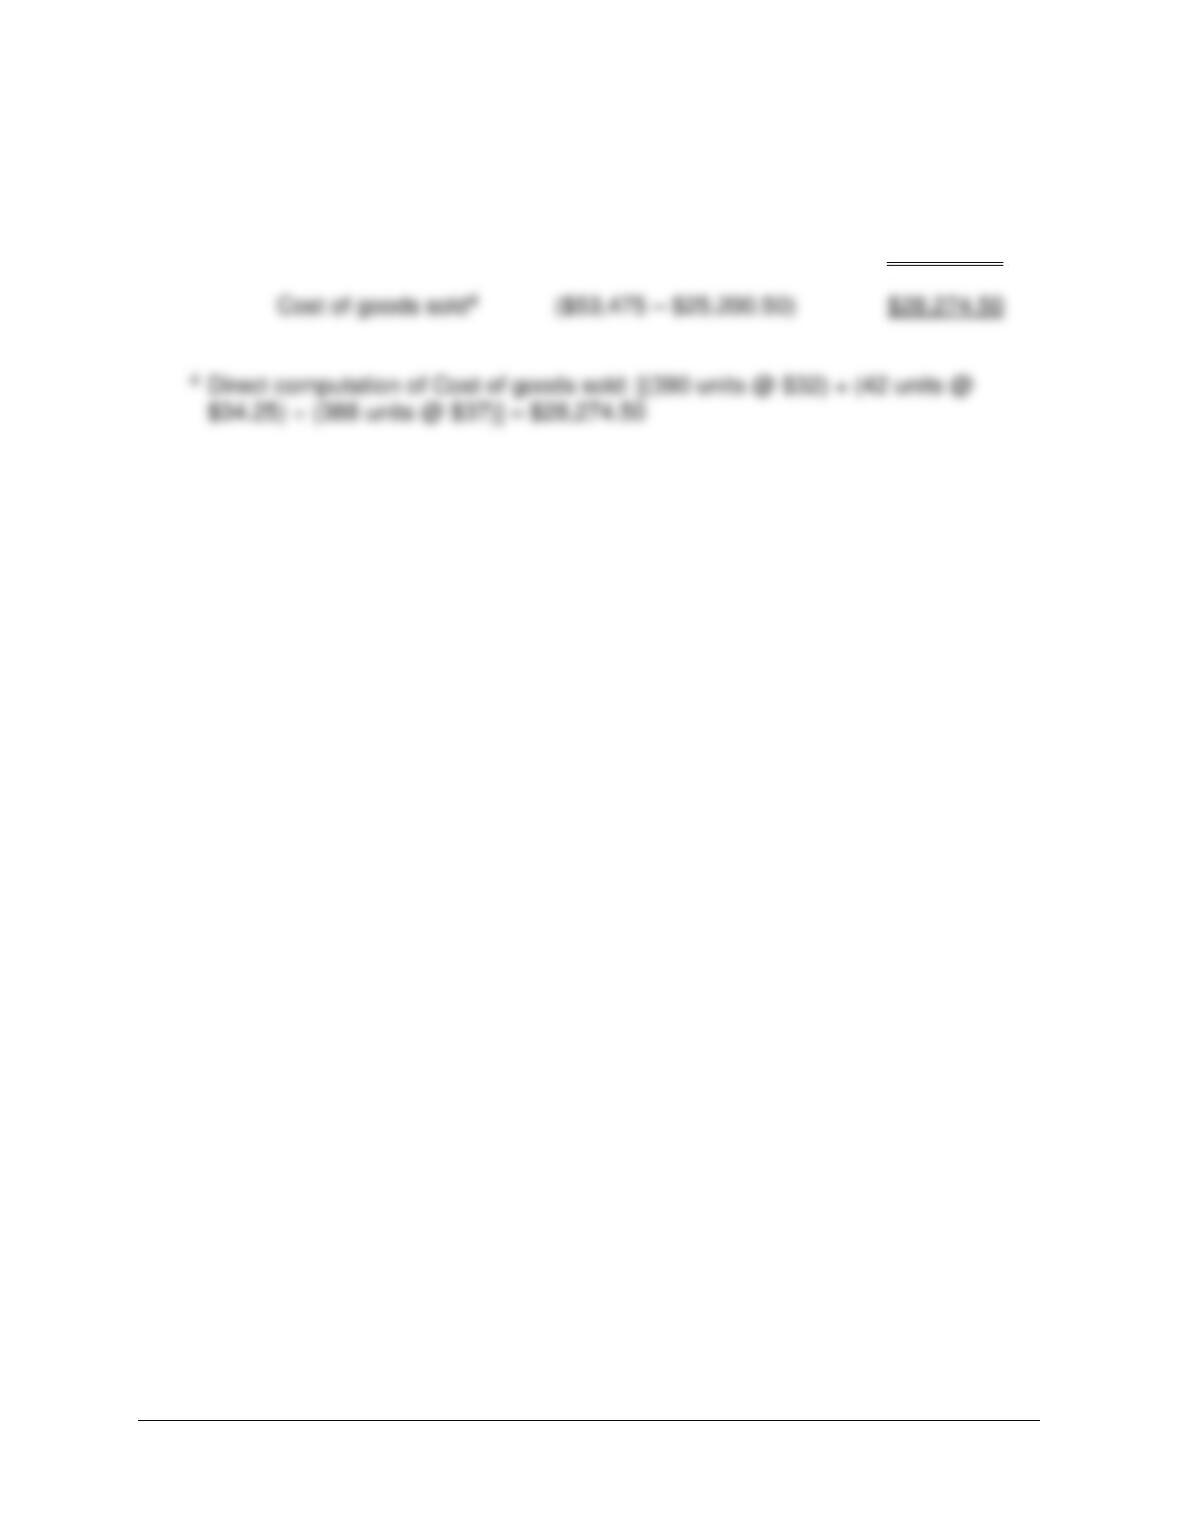
7-46 Solutions Manual
AP7−1. (continued)
4. Specific identification:
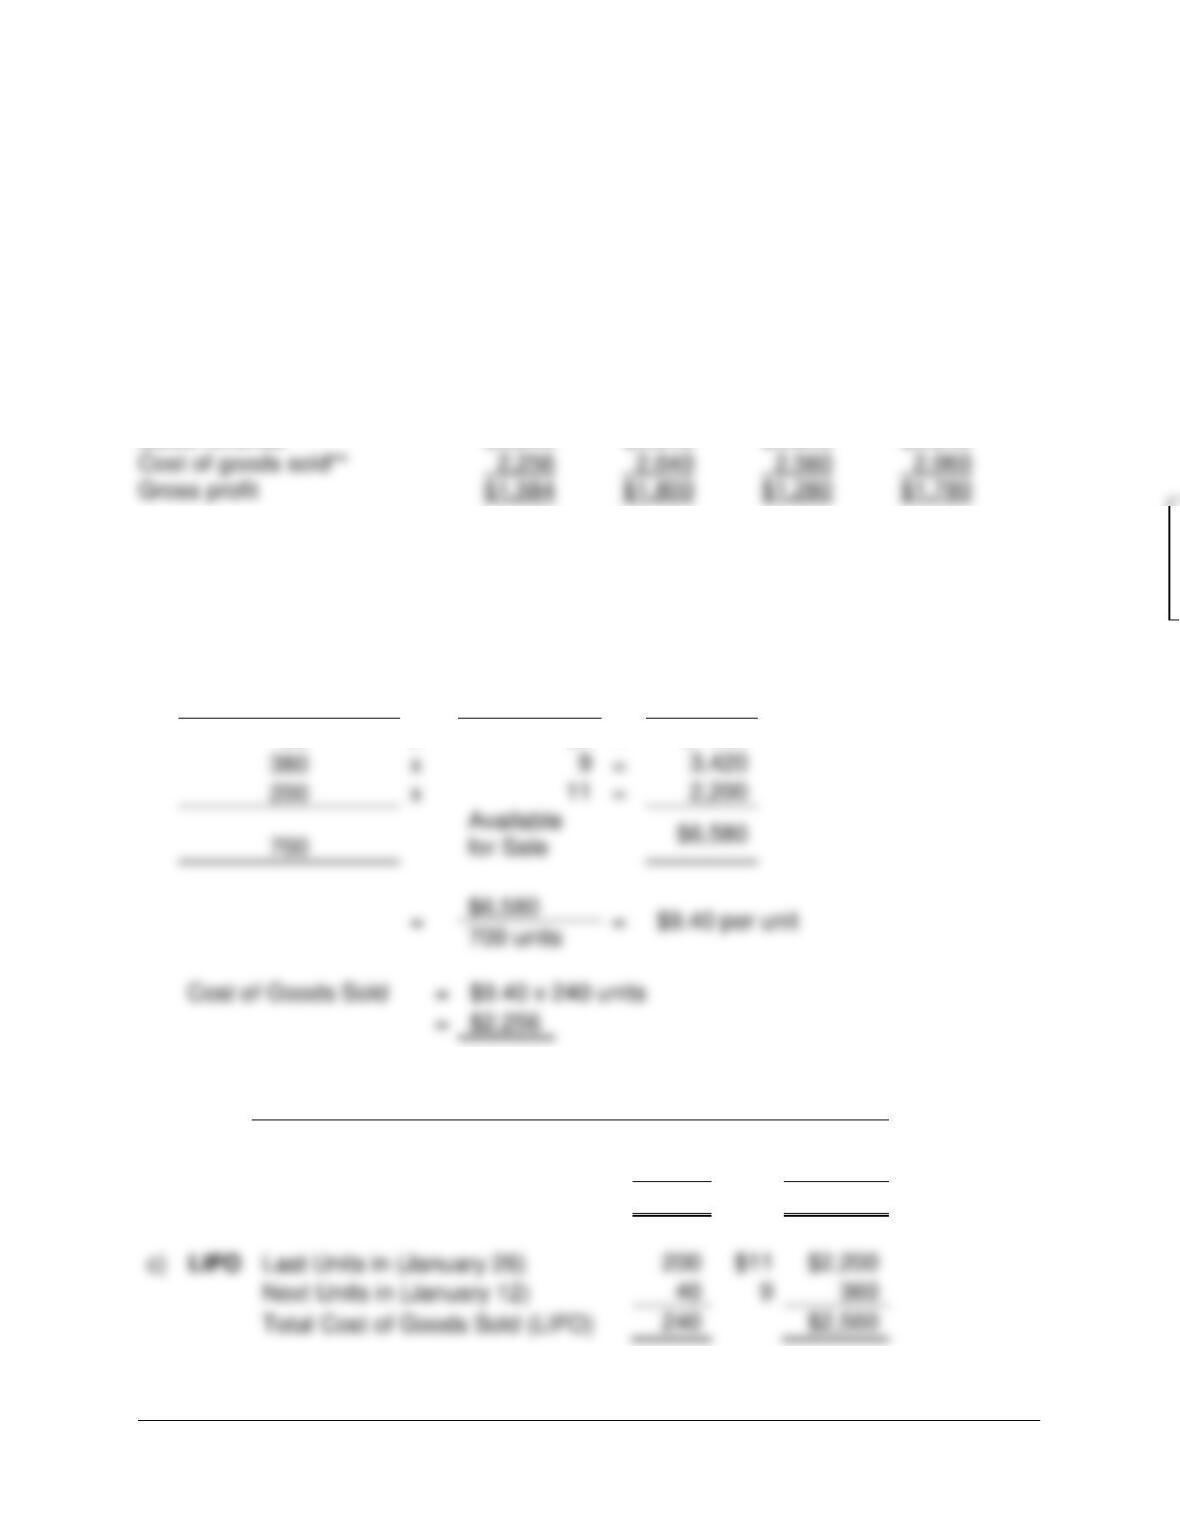
Ending inventory (658 units x $34.25) +
(72 units x $37) $25,200.50
Financial Accounting, 9/e 7-47
AP7–2.
Req. 1
NEWRIDGE COMPANY
Partial Income Statement
For the Month Ended January 31, current year
(a) (b) (c) (d)
Average Specific
Cost FIFO LIFO Identification
Sales revenue* $3,840 $3,840 $3,840 $3,840
Computations:
*Sales revenue = 240 units @ $16 = $3,840.
**Cost of Goods Sold Amounts:
a)
Average Cost
Number of Units
x
Unit Cost
=
Total
Cost
120
x
$8
=
$ 960
380
x
=
200
x
=
700
for Sale
$6,580
700 units
Cost of Goods Sold
=
$9.40 x 240 units
=
$2,256
Cost of Goods Sold
Units
Unit
Cost
Total
Cost
b)
FIFO
First Units in (Beginning Inventory)
120
$8
$ 960
Next Units in (January 12)
120
9
1,080
Total Cost of Goods Sold (FIFO)
240
$2,040
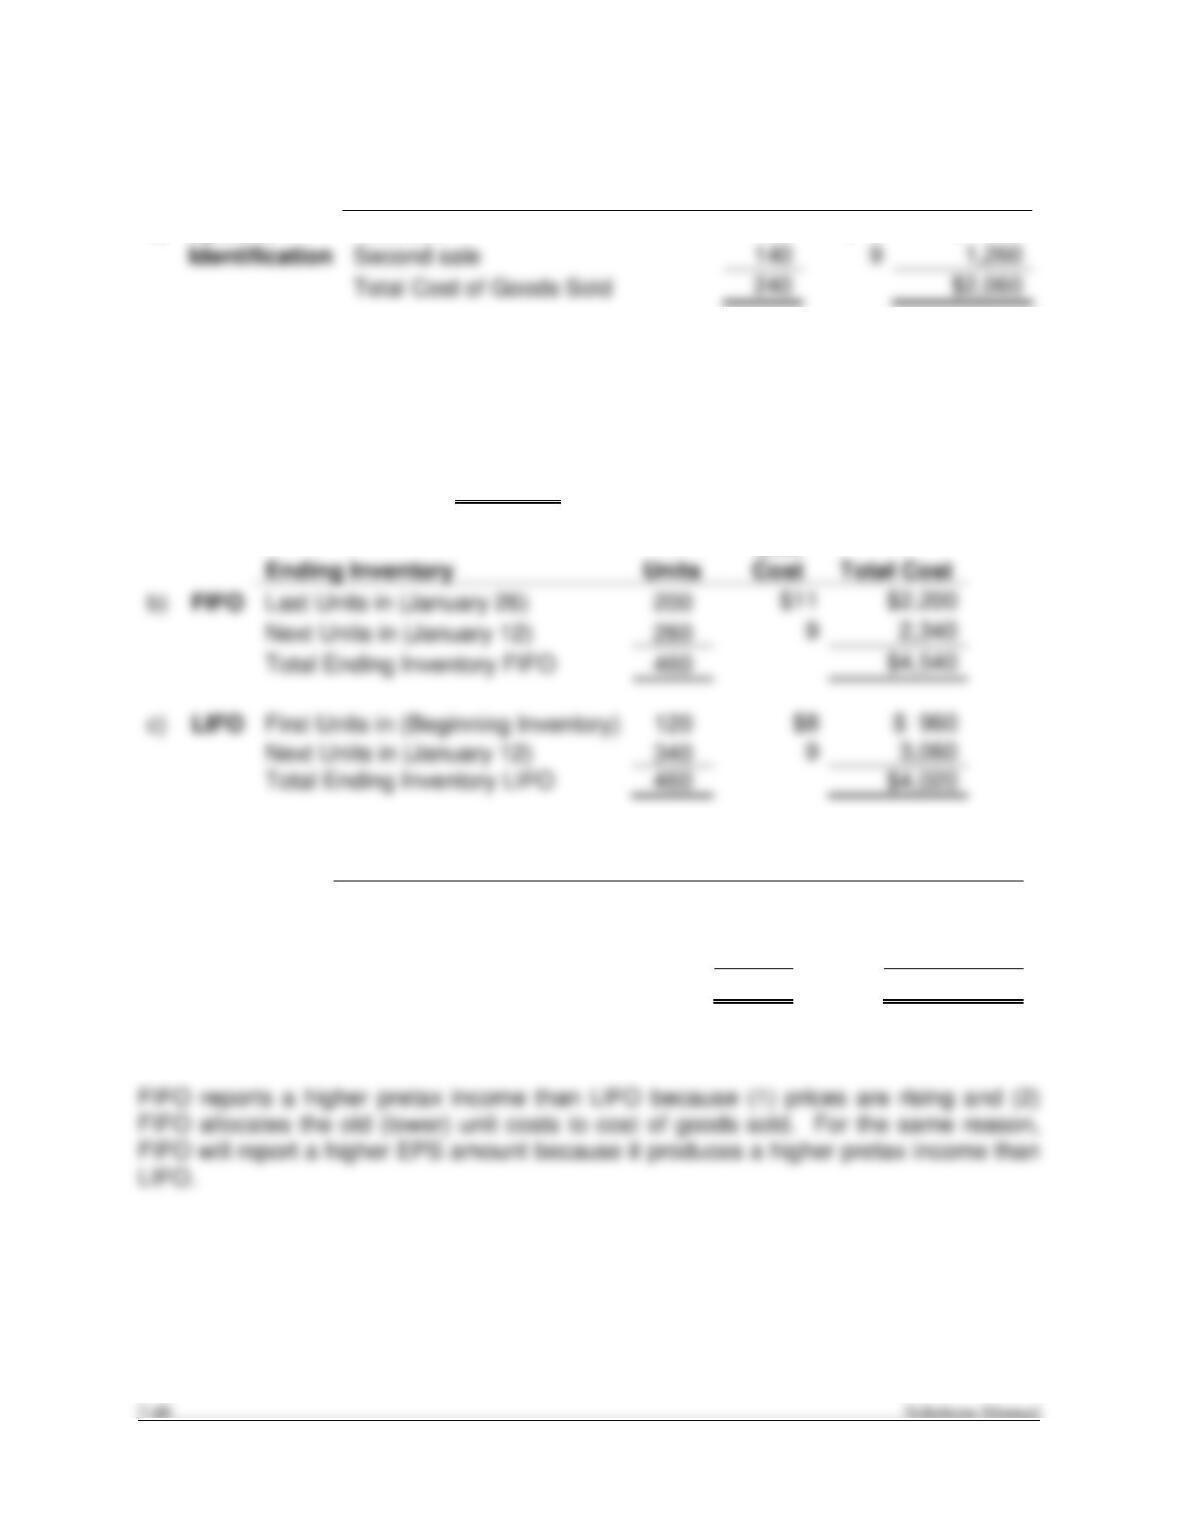
c)
LIFO
Last Units in (January 26)
Next Units in (January 12)
AP7–2. (continued)
Cost of Goods Sold
Units
Unit
Cost
Total Cost
d)
Specific
First sale
100
$ 8
$ 800
Identification
Second sale
1,260
Total Cost of Goods Sold
240
$2,060
Cost of Ending Inventory Amounts:
a)
Average Cost
Ending Inventory
=
$9.40 x 460 units
=
$4,324
Ending Inventory
Units
Total Cost
b)
FIFO
Last Units in (January 26)
$2,200
Next Units in (January 12)
Total Ending Inventory FIFO
c)
LIFO
First Units in (Beginning Inventory)
Next Units in (January 12)
Total Ending Inventory LIFO
Unit
Req. 2
Ending Inventory
Units
Unit
Cost
Total Cost
d)
Specific
Beginning
20
$ 8
$ 160
Identification
January 12
240
9
2,160
January 26
200
11
2,200
Total Ending Inventory (Spec.)
460
$4,520

Financial Accounting, 9/e 7-49
AP7–2. (continued)
Req. 3
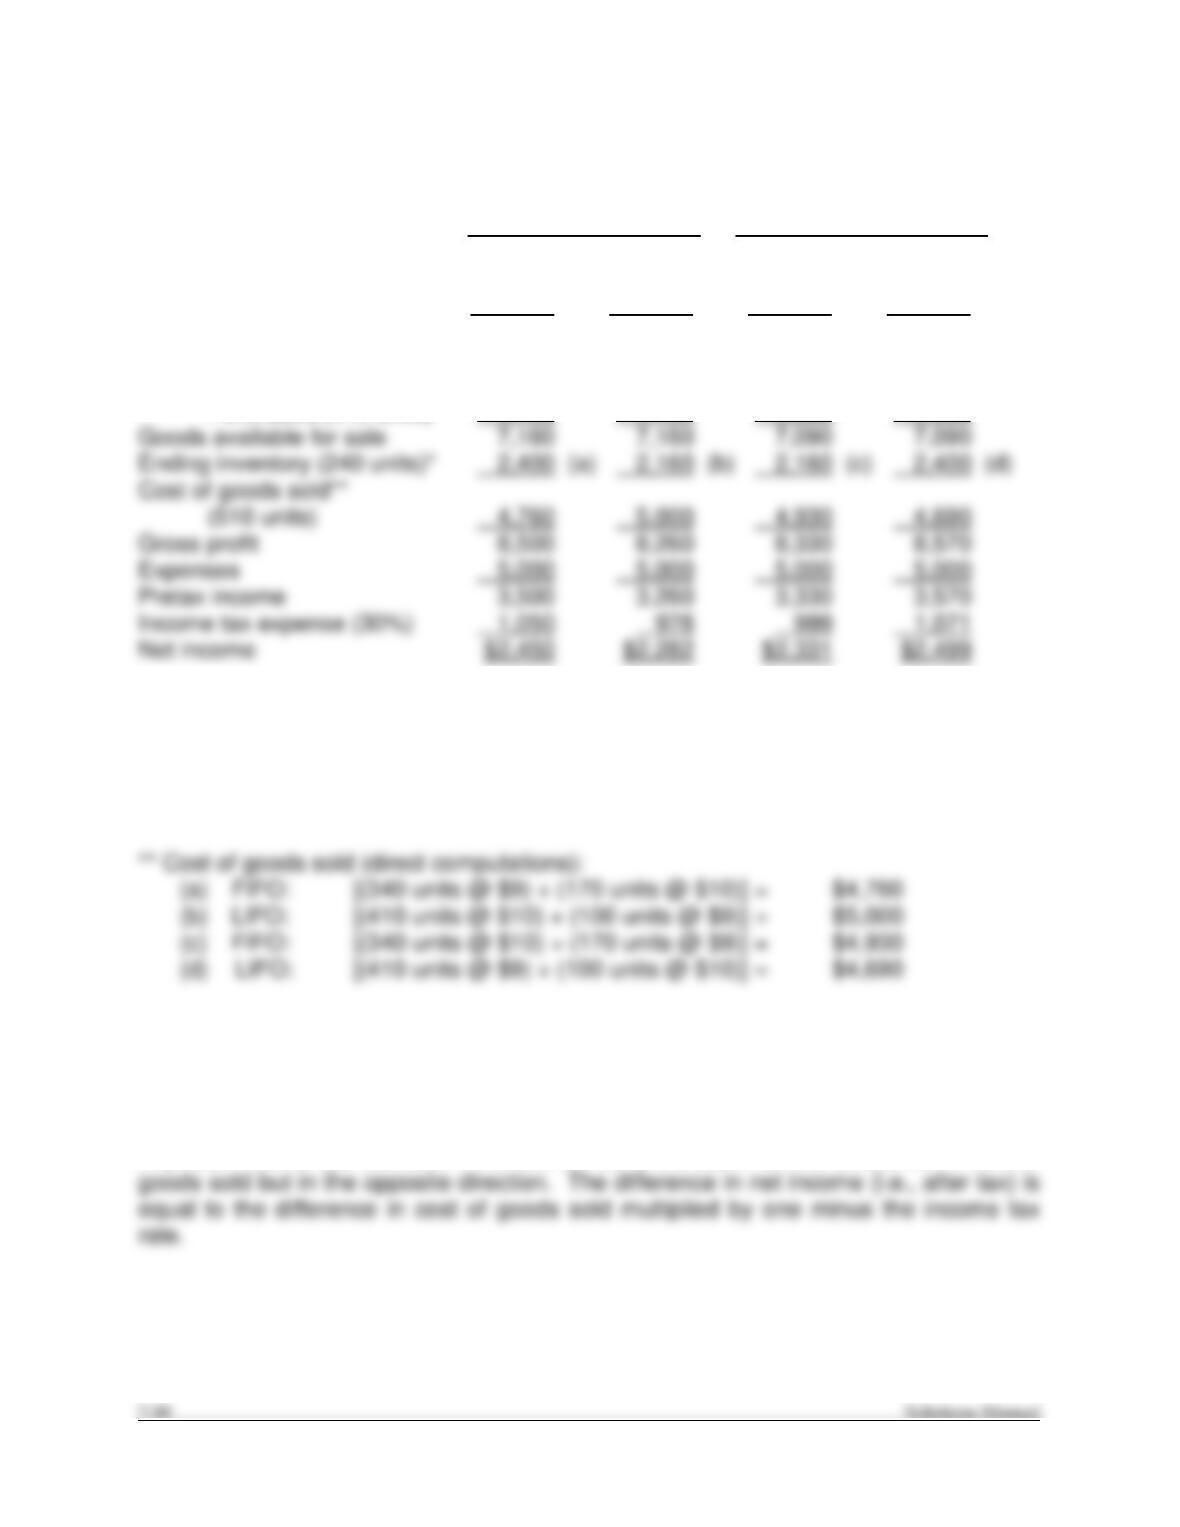
Because LIFO reports a lower pretax income than FIFO for the reasons given in
Req. 4
LIFO will provide a more favorable cash flow than FIFO of $156 because less cash will
AP7–3.
Req. 1
Prices Rising Prices Falling
A B C D
FIFO LIFO FIFO LIFO
Sales revenue (510 units) $13,260 $13,260 $13,260 $13,260
Cost of goods sold:
Beginning inventory
(340 units) 3,060 3,060 3,400 3,400
Purchases (410 units) 4,100 4,100 3,690 3,690
*Ending inventory computations:
(a) FIFO: 240 units @ $10.00 = $2,400
(b) LIFO: 240 units @ $9.00 = 2,160
(c) FIFO: 240 units @ $9.00 = 2,160
(d) LIFO: 240 units @ $10.00 = 2,400
Req. 2
The above tabulation demonstrates that when prices are rising, FIFO gives a higher net
income than LIFO. When prices are falling, the opposite effect results. The difference
in pretax income (as between FIFO and LIFO) is the same as the difference in cost of
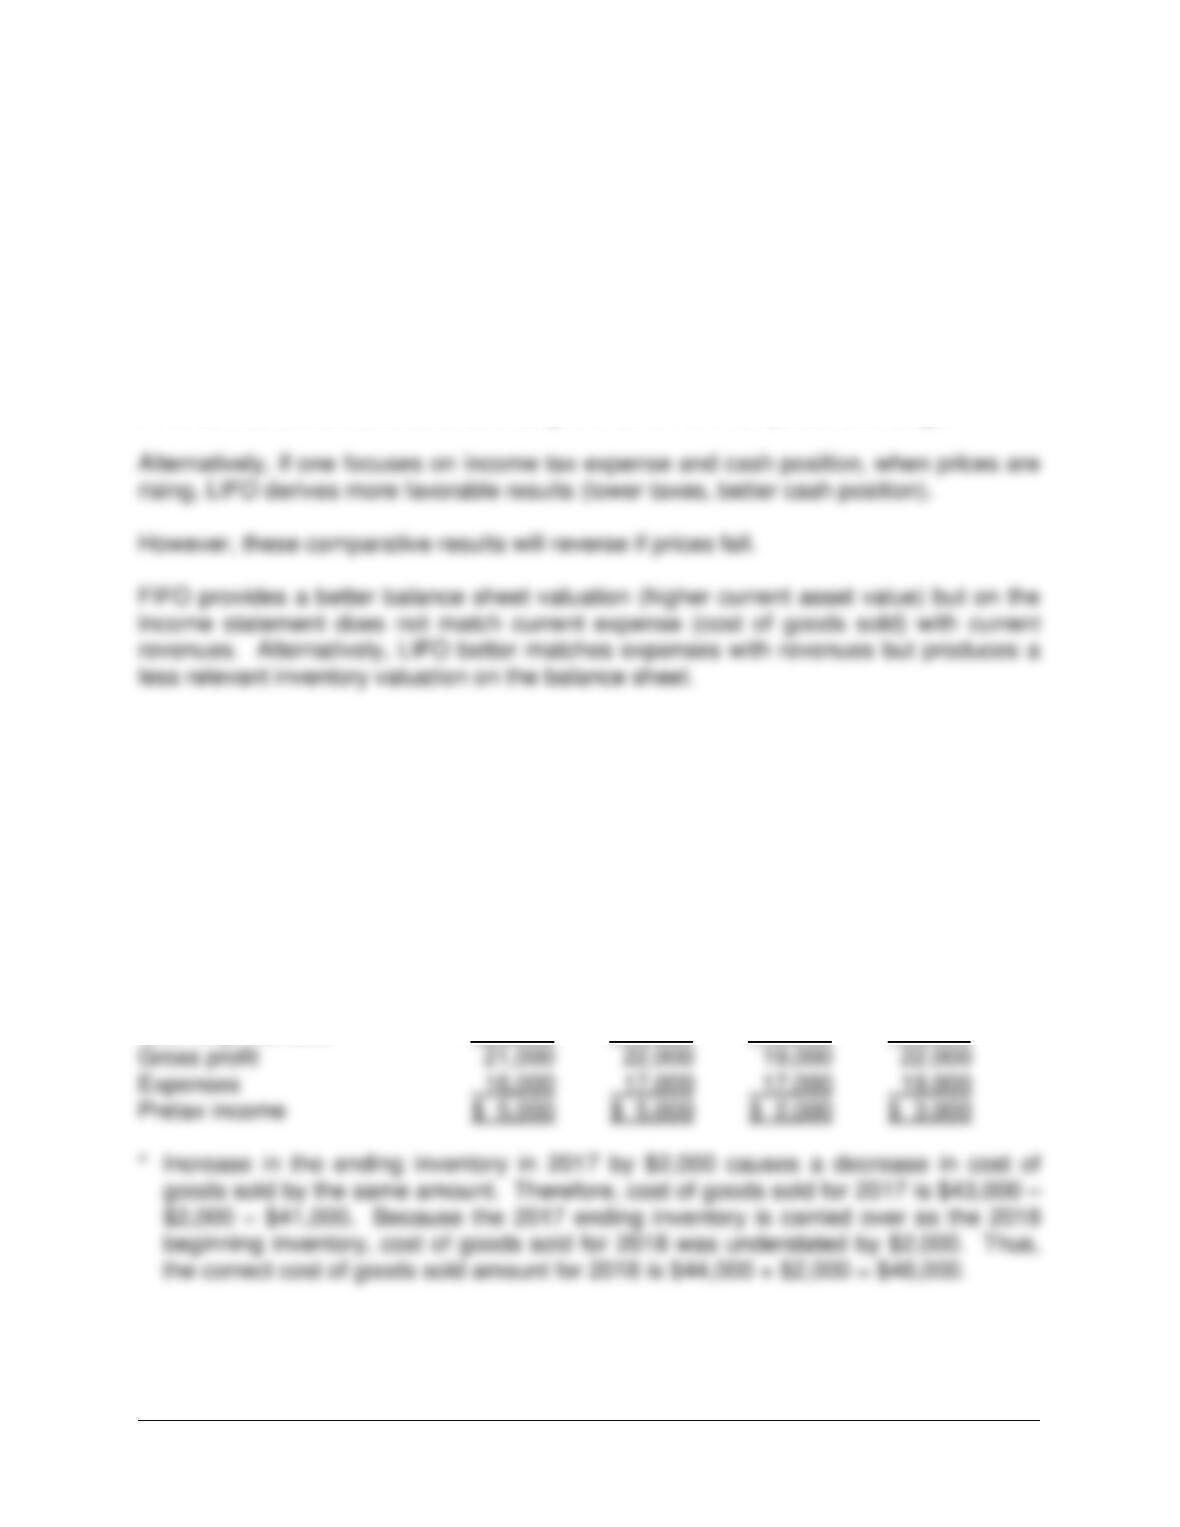
Financial Accounting, 9/e 7-51
AP7–3. (continued)
Req. 3
When prices are rising, LIFO derives a more favorable cash position (than FIFO) equal
to the difference in income tax. In contrast, when prices are falling, FIFO derives a
more favorable cash position equal to the difference in income tax.
Req. 4
Either method can be defended reasonably. If one focuses on current income and EPS,
FIFO derives a more favorable result (higher than LIFO when prices are rising).
AP7–4.
Req. 1
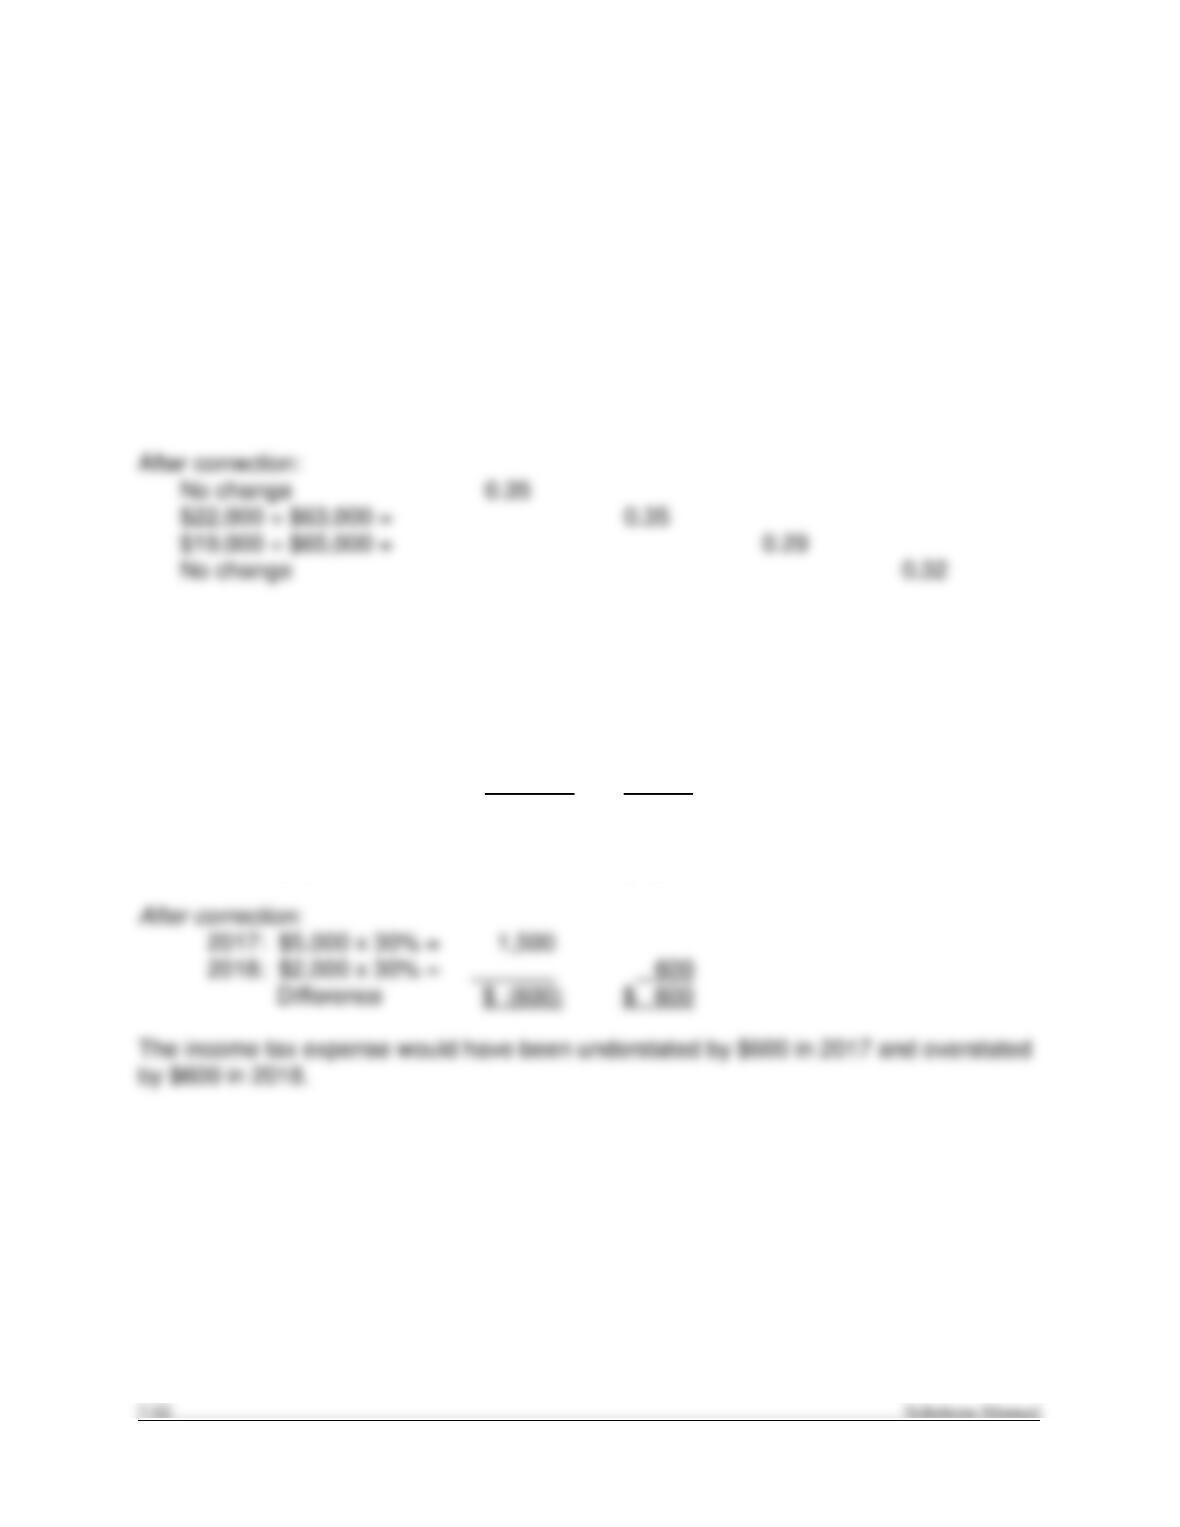
COLCA COMPANY
Income Statements Corrected
2016 2017 2018 2019
Sales revenue $60,000 $63,000 $65,000 $68,000
Cost of goods sold 39,000 41,000* 46,000* 46,000
AP7–4. (continued)
Req. 2
2016 2017 2018 2019
Gross profit ratio (gross profit ÷ sales):
Before correction:
$21,000 ÷ $60,000 = 0.35
$20,000 ÷ $63,000 = 0.32
$21,000 ÷ $65,000 = 0 .32
$22,000 ÷ $68,000 = 0.32
Req. 3
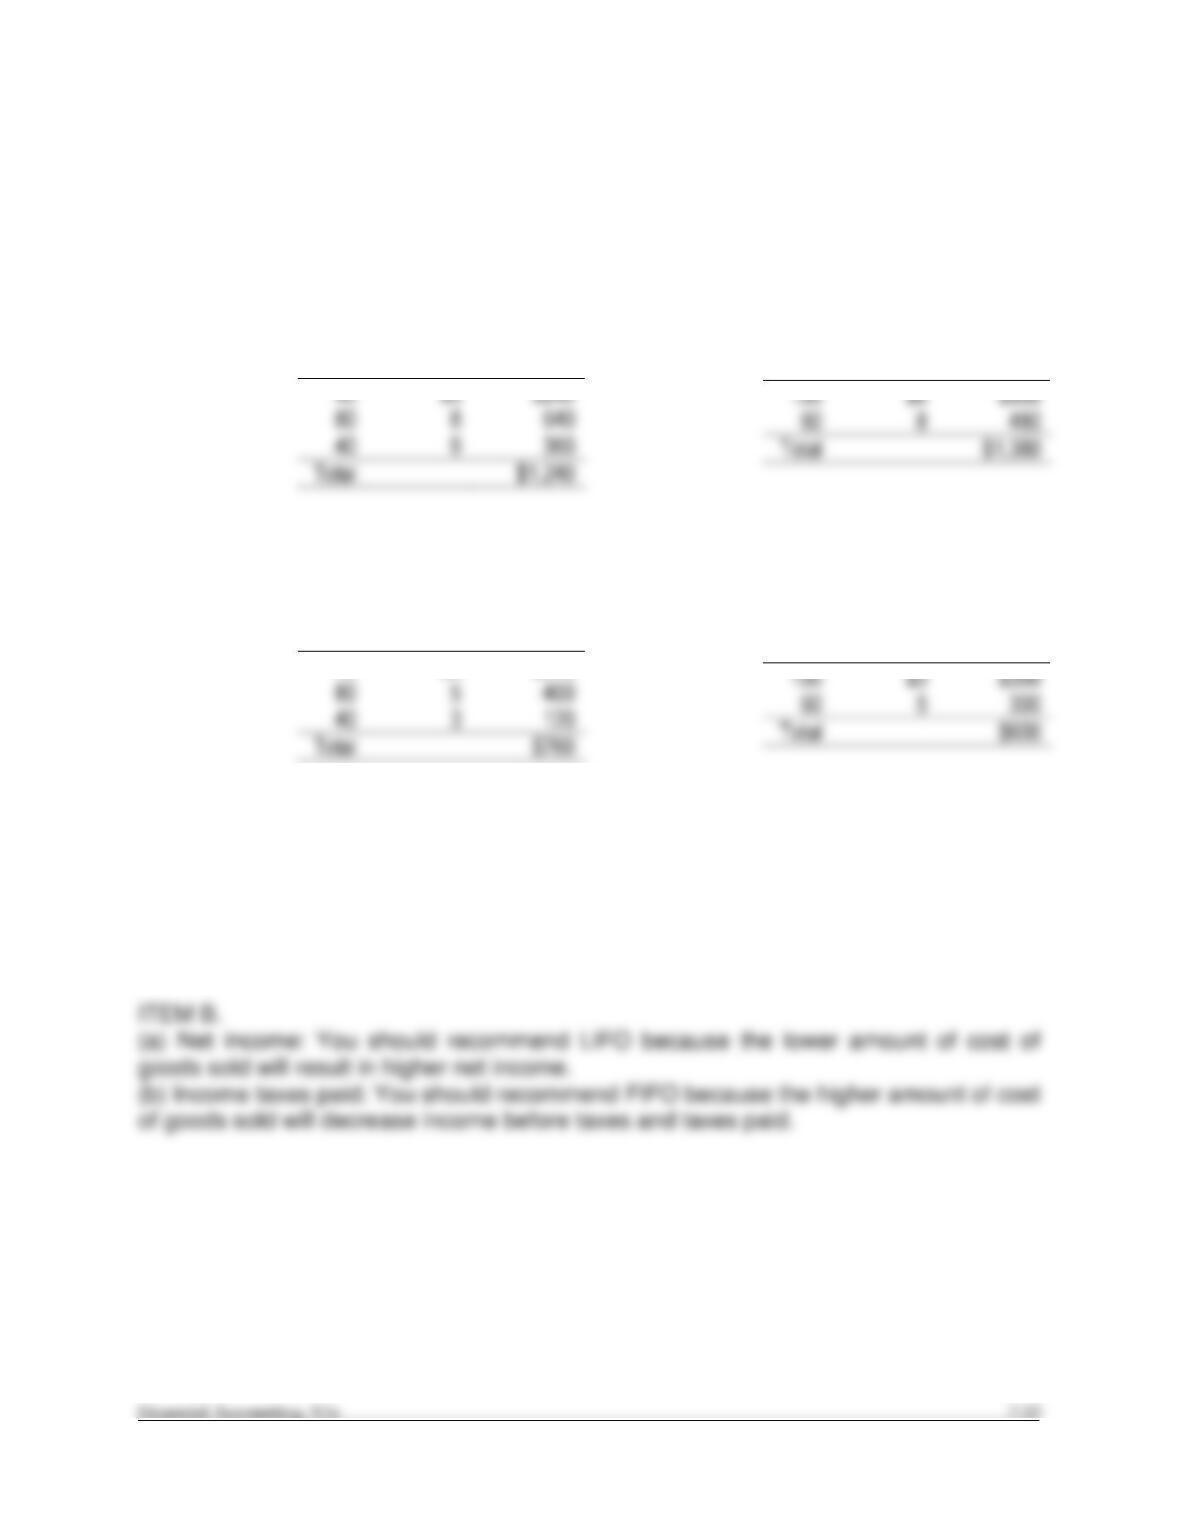
The error would have the following effect on income tax expense:
2017 2018
Before correction:
2017: $3,000 x 30% = $900
2018: $4,000 x 30% = $1,200
CONTINUING PROBLEM
CON7-1.
Req. 1
ITEM A. First–In, First–Out (FIFO) Last–In, First–Out (LIFO)
Cost of Goods Sold
Units
Unit Cost
Total Cost
40
$6
$240
80
40
$9
$900
60
ITEM B. First–In, First–Out (FIFO) Last–In, First–Out (LIFO)
Cost of Goods Sold
Units
Unit Cost
Total Cost
40
$6
$240
80
40
$760
$3
$300
60
$600
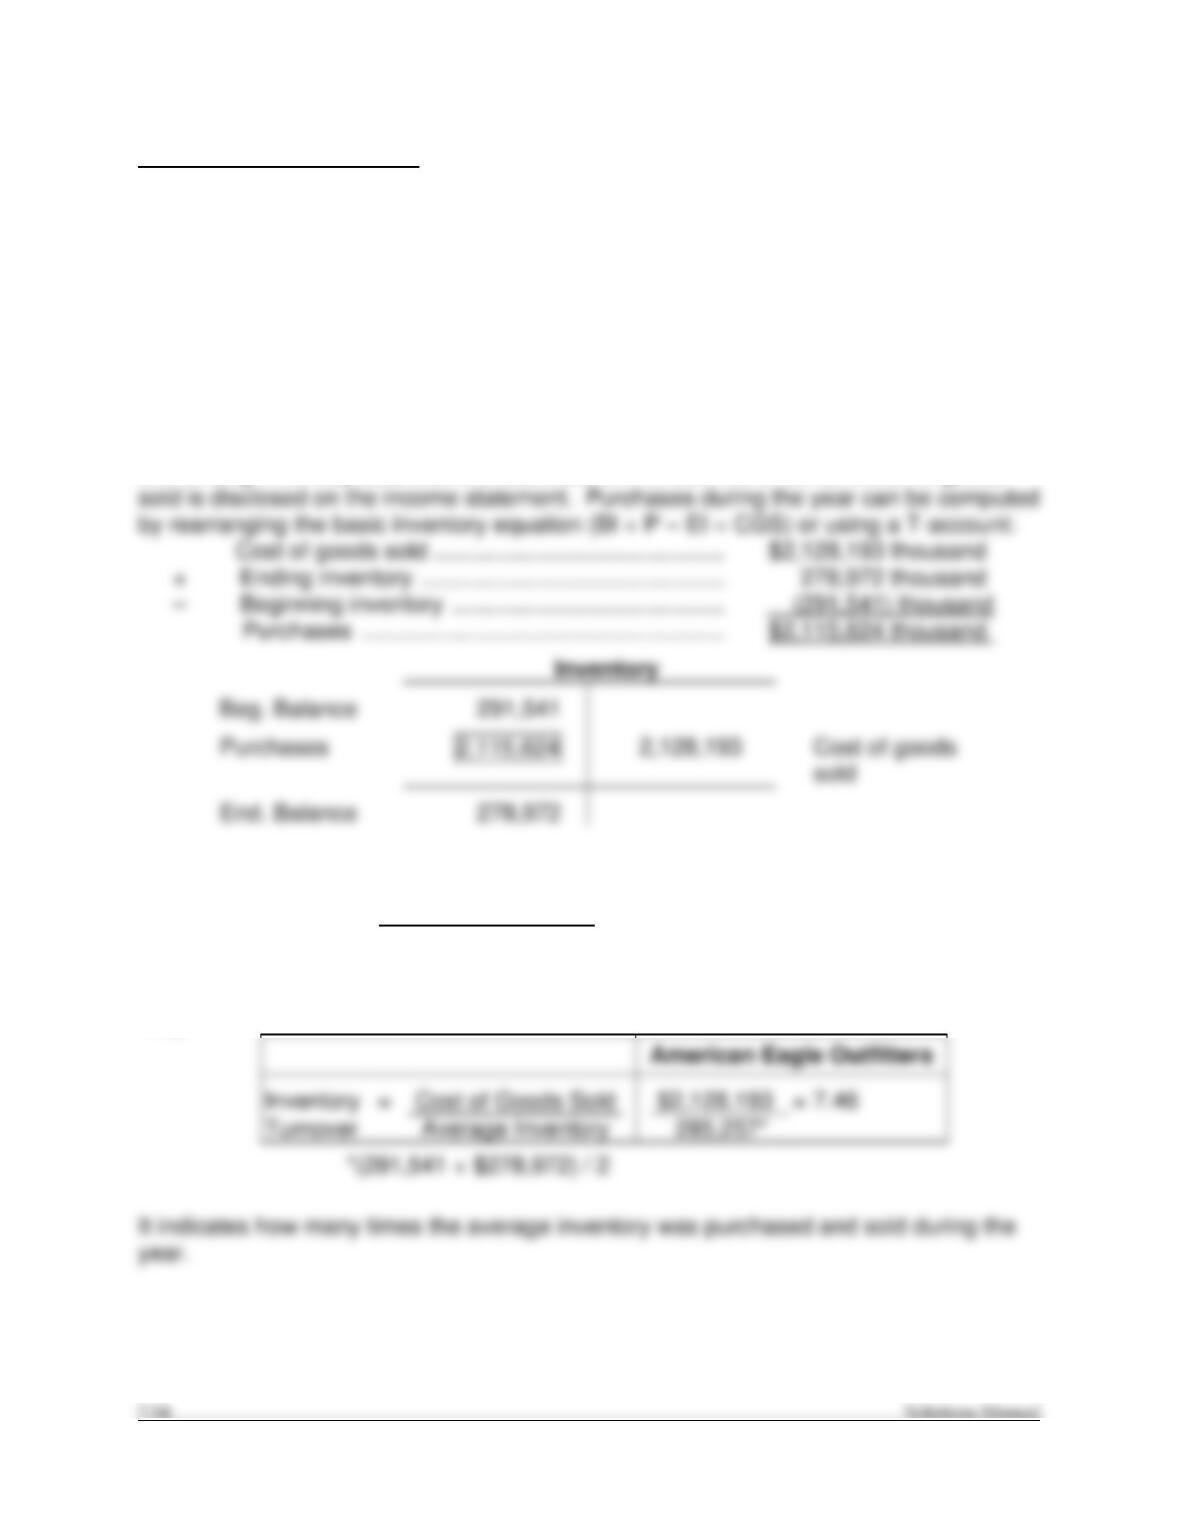
Req. 2
ITEM A.
(a) Net income: You should recommend FIFO because the lower amount of cost of
goods sold will result in higher net income.
(b) Income taxes paid: You should recommend LIFO because the higher amount of cost
of goods sold will decrease income before taxes and taxes paid.
Cost of Goods Sold
Units
Unit Cost
Total Cost
Cost of Goods Sold
Units
Unit Cost
Total Cost
CASES AND PROJECTS
ANNUAL REPORT CASES
CP7–1
Req. 1
The company held $278,972 thousand of merchandise inventory at the end of the
current year. This is disclosed on the balance sheet.
Req. 2
The company purchased $2,108,695 thousand during the current year. The beginning
and ending inventory balances are disclosed on the balance sheet and cost of goods
Req. 3
The company uses the average cost method to determine the cost of its inventory. This
is disclosed in Note 2 under “Merchandise Inventory.” It indicates that inventory is
valued at the lower of average cost or market.
Req. 4

Financial Accounting, 9/e 7-55
CP7–2.
Req. 1
Given the general trend of little or no inflation every year, it would be unlikely that the
replacement cost of Urban Outfitters’ inventory would be lower than its current book
value. And, unless a severe market downturn (or extreme change in fashion) took
Req. 2
The company uses the first-in, first-out method to determine the cost of its inventory.
This is disclosed in Note 2 under “Inventories.”
Req. 3
If the company had overstated its ending inventory by $10 million, its income before
Req. 4
Urban Outfitters
Inventory
=
Cost of Goods Sold
$2,148,147
=
6.42
Turnover
Average Inventory
334,722*

CP7–3
Req. 1
American Eagle
Outfitters
Urban Outfitters
Inventory
=
Cost of Goods Sold
$2,128,193
=
7.46
$2,148,147
=
6.42
Turnover
Average Inventory
285,257*
334,722**
Req. 2
Industry
Average
American Eagle
Outfitters
Urban Outfitters
5.05
7.46
6.42
Financial Accounting, 9/e 7-57
FINANCIAL REPORTING AND ANALYSIS CASES
CP7–4.
Req. 1 Production costs included in inventory become cost of goods sold expense on
the income statement in the period the goods are sold.
Req. 2 Since some of the current year’s production is still not sold, some of these
CP7–5.
Req. 1
Caterpillar
2011
2010
2009
Inventories – LIFO
$14,544
$9,587
$6,360
Plus: LIFO Reserve
2,422
2,575
3,022
Inventories – FIFO
$16,966
$12,162
$9,382
Cost of goods sold: LIFO
$43,578
$30,367
+ Beginning LIFO Reserve
– Ending LIFO Reserve
Cost of goods sold: FIFO
$43,731
$30,814

CP7–5. (continued)
DEERE (as provided)
2011 LIFO 5.9
2011 FIFO 4.2
Req. 2
In all three cases, the ratio is higher under LIFO than FIFO. The LIFO beginning and
Req. 3
The FIFO inventory turnover ratio is normally thought to be a more accurate indicator
when prices are changing because LIFO can include very old inventory prices in ending
CRITICAL THINKING CASES
CP7–6.
1. The press release states that management believes LIFO is more appropriate
2. The decrease in pre-tax income was $28,165,000. Thus, ending inventory was
decreased by $28,165,000 and cost of goods sold was increased by $28,165,000.
Since the company is in the 35% tax bracket, this resulted in a decrease in tax
expense of .35 x $28,165,000 = $9,858,000 (rounded to the nearest thousand) and
a decrease in net income of $18,307,000.
3. This $9,858,000 tax postponement is significant and is likely to be the main reason
that management adopted LIFO. A decrease in net income is normally a negative

7-60 Solutions Manual
CP7–7.
To: The Files
From: The New Staff Member
Re: Effect of restatement
1. The Company understated purchases by $47.3 million. This causes cost of
goods sold to be understated and pre-tax income to be overstated by $47.3
million. Net income is overstated by that amount times 1 – tax rate:
$47.3 x (1 – .404) = $28.2 million overstatement
3. If it is assumed that bonuses are a fixed portion of net income, the bonus rate
can be roughly estimated using the amounts computed in parts 1 and 2.
Change in bonus = Bonus rate per dollar of net income
Change in net income
4. The Board likely tied management compensation to net income to align the
interests of management with that of shareholders. Typically, increases in net
FINANCIAL REPORTING AND ANALYSIS PROJECTS
CP7–8.
The solution to this case will depend on the company and/or accounting period selected
for analysis.