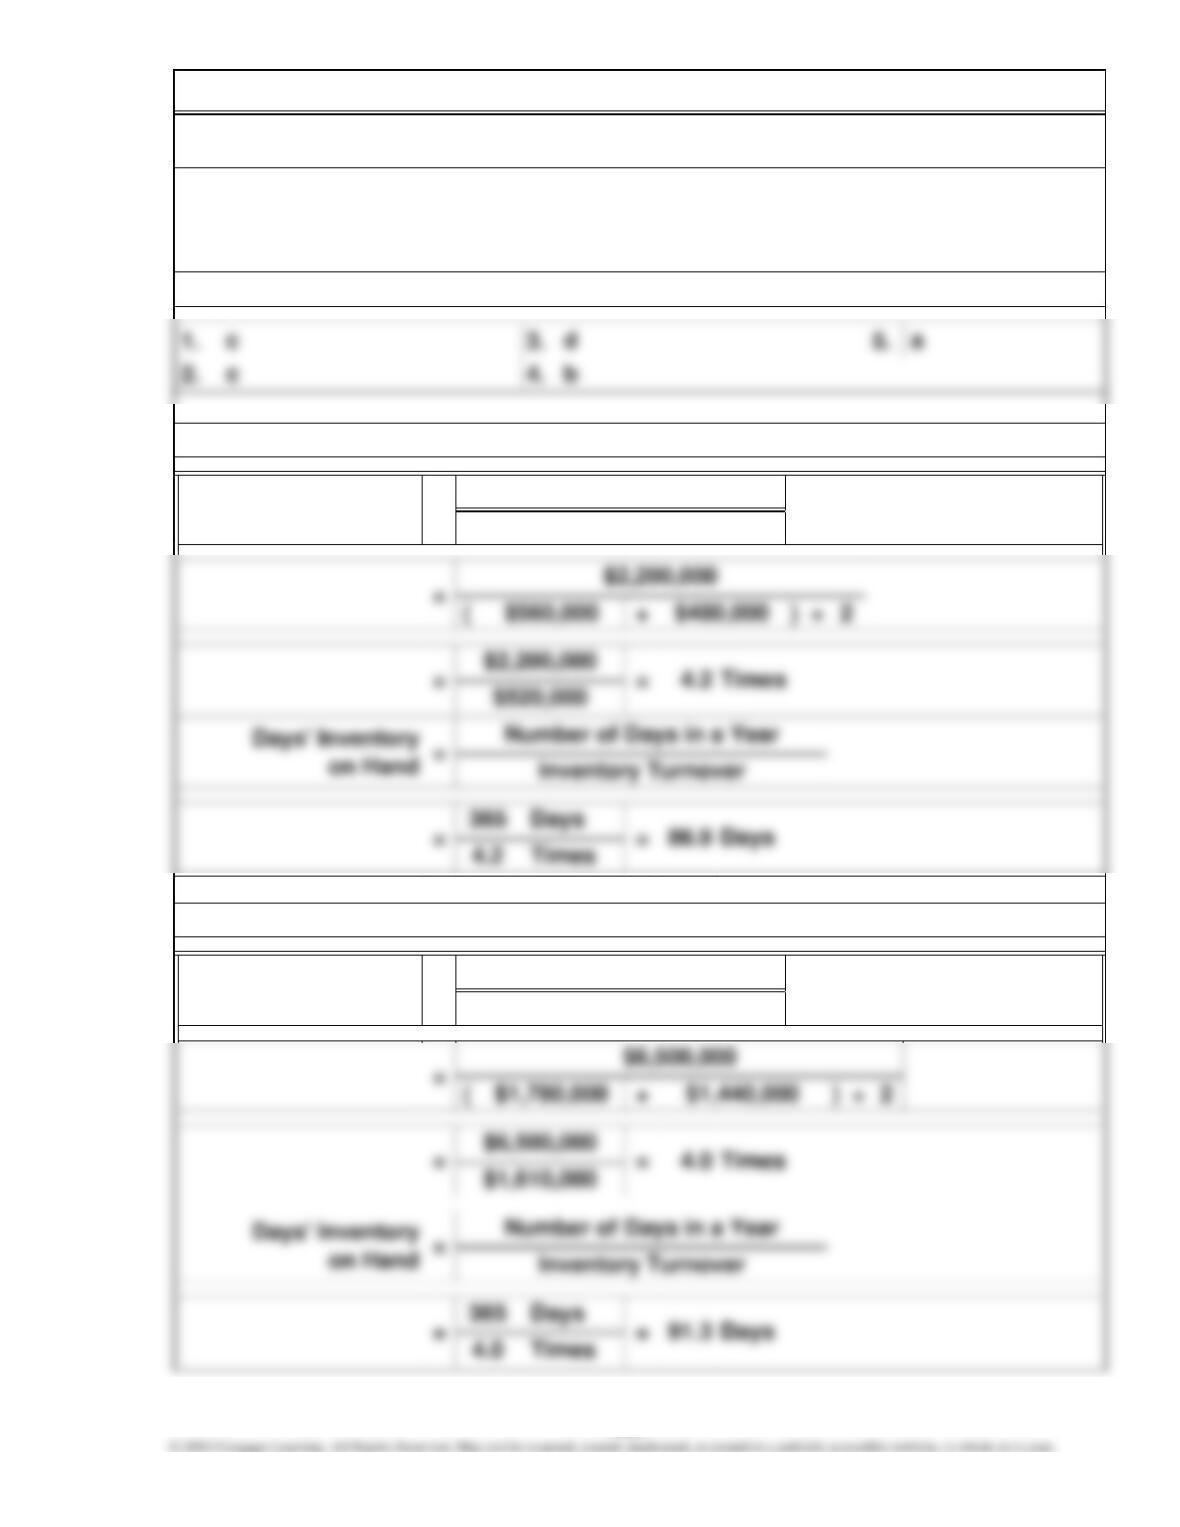
Average Inventory
Inventory Turnover
Cost of Goods Sold
CHAPTER 6—Solutions
INVENTORIES
Chapter 6, SE 1.
=
Chapter 6, SE 2.
Cost of Goods Sold
Average Inventory
=
Inventory Turnover
Chapter 6, SE 3.
295
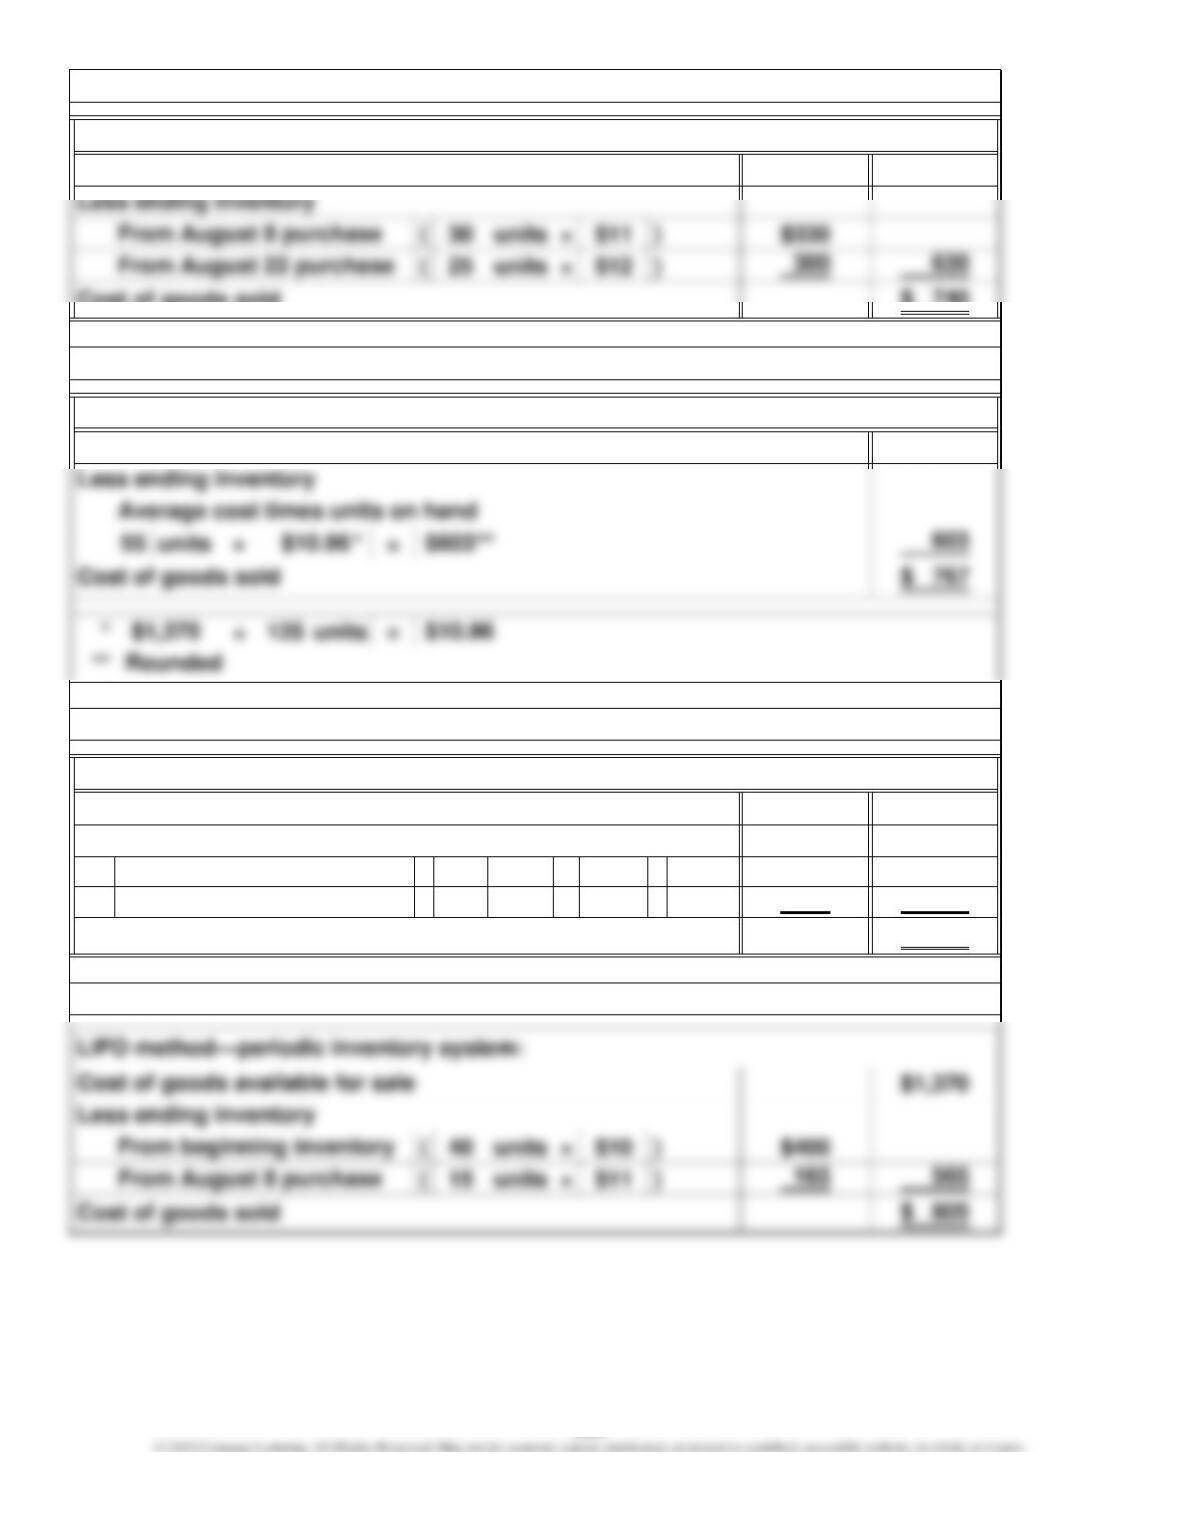
$1,370
$ 740
$1,370
$1,370
( 35 units × $12 ) $420
( 20 units × $11 ) 220 640
$ 730
Chapter 6, SE 6.
Average-cost method—periodic inventory system:
Cost of goods sold
Cost of goods available for sale
Chapter 6, SE 4.
Cost of goods available for sale
Specific identification method:
Cost of goods sold
From August 22 purchase
Chapter 6, SE 5.
Less ending inventory
Chapter 6, SE 7.
From August 8 purchase
FIFO method—periodic inventory system:
Cost of goods available for sale
296
Average-
Cost FIFO LIFO
Method Method Method
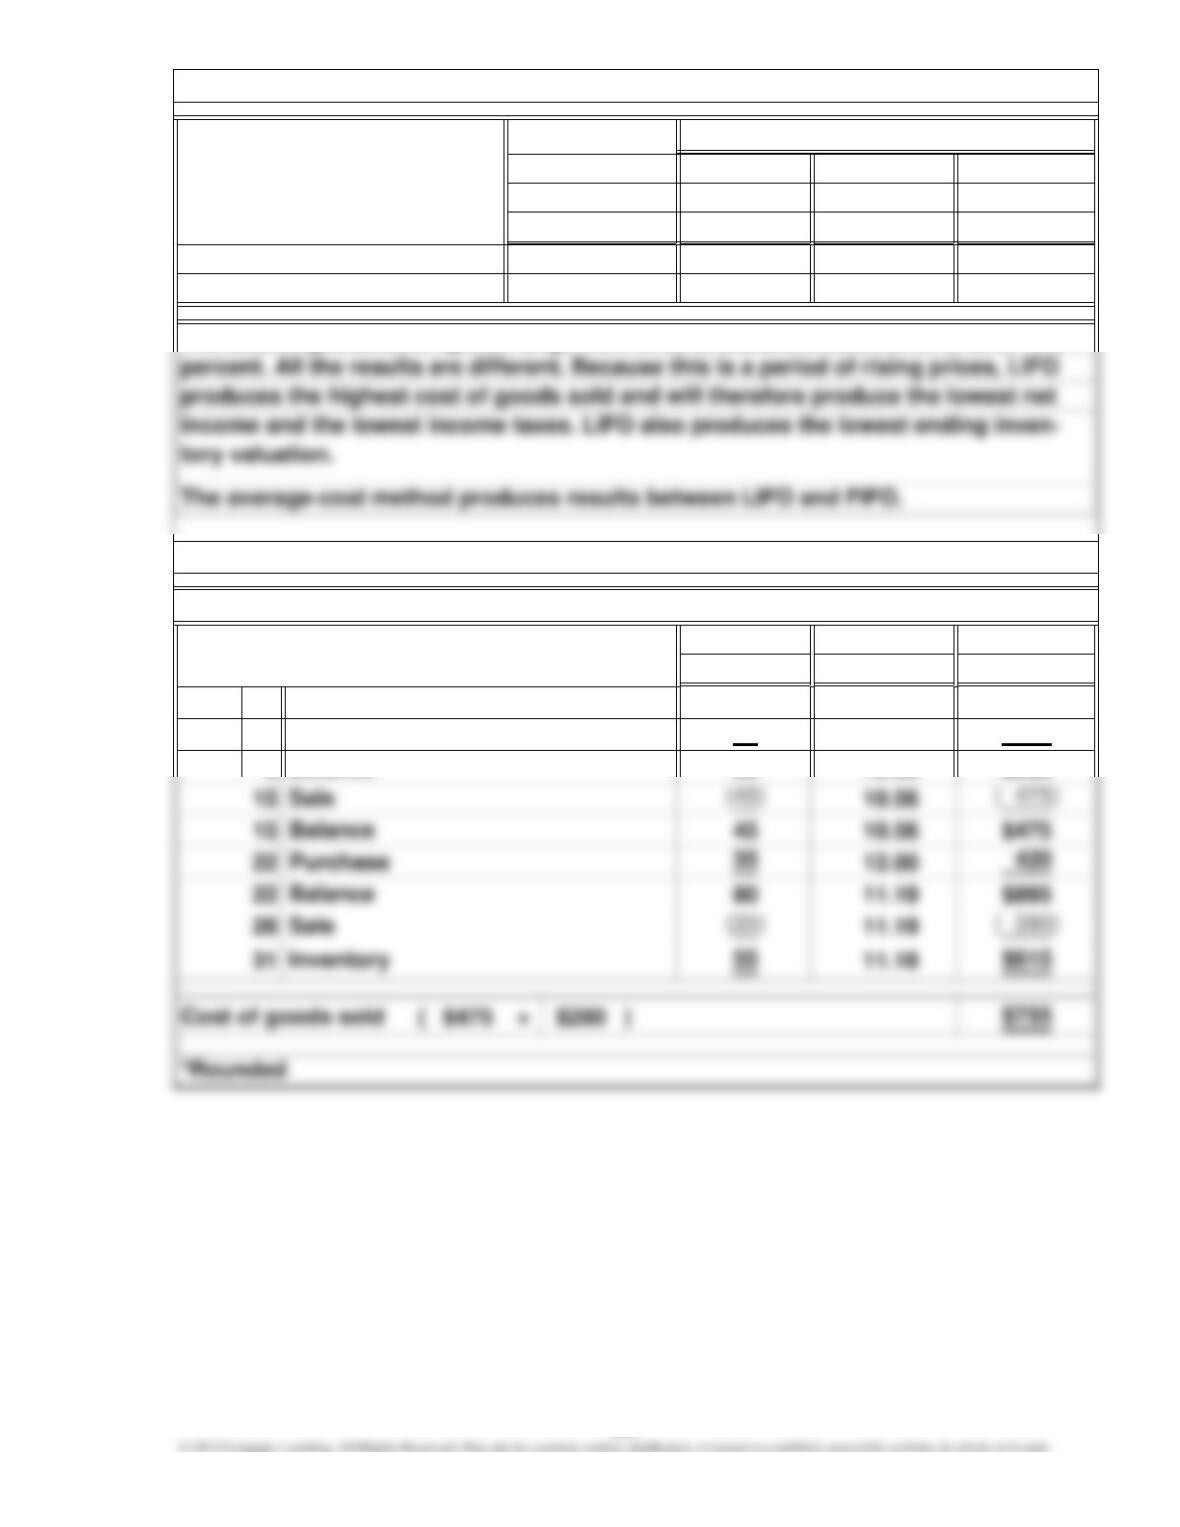
$603 $640 $565
767 730 805
Cost
Units per Unit* Amount*
Aug. 1 40 $10.00 $400
850 11.00 550
8 90 10.56 $950
The cost of goods sold figures range from $730 to $805, a difference of $75, or 10.3
Ending inventory
Cost of goods sold
$630
740
Average-cost method—perpetual inventory system:
Chapter 6, SE 9.
Chapter 6, SE 8.
Specific
Identification
Method
Periodic Inventory System
Inventory
Purchase
Balance
297
Cost
Units per Unit
Aug. 1 40 $10 $400
850 11 550
8 40 10 $400
Purchase
Balance
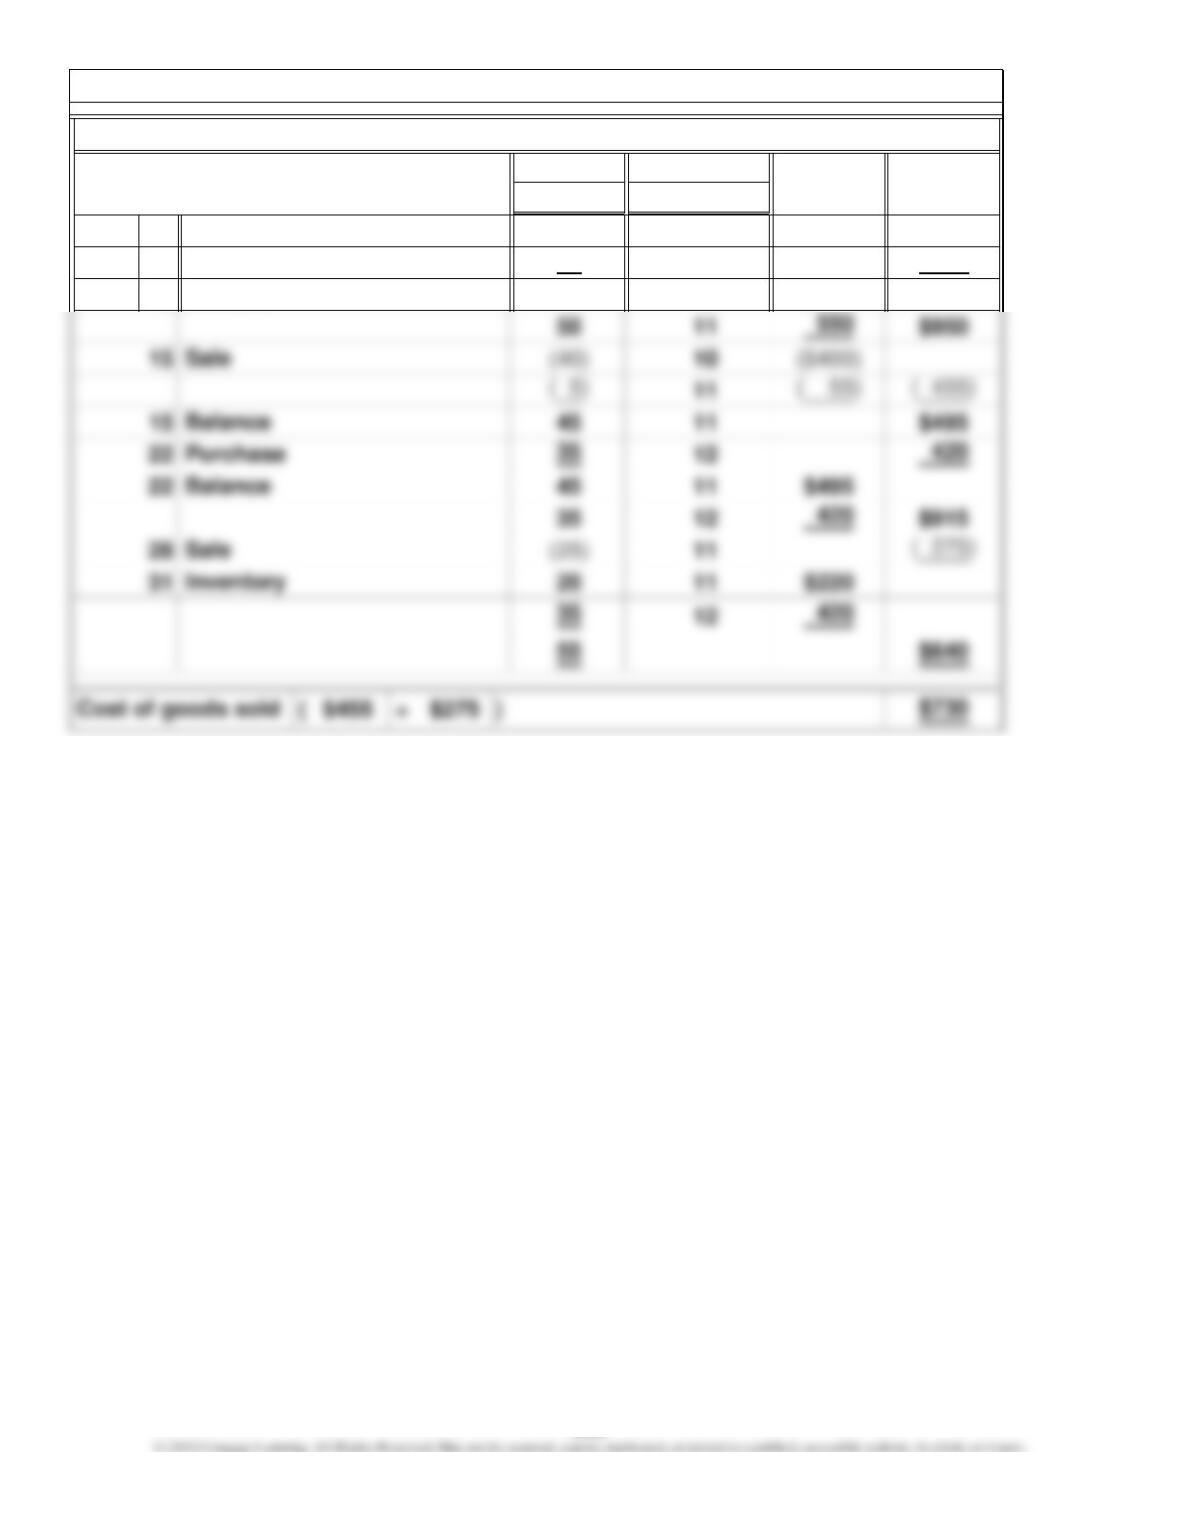
FIFO method—perpetual inventory system:
Inventory
Chapter 6, SE 10.
298
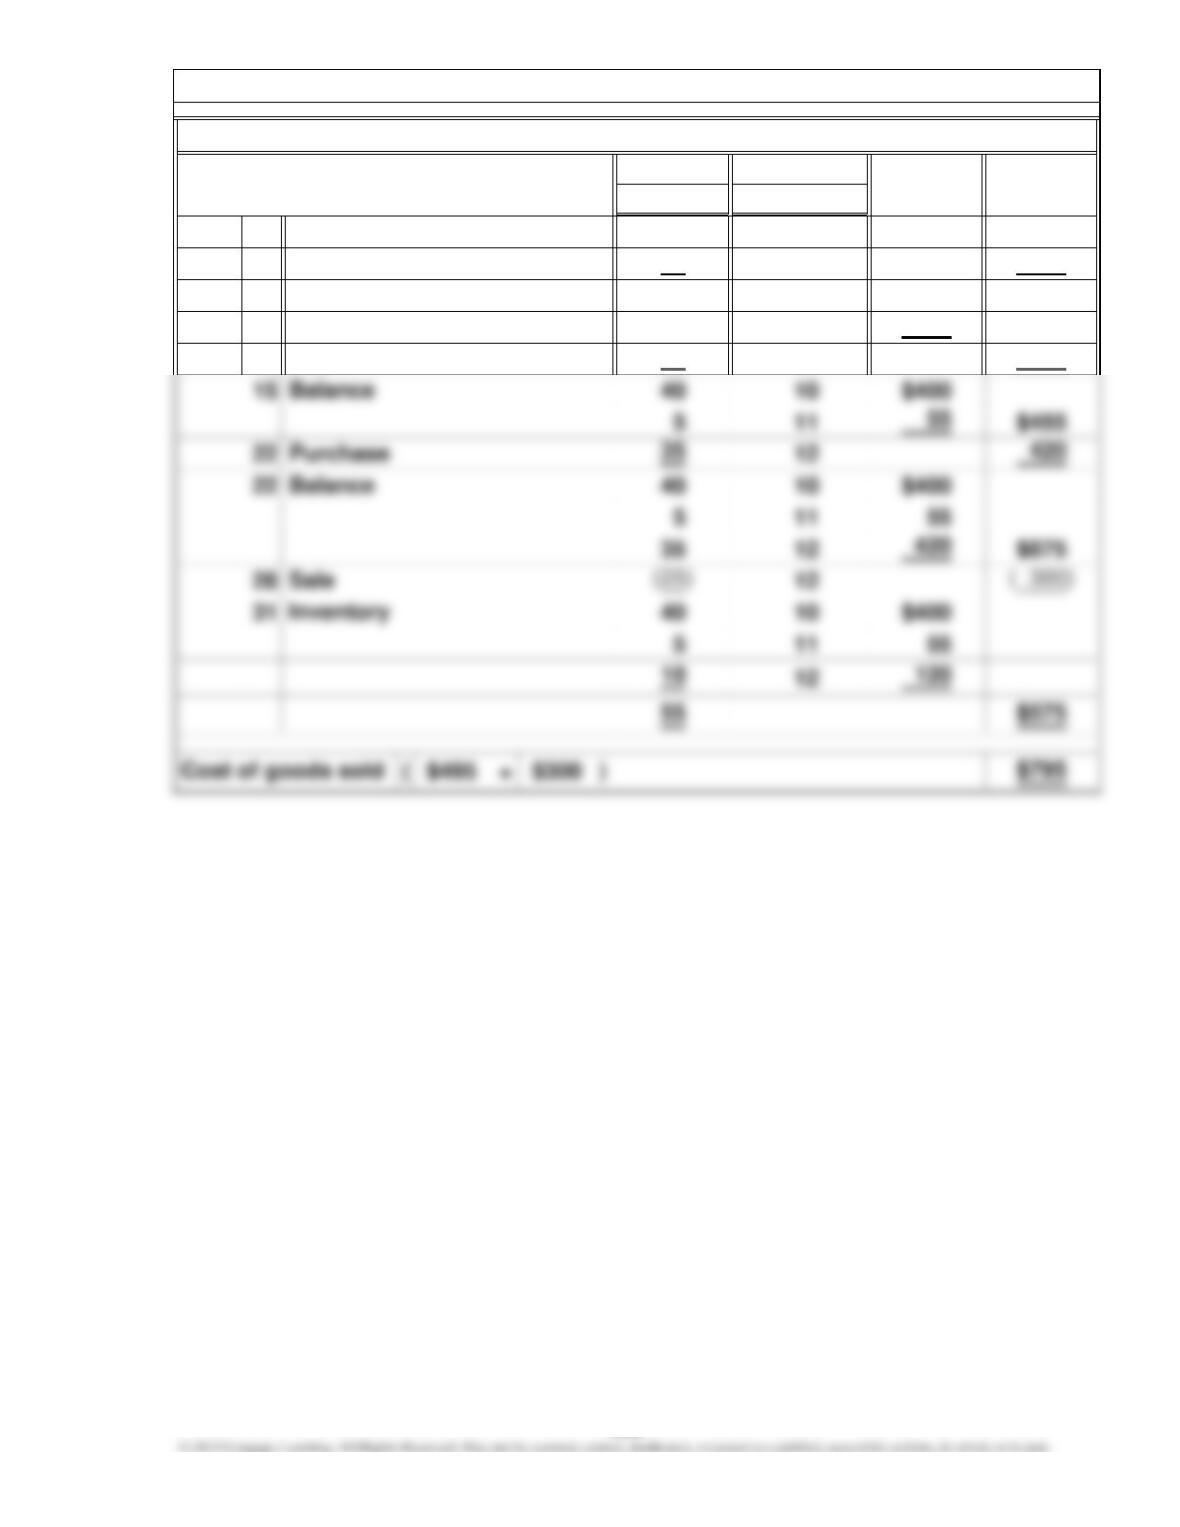
Cost
Units per Unit
Aug. 1 40 $10 $400
850 11 550
8 40 10 $400
50 11 550 $950
15 (45) 11 ( 495)
Chapter 6, SE 11.
LIFO method—perpetual inventory system:
Balance
Sale
Inventory
Purchase
299
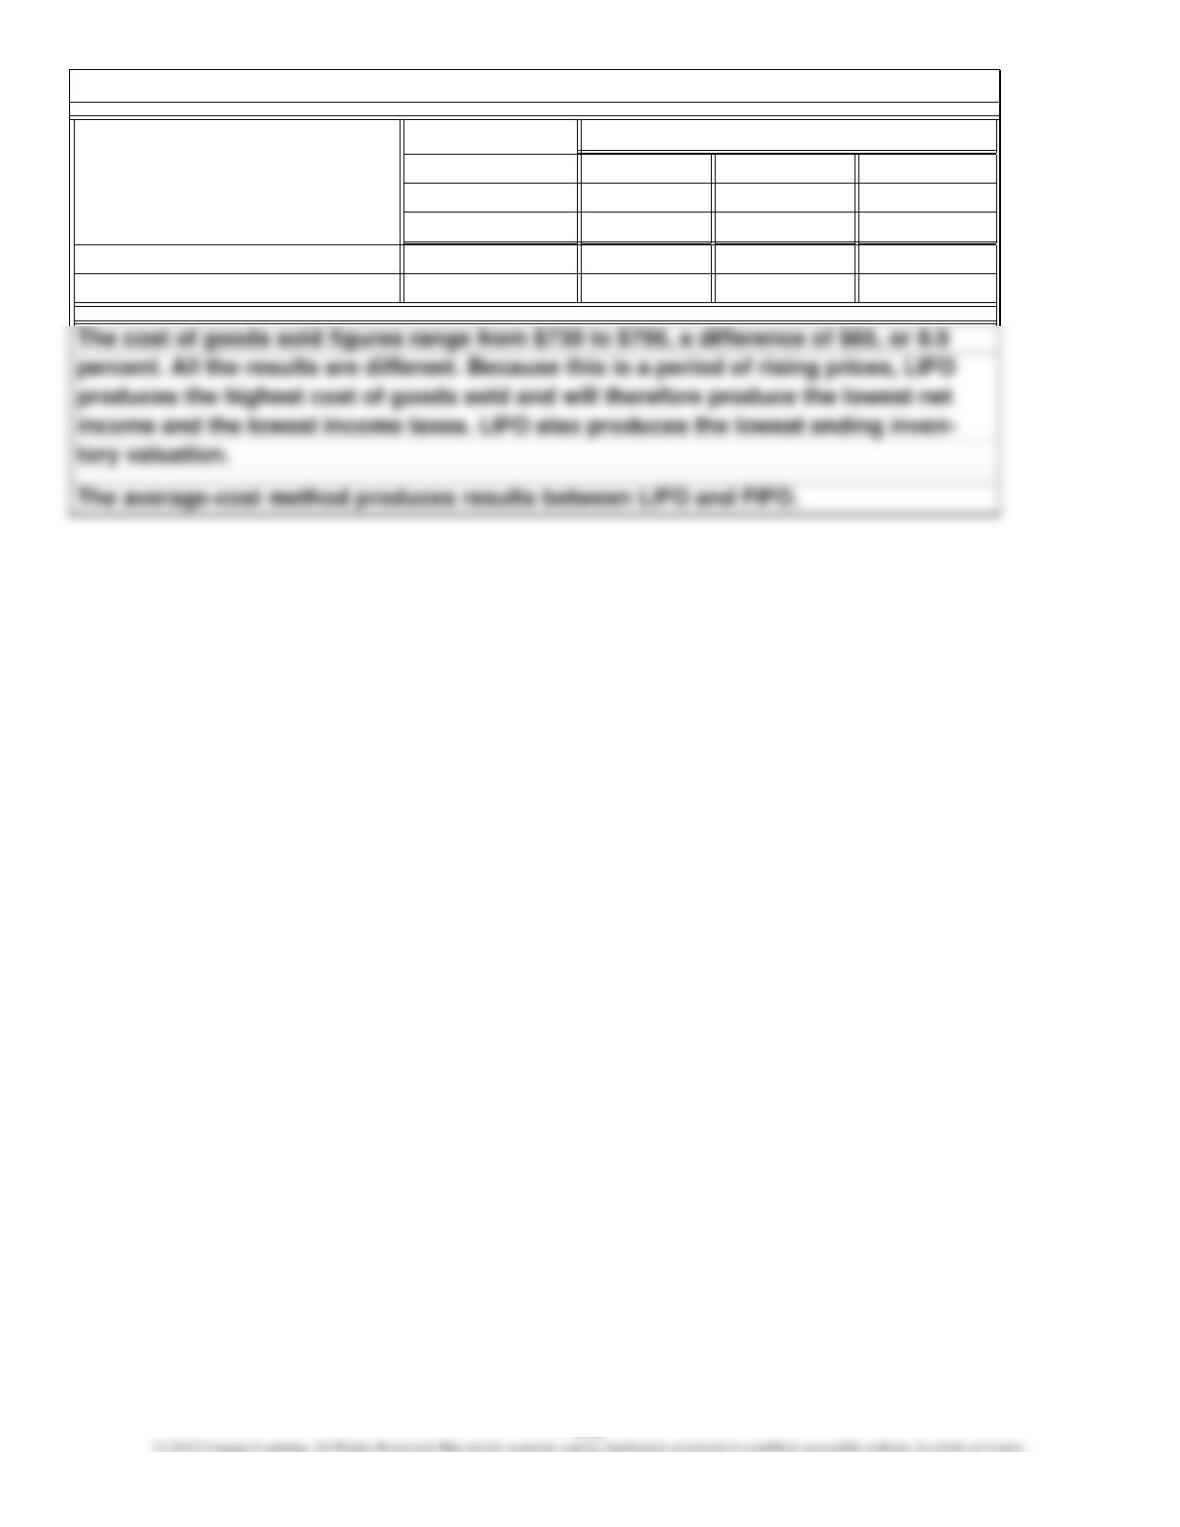
Average-
Cost FIFO LIFO
Method Method Method
$615 $640 $575
755 730 795
Method
$630
Chapter 6, SE 12.
Perpetual Inventory System
Cost of goods sold
Identification
Specific
740
Ending inventory
300
1.
1.
2.
Chapter 6, E 2.
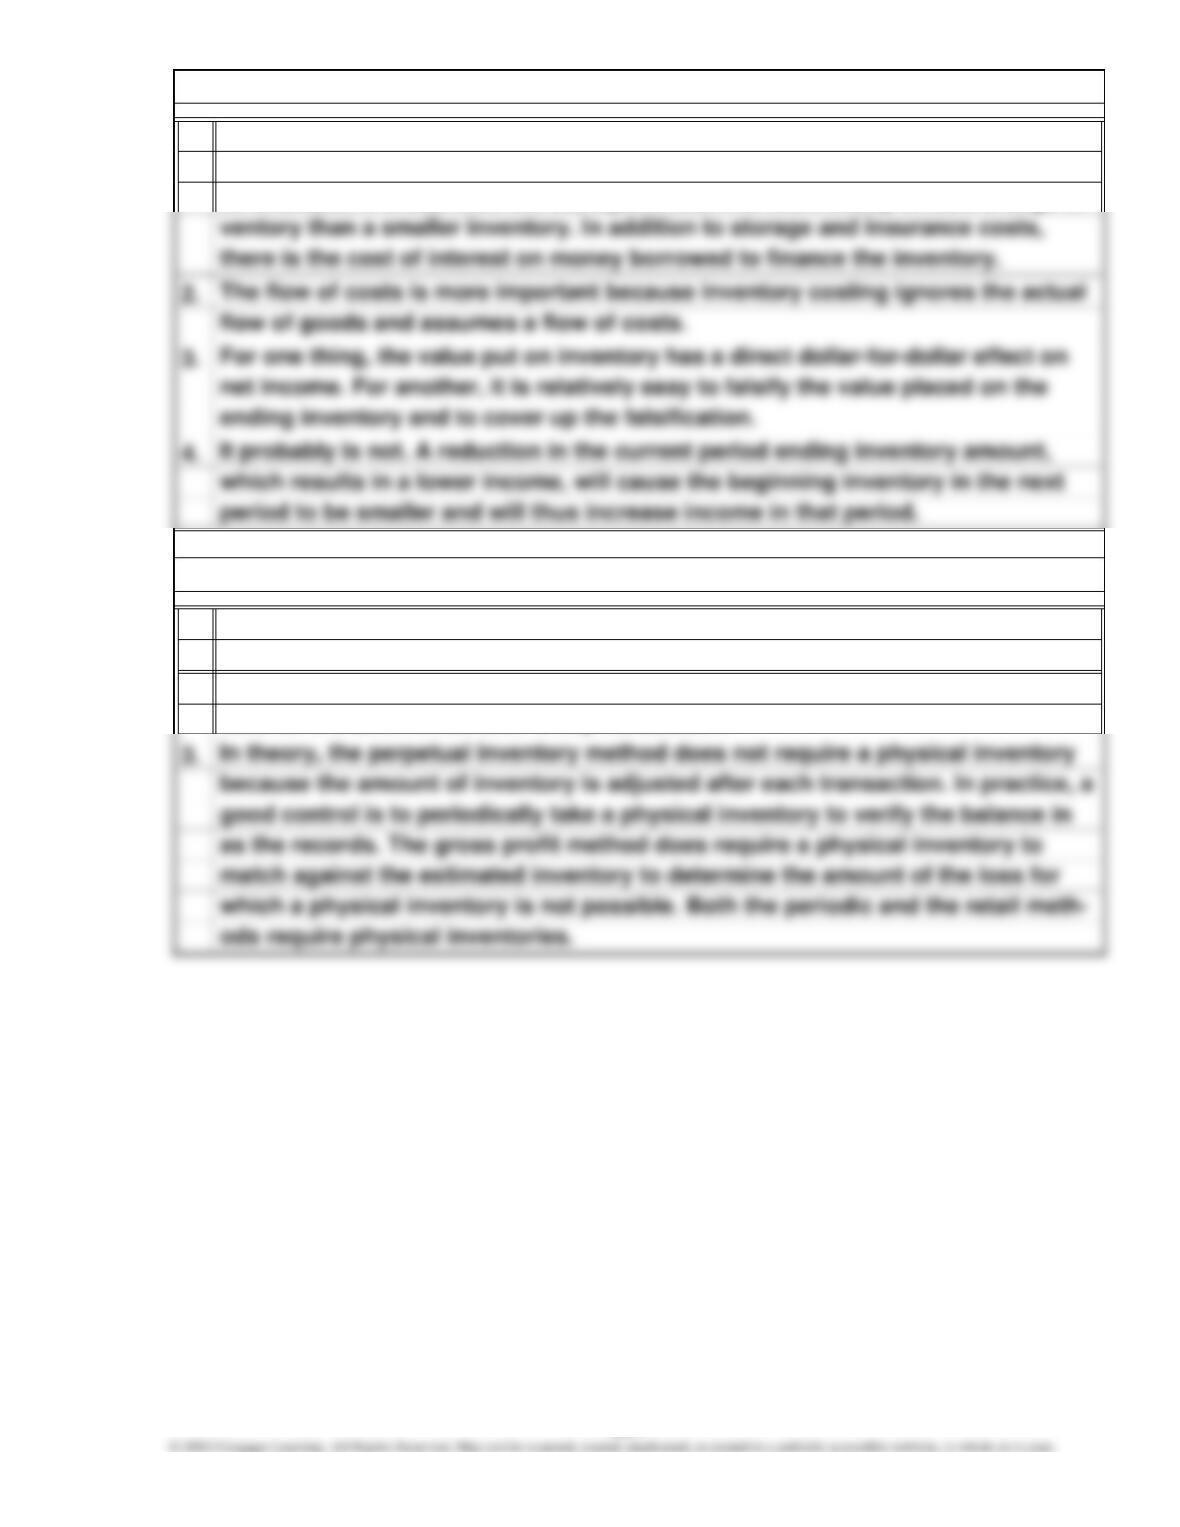
The four methods would produce the same results if there were no price changes
after the purchase of the beginning inventory.
Under the perpetual inventory method, the cost of goods sold and the inventory
balance are determined after every transaction.
be available. It is bad from the standpoint that it is more costly to have a large in-
It is both good and bad for a retail store to have a large inventory. It is good from
the standpoint that customers want a large selection and they want the items to
Chapter 6, E 1.
301
1.
2.
( + ) ÷ 2
=$450,000
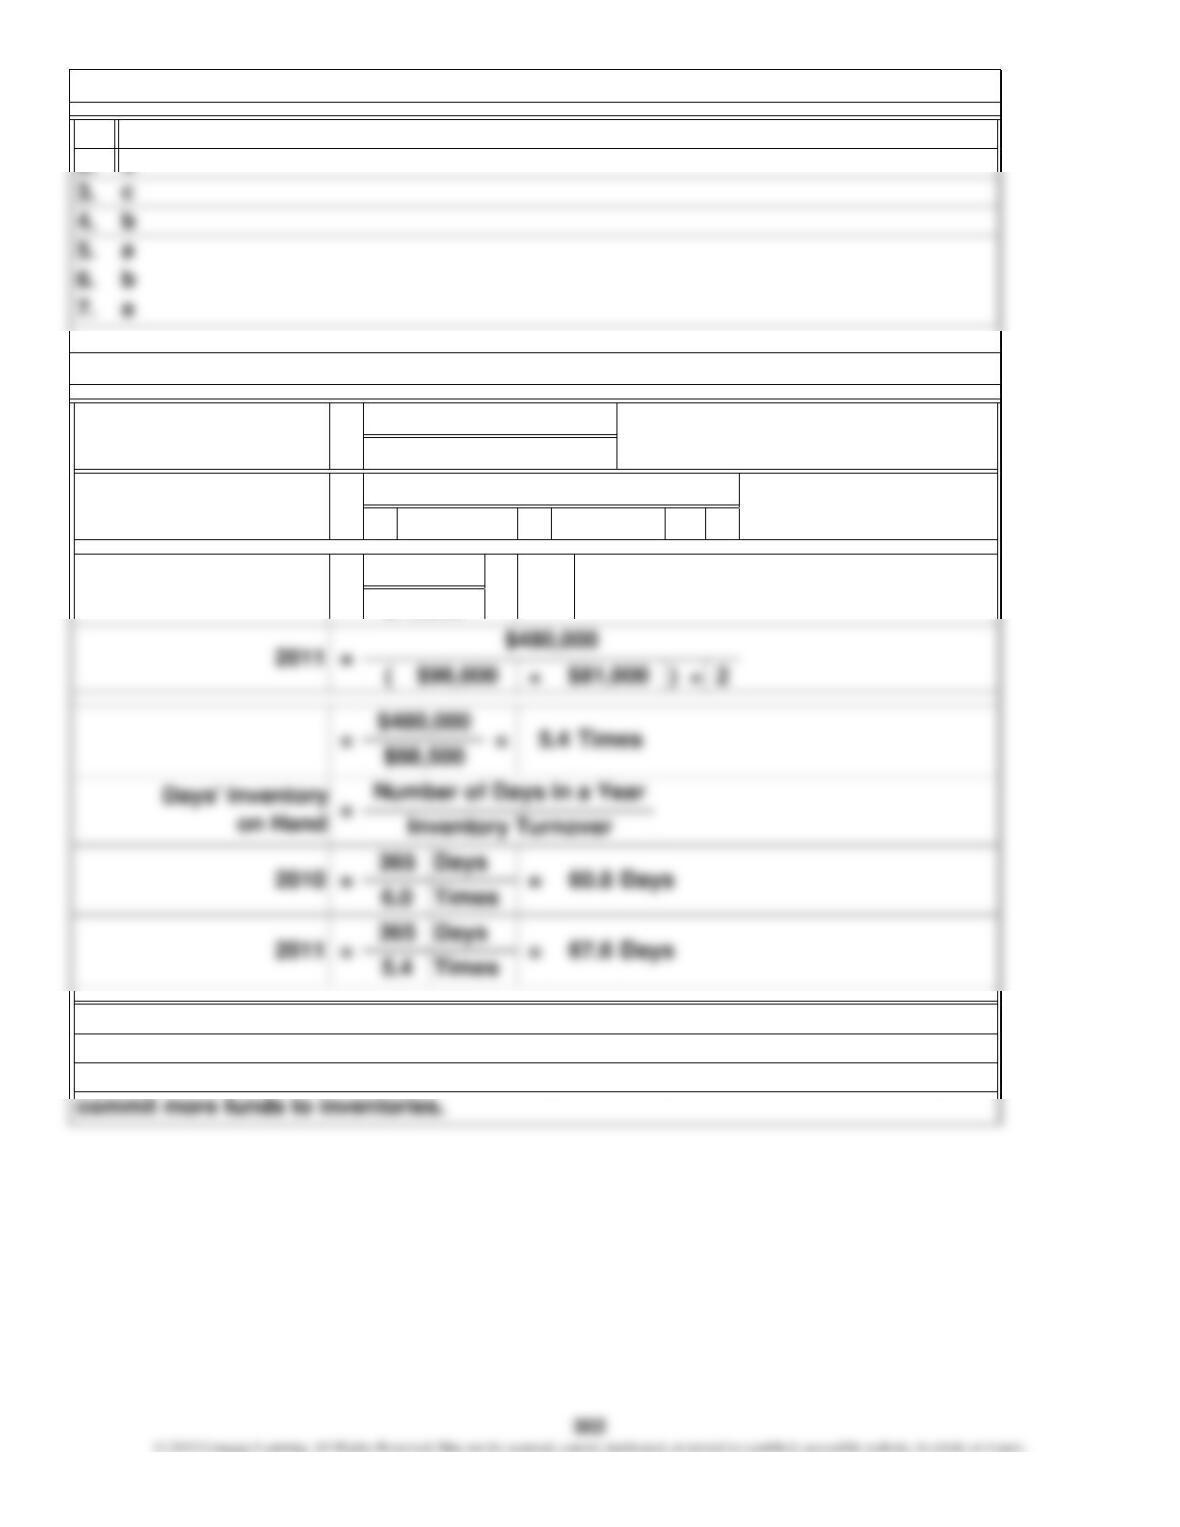
2010 = $450,000
$69,000
= 6.0
$81,000
Times
$75,000
Cost of Goods Sold
Average Inventory
Inventory Turnover =
c
Chapter 6, E 3.
d
Chapter 6, E 4.
Just a Buck Discount Stores’ inventory is increasing much faster than its sales. As
a result, the inventory turnover is decreasing and days’ inventory on hand is increas-
ing. This is a negative trend that will reduce profitability and require the company to
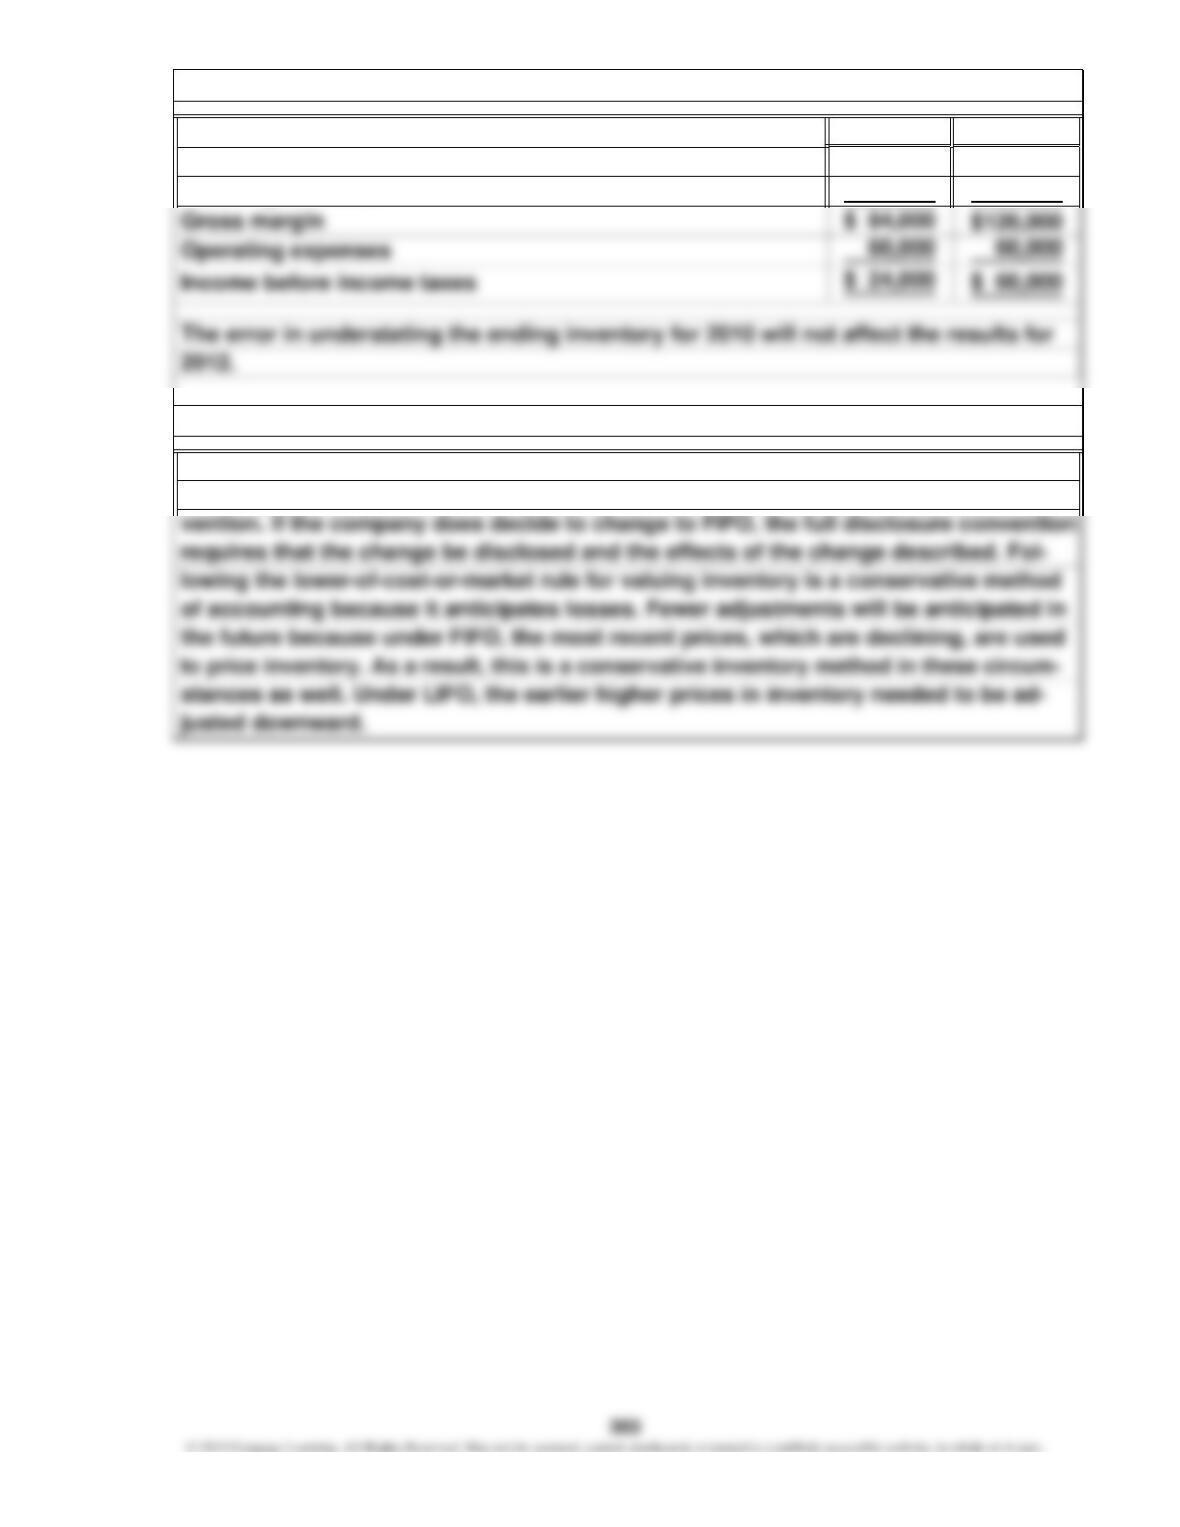
2011 2010
$252,000 $210,000
168,000 90,000
According to the convention of consistency, a company must follow the same ac-
counting principles from year to year. Thus, a change to FIFO would violate this con-
Chapter 6, E 6.
Chapter 6, E 5.
Sales
Cost of goods sold
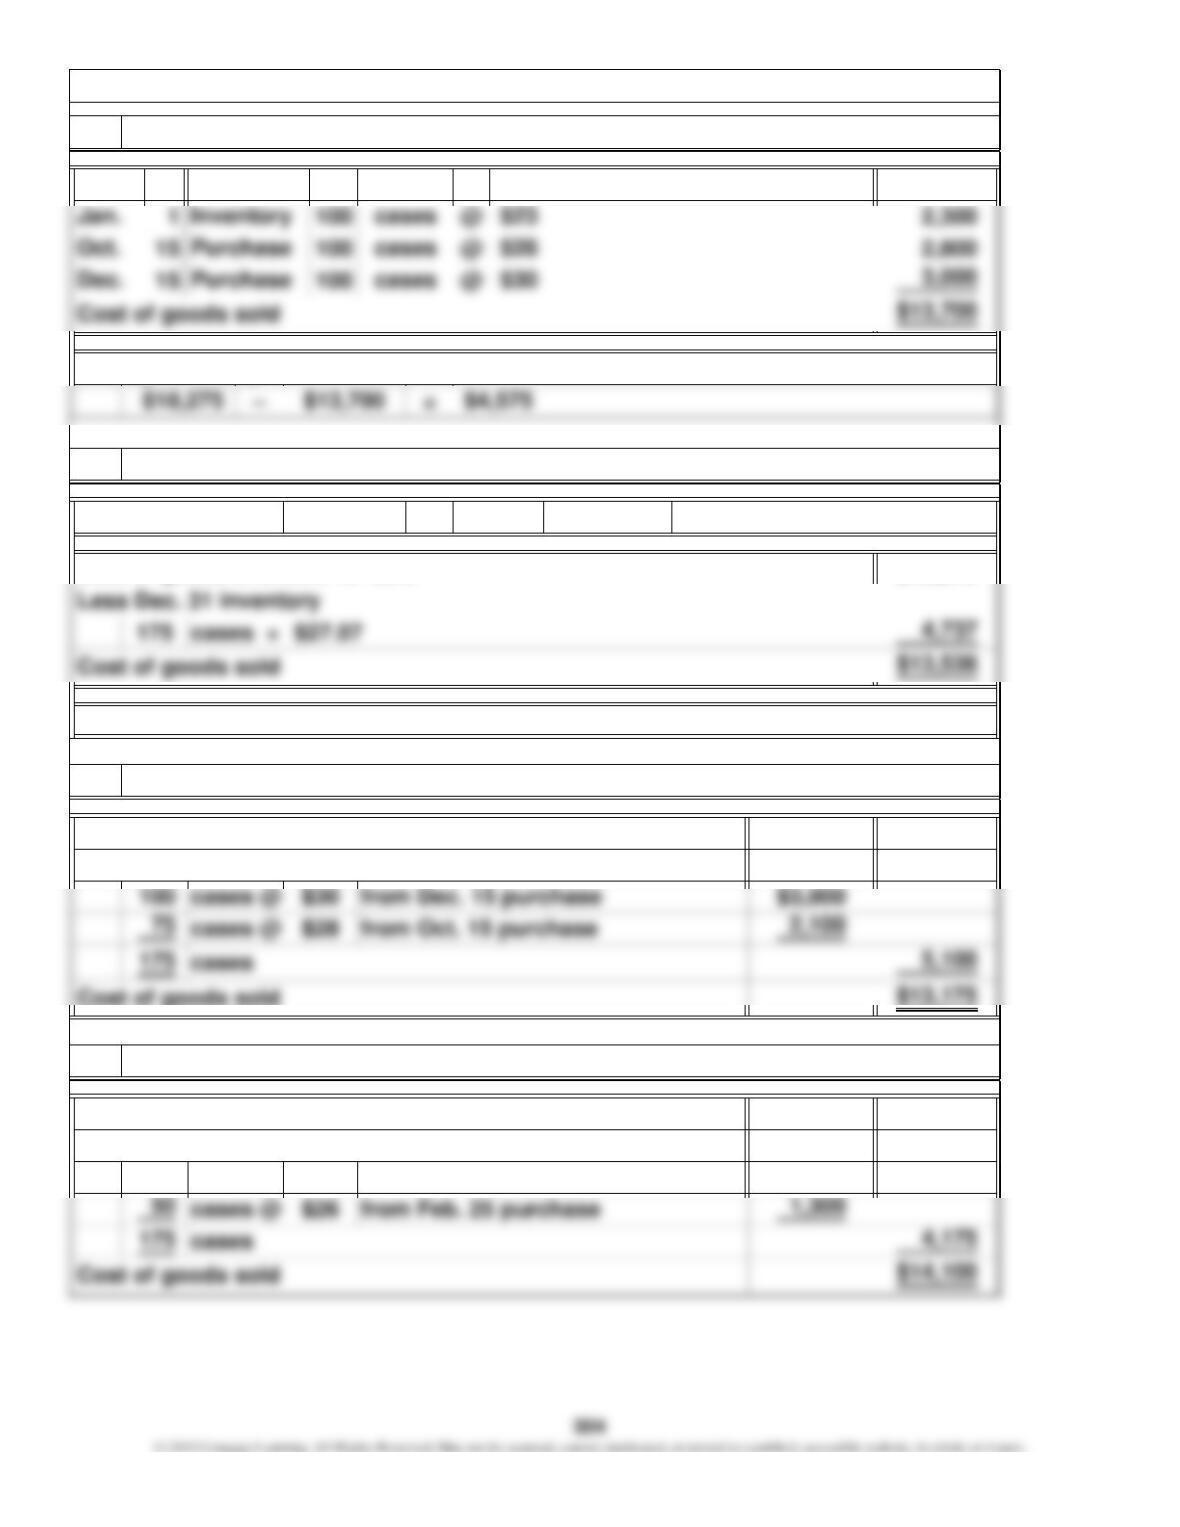
15 200 @ $ 5,600
÷ cases =
$18,275
$18,275
$18,275
Ending inventory
Purchase
Chapter 6, E 7.
1. Inventory costs assigned by the specific identification method
June cases
*Rounded
2.
$18,275 $27.07
Inventory costs assigned by the average-cost method
675
3.
Average unit cost:
Cost of goods available for sale
Inventory costs assigned by the FIFO method
$2,875$23cases @
Less Dec. 31 inventory
Cost of goods available for sale
from Jan. 1 inventory
$28
Cost of goods available for sale
125
Less Dec. 31 inventory
4.
Inventory costs assigned by the LIFO method
*
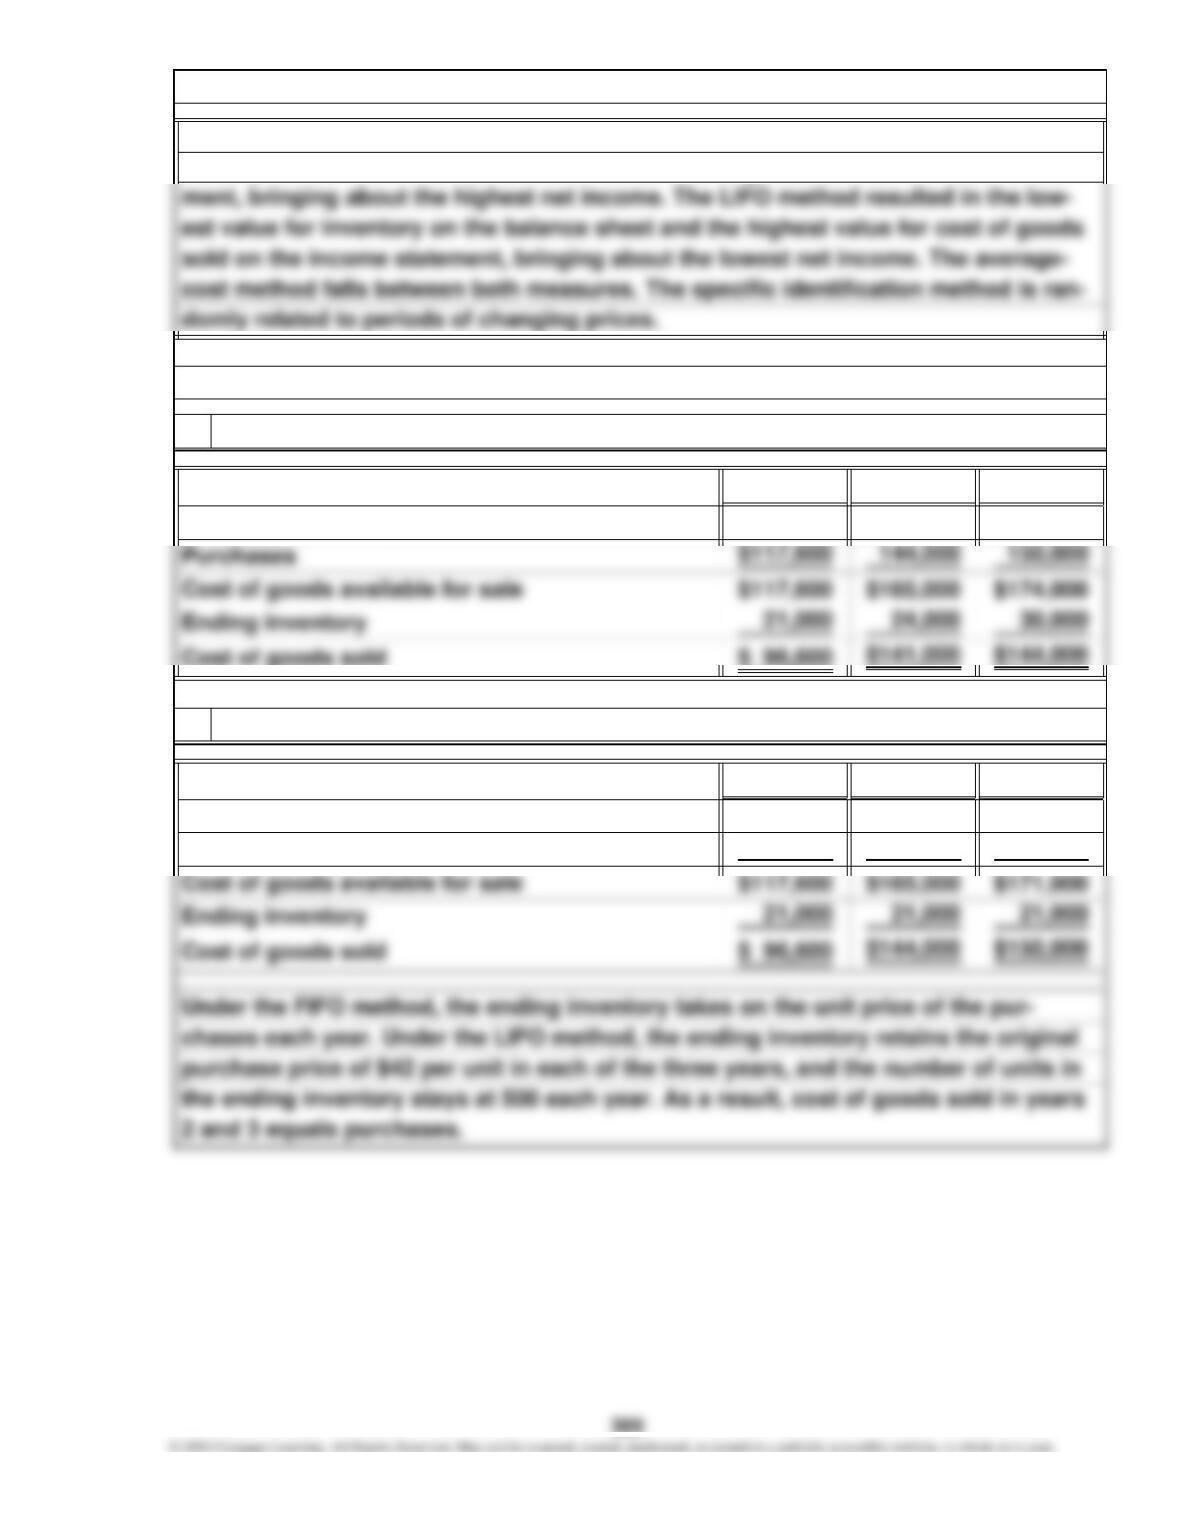
Year 1 Year 2 Year 3
— $ 21,000 $ 24,000
Year 1 Year 2 Year 3
— $ 21,000 $ 21,000
$117,600 144,000 150,000
Beginning inventory
Purchases
2. Cost of goods sold computed by LIFO method
Beginning inventory
Chapter 6, E 8.
1. Cost of goods sold computed by FIFO method
Chapter 6, E 7. (Continued)
In this period of rising prices, the FIFO method resulted in the highest value for in-
ventory on the balance sheet and the lowest cost of goods sold on the income state-
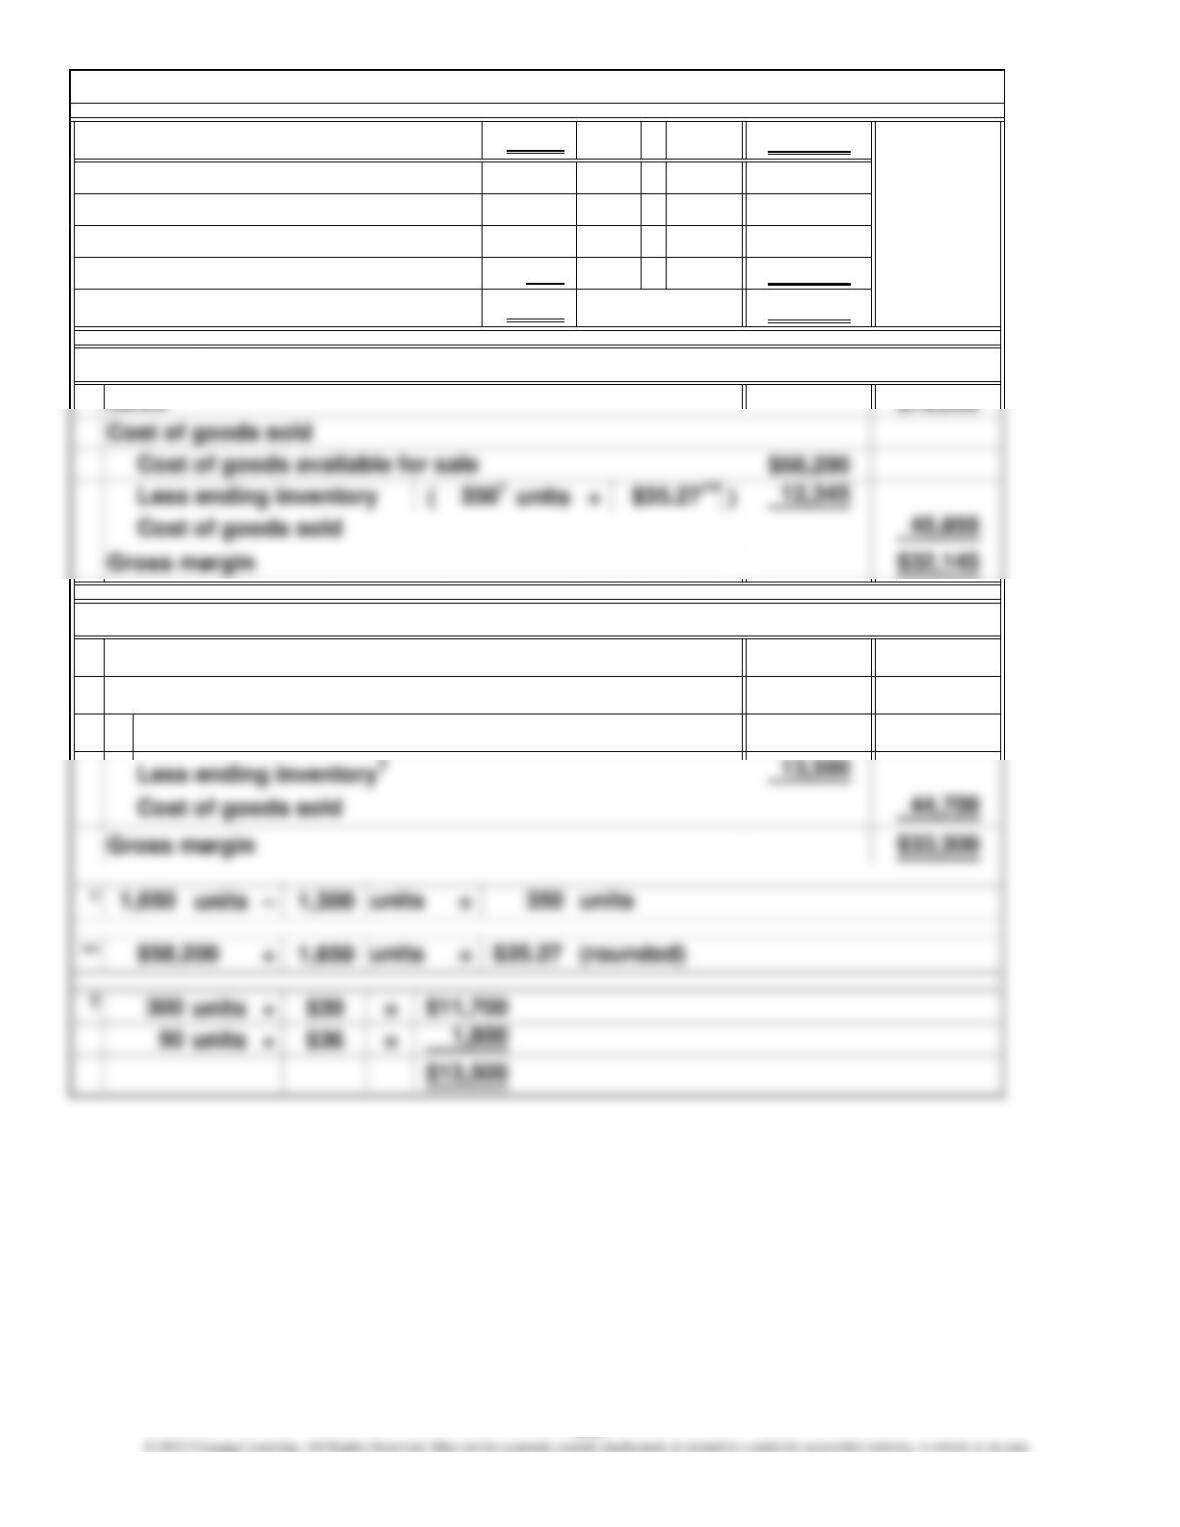
units × $78,000
units × $ 4,500
units × 13,200
units × 28,800
units × 11,700
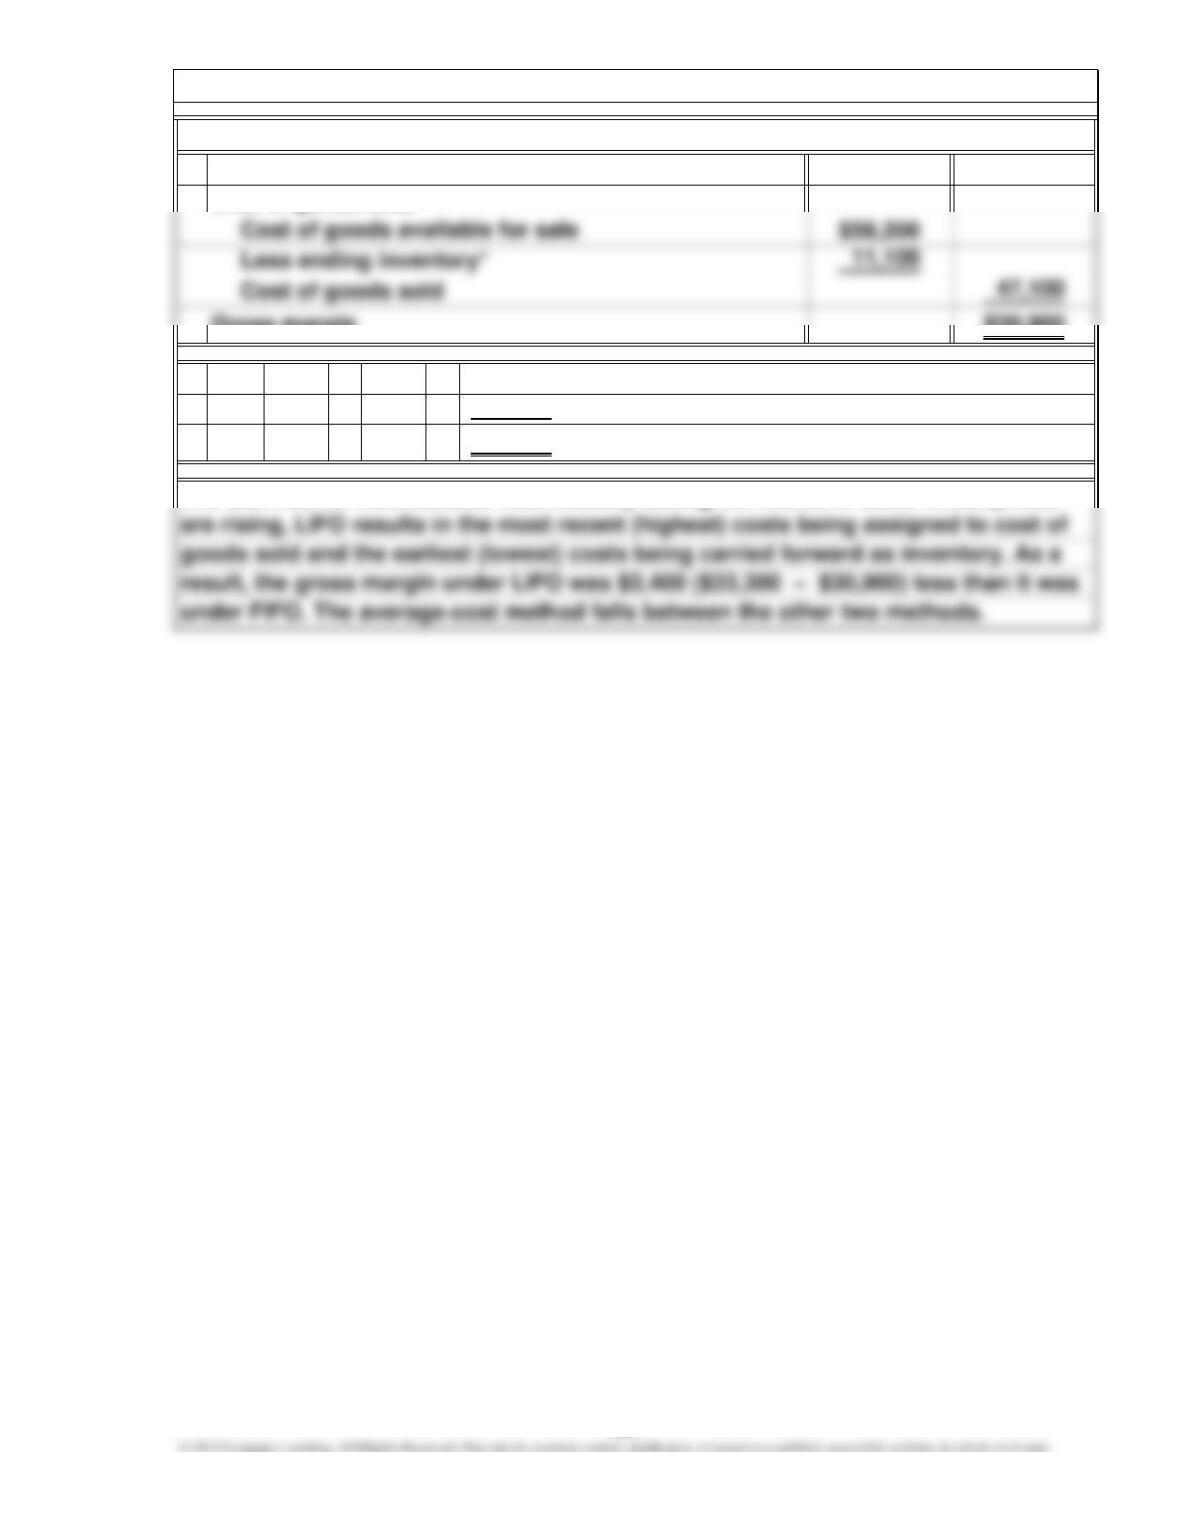
$58,200
$78,000
$58,200
Chapter 6, E 9.
$60
$33
300
Cost of goods available for sale
Periodic inventory system—FIFO method:
$30
Periodic inventory system—average-cost method:
Sales
Beginning inventory
Purchases 400
Sales
1,650
1,300
150
800
Sales
Cost of goods sold
Cost of goods available for sale
units
$36
$39
306
$78,000
$30,900
* units × $30 =
units × $33 =
Gross margin
$11,100
Cost of goods sold
200
Sales
150 $ 4,500
The unit cost of merchandise rose steadily during the month of June. When prices
Chapter 6, E 9. (Continued)
Periodic inventory system—LIFO method:
6,600
307
FIFO LIFO
Method Method
×$2,400,000 $2,400,000
20,000 × $ 240,000 $ 240,000
FIFO ( × $15 150,000
LIFO ( × $12 _________ 120,000
$1,680,000 $1,710,000
120,000
Sales
$20
Cost of goods sold
Beginning inventory
$12
Chapter 6, E 10.
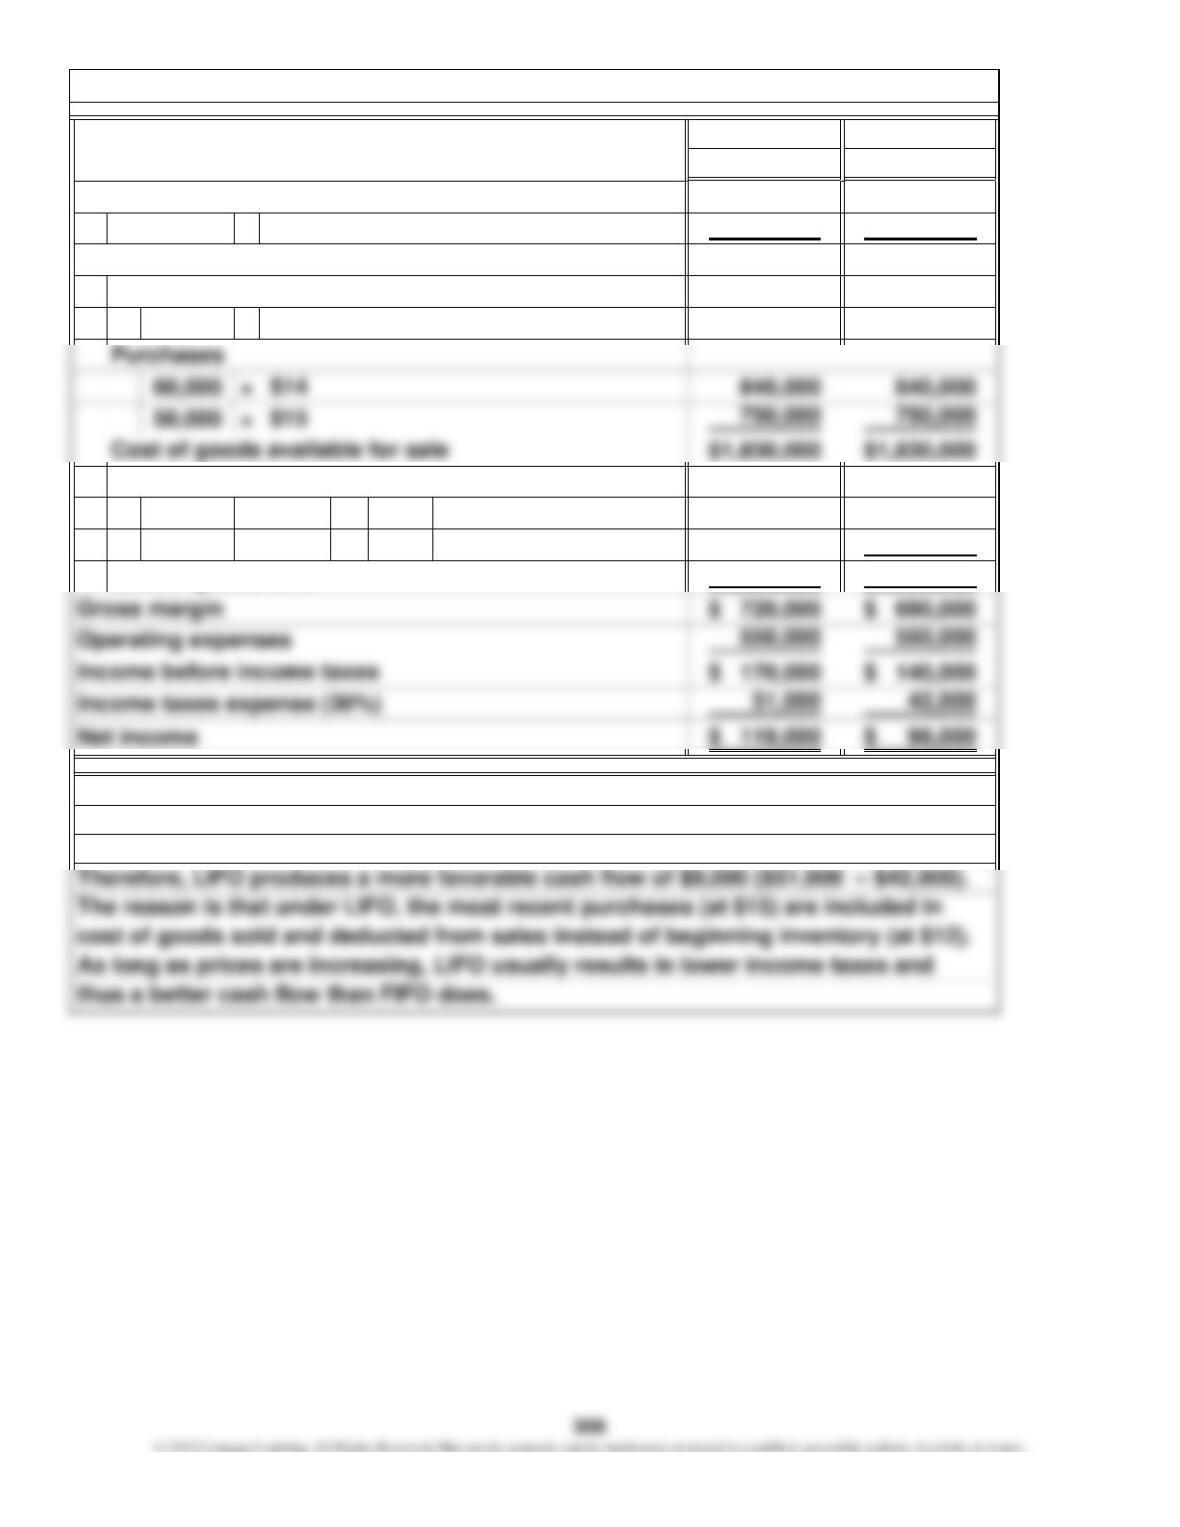
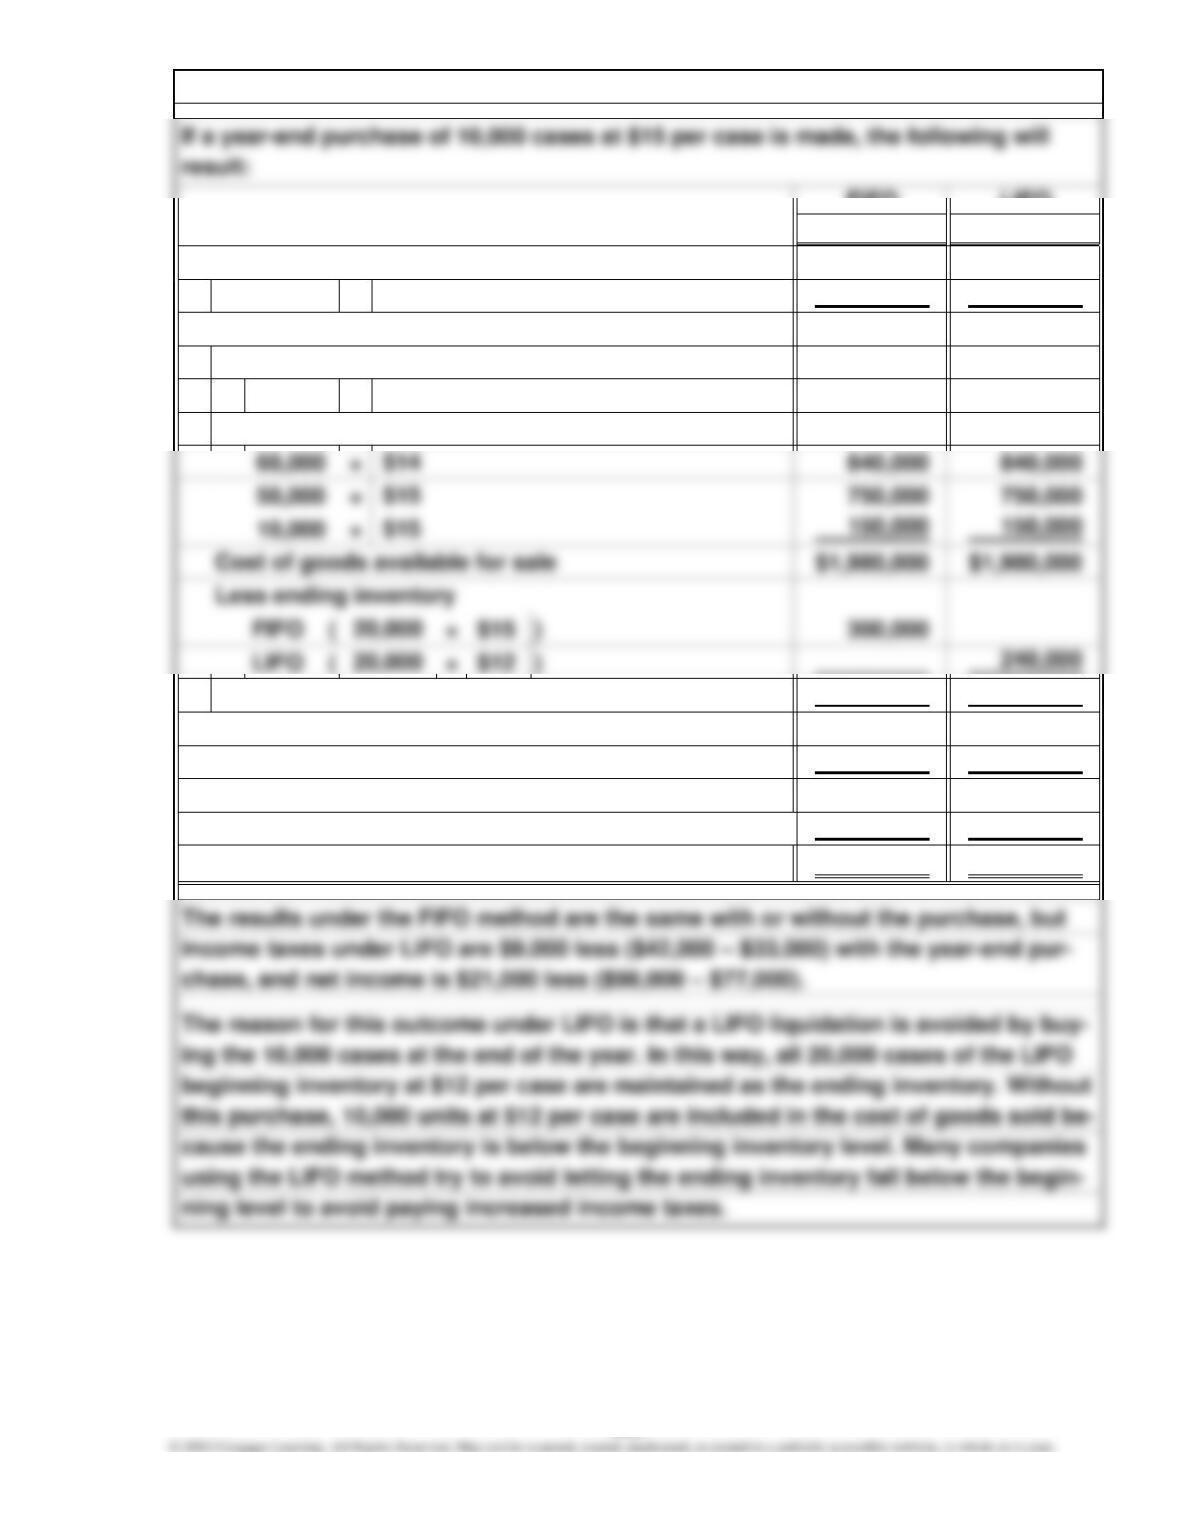
FIFO produces the higher reported net income, but from a cash flow standpoint, the
Less ending inventory
Cost of goods sold
10,000 )
)10,000
only difference under FIFO and LIFO is the amount of income taxes paid (note that
sales, purchases, and operating expenses are the same under both methods).
FIFO LIFO
Method Method
×$2,400,000 $2,400,000
20,000 × $ 240,000 $ 240,000
$1,680,000 $1,740,000
$ 720,000 $ 660,000
550,000 550,000
$ 170,000 $ 110,000
51,000 33,000
$ 119,000 $ 77,000
$12
Income before income taxes
Operating expenses
Gross margin
Cost of goods sold
Chapter 6, E 10. (Continued)
Purchases
Net income
Cost of goods sold
Income taxes expense (30%)
Beginning inventory
$20120,000
Sales
309
Units Cost* Amount
1 150 $30.00 $ 4,500
4400 33.00 13,200
4 550 32.18 $17,700
12 800 36.00 28,800
12 1,350 34.44 $46,500
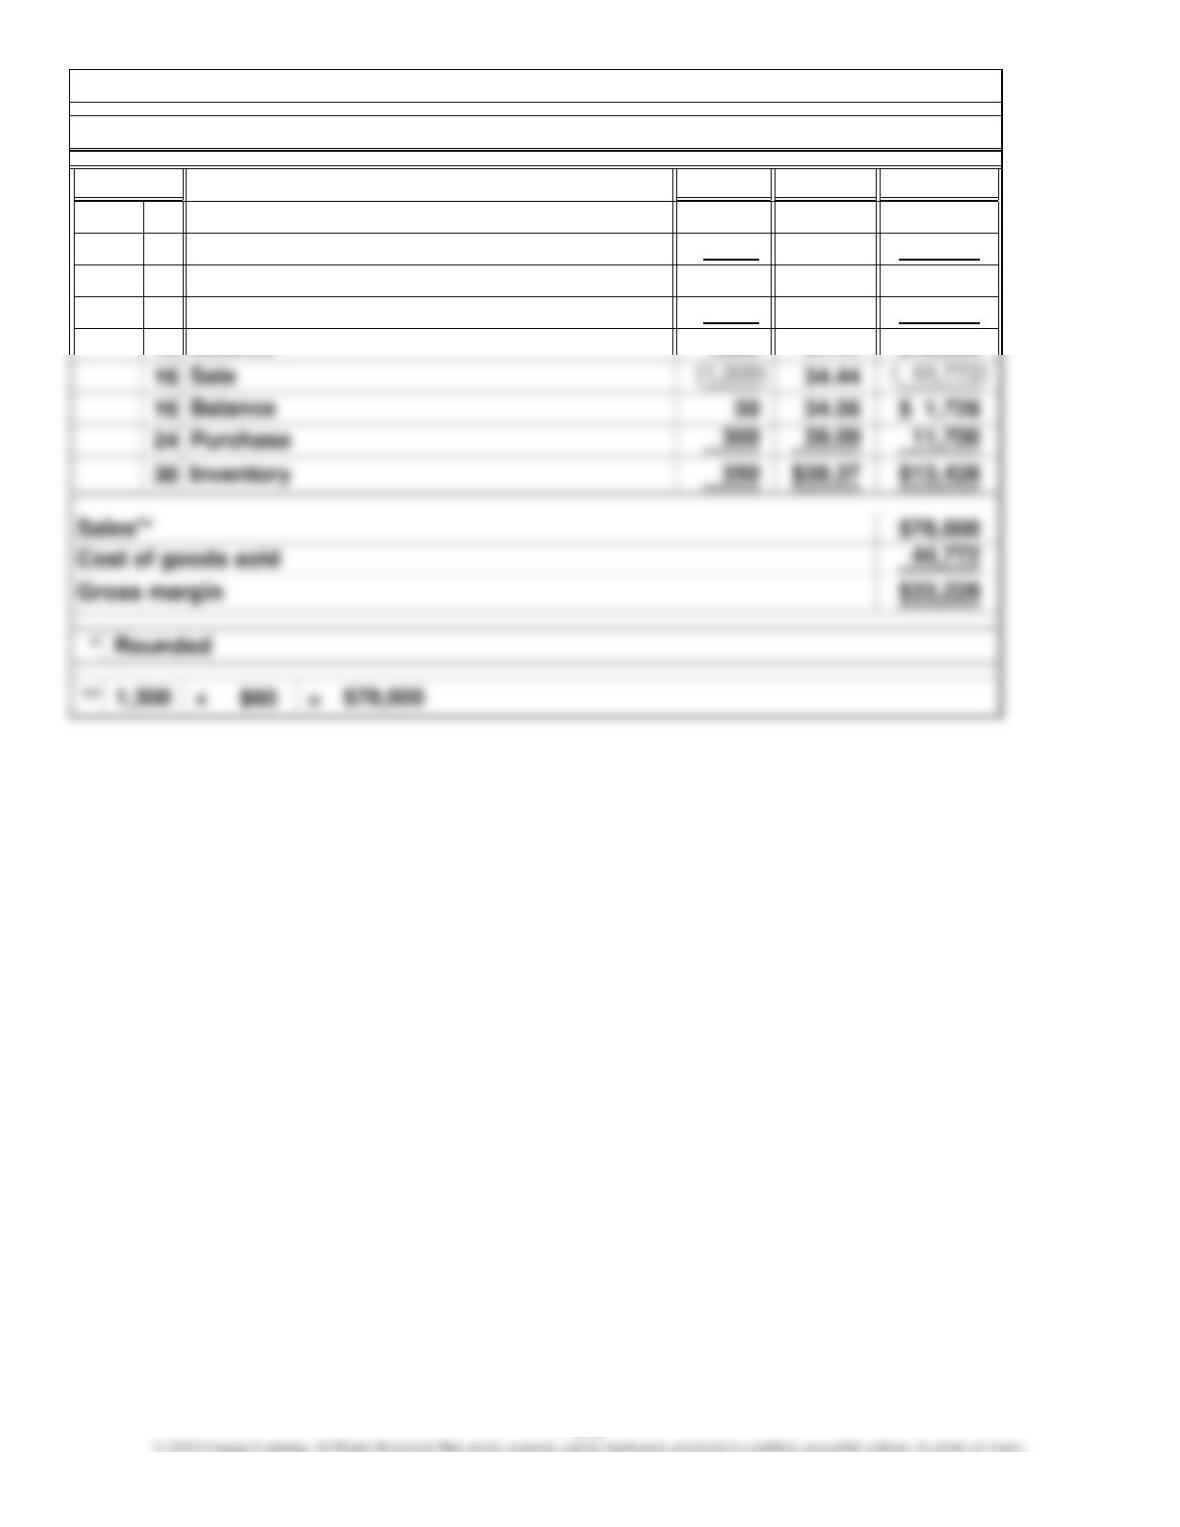
Perpetual inventory system—average-cost method
Purchase
Balance
Purchase
Chapter 6, E 11.
Date
June Inventory
Balance
310
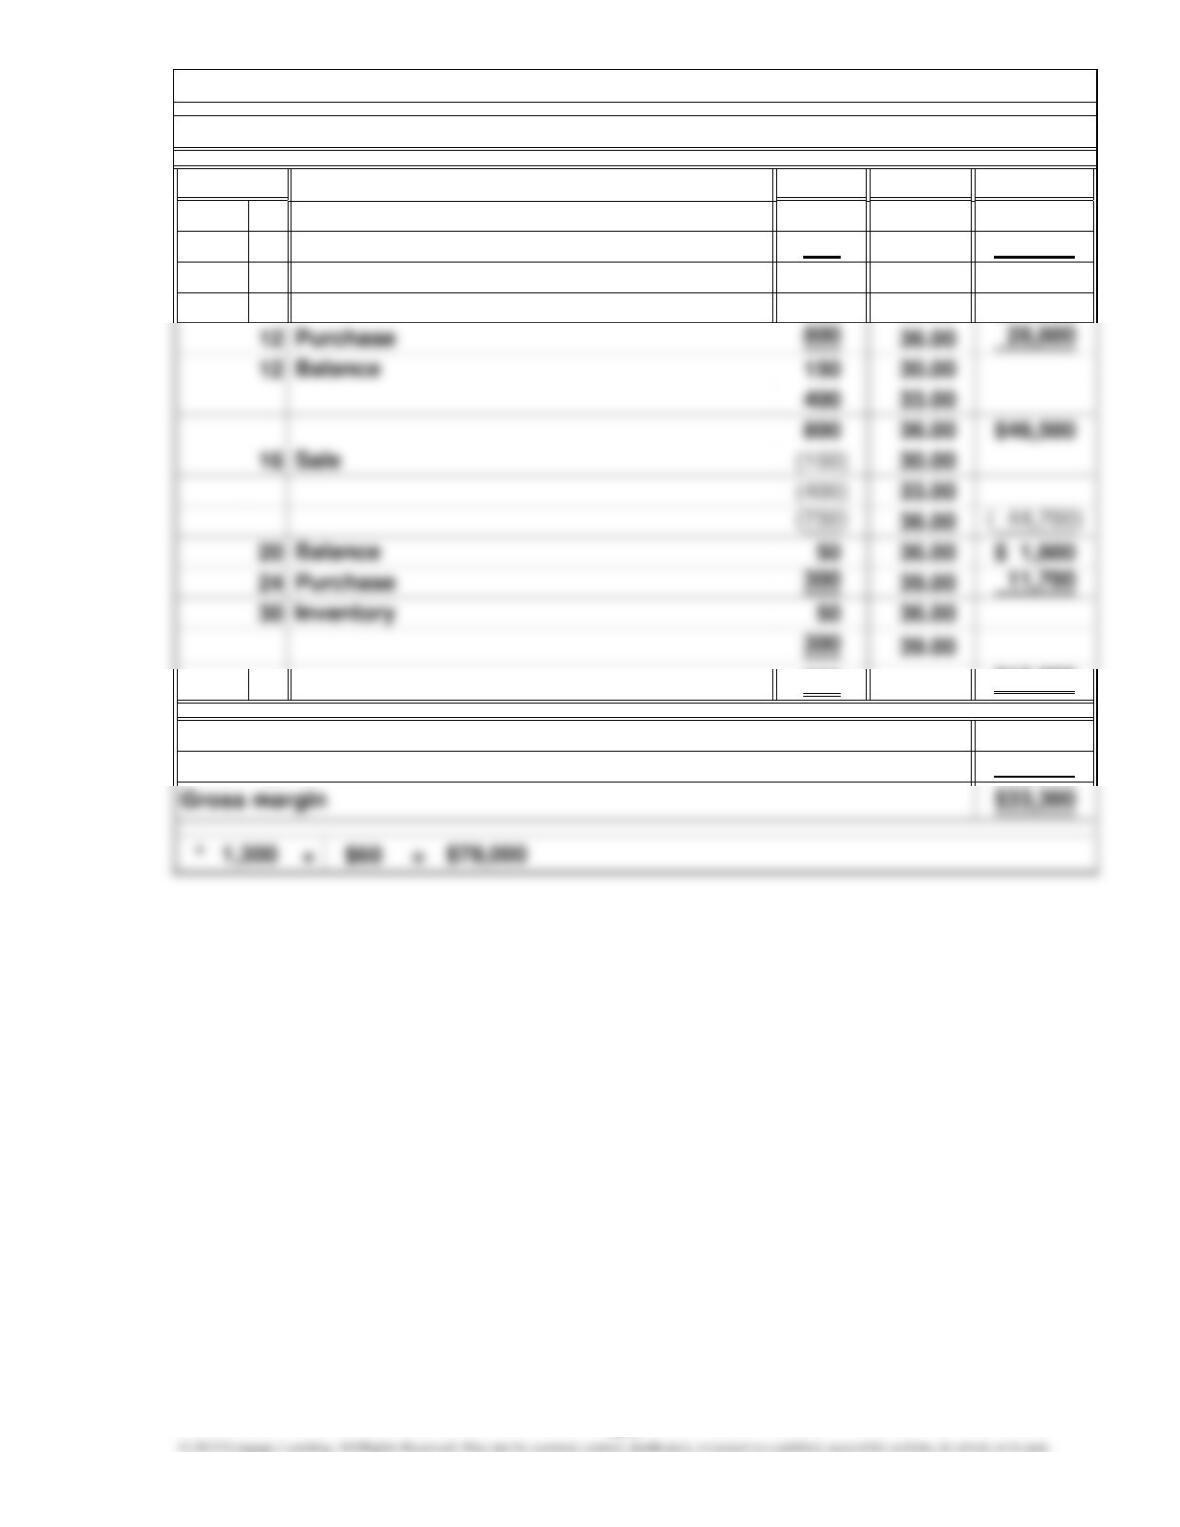
Units Cost Amount
1 150 $30.00 $ 4,500
4400 33.00 13,200
4 150 30.00
400 33.00 $17,700
350 $13,500
$78,000
44,700
Sales*
Perpetual inventory system—FIFO method
Purchase
Balance
Chapter 6, E 11. (Continued)
Date
Inventory
Cost of goods sold
June
311
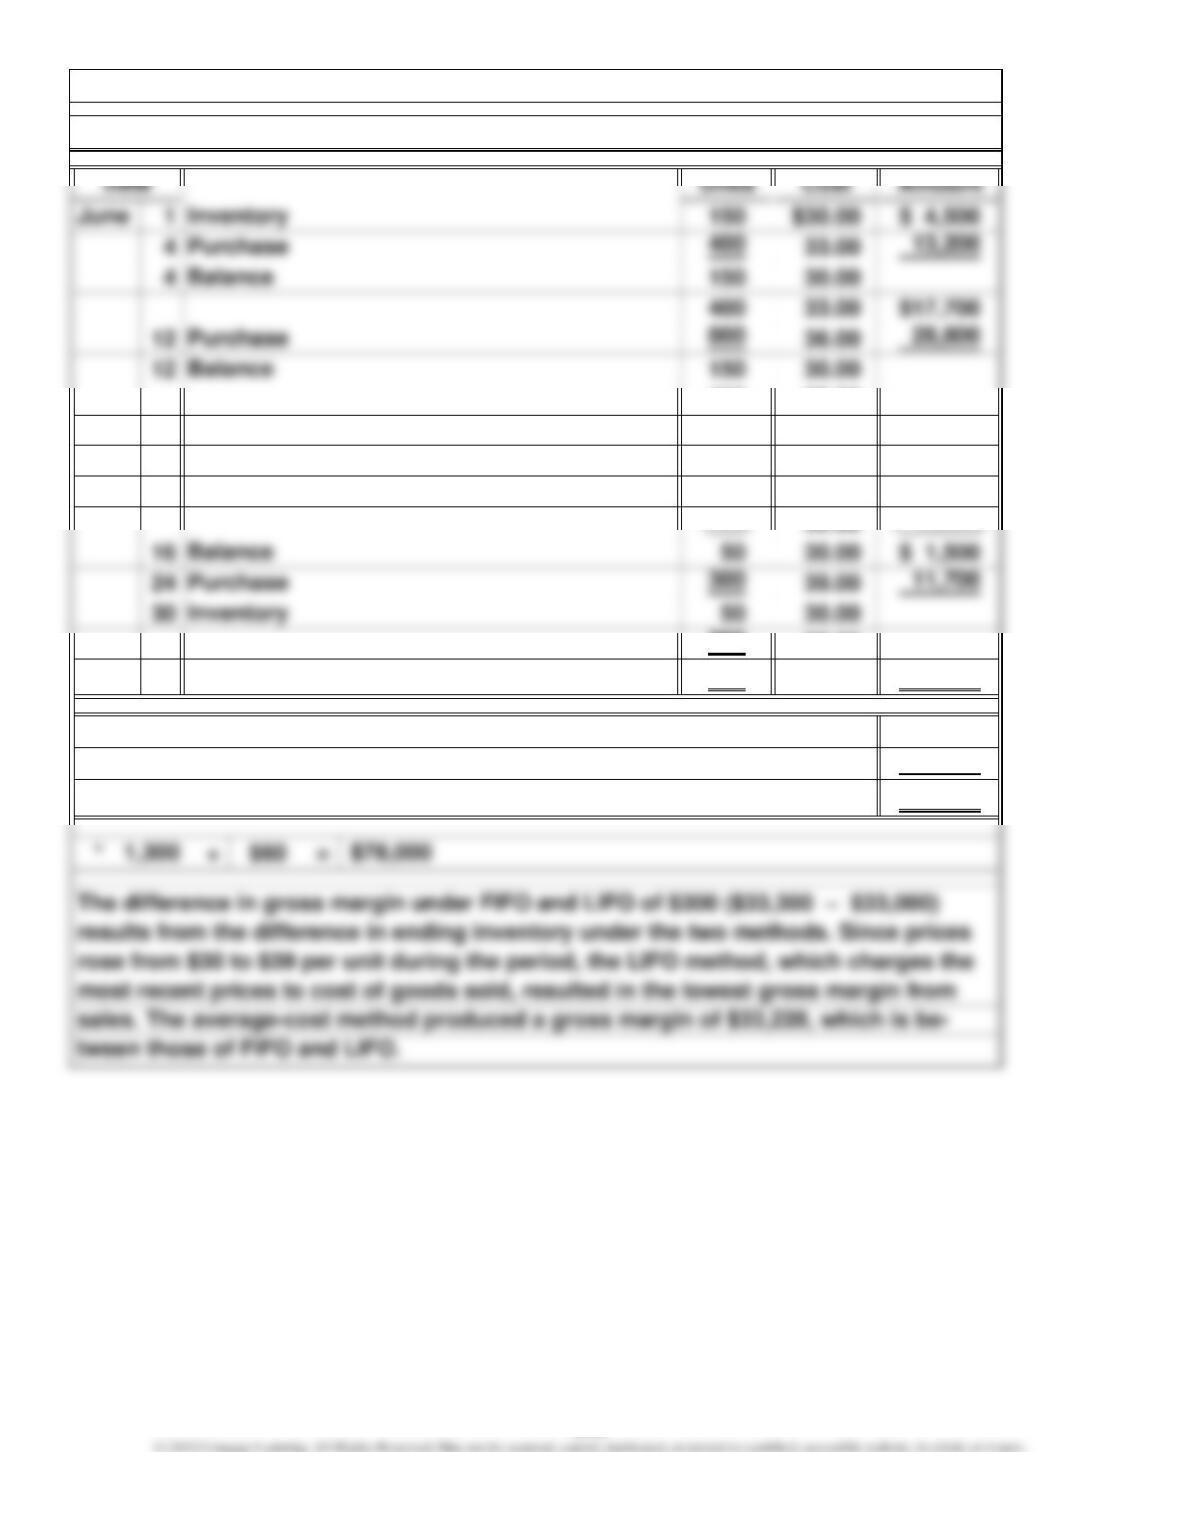
400 33.00
800 36.00 $46,500
16 (800) 36.00
(400) 33.00
(100) 30.00 ( 45,000)
300 39.00
350 $13,200
$78,000
45,000
$33,000
Sale
Chapter 6, E 11. (Continued)
Perpetual inventory system—LIFO method
Cost of goods sold
Gross margin
Sales*
312
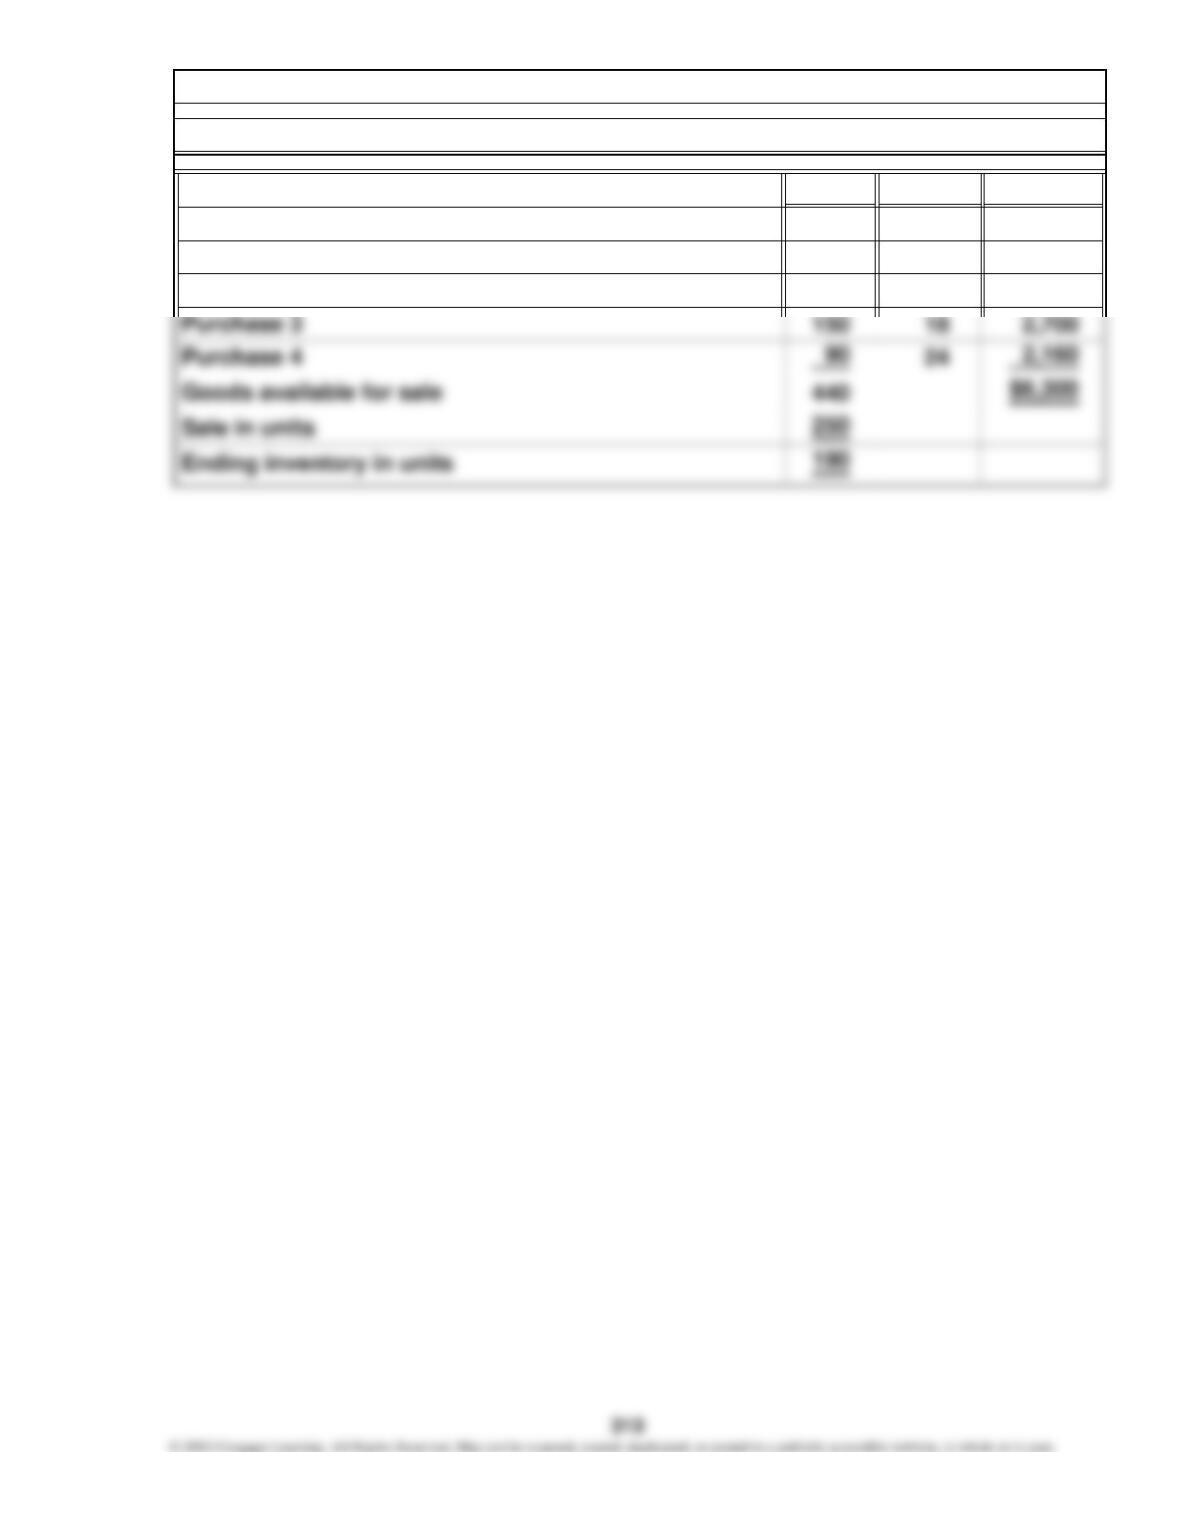
Units Cost Total
100 $ 4 $ 400
40 8 320
60 12 720
Beginning inventory
Purchase 1
Purchase 2
Goods available for sale and ending inventory in units
Chapter 6, E 12.
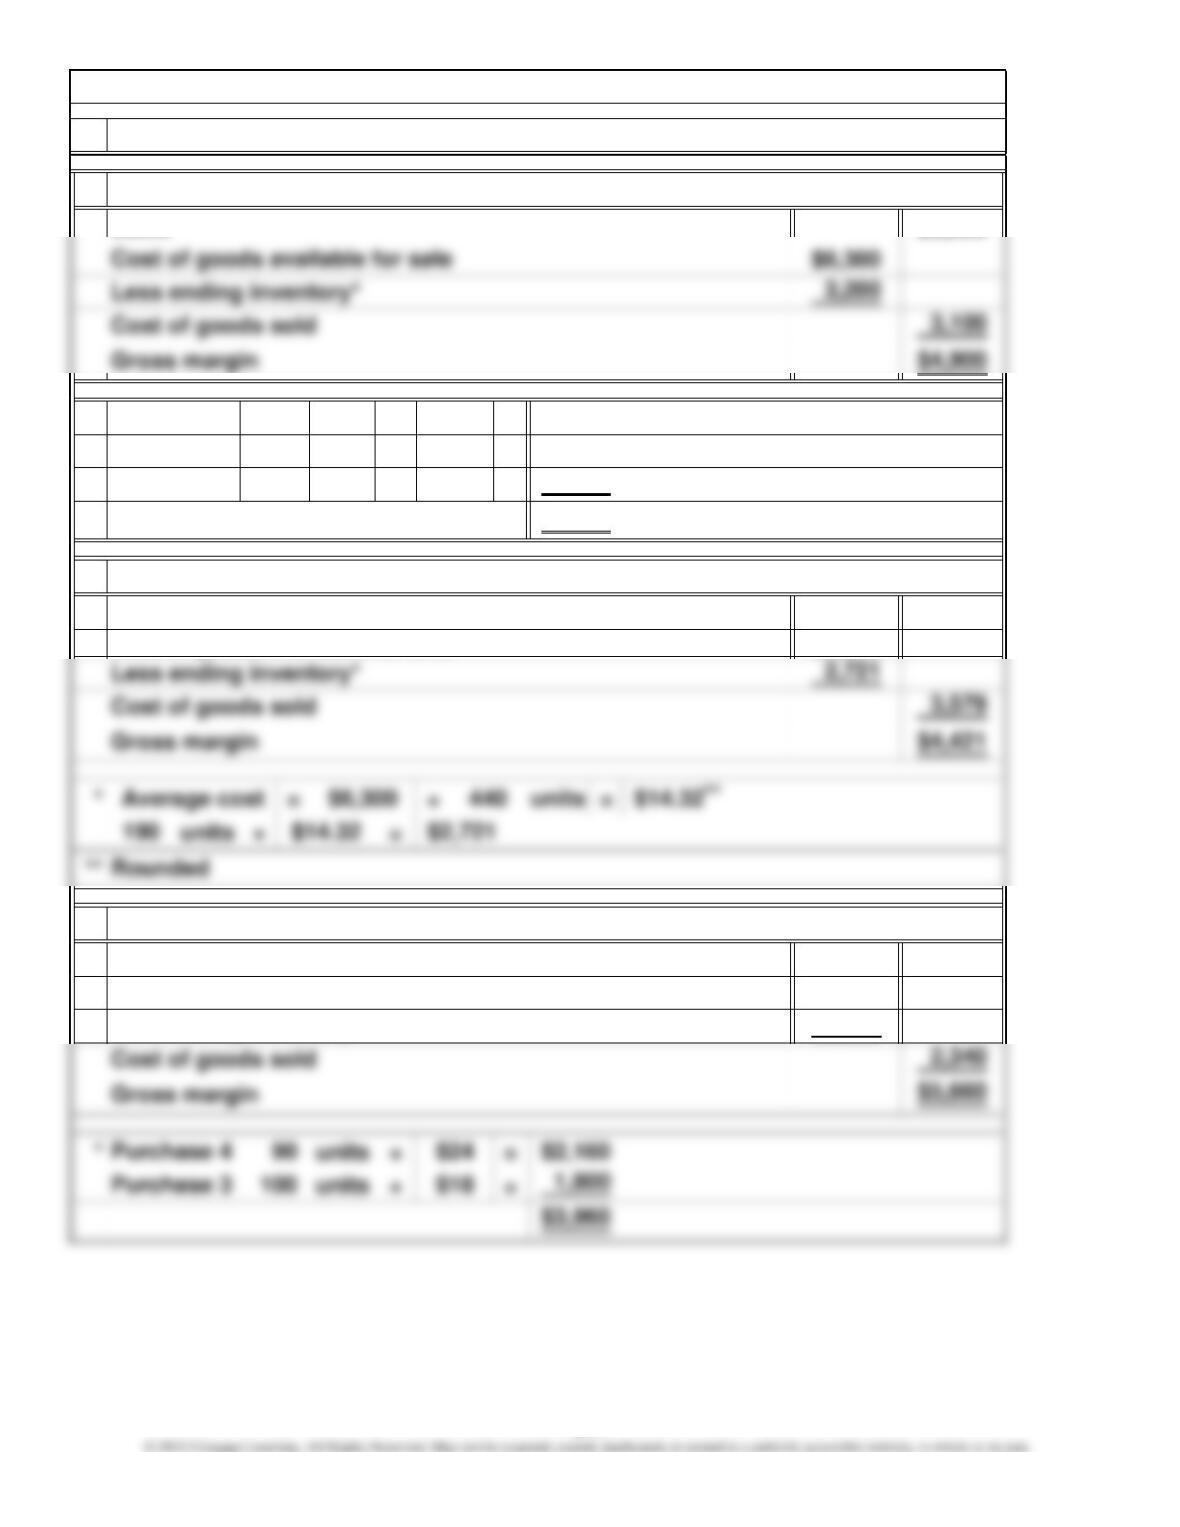
a.
$8,000
* units × =
units × =
units × =
b.
$8,000
$6,300
c.
$8,000
$6,300
3,960
720
2,160
$3,200
$ 320
Cost of goods available for sale
Sales
40
90 $24Purchase 4
Purchase 2 60
$8
FIFO method:
Less ending inventory*
Cost of goods available for sale
Average-cost method:
Sales
Specific identification method:
$12
Purchase 1
Sales
Chapter 6, E 12. (Continued)
1. Periodic inventory system
314