6e Specific Accounts Page 210 Chapter 6
ACTIVITY 77 EXAMINING THE BOND MARKET
Purpose: • Understand why bonds sell at a premium, at par, or at a discount.
HIGH-YIELD BONDS
Name
Rating
Coupon Rate
Maturity
Bid Price
Yield*
Allied Waste
B+
10.00%
8/2014
104.50
8.71%
Trump AC
CCC+
11.25%
5/2011
79.00
21.13%
* Yield is the lower of yield to maturity and yield to call.
Refer to the information in the table above to answer the following questions.
Assuming investments with the same amount of risk, an investor/creditor would prefer a
Q4 The amount paid by the issuing corporation at maturity is referred to as the face value, the par
value, and the maturity value. Bond bid (selling) price is quoted as a percentage of par.
For example, the Bid Price of the Allied Waste bond is 104.50. This indicates an investor/creditor
could purchase or sell a $100,000 Allied Waste bond for $104,500. ($100,000 x 104.50%). This bond
Q5 The Allied Waste bond is selling at a premium because the coupon rate (stated rate, face rate) is
(premium) at the beginning of the investment.
The Trump AC bond is selling at a discount because the coupon rate (stated rate, face rate) is
(discount) and at maturity the higher face value is received.
Q6 Would you prefer to invest in the Allied Waste or the Trump AC bond? Why?
6e Specific Accounts Page 211 Chapter 6
ACTIVITY 78 STOCKHOLDERS’ EQUITY
Purpose: • Reinforce understanding of amounts reported on the financial statements for
stockholders’ equity.
The COCA-COLA COMPANY
Shareowners’ Equity December 31, 2011 $ in millions
Common stock, $.25 par value
Authorized: 5,600 shares
Issued: 3,520 shares
$ 880
Capital surplus*
11,212
Reinvested earnings
53,550
Accumulated other comprehensive income (loss)
(2,703)
Treasury shares, at cost (1,257 shares)
(31,302)
* Assume capital surplus is all from issuing common stock above par value.
Refer to the financial information above to answer the following questions.
Q2 When additional shares of common stock are issued, this event will:
Q3 The amount of net income retained in the business and not yet distributed as dividends to the
Q6 When a company buys back its own stock, this event will:
shareholders.
Q9 List several factors that would attract you to purchase shares of stock in a particular corporation.
6e Specific Accounts Page 212 Chapter 6
ACTIVITY 79 EXAMINING THE DOW JONES INDUSTRIAL AVERAGE
Using the Internet
Purpose: • Understand how the DJIA is computed.
• Understand the information provided by the DJIA average.
Q1 Companies comprising the Dow Jones Industrial Average (DJIA). The DJIA is the most quoted stock
traded on the New York Stock Exchange. Since then the corporations comprising the index have
changed many times to reflect the changing economy. What stocks currently comprise the DJIA?
Use the Internet to find out and list 6 of the 30 companies that currently comprise the DJIA.
Any 6 of the following are correct.
Q2 Computing the DJIA. The index started as a true average of the market values of the stocks
comprising the index. In 1928, the sum of the market values of the each of the 30 stocks totaled
$6,000 / 30 stocks = 200 DJIA points. However, the average computation needed to be adjusted for
stock splits and stock dividends. On May 31, 2012 the market values added together totaled
$1,637.54 divided by a divisor of 0.132129493 = DJIA of 12,393 points.
On May 31, 2012 if each of the 30 DJIA stocks increased in value by one dollar per share then the
DJIA would increase by approximately 227 points (30/0. 132129493 = 227). On May 31, 2012
6e Specific Accounts Page 213 Chapter 6
Answers reflect market values on May 31, 2012.
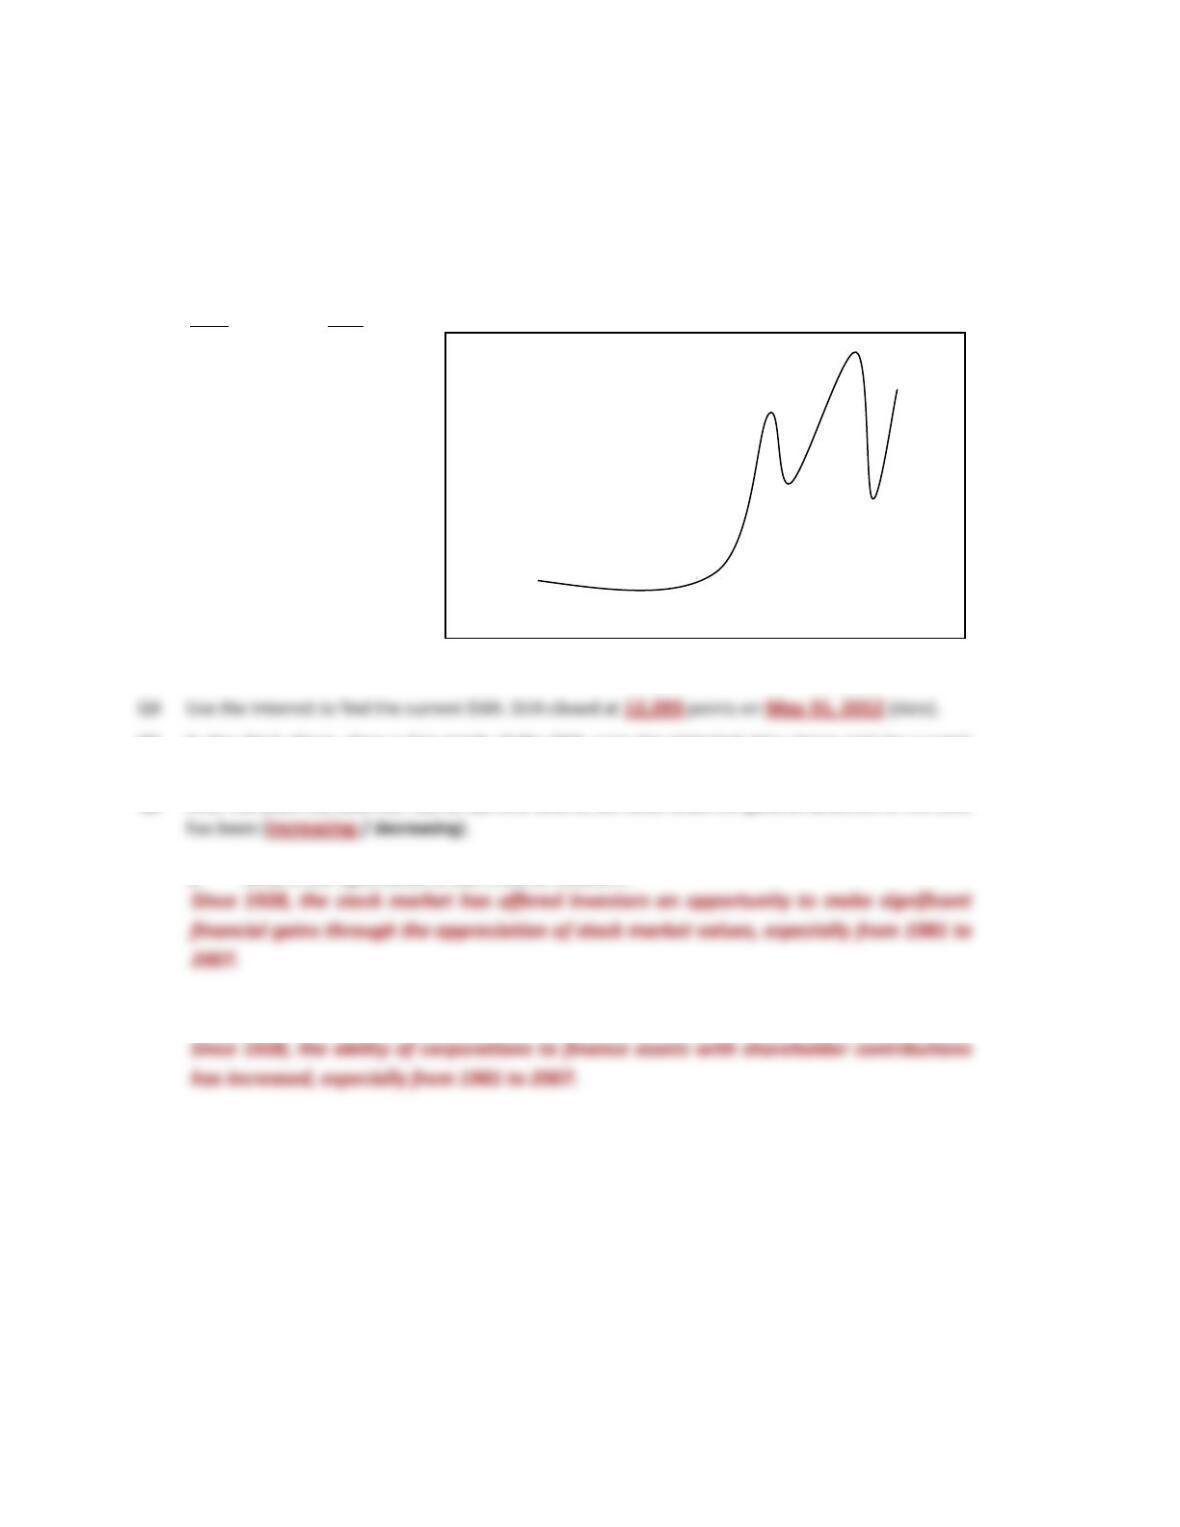
Q3 Historical Summary of the DJIA. The following chart summarizes the DJIA at various points in
history. Using the information presented in the chart, complete the graph outlined below.
Date DJIA
1928 ……………….. 200
1981 …………….. 1,000
1986 …………….. 2,000
1991 …………….. 3,000
1995 …………….. 4,000
1996 …………….. 6,000
1997 …………….. 8,000
1999 …………… 11,000
2002… ………….. 7,000
2004 …………… 10,000
2007 Oct 9 ……. 14,164
2008 …………….. 8,000
2009 March 9 … 6,547
2011 …………… 12,000
Q5 In the chart above, draw a line graph of the DJIA using the historical data above and the current
DJIA information you just found.
Q6 Over the years the DJIA has had its ups and downs, but since 1928 the general direction of the DJIA
a. What is the significance of the trend to investors?
b. To the corporations issuing the stock?
14,000 I DJIA
12,000 |
10,000 |
8,000 |
6,000 |
4,000 |
2,000 |_____________________________________
1928 ’38 ’48 ’58 ’68 ’81 ’91 2001 2006 2011
6e Specific Accounts Page 214 Chapter 6
ACTIVITY 80 FOLLOWING THE STOCK MARKET
Using the Internet
Purpose: • Follow the stock market quotes for three companies and the Dow Jones Industrial
Average (DJIA) for four weeks.
• Understand market value per share.
Q1 Select three publicly traded corporations. For each of the next four weeks record in the chart below
the (a) date of the stock information, (b) the closing stock price of the three companies you
selected, and (c) the DJIA as of the close (end) of that business day.
Free stock quote information can be found on the Internet at money.msn.com; finance.yahoo.com;
and other sites.
Corporation Name
Company
#1
Company
#2
Company
#3
DJIA
WEEK ONE: Closing
Market Price on ______________ (a)
WEEK TWO: Closing
Market Price on ______________
WEEK THREE: Closing
Market Price on ______________
WEEK FOUR: Closing
Market Price on ______________ (b)
Four week change in
market price (b) – (a)
Four week % change in
market price (b – a) / (a)
%
%
%
%
Q2 At the end of the four weeks complete the following:
a. Compute the information requested in the bottom two rows of the above chart.
b. Over the four weeks you observed the DJIA (increased / stayed the same / decreased).
c. Did the stocks you selected move in the same direction as the Dow Jones Industrial
Average? (Yes / No)
d. Would you expect your stocks to move in the same direction as the DJIA? (Yes / No)
Why?
e. Comment on at least two interesting results you noted while following the stock market.
6e Specific Accounts Page 215 Chapter 6
ACTIVITY 81 RATIO ANALYSIS
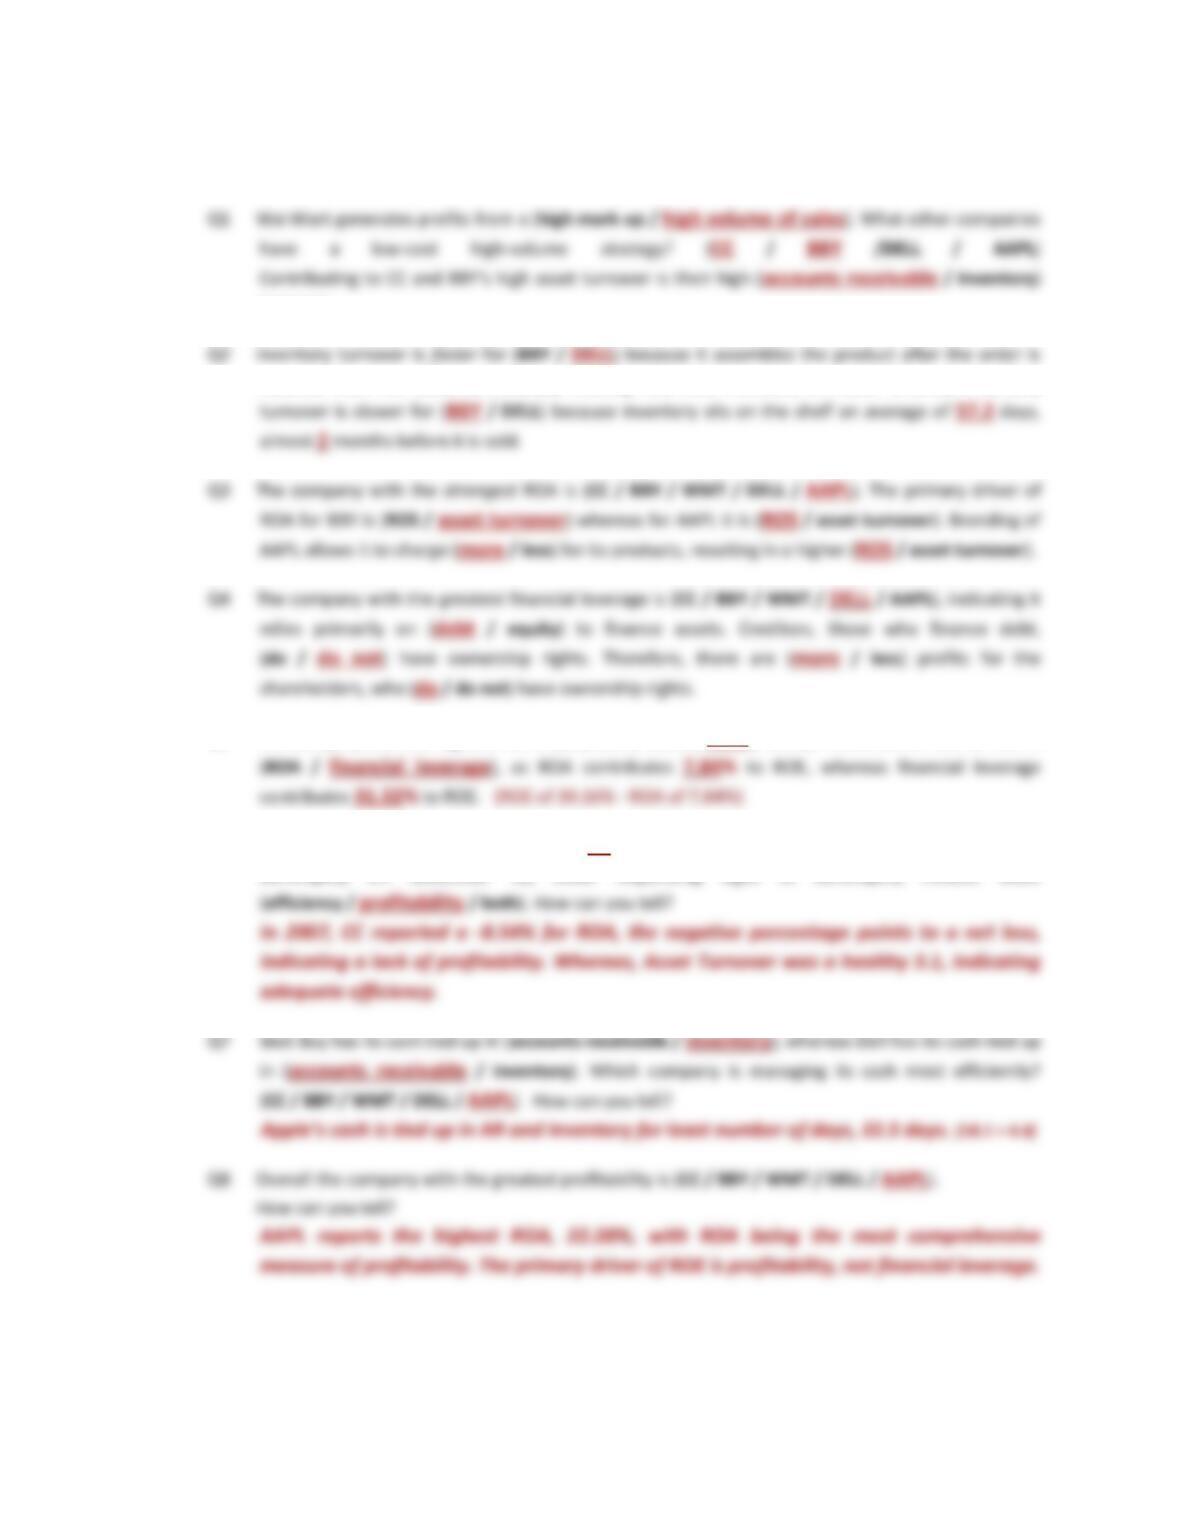
Purpose: • Analyze profitability, efficiency, and solvency ratios of various companies.
Where’s the Cash?
2011
CC*
BBY
WMT
DELL
AAPL
Accounts receivable (A/R) days
10.3
17.0
4.4
38.0
18.1
Efficiency Ratios
2011
CC*
BBY
WMT
DELL
AAPL
A/R turnover
35.5
21.4
82.9
9.6
20.2
Inventory turnover
Asset turnover
3.1
2.3
1.4
0.9
DuPont Analysis of ROE
2011
CC*
BBY
WMT
DELL
AAPL
ROS
–2.72%
2.54%
3.89%
5.63%
23.95%
Asset turnover
3.1
2.8
2.3
1.4
0.9
ROA
Selected Accounts
CC*
BBY
WMT
DELL
AAPL
($ in Millions)
2/28/2008
2/1/11
1/31/11
1/1/12
9/29/11
Accounts receivable
$ 331
$ 2,348
$ 5,089
$ 6,476
$ 5,369
Inventory
1,574
5,897
36,318
1,404
776
Total assets
3,746
17,849
180,663
44,533
116,371
Total liabilities
2,243
11,247
112,121
35,616
39,756
1,503
6,602
68,542
8,917
76,615
Revenue
Net income
Circuit City (CC)
SIC #5731
Retail—Radio TV and Consumer Electronics Stores
Best Buy (BBY)
SIC #5731
Retail—Radio TV and Consumer Electronics Stores
SIC #5331
Retail—Variety Stores
SIC #3571
Electronic Computers
SIC #3571
Electronic Computers
Inventory days
61.7
57.2
42.0
10.6
4.4
6e Specific Accounts Page 216 Chapter 6
Use the information on the previous page regarding Circuit City (CC), Best Buy (BBY), Wal-Mart (WMT),
Dell (DELL), and Apple (AAPL) to answer the following questions.
turnover.
received from the customer, thereby needing very little inventory on hand. Whereas inventory
Q5 The company with the highest ROE is (CC / BBY / WMT / DELL / AAPL). The driver of ROE for Dell is
Q6 The company with the weakest ROE is (CC / BBY / WMT / DELL / AAPL). Circuit City filed for
bankruptcy on November 10, 2008. Impending signs of bankruptcy include weak
6e Specific Accounts Page 217 Chapter 6
Why? Support your choice by discussing at least 3 good reasons.
6e Specific Accounts Page 218 Chapter 6
ACTIVITY 82 TEST YOUR UNDERSTANDING
Purpose: • Compare effects of the inventory cost-flow assumptions FIFO and LIFO on the
financial statements.
• Compare effects of the depreciation method (SL or DDB) on the financial statements.
• Prepare the income statement, balance sheet, and the statement of cash flows using
different accounting methods.
• Understand how the choice of different accounting methods affects cash and accrual
accounting.
Frasco and Lasco are virtually identical; both companies began operations at the beginning of the current
year and during the year purchased inventory as follows:
Jan 4 10,000 units at $4 = $ 40,000
Apr 6 10,000 units at $5 = 50,000
In early January both companies purchased equipment costing $200,000 with a 10-year estimated useful
life and no residual value. Frasco uses straight-line depreciation, and Lasco uses double-declining-
balance depreciation for equipment.
Both companies’ trial balances at December 31st include the following:
Sales revenue ……………………………………………………….. $300,000
Purchases (see above) ……………………………………….. $220,000
COGS ………………………………………………………………………… compute
Operating expenses:
Depreciation expense ………………………………. compute
Other than depreciation ……………………………… 80,000
Use the above information to answer the following questions.
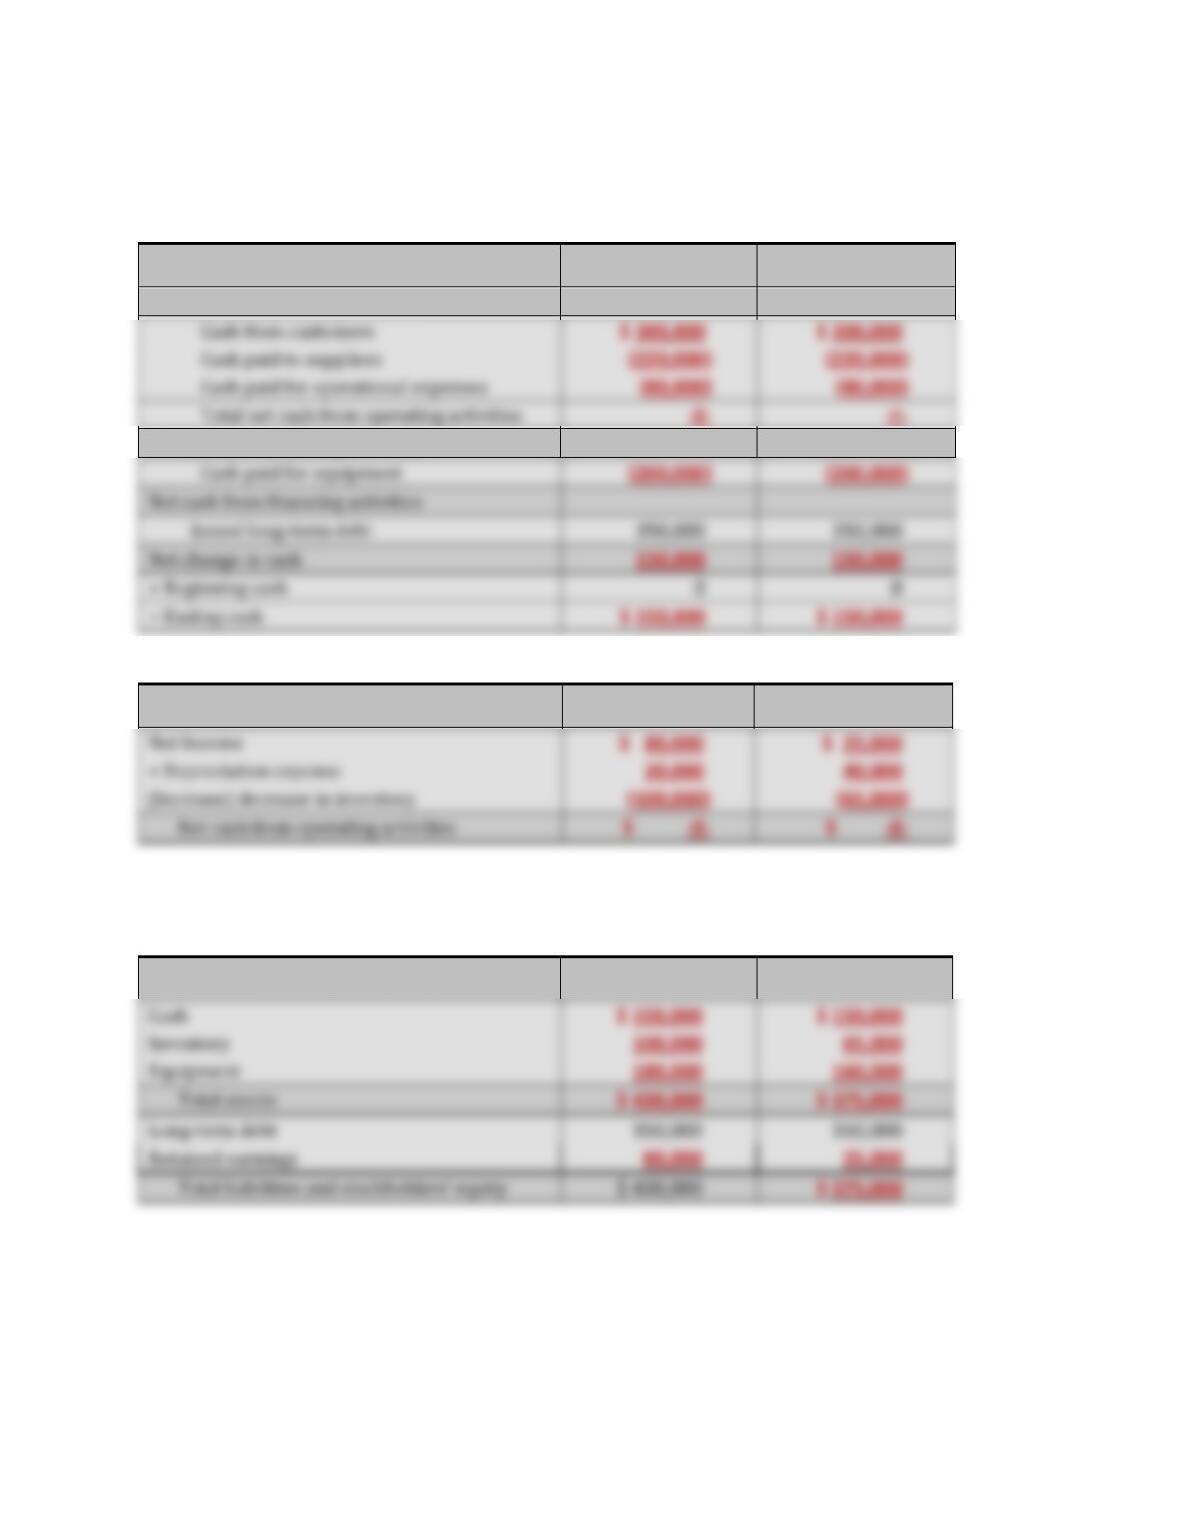
Q1 Prepare a multi-step Income Statement for both companies in the space provided below.
INCOME STATEMENT
FRASCO
LASCO
6e Specific Accounts Page 219 Chapter 6
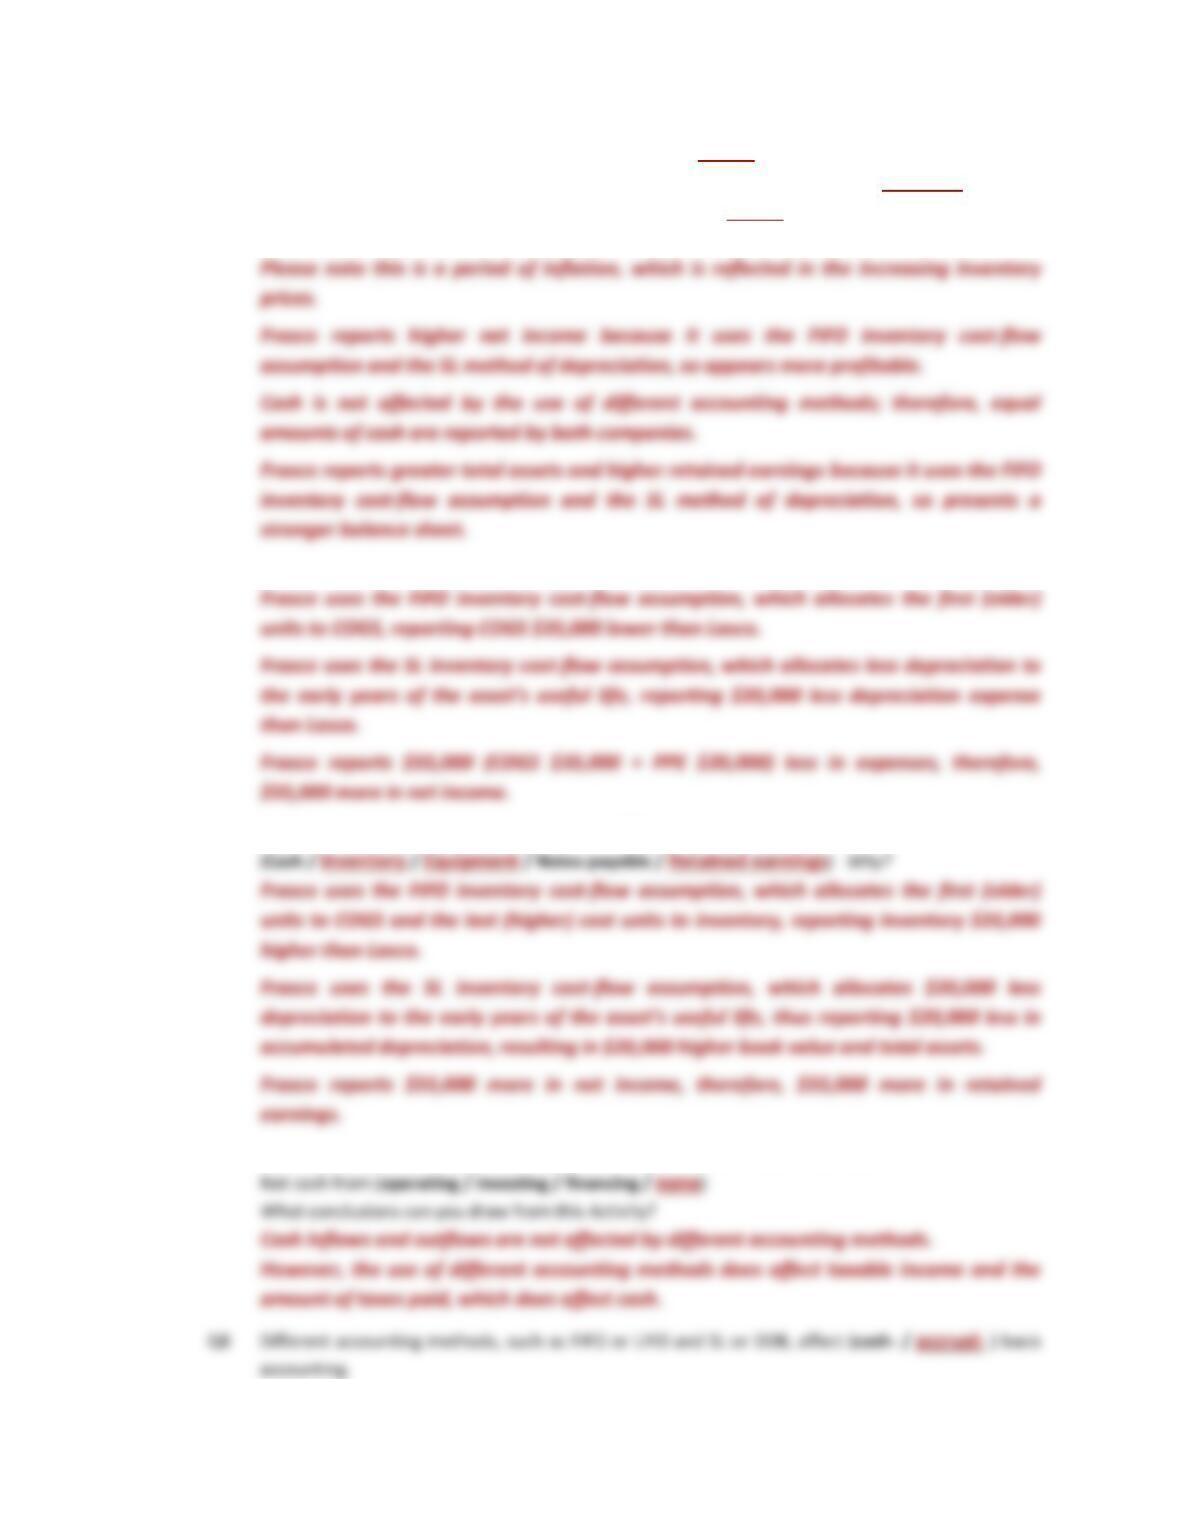
Q2 Assuming all transactions are cash transactions, prepare a Statement of Cash Flows. Also prepare
the Supplement Schedule—Indirect Method that reconciles net income and net cash from
operating activities.
STATEMENT OF CASH FLOWS
FRASCO
LASCO
Net cash from operating activities
Net cash from investing activities
Cash paid for equipment
Net cash from financing activities
Issued long-term debt
Net change in cash
+ Beginning cash
= Ending cash
Supplemental Schedule—Indirect Method
FRASCO
LASCO
Net Income
+ Depreciation expense
(Increase) decrease in inventory
Net cash from operating activities
Q3 Prepare a Balance Sheet for both companies in the space provided below.
BALANCE SHEET
FRASCO
LASCO
Cash
Inventory
Equipment
Total assets
Long-term debt
Retained earnings
Total liabilities and stockholders’ equity
Cash from customers
Cash paid to suppliers
Cash paid for operational expenses
Total net cash from operating activities
6e Specific Accounts Page 220 Chapter 6
Q4 a. Which company appears to be more profitable? (Frasco / Lasco / the same)
b. Which company generated more cash during the year? (Frasco / Lasco / the same)
c. Which company presents a stronger balance sheet? (Frasco / Lasco / the same)
Why?
Q5 On the Income Statement, why is net income different for Frasco and Lasco?
Q6 On the balance sheet, which accounts report different amounts?
Q7 On the Statement of Cash Flows, which totals differ between Frasco and Lasco?