P6-2A Determine cost of goods sold and ending inventory using FIFO, LIFO, and average-cost with analysis
Mullins Distribution markets CDs of numerous performing artists. At the beginning of March, Mullins had in
beginning inventory 2,500 CDs with a unit cost of $7. During March, Mullins made the following purchases of CDs.
March 5 2,000 @ $8 March 21 5,000 @ $10
March 13 3,500 @ $9 March 26 2,000 @ $11
During March 12,000 units were sold. Mullins uses a periodic inventory system.
Instructions
(a) Determine the cost of goods available of sale.
(b) Determine (1) the ending inventory and (2) the cost of goods sold under each of the assumed cost
flow methods (FIFO, LIFO, and average-cost). Prove the accuracy of the cost of goods sold under the
FIFO and LIFO methods. (Note: For average-cost, round cost per unit to three decimal places.)
(c ) Which cost flow methods results in (1) the highest inventory amount for the balance sheet and (2)
the highest cost of goods sold for the income statement?
NOTE: Enter a number in cells requesting a value; enter either a number or a formula in cells with a “?”.
Enter a textual answer in the cells with “TEXT.”
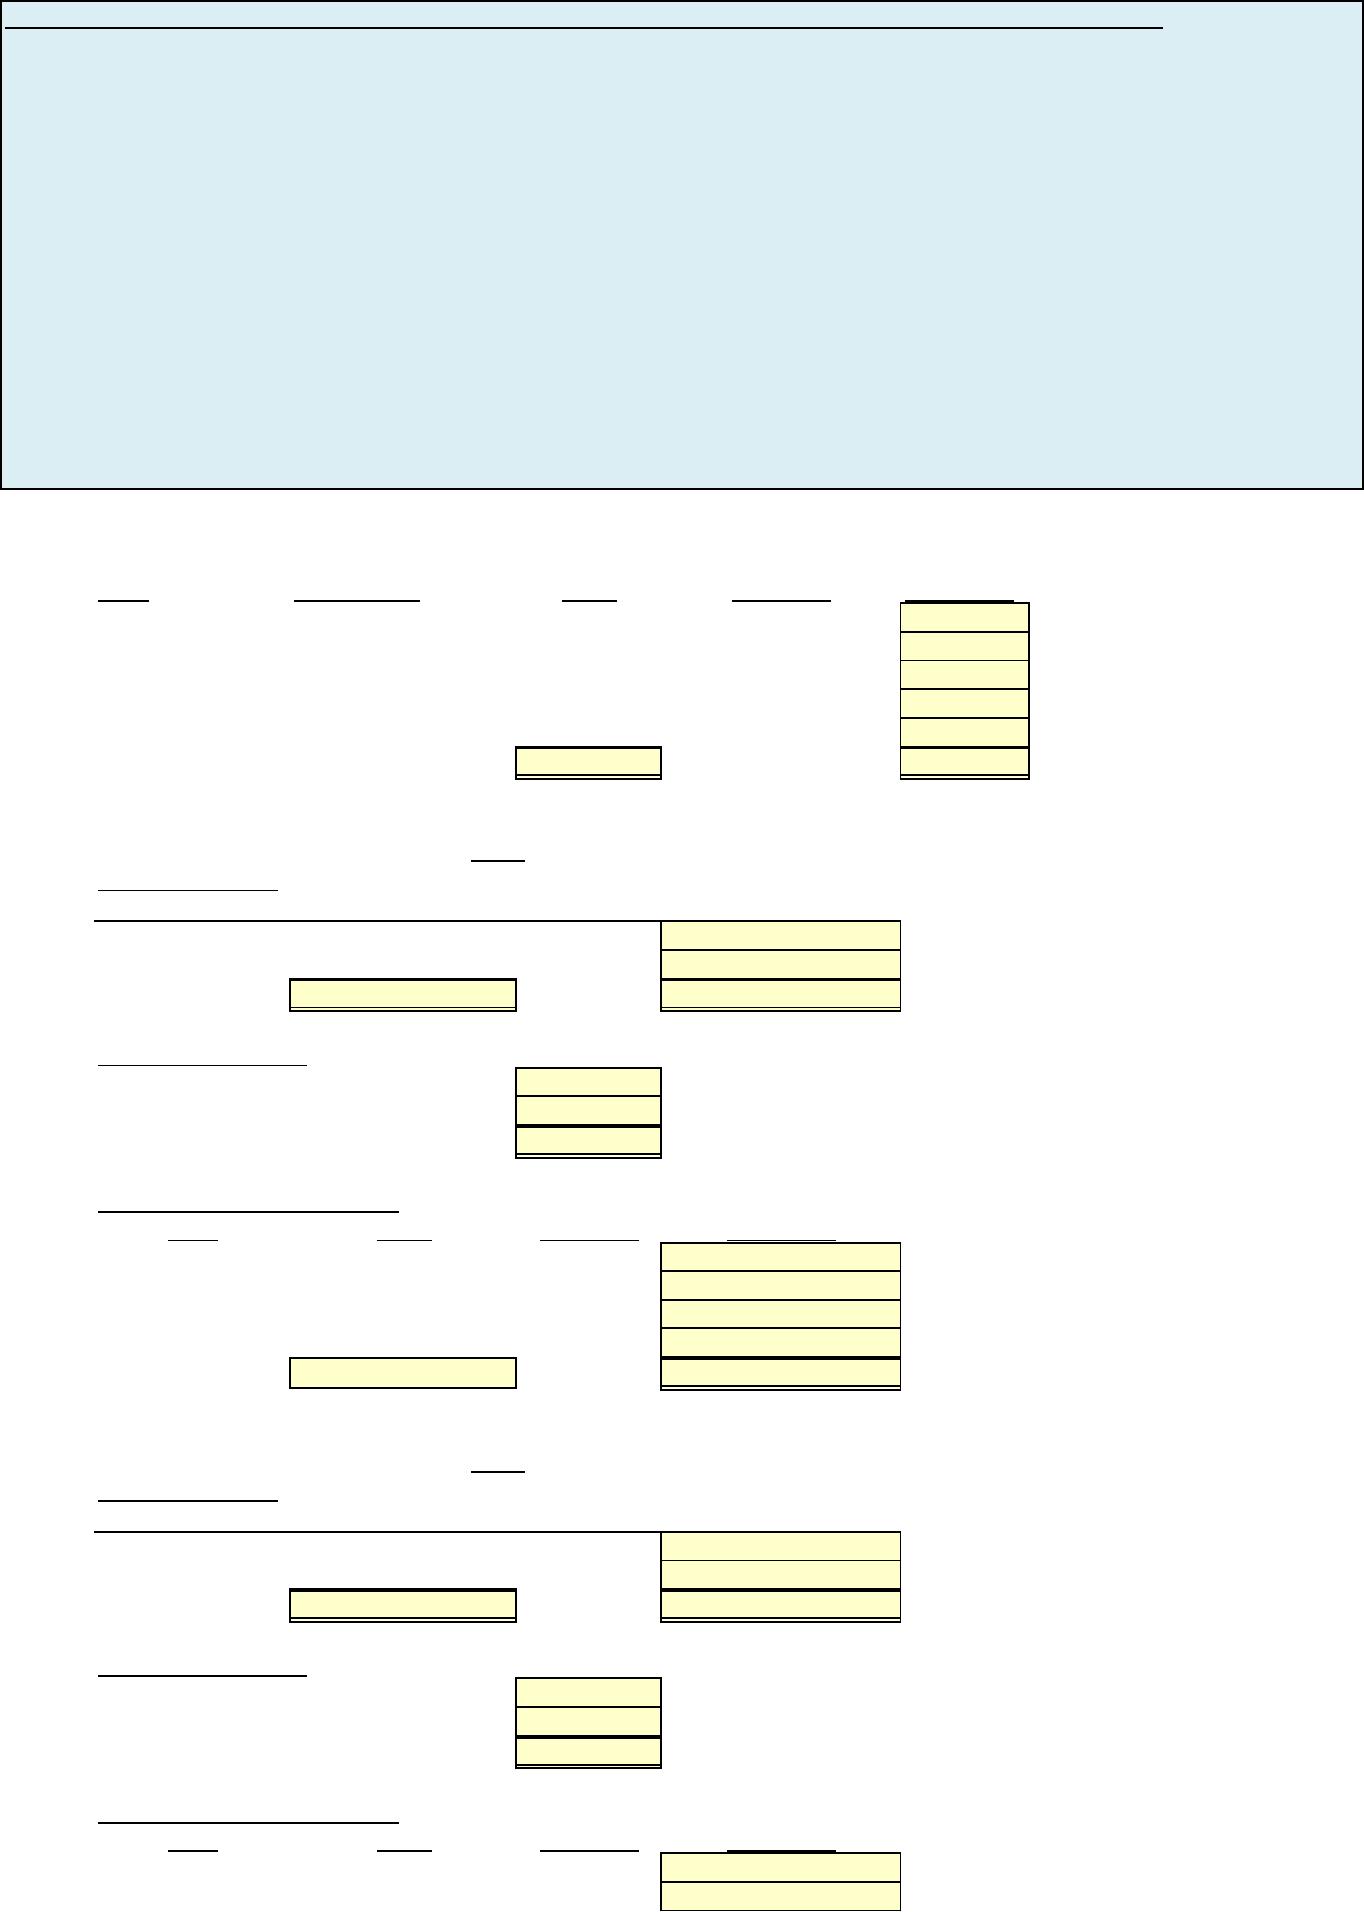
(a) COST OF GOODS AVAILABLE FOR SALE
Date Explanation Units Unit Cost Total Cost
March 1 Beginning inventory 2,500 $7 Value
5 Purchase 2,000 8 Value
13 Purchase 3,500 9 Value
21 Purchase 5,000 10 Value
26 Purchase 2,000 11 Value
Total ? ?
(b)(1) Ending Inventory
Date Units Unit Cost Total Cost
March 26 2,000 $11 Value
21 1,000 10 Value
? ?
(b)(2) Cost of Goods Sold
Cost of goods available for sale Value
Less: Ending inventory Value
Cost of goods sold ?
Proof of Cost of Goods Sold
Date Units Unit Cost Total Cost
March 1 2,500 $7 Value
5 2,000 8 Value
13 3,500 9 Value
21 4,000 10 Value
? ?
(b)(1) Ending Inventory
Date Units Unit Cost Total Cost
March 1 2,500 $7 Value
5 500 8 Value
? ?
(b)(2) Cost of Goods Sold
Cost of goods available for sale Value
Less: Ending inventory Value
Cost of goods sold ?
Proof of Cost of Goods Sold
Date Units Unit Cost Total Cost
March 26 2,000 $11 Value
21 5,000 10 Value
FIFO
LIFO
13 3,500 9 Value
5 1,500 8 Value
? ?
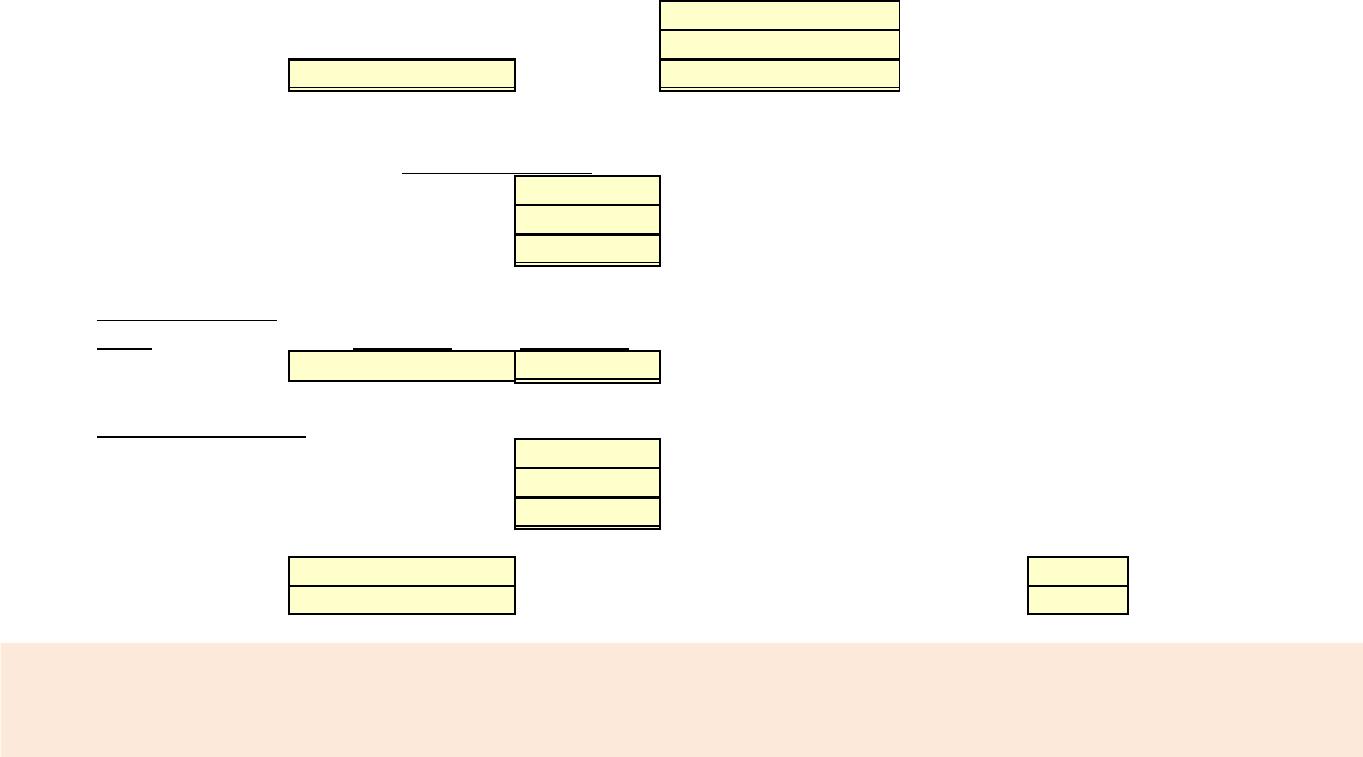
Cost of goods available for sale Value
Units available for sale Value
Average cost per unit ?
(b)(1) Ending Inventory
Units Unit Cost Total Cost
3,000 Value ?
(b)(2) Cost of Goods Sold
Cost of goods available for sale Value
Less: Ending inventory Value
Cost of goods sold ?
(c) (1) As shown in (b), TEXT produces the highest inventory amount, Value
(c) (2) As shown in (b), TEXT
produces the highest cost of goods sold,
highest cost of goods
sold, Value
After you have completed P6-2A, consider the following additional question.
1. Assume that number of units sold changed to 10,000 units. How does this change impact ending inventory
and cost of goods sold under FIFO, LIFO and Average cost?
AVERAGE COST
P6-2A Solution
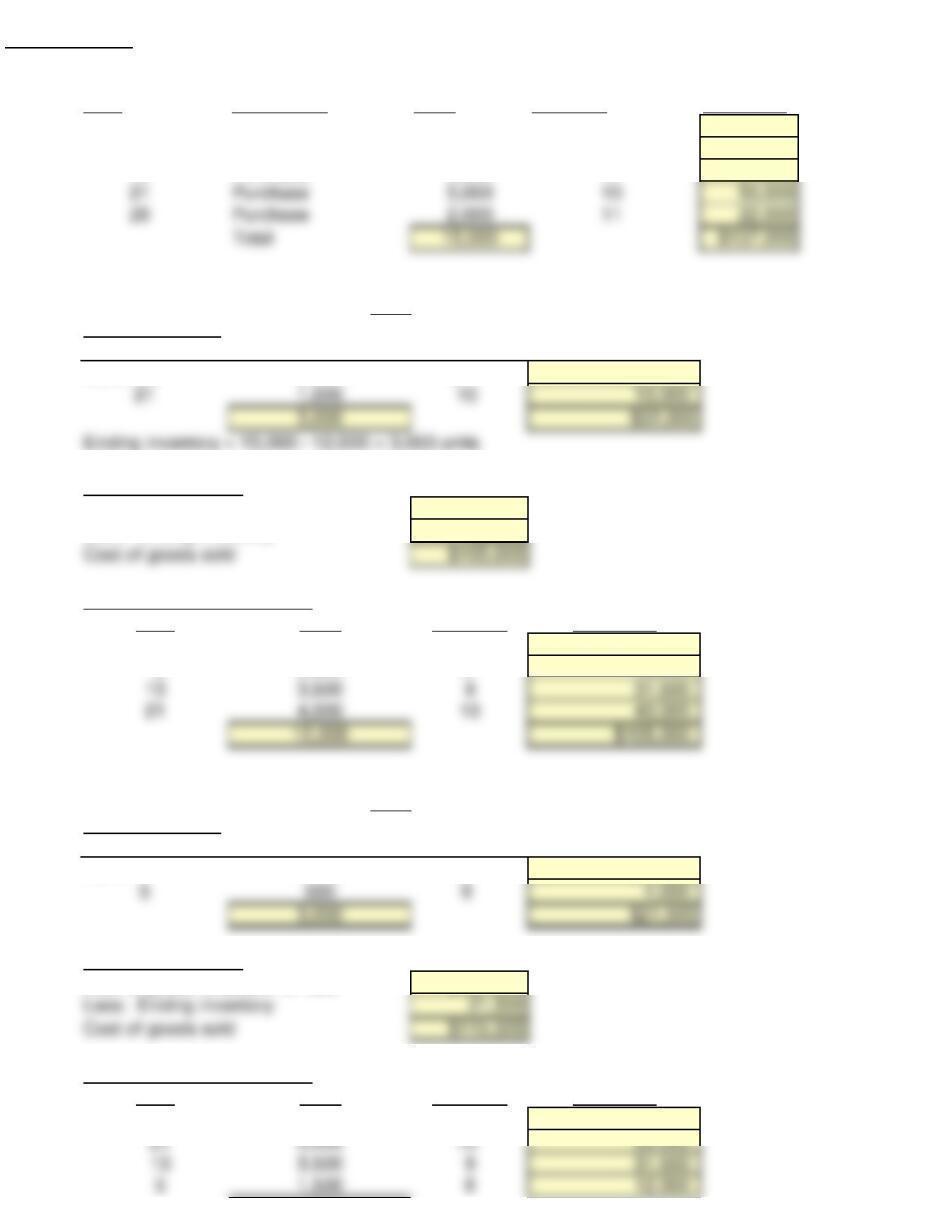
(a) COST OF GOODS AVAILABLE FOR SALE
Date Explanation Units Unit Cost Total Cost
March 1 Beginning inventory 2,500 $7 $17,500
5 Purchase 2,000 8 16,000
13 Purchase 3,500 9 31,500
(b)(1) Ending Inventory
Date Units Unit Cost Total Cost
March 26 2,000 $11 $22,000
(b)(2) Cost of Goods Sold
Cost of goods available for sale $137,000
Less: Ending inventory 32,000
Proof of Cost of Goods Sold
Date Units Unit Cost Total Cost
March 1 2,500 $7 $17,500
5 2,000 8 16,000
(b)(1) Ending Inventory
Date Units Unit Cost Total Cost
March 1 2,500 $7 $17,500
(b)(2) Cost of Goods Sold
Cost of goods available for sale $137,000
Proof of Cost of Goods Sold
Date Units Unit Cost Total Cost
March 26 2,000 $11 $22,000
FIFO
LIFO
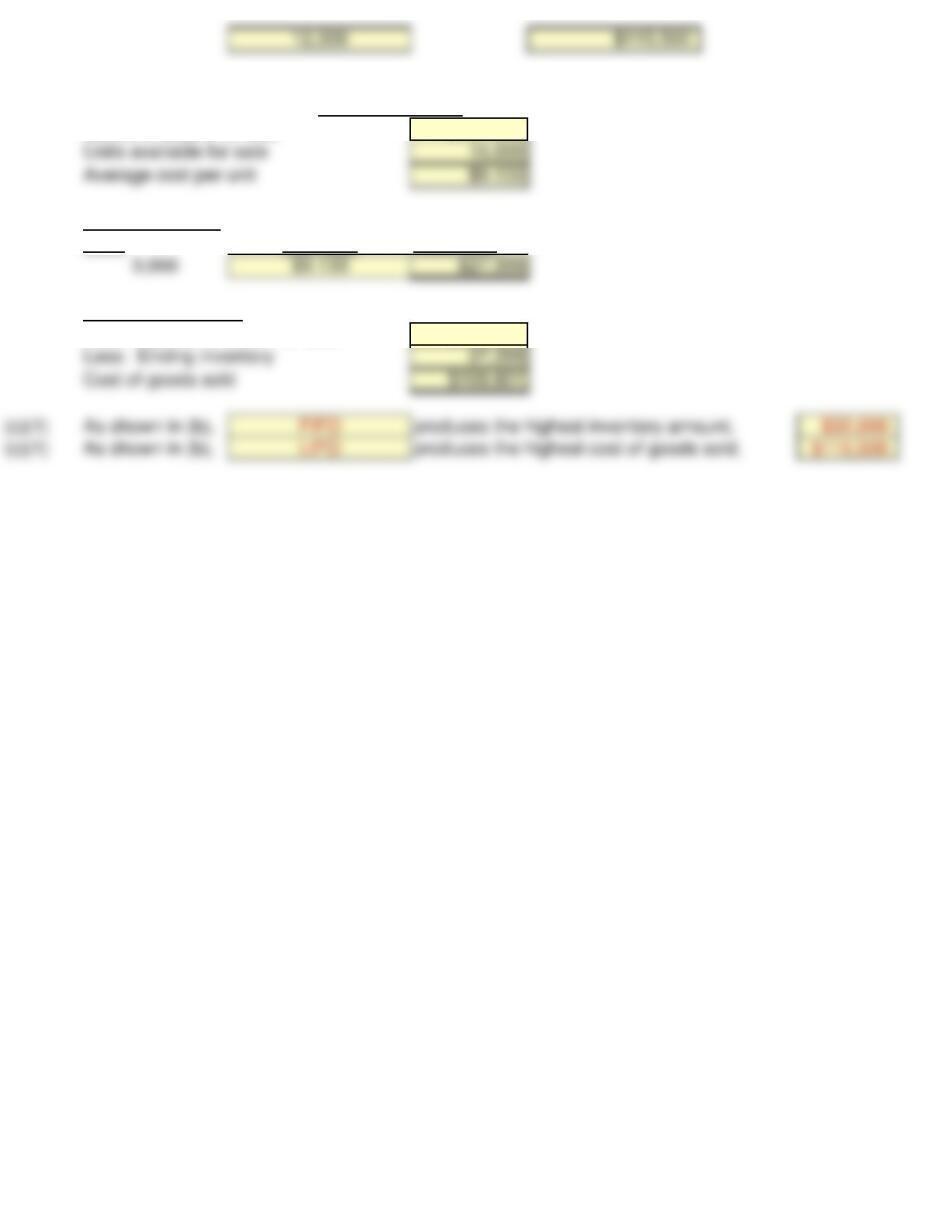
Goods available for sale $137,000
(b)(1) Ending Inventory
Units Unit Cost Total Cost
(b)(2) Cost of Goods Sold
Cost of goods available for sale $137,000
AVERAGE COST
P6-2A Solution to additional question
1. Assume that number of units sold changed to 10,000 units. How does this change impact ending inventory
and cost of goods sold under FIFO, LIFO and Average cost?
(a) COST OF GOODS AVAILABLE FOR SALE
Date Explanation Units Unit Cost Total Cost
March 1 Beginning inventory 2,500 $7 $17,500
5 Purchase 2,000 8 16,000
(b)(1) Ending Inventory
Date Units Unit Cost Total Cost
March 26 2,000 $11 $22,000
(b)(2) Cost of Goods Sold
Cost of goods available for sale $137,000
Proof of Cost of Goods Sold
Date Units Unit Cost Total Cost
March 1 2,500 $7 $17,500
5 2,000 8 16,000
(b)(1) Ending Inventory
Date Units Unit Cost Total Cost
March 1 2,500 $7 $17,500
(b)(2) Cost of Goods Sold
Cost of goods available for sale $137,000
Proof of Cost of Goods Sold
Date Units Unit Cost Total Cost
March 26 2,000 $11 $22,000
FIFO
LIFO
Goods available for sale $137,000
(b)(1) Ending Inventory
Units Unit Cost Total Cost
(b)(2) Cost of Goods Sold
Cost of goods available for sale $137,000
AVERAGE COST
P6-3A Determine cost of goods sold and ending inventory using FIFO, LIFO, and average-cost
in a periodic inventory system and assess financial statement effects.
Vista Company Inc. had a beginning inventory of 100 units of Product RST at a cost of
$8 per unit. During the year, purchases were:
Feb. 20 600 units at $9 Aug 12 400 units at $11
May 5 500 units at $10 Dec 8 100 units at $12
Vista Company uses a periodic inventory system. Sale totaled 1,500 units.
Instructions
(a) Determine the cost of goods available for sale.
(b) Determine the ending inventory and the cost of goods sold under each of the assumed
cost flow methods (FIFO, LIFO, and average-cost). Prove the accuracy of the cost of goods
sold under the FIFO and LIFO methods. (Round average unit cost to three decimal places.)
(c ) Which cost flow method results in the lowest inventory amount for the balance sheet?
The lowest cost of goods sold for the income statement?
NOTE: Enter a number in cells requesting a value; enter either a number or a formula in cells with a “?” .
Enter a textual answer in the cells with “TEXT.”
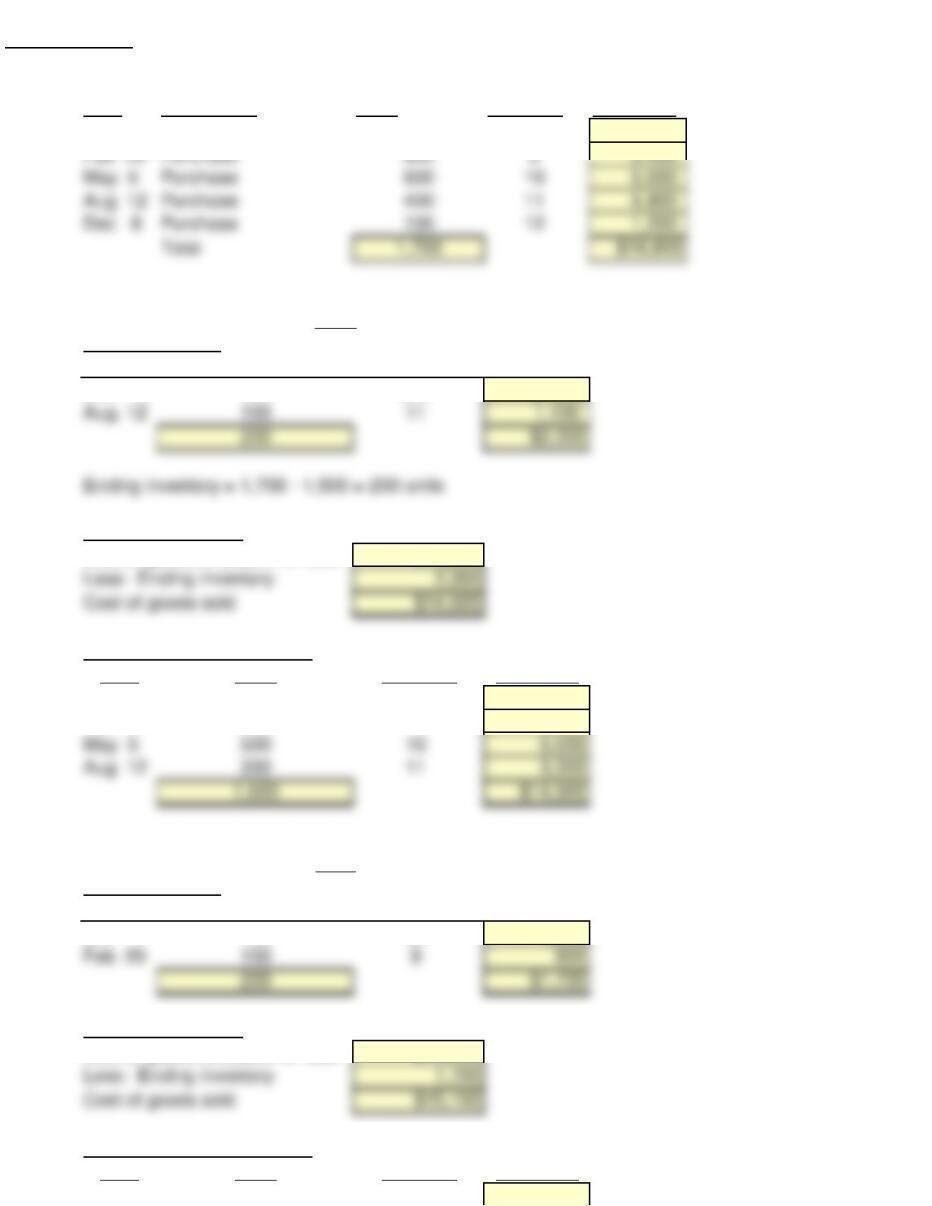
(a) COST OF GOODS AVAILABLE FOR SALE
Date Explanation Units Unit Cost Total Cost
Jan 1 Beginning inventory 100 $8 Value
Feb 20 Purchase 600 9 Value
May 5 Purchase 500 10 Value
Aug 12 Purchase 400 11 Value
Dec 8 Purchase 100 12 Value
Total ? ?
(b)(1) Ending Inventory
Date Units Unit Cost Total Cost
Dec 8 100 $12 Value
Aug. 12 100 11 Value
? ?
(b)(2) Cost of Goods Sold
Cost of goods available for sale Value
Less: Ending inventory Value
Cost of goods sold ?
Proof of Cost of Goods Sold
Date Units Unit Cost Total Cost
Jan 1 100 $8 Value
Feb 20 600 9 Value
May 5 500 10 Value
Aug 12 300 11 Value
? ?
(b)(1) Ending Inventory
Date Units Unit Cost Total Cost
Jan 1 100 $8 Value
Feb 20 100 9 Value
FIFO
LIFO
? ?
(b)(2) Cost of Goods Sold
Cost of goods available for sale Value
Less: Ending inventory Value
Cost of goods sold ?
Proof of Cost of Goods Sold
Date Units Unit Cost Total Cost
Dec 8 100 $12 Value
Aug 12 400 11 Value
May 5 500 10 Value
Feb 20 500 9 Value
? ?
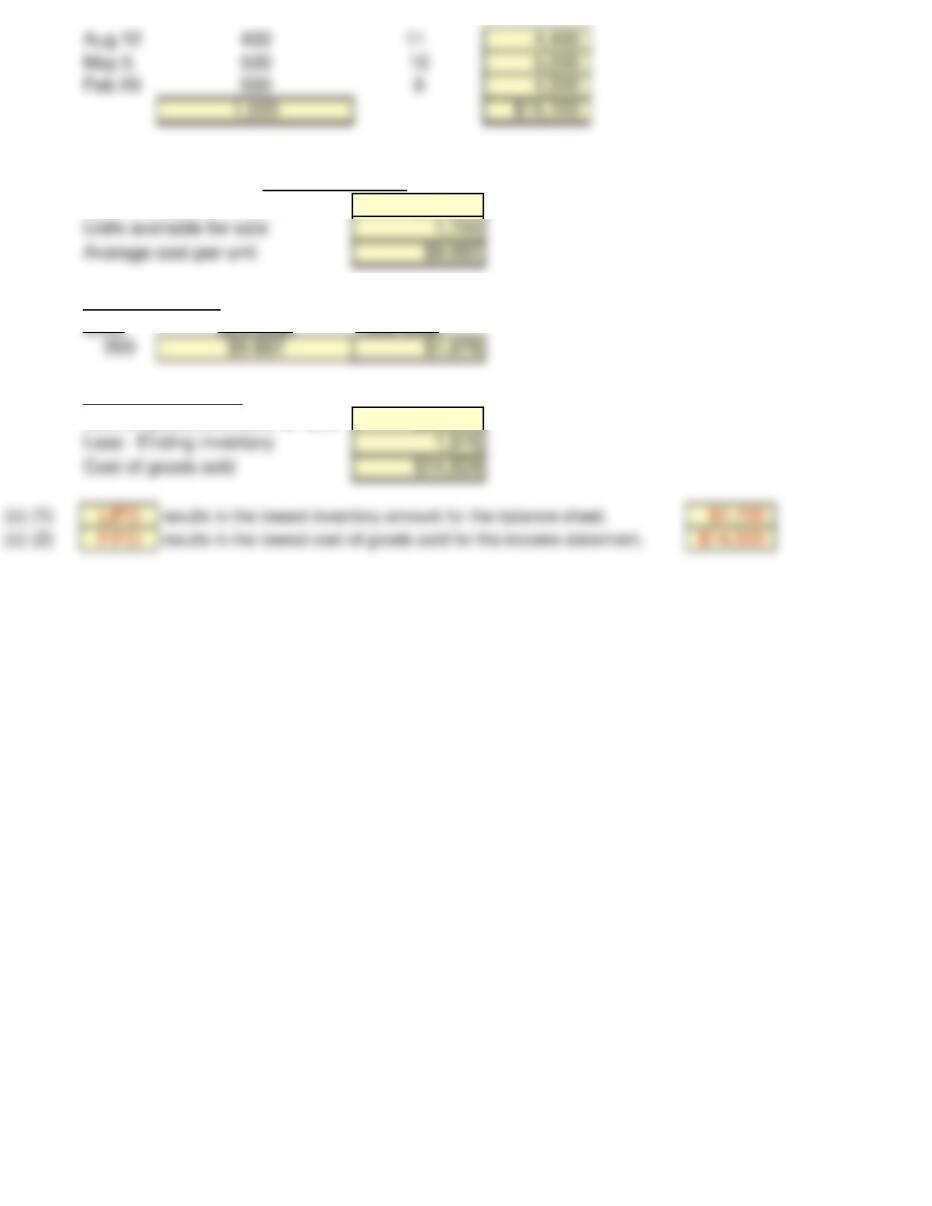
Goods available for sale Value
Units available for sale Value
Average cost per unit ?
(b)(1) Ending Inventory
Units Unit Cost Total Cost
200 Value ?
(b)(2) Cost of Goods Sold
Cost of goods available for sale Value
Less: Ending inventory Value
Cost of goods sold ?
Proof of Cost of Goods Sold
1500 x Value ?
(c) (1) TEXT results in the lowest inventory amount for the balance sheet, Value
(c) (2) TEXT results in the lowest cost of goods sold for the income statement, Value
After you have completed P6-3A, consider the additional question.
1. Assume the units sold changed to 1,400 units. Recompute ending inventory and cost of goods sold
under FIFO, LIFO and average cost.
AVERAGE COST
P6-3A Solution
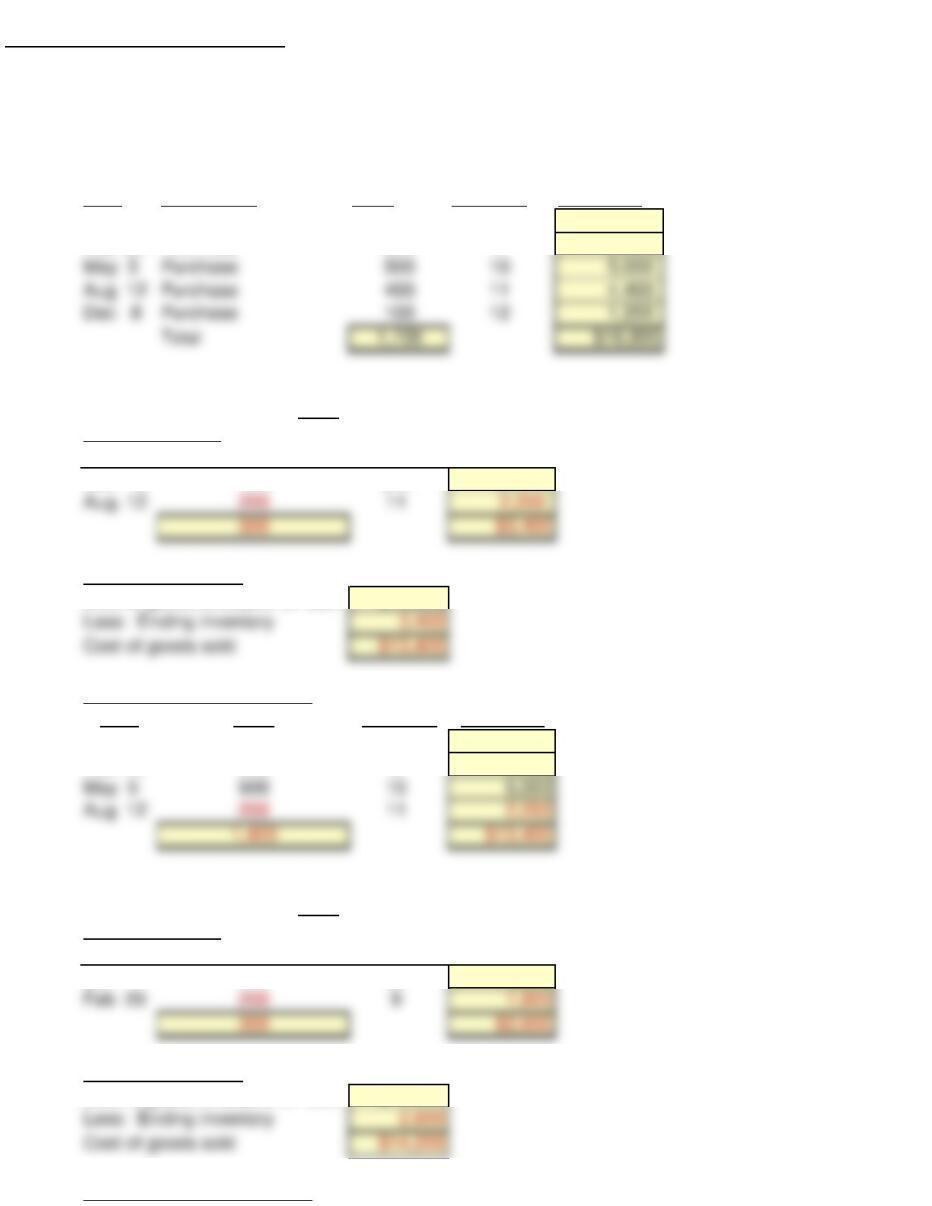
(a) COST OF GOODS AVAILABLE FOR SALE
Date Explanation Units Unit Cost Total Cost
Jan 1 Beginning inventory 100 $8 $800
(b)(1) Ending Inventory
Date Units Unit Cost Total Cost
Dec 8 100 $12 $1,200
(b)(2) Cost of Goods Sold
Cost of goods available for sale $16,800
Proof of Cost of Goods Sold
Date Units Unit Cost Total Cost
Jan 1 100 $8 $800
Feb 20 600 9 5,400
(b)(1) Ending Inventory
Date Units Unit Cost Total Cost
Jan 1 100 $8 $800
(b)(2) Cost of Goods Sold
Cost of goods available for sale $16,800
Proof of Cost of Goods Sold
Date Units Unit Cost Total Cost
Dec 8 100 $12 $1,200
FIFO
LIFO
Goods available for sale $16,800
(b)(1) Ending Inventory
Units Unit Cost Total Cost
(b)(2) Cost of Goods Sold
Cost of goods available for sale $16,800
AVERAGE COST
P6-3A Solution to additional question
1. Assume the units sold changed to 1,400 units. Recompute ending inventory and cost of goods sold
under FIFO, LIFO and average cost.
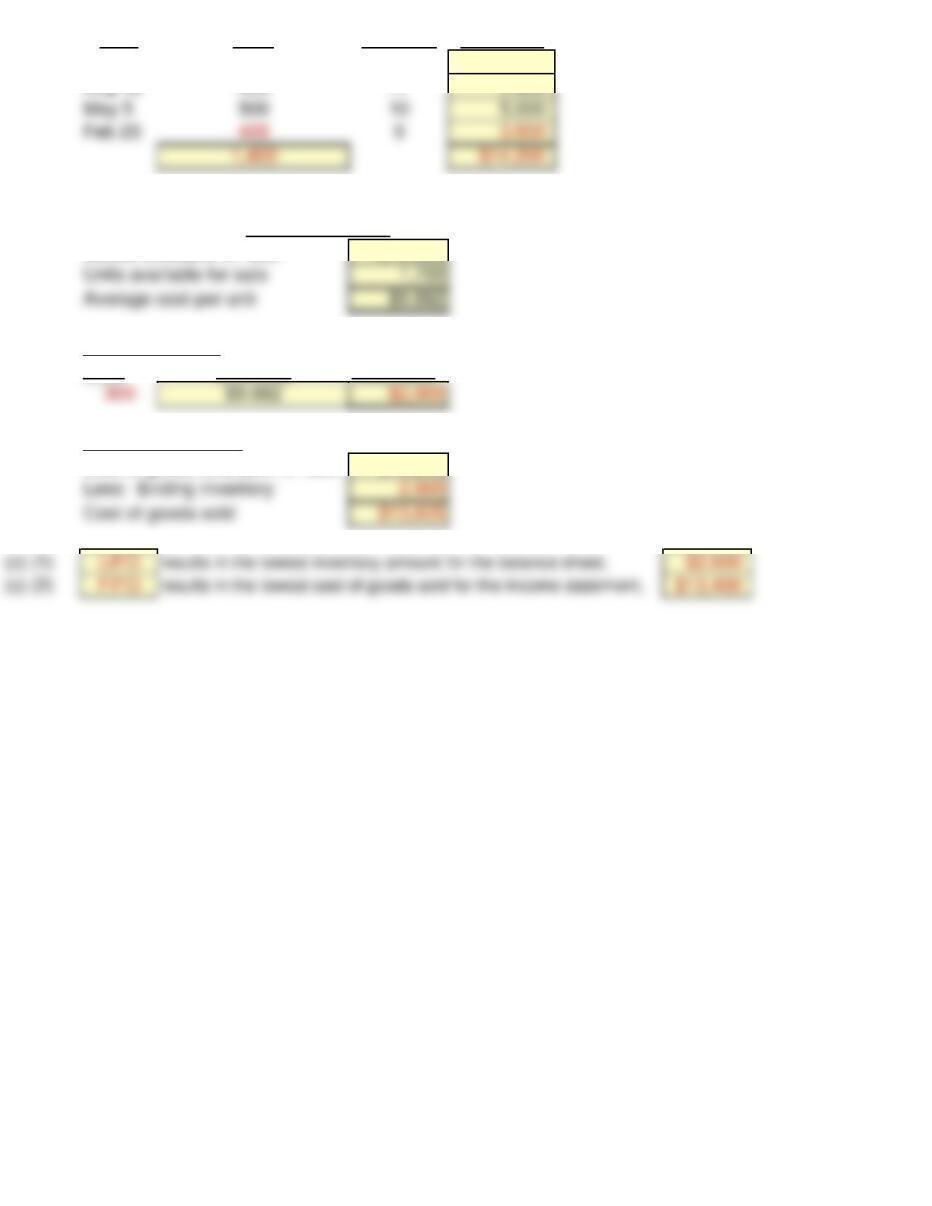
(a) COST OF GOODS AVAILABLE FOR SALE
Date Explanation Units Unit Cost Total Cost
Jan 1 Beginning inventory 100 $8 $800
Feb 20 Purchase 600 9 5,400
(b)(1) Ending Inventory
Date Units Unit Cost Total Cost
Dec 8 100 $12 $1,200
(b)(2) Cost of Goods Sold
Cost of goods available for sale $16,800
Proof of Cost of Goods Sold
Date Units Unit Cost Total Cost
Jan 1 100 $8 $800
Feb 20 600 9 5,400
(b)(1) Ending Inventory
Date Units Unit Cost Total Cost
Jan 1 100 $8 $800
(b)(2) Cost of Goods Sold
Cost of goods available for sale $16,800
Proof of Cost of Goods Sold
FIFO
LIFO
Date Units Unit Cost Total Cost
Dec 8 100 $12 $1,200
Aug 12 400 11 4,400
Goods available for sale $16,800
(b)(1) Ending Inventory
Units Unit Cost Total Cost
(b)(2) Cost of Goods Sold
Cost of goods available for sale $16,800
AVERAGE COST
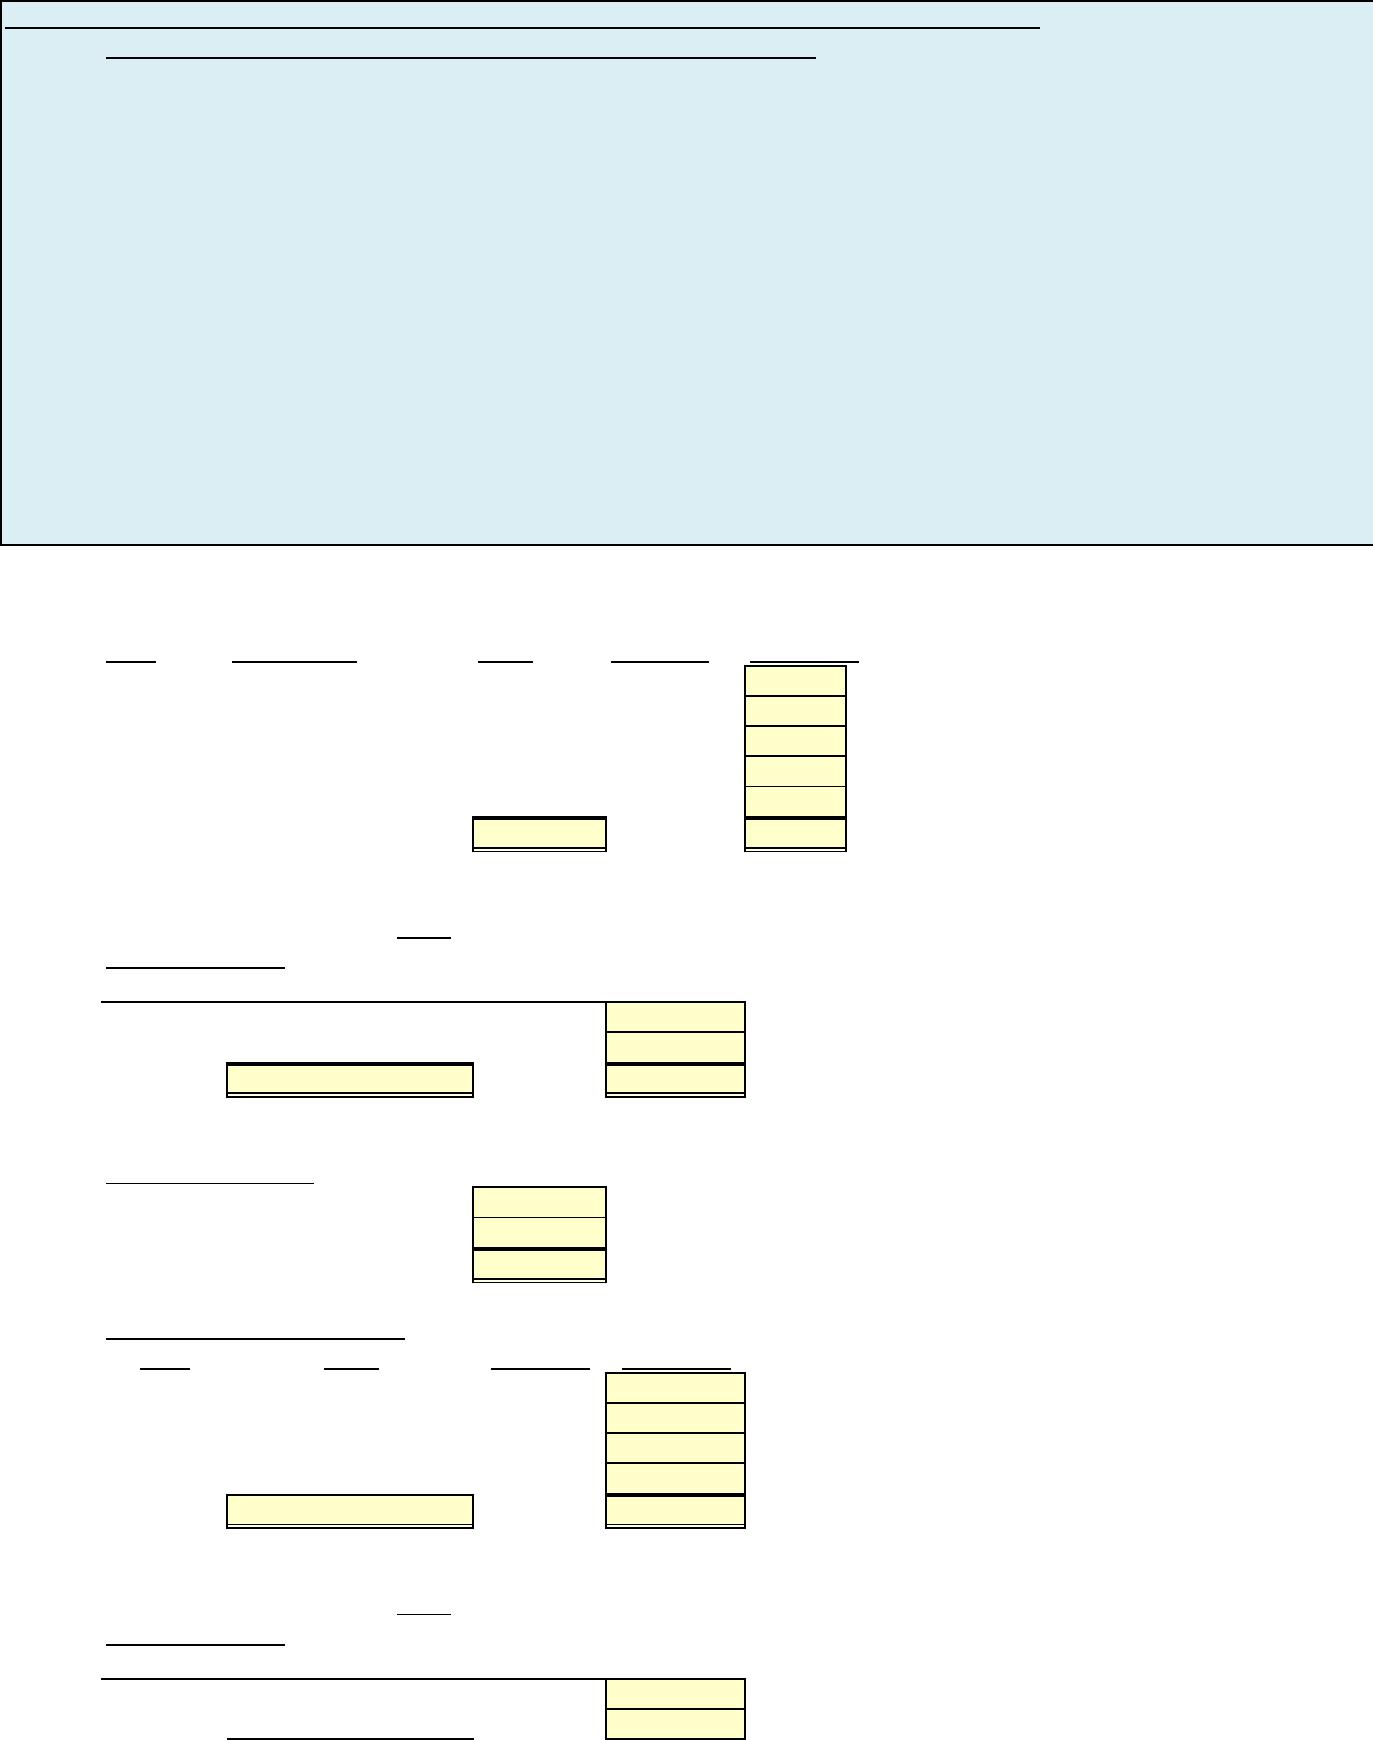
P6-3B Determine cost of goods sold and ending inventory using FIFO, LIFO, and average-cost in
a periodic inventory system and assess financial statement effects.
Smythe Company Inc. had a beginning inventory of 200 units of Product ERV at a cost of
$6 per unit. During the year, purchases were:
Jan. 24 800 units at $7 Aug 19 600 units at $9
Apr. 12 400 units at $8 Nov 30 350 units at $10
Smythe Company uses a periodic inventory system. Sale totaled 1,900 units.
Instructions
(a) Determine the cost of goods available for sale.
(b) Determine the ending inventory and the cost of goods sold under each of the assumed
cost flow methods (FIFO, LIFO, and average-cost). Prove the accuracy of the cost of goods
sold under the FIFO and LIFO methods. (Round average unit cost to three decimal places.)
(c ) Which cost flow method results in the lowest inventory amount for the balance sheet?
The lowest cost of goods sold for the income statement?
NOTE: Enter a number in cells requesting a value; enter either a number or a formula in cells with a “?” .
(a) COST OF GOODS AVAILABLE FOR SALE
Date Explanation Units Unit Cost Total Cost
Jan. 1 Beginning inventory 200 $6 Value
24 Purchase 800 7 Value
Apr. 12 Purchase 400 8 Value
Aug. 19 Purchase 600 9 Value
Nov 30 Purchase 350 10 Value
Total ? ?
(b)(1) Ending Inventory
Date Units Unit Cost Total Cost
Nov 30 350 $10 Value
Aug. 19 100 9 Value
? ?
(b)(2) Cost of Goods Sold
Cost of goods available for sale Value
Less: Ending inventory Value
Cost of goods sold Value
Proof of Cost of Goods Sold
Date Units Unit Cost Total Cost
Jan. 1 200 $6 Value
Jan. 24 800 7 Value
Apr. 12 400 8 Value
Aug. 19 500 9 Value
? ?
(b)(1) Ending Inventory
Date Units Unit Cost Total Cost
Jan. 1 200 $6 Value
Jan. 24 250 7 Value
FIFO
LIFO
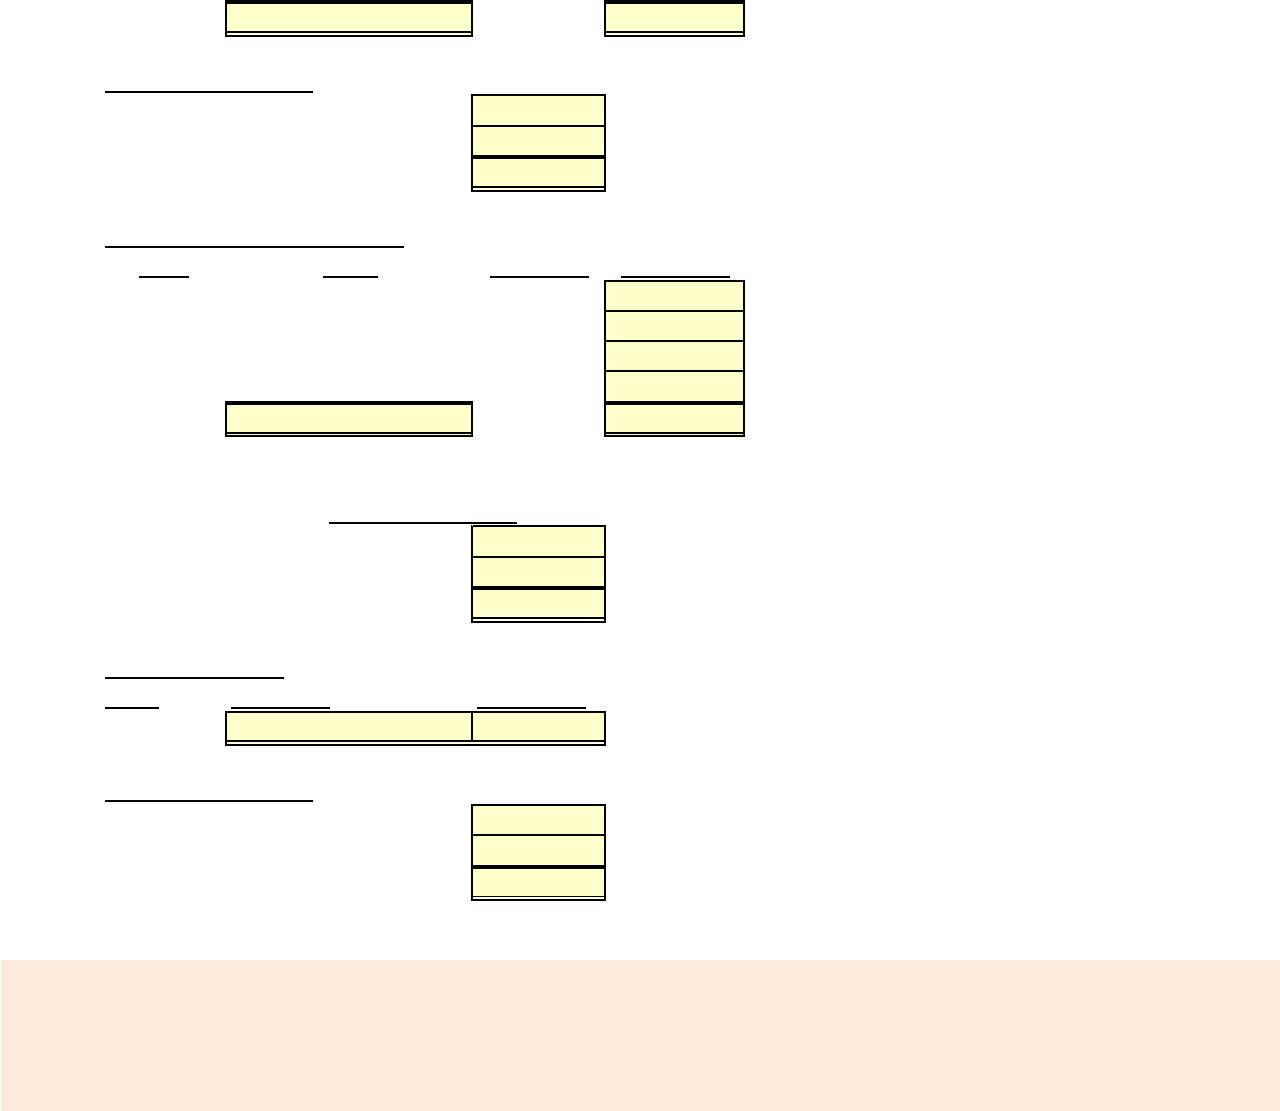
? ?
(b)(2) Cost of Goods Sold
Cost of goods available for sale Value
Less: Ending inventory Value
Cost of goods sold ?
Proof of Cost of Goods Sold
Date Units Unit Cost Total Cost
Nov. 30 350 $10 Value
Aug. 19 600 9 Value
Apr. 12 400 8 Value
Jan. 24 550 7 Value
? ?
Goods available for sale Value
Units available for sale Value
Average cost per unit ?
(b)(1) Ending Inventory
Units Unit Cost Total Cost
450 Value ?
(b)(2) Cost of Goods Sold
Cost of goods available for sale Value
Less: Ending inventory Value
Cost of goods sold ?
After you have completed P6-3B, consider the additional question.
1. Assume the units sold changed to 2,000 units. Recompute ending inventory and cost of goods sold
under FIFO, LIFO and average cost.
AVERAGE COST
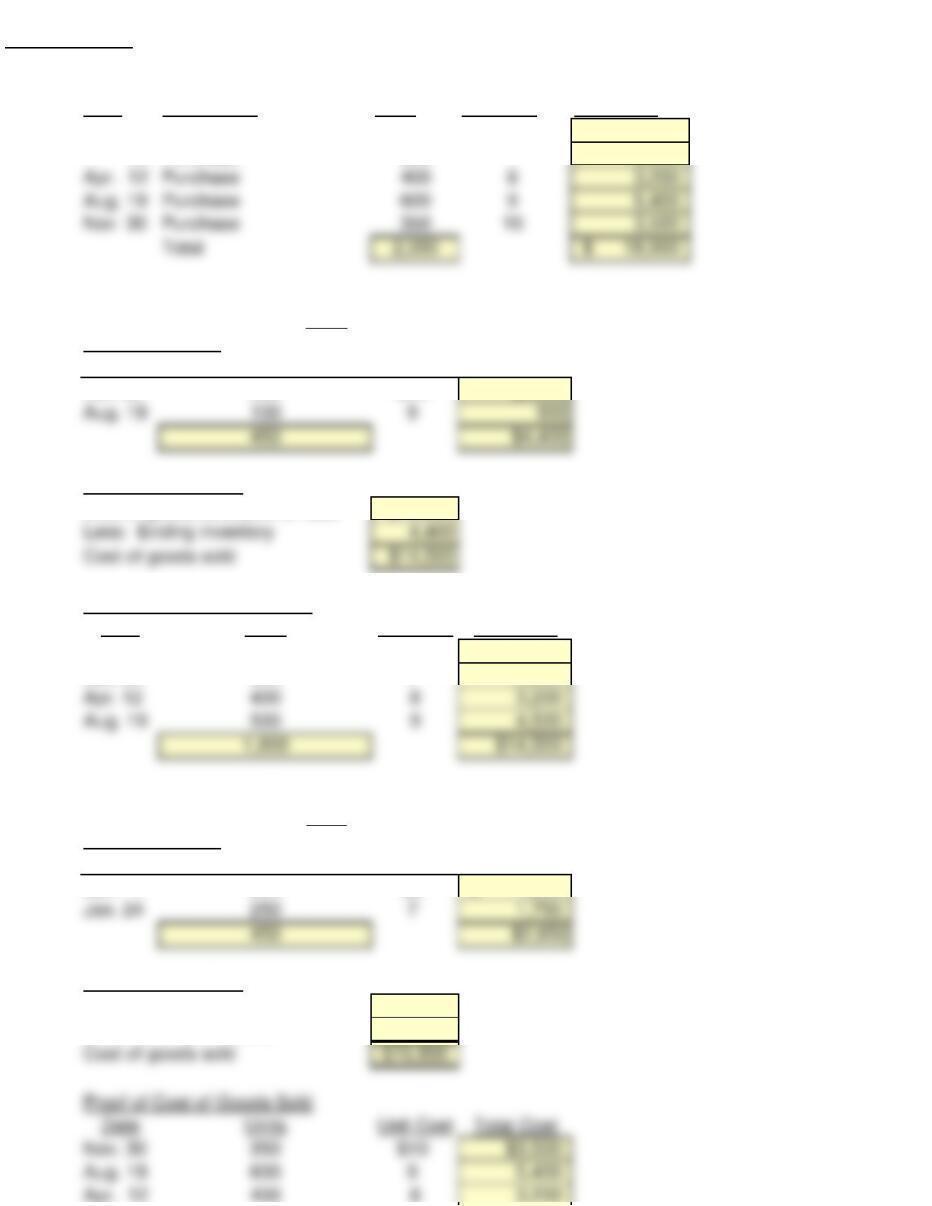
P6-3B Solution
(a) COST OF GOODS AVAILABLE FOR SALE
Date Explanation Units Unit Cost Total Cost
Jan. 1 Beginning inventory 200 $6 1,200$
24 Purchase 800 7 5,600
(b)(1) Ending Inventory
Date Units Unit Cost Total Cost
Nov 30 350 $10 $3,500
(b)(2) Cost of Goods Sold
Cost of goods available for sale $18,900
Proof of Cost of Goods Sold
Date Units Unit Cost Total Cost
Jan 1 200 $6 $1,200
Jan. 24 800 7 5,600
(b)(1) Ending Inventory
Date Units Unit Cost Total Cost
Jan. 1 200 $6 1,200$
(b)(2) Cost of Goods Sold
Cost of goods available for sale $18,900
Less: Ending inventory 2,950
FIFO
LIFO
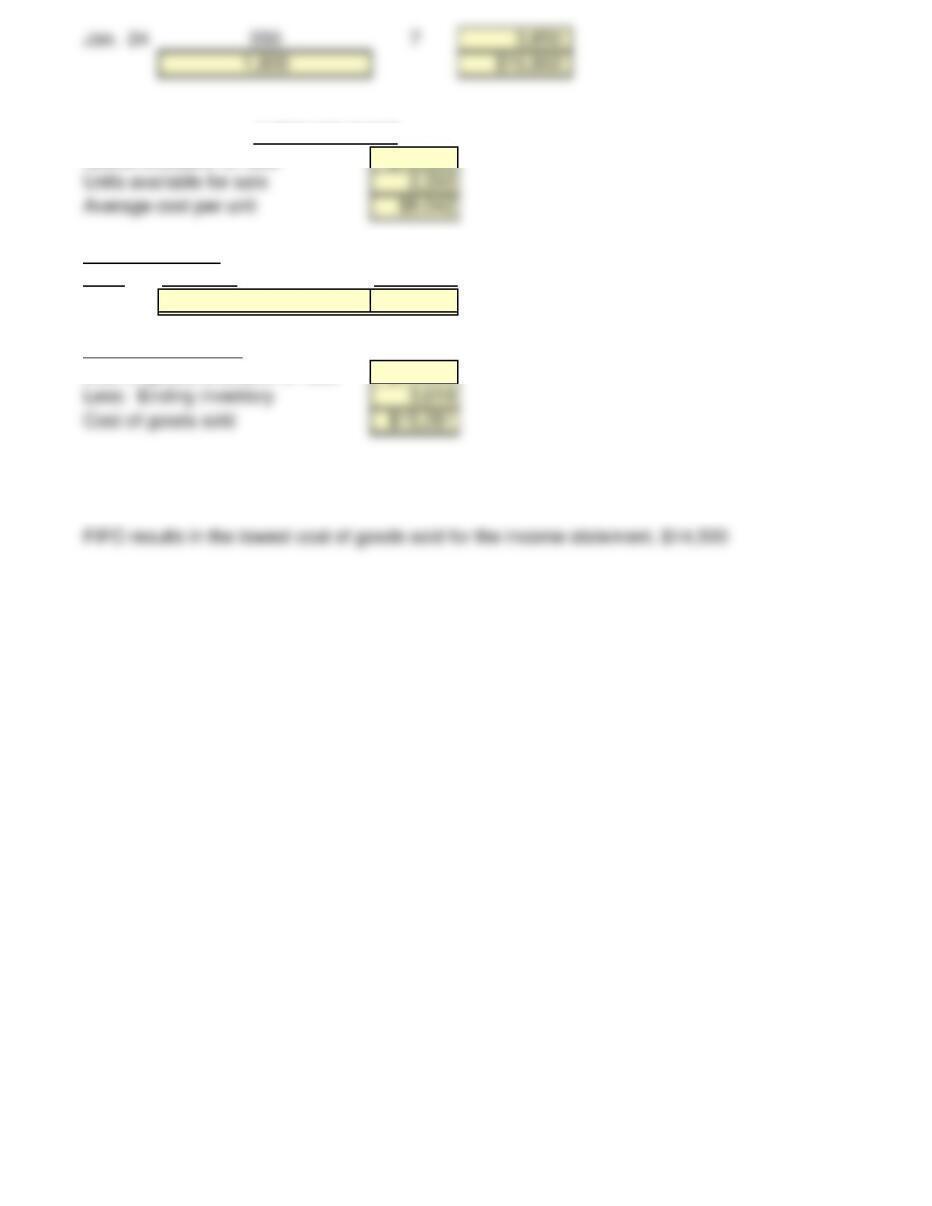
Goods available for sale $18,900
(b)(1) Ending Inventory
Units Unit Cost Total Cost
450 $8.042 $3,619
(b)(2) Cost of Goods Sold
Cost of goods available for sale $18,900
(c ) Due to rising prices, LIFO results in the lowest inventory amount for the balance sheet, $2,950
AVERAGE COST
P6-3B Solution to additional question
Assume the units sold changed to 2,000 units. Recompute ending inventory and cost of goods sold
under FIFO, LIFO and average cost.
(a) COST OF GOODS AVAILABLE FOR SALE
Date Explanation Units Unit Cost Total Cost
Jan. 1 Beginning inventory 200 $6 $1,200
24 Purchase 800 7 5,600
(b)(1) Ending Inventory
Date Units Unit Cost Total Cost
Nov 30 350 $10 $3,500
(b)(2) Cost of Goods Sold
Cost of goods available for sale $18,900
Proof of Cost of Goods Sold
Date Units Unit Cost Total Cost
Jan 1 200 $6 1,200$
(b)(1) Ending Inventory
Date Units Unit Cost Total Cost
Jan. 1 200 $6 1,200$
(b)(2) Cost of Goods Sold
Cost of goods available for sale $18,900
Proof of Cost of Goods Sold
Date Units Unit Cost Total Cost
Nov. 30 350 $10 $3,500
FIFO
LIFO
Goods available for sale $18,900
(b)(1) Ending Inventory
Units Unit Cost Total Cost
(b)(2) Cost of Goods Sold
Cost of goods available for sale $18,900
AVERAGE COST