Problem 06-46 Student Name:
Class:
Airport
Month Flights Costs
January * *
February * *
March * *
April * *
May * *
June * *
July * *
August * *
September * *
October * *
November * *
December * *
2. Least-squares regression:
(a) Tabulation of data:
Dependent
Independent
Variable Variable
(cost in (flights in
thousands)
hundreds)
Month Y X
X2XY
January * * * *
February * * * *
March * * * *
April * * * *
May * * * *
June * * * *
July * * * *
August * * * *
September * * * *
October * * * *
November * * * *
December * * * *
Total * * * *
(b) Calculation of parameters:
(∑Y) (∑X2)–(∑X) (∑XY)
n (∑X2)–(∑X) (∑X)
a = *
n (∑XY) –(∑X) (∑Y)
n (∑X2)–(∑X) (∑X)
b = *
(c) Fixed- and variable-cost components:
Monthly fixed cost = *
Variable cost = *per hundred flights
3. Cost equation
Total monthly airport cost = *+*X
where X denotes the number of flights in hundreds.
4. Cost prediction for 1,600 flights
Airport cost for the month = *
5. Calculation and interpretation of R2
Formula for calculation
S(Y-Y1)2
S(Y-Ÿ)2
Where Y
denotes the observed value of the dependent
variable (cost) at a particular activity level
Y1
denotes the predicted value of the dependent
variable (cost) based on the regression line,
at a particular activity level
Ÿdenotes the mean (average) observation of the
dependent variable (cost)
Tabulation of data: Predicted Cost
(in thousands)
Based on
Regression
Month Y X Line Y’
[(Y-Y‘)2]†[(Y-Ÿ)2]†
a =
b =
R2 =1-
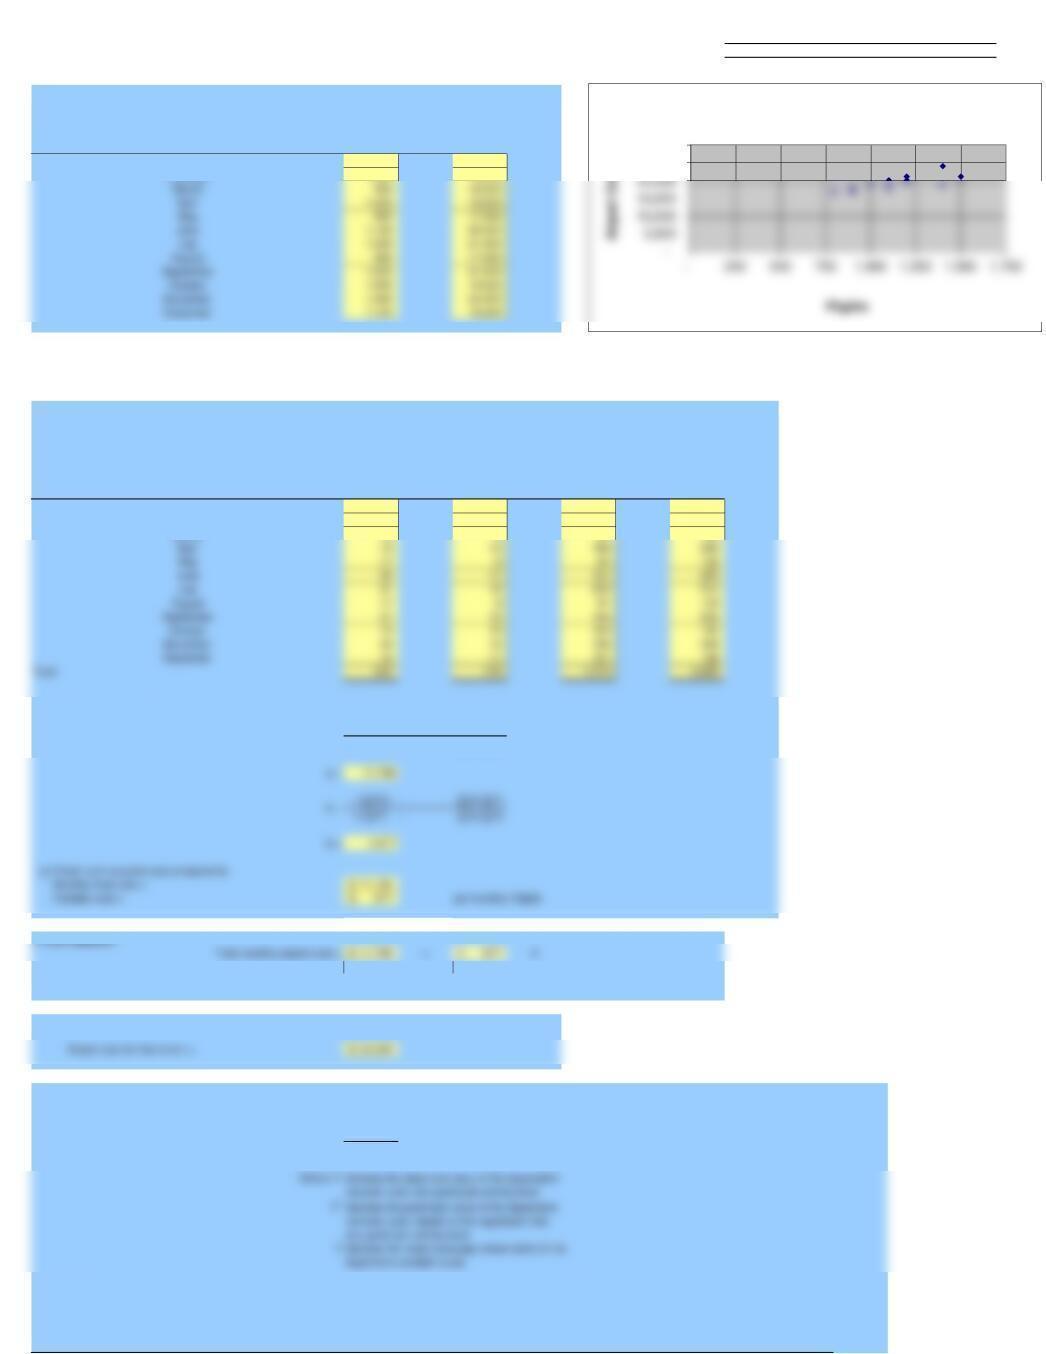
1. Scatter diagram:
Jefferson County Airport

January 20 11 * * *
February 17 8* * *
March 19 14 * * *
April 18 9* * *
May 19 10 * * *
June 20 12 * * *
July 18 11 * * *
August 24 14 * * *
September 19 10 * * *
October 21 12 * * *
November 17 9* * *
December 21 15 * * *
Total 233 135 * *
†Rounded
Calculation of R2:*
Briefly interpret R2:
Problem 06-46 Student Name:
Class:
Airport
Month Flights Costs
January 1,200 20,000
February 1,000 19,000
2. Least-squares regression:
(a) Tabulation of data:
Dependent Independent
Variable Variable
(cost in (flights in
thousands)
hundreds)
Month Y X
X2XY
January 20 12 144 240
February 19 10 100 190
March 18 9 81 162
(b) Calculation of parameters:
(∑Y) (∑X2)–(∑X) (∑XY)
n (∑X2)–(∑X) (∑X)
n (∑X2)–(∑X) (∑X)
where X denotes the number of flights in hundreds.
4. Cost prediction for 1,600 flights
5. Calculation and interpretation of R2
Formula for calculation
S(Y-Y1)2
S(Y-Ÿ)2
Tabulation of data: Predicted Cost
(in thousands)
Based on
Regression
Month Y X Line Y’
[(Y-Y’)2]†[(Y-Ÿ)2]†
January 20 12 19.920 0.006 0.340
February 19 10 18.566 0.188 0.174
March 18 9 17.889 0.012 2.007
a =
R2 =1-
Instructor
McGraw-Hill/Irwin
1. Scatter diagram:
Jefferson County Airport
25,000
30,000
Jefferson County Airport
May 17 8 17.212 0.045 5.840
Briefly interpret R2:
county’s cost estimation, a high R2 would mean that the county budget officer can be
the R2 , the better the regression line fits the data. The interpretation of a high R2 is that the
The coefficient of determination, R2, is a measure of the goodness of a fit of the least-squares
Calculation of R2:0.58
Problem 06-46 Student Name:
Class:
Airport
Month Flights Costs
January 1,200 20,000
February 1,000 19,000
March 900 18,000
2. Least-squares regression:
(a) Tabulation of data:
Dependent
Independent
Variable Variable
(cost in (flights in
thousands)
hundreds)
Month Y X
X2XY
January 20 12 144 240
February 19 10 100 190
(b) Calculation of parameters:
(∑Y) (∑X2)–
(∑X) (∑XY)
n (∑X2)–(∑X) (∑X)
where X denotes the number of flights in hundreds.
4. Cost prediction for 1,600 flights
5. Calculation and interpretation of R2
Formula for calculation
Tabulation of data: Predicted Cost
(in thousands)
Based on
Regression
Month Y X Line Y’
[(Y-Y’)2]†[(Y-Ÿ)2]†
January 20 12 19.920 0.006 0.340
February 19 10 18.566 0.188 0.174
Instructor
McGraw-Hill/Irwin
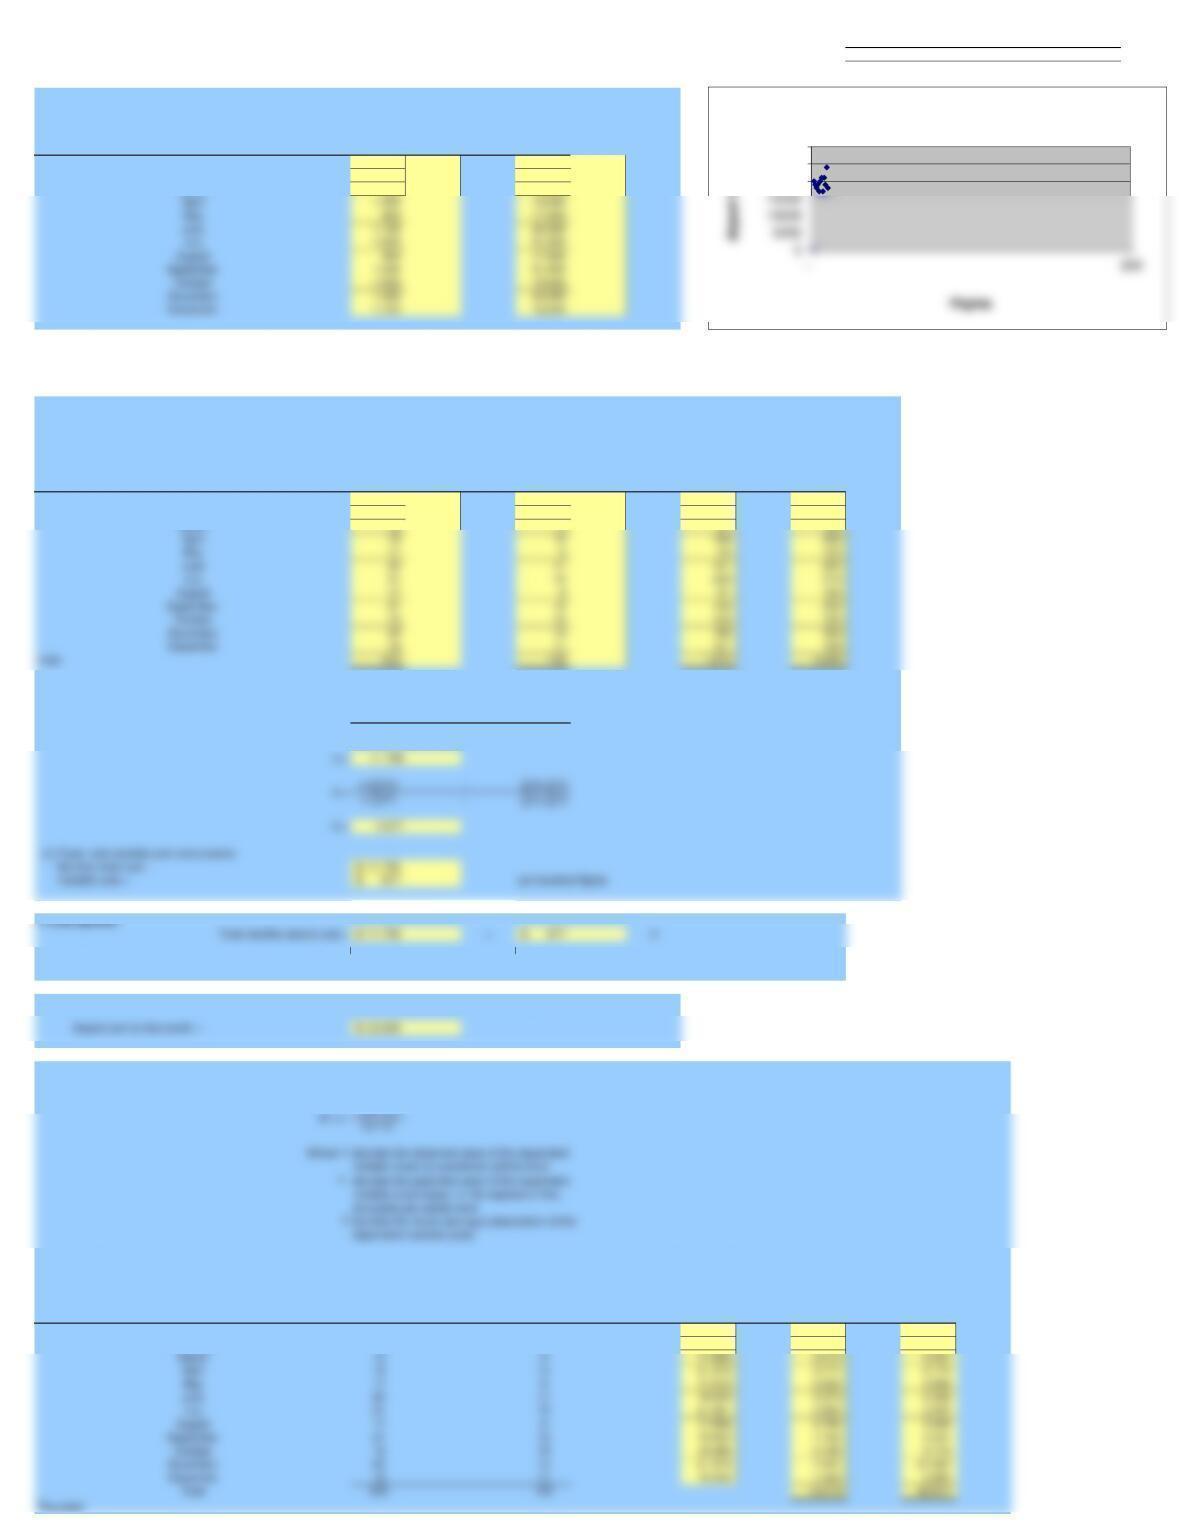
1. Scatter diagram:
Jefferson County Airport
a =
20000
25000
30000
Jefferson County Airport

Briefly interpret R2:
The coefficient of determination, R2, is a measure of the goodness of a fit of the least-squares
county’s cost estimation, a high R2 would mean that the county budget officer can be
An R2 of .58 is not particularly high.