Chapter 06 – Activity Analysis, Cost Behavior, and Cost Estimation
6-1
CHAPTER 6
Activity Analysis, Cost Behavior, and Cost
Estimation
ANSWERS TO REVIEW QUESTIONS
6-1 Cost behavior patterns are important in the process of making cost predictions. Cost
predictions are used in planning, control, and decision making. For example, cost
6-2 a. Cost estimation is the process of determining how a particular cost behaves.
6-3 a. Hotel: Percentage of rooms occupied or the number of occupancy-days, where
an occupancy-day is defined as one room occupied for one day.
6-2
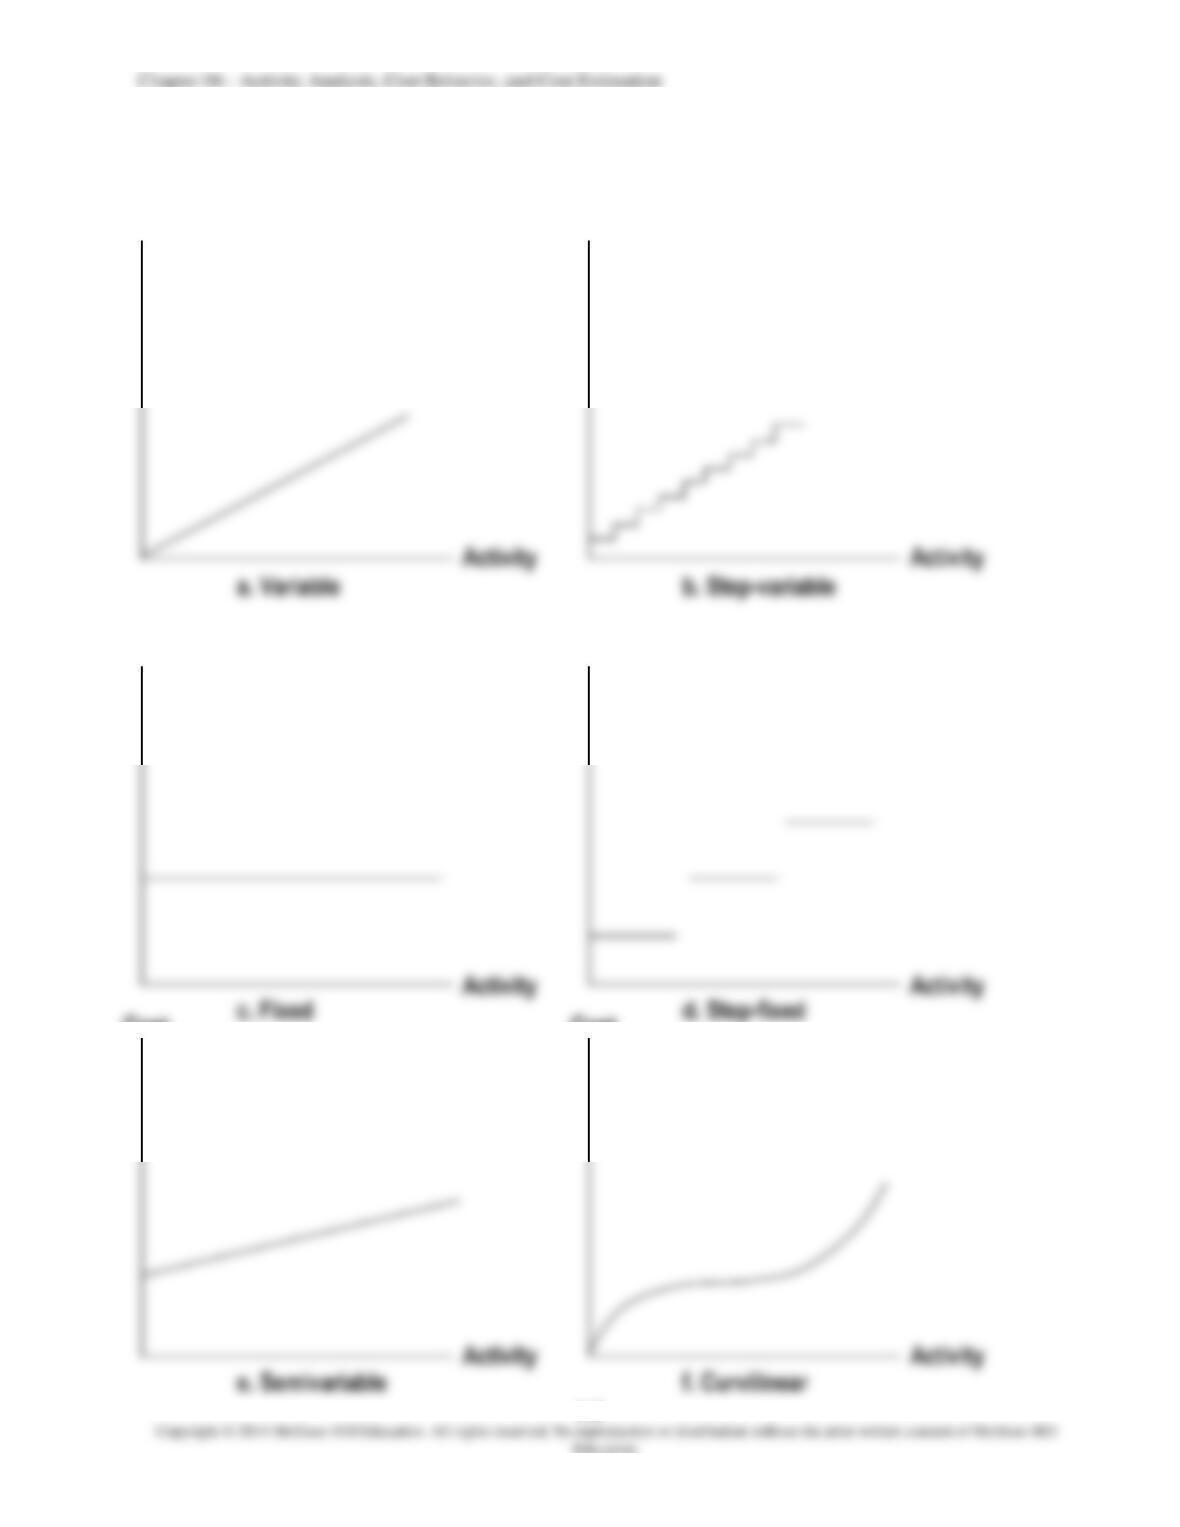
6-4 Graphs of the cost behavior patterns are as follows:
Cost
Cost
Cost
Cost
Cost
Cost
Chapter 06 – Activity Analysis, Cost Behavior, and Cost Estimation
6-3
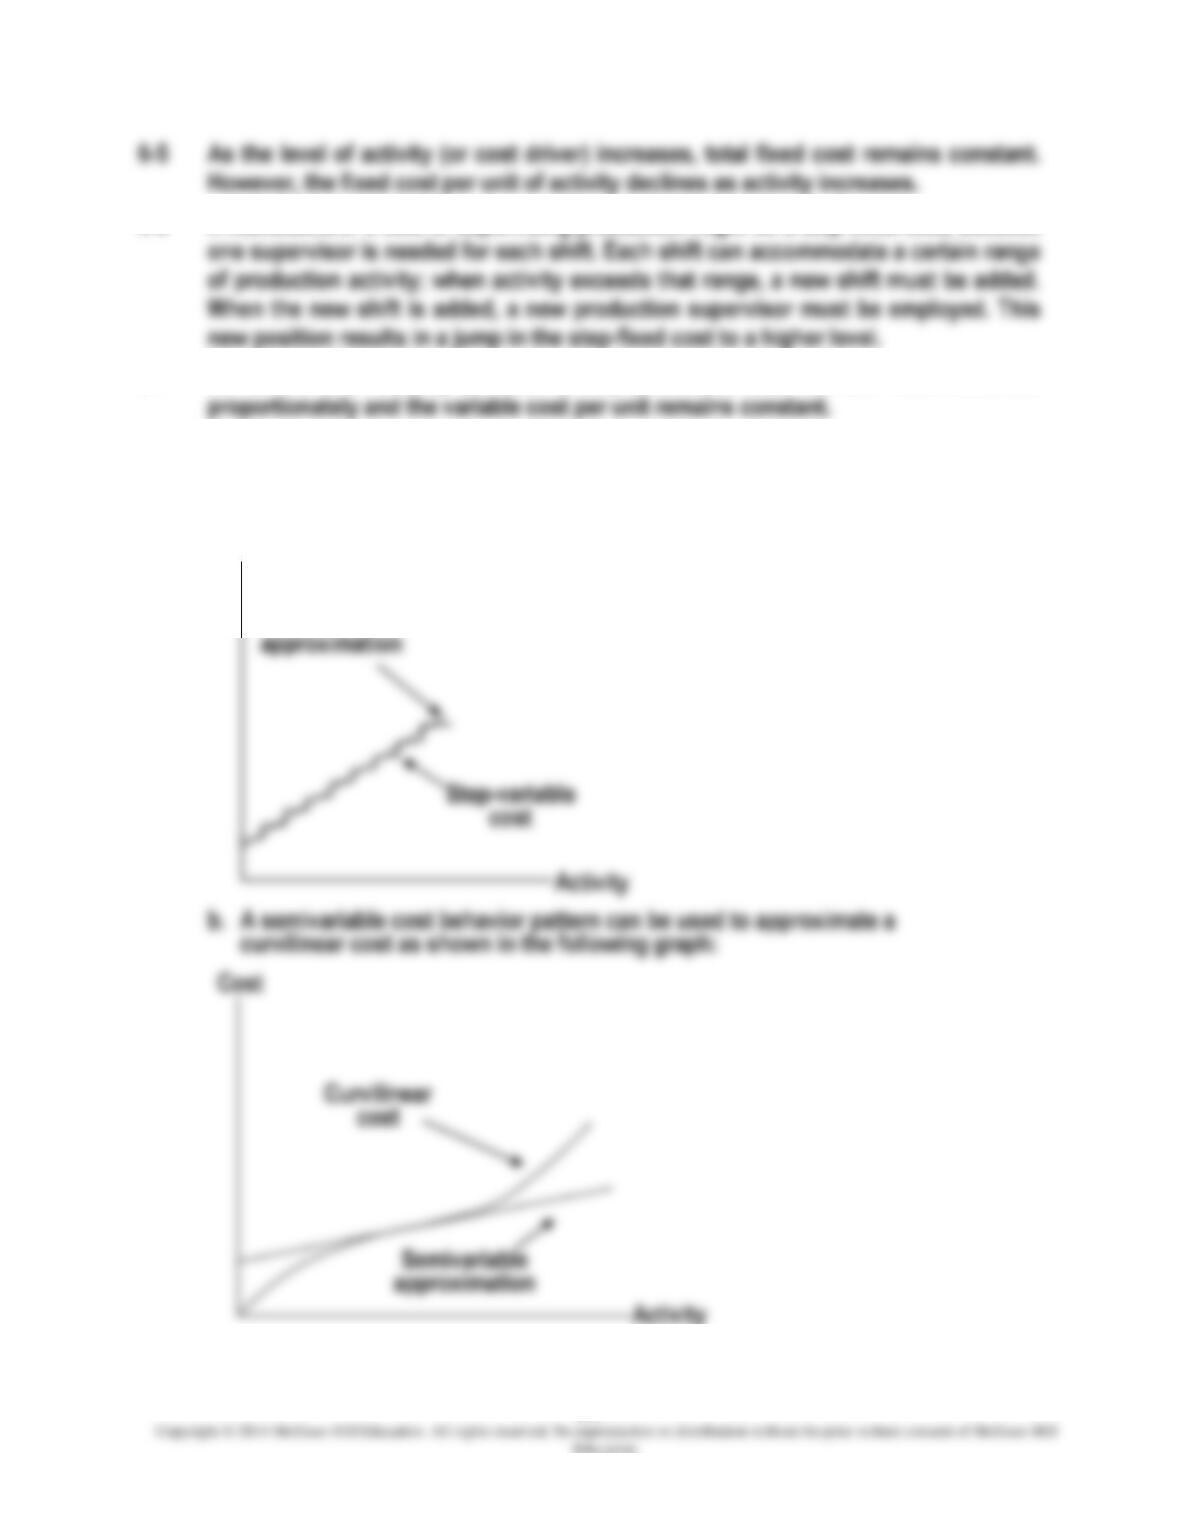
6-6 A manufacturer’s cost of supervising production might be a step-fixed cost, because
6-7 As the level of activity (or cost driver) increases, total variable cost increases
6-8 a. A semivariable cost behavior pattern can be used to approximate a step-variable
cost as shown in the following graph:
Semivariable
Cost
6-4
6-9 (a) Annual cost of maintaining an interstate highway: committed cost. (Once the
6-10 The cost analyst should respond by pointing out that in most cases a cost behavior
pattern should be limited to the relevant range of activity. When the firm’s utility cost
6-11 A learning curve shows how average labor time per unit of production changes as
cumulative output changes. In many production processes, as production activity
6-12 Appropriate independent variables for several tasks are as follows:
Chapter 06 – Activity Analysis, Cost Behavior, and Cost Estimation
6-5
6-13 An outlier is a data point that falls far away from the other points in the scatter
diagram and is not representative of the data. One possible cause of an outlier is
6-14 Fixed costs are often allocated on a per unit-of-activity basis. For example, fixed
manufacturing-overhead costs, such as depreciation, may be allocated to units of
6-15 In the first step of the visual-fit method of cost estimation, data points are plotted on
graph paper to form a scatter diagram. Then a line is drawn through the scatter
diagram in an attempt to minimize the distance between the line and the plotted
6-16 The chief drawback of the high-low method of cost estimation is that it uses only two
data points. The rest of the data are ignored by the method. An outlier can cause a
6-17 The term least squares in the least-squares regression method of cost estimation
6-6
6-18 A least-squares regression line may be expressed in equation form as follows:
Y = a + bX
6-20 Potential cost drivers in the cruise industry include the following: number of
6-21 A particular least-squares regression line may be evaluated on the basis of
economic plausibility or goodness of fit.
Chapter 06 – Activity Analysis, Cost Behavior, and Cost Estimation
6-7
SOLUTIONS TO EXERCISES
EXERCISE 6-22 (15 MINUTES)
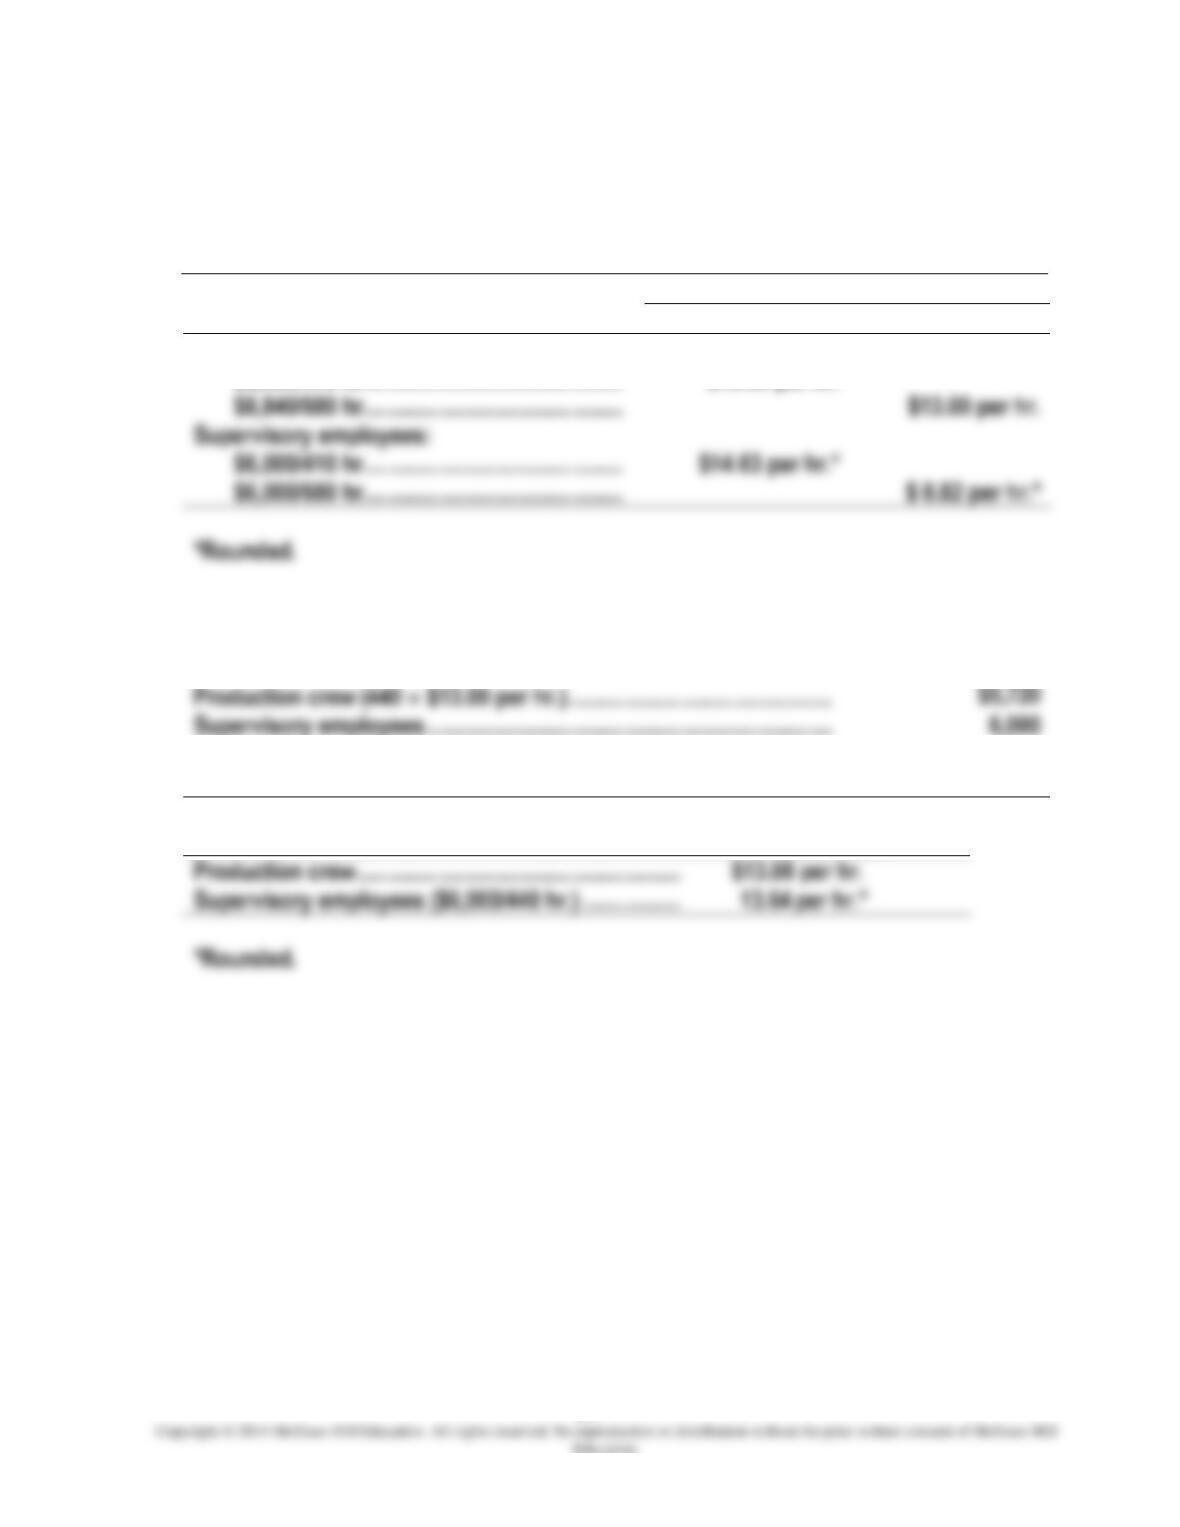
1.
Cost per Broadcast Hour
Cost Item
August
October
Production crew:
$5,330/410 hr. ……………………………………..
$13.00 per hr.
$8,840/680 hr. ……………………………………..
Supervisory employees:
$6,000/410 hr. ……………………………………..
$6,000/680 hr. ……………………………………..
*Rounded.
2.
December cost predictions:
Supervisory employees …………………………………………………………….
3.
Cost Item
Cost per Broadcast Hour
in December
Production crew ………………………………………………..
Supervisory employees ($6,000/440 hr.) ……………..
Chapter 06 – Activity Analysis, Cost Behavior, and Cost Estimation
6-8
EXERCISE 6-23 (40 MINUTES)
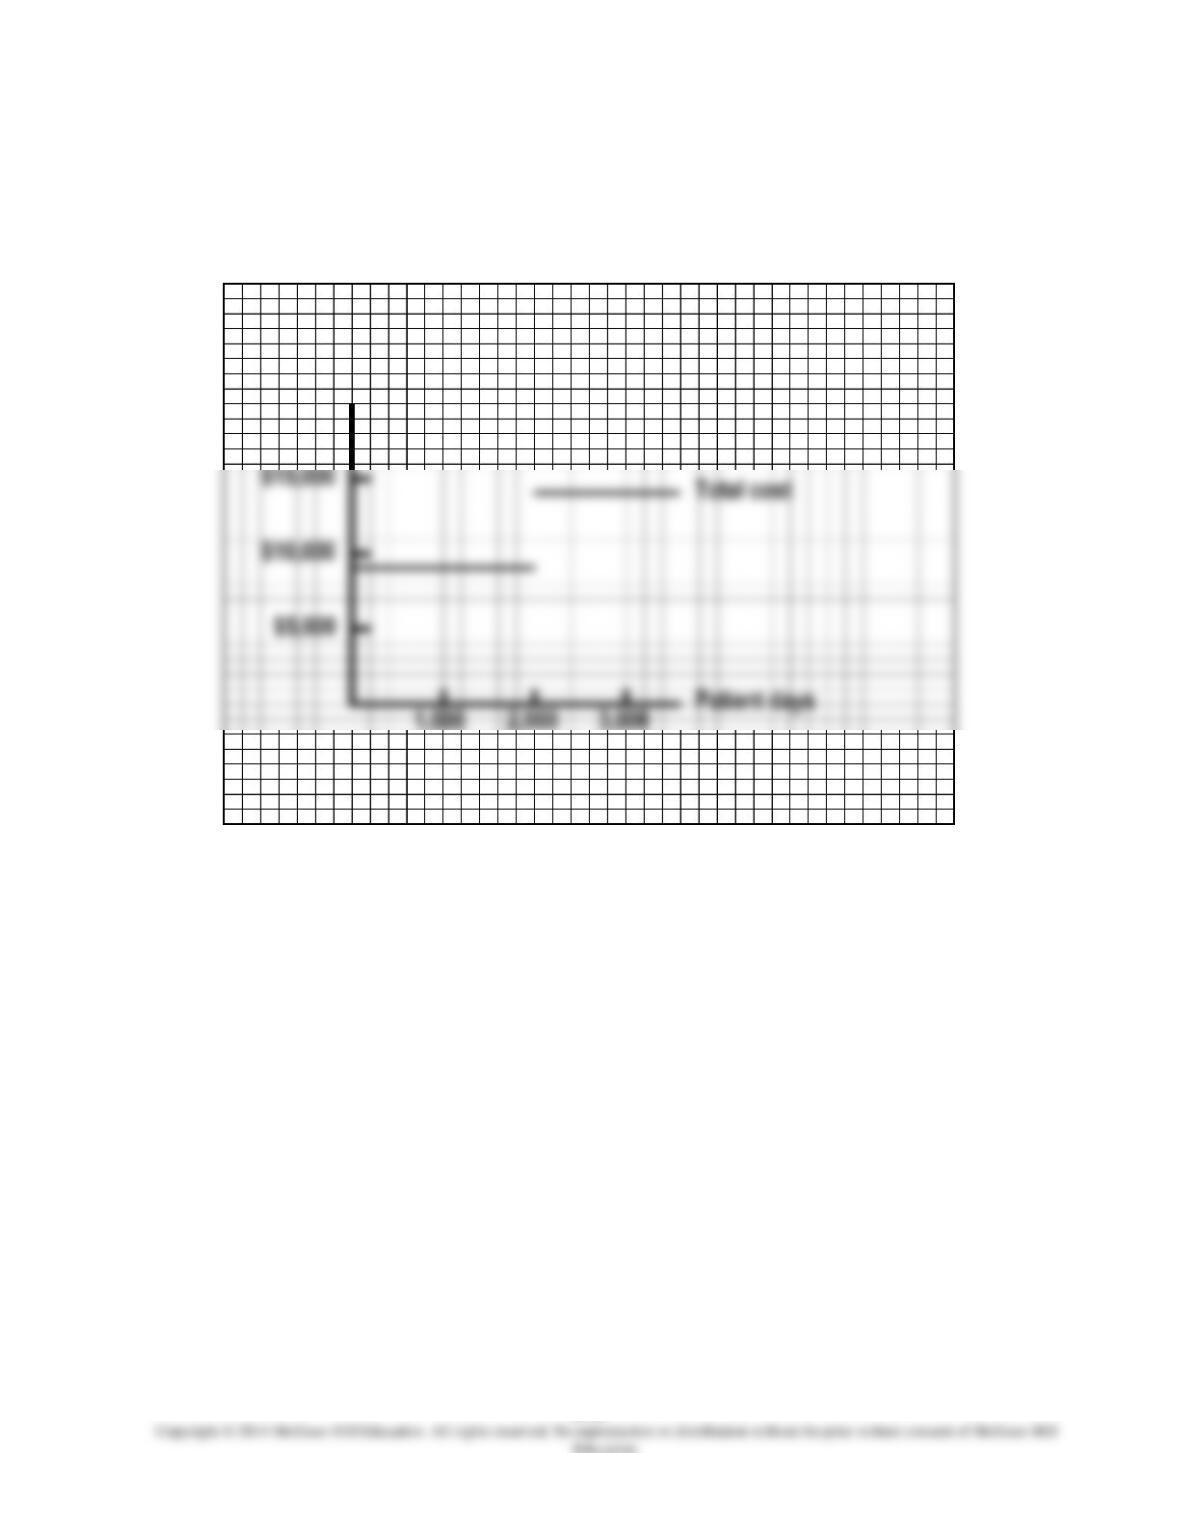
1.
Cost of food:
1,000
2,000
3,000
$20,000
$5,000
Cost
Total cost
$25,000
Chapter 06 – Activity Analysis, Cost Behavior, and Cost Estimation
6-9
EXERCISE 6-23 (CONTINUED)
2.
Cost of salaries and fringe benefits for administrative staff:
Cost per month
Chapter 06 – Activity Analysis, Cost Behavior, and Cost Estimation
6-10
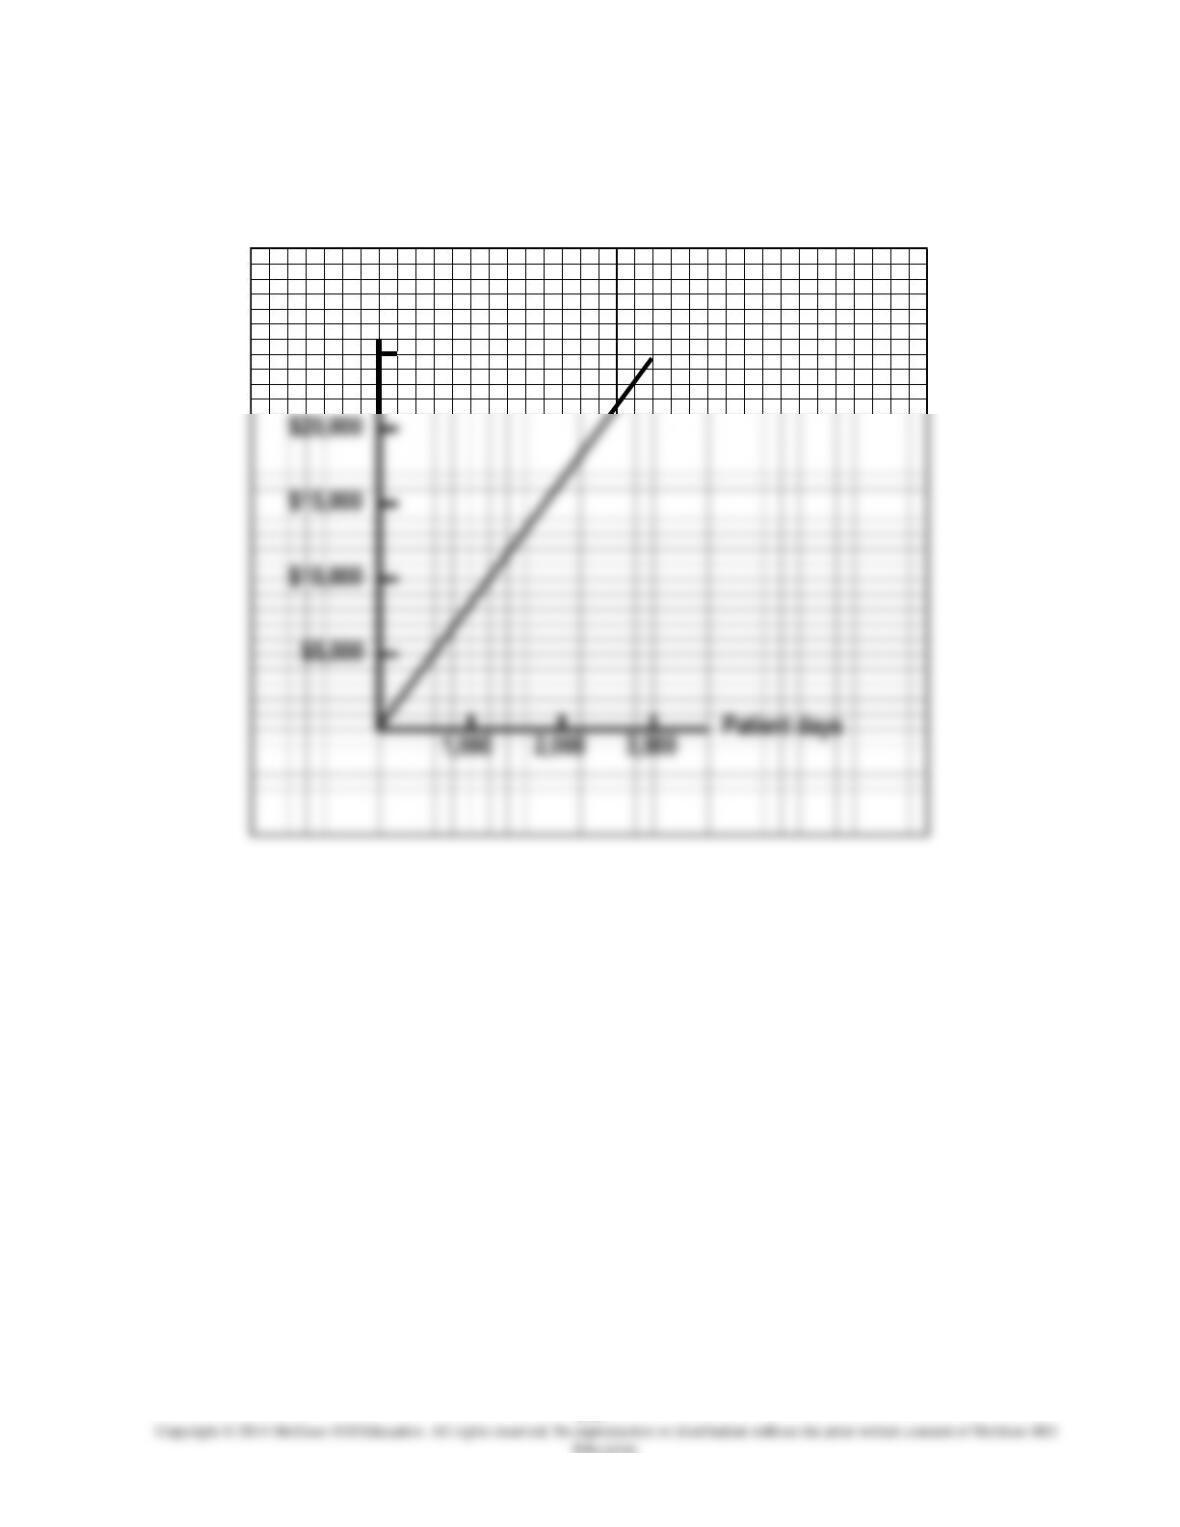
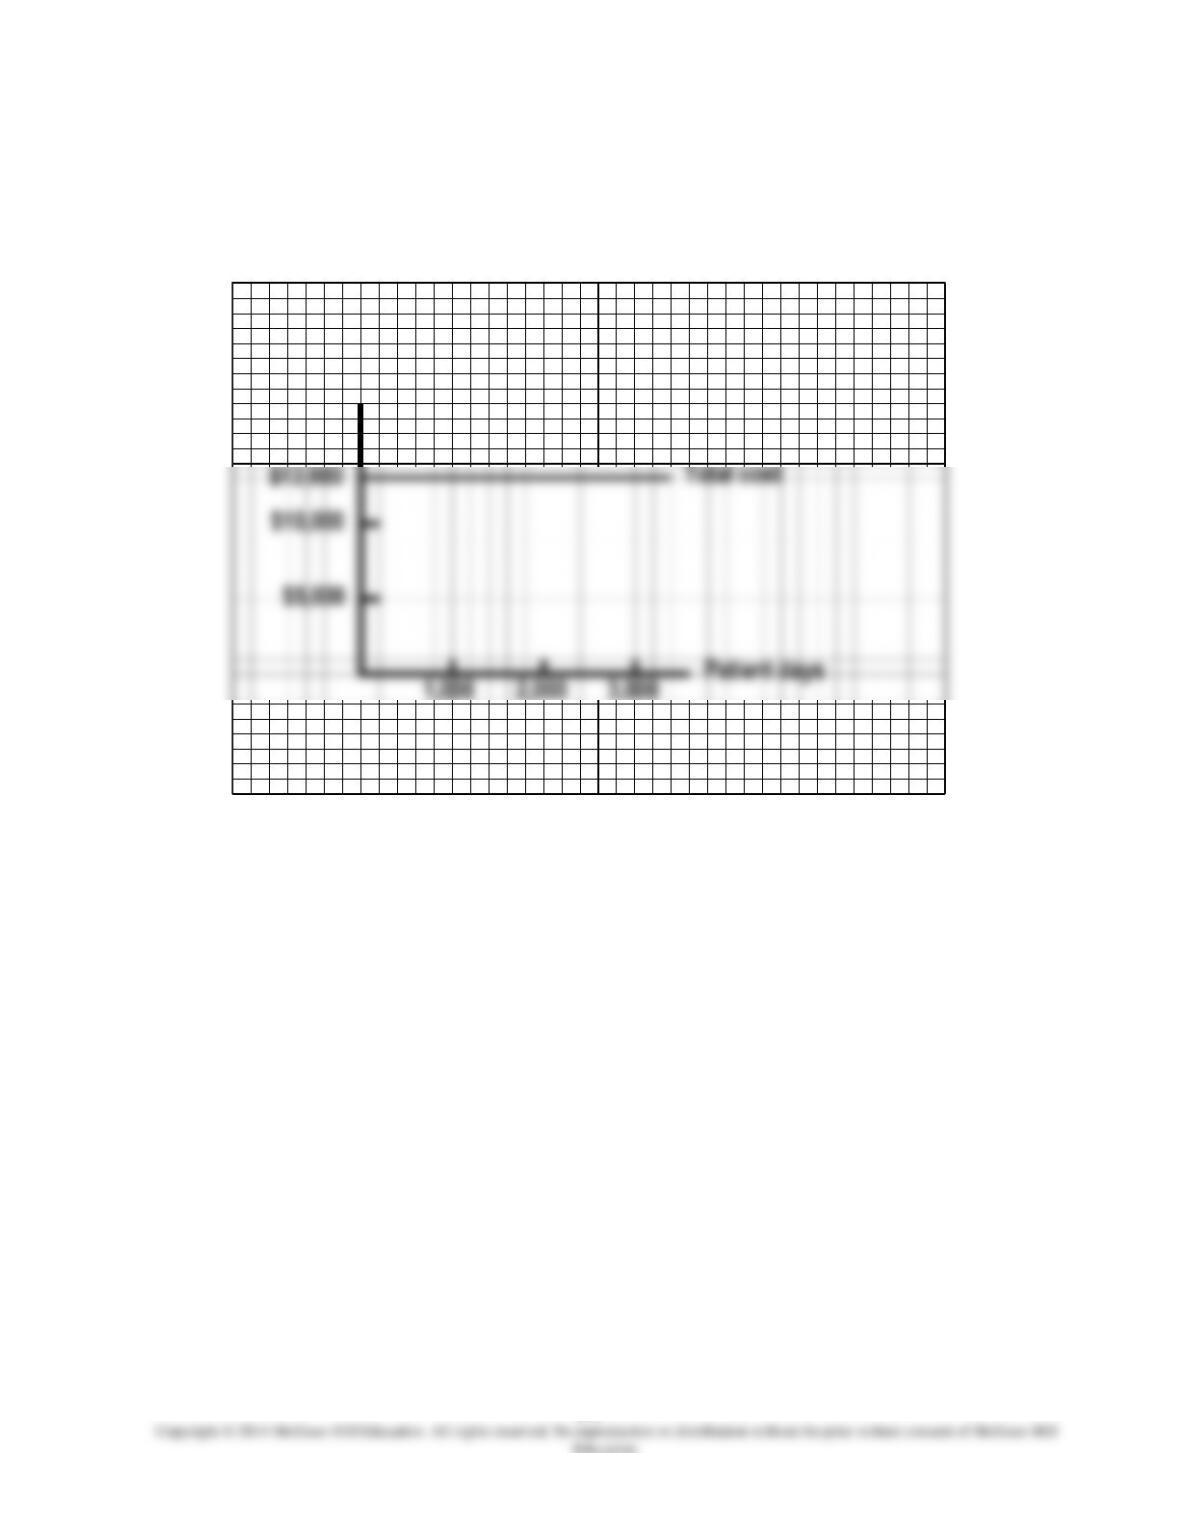
EXERCISE 6-23 (CONTINUED)
3.
Laboratory costs:
Total cost
Cost per month
$80,000
$70,000
$60,000
$50,000
$20,000
$10,000
1,000
2,000
3,000
Patient days
Chapter 06 – Activity Analysis, Cost Behavior, and Cost Estimation
6-11
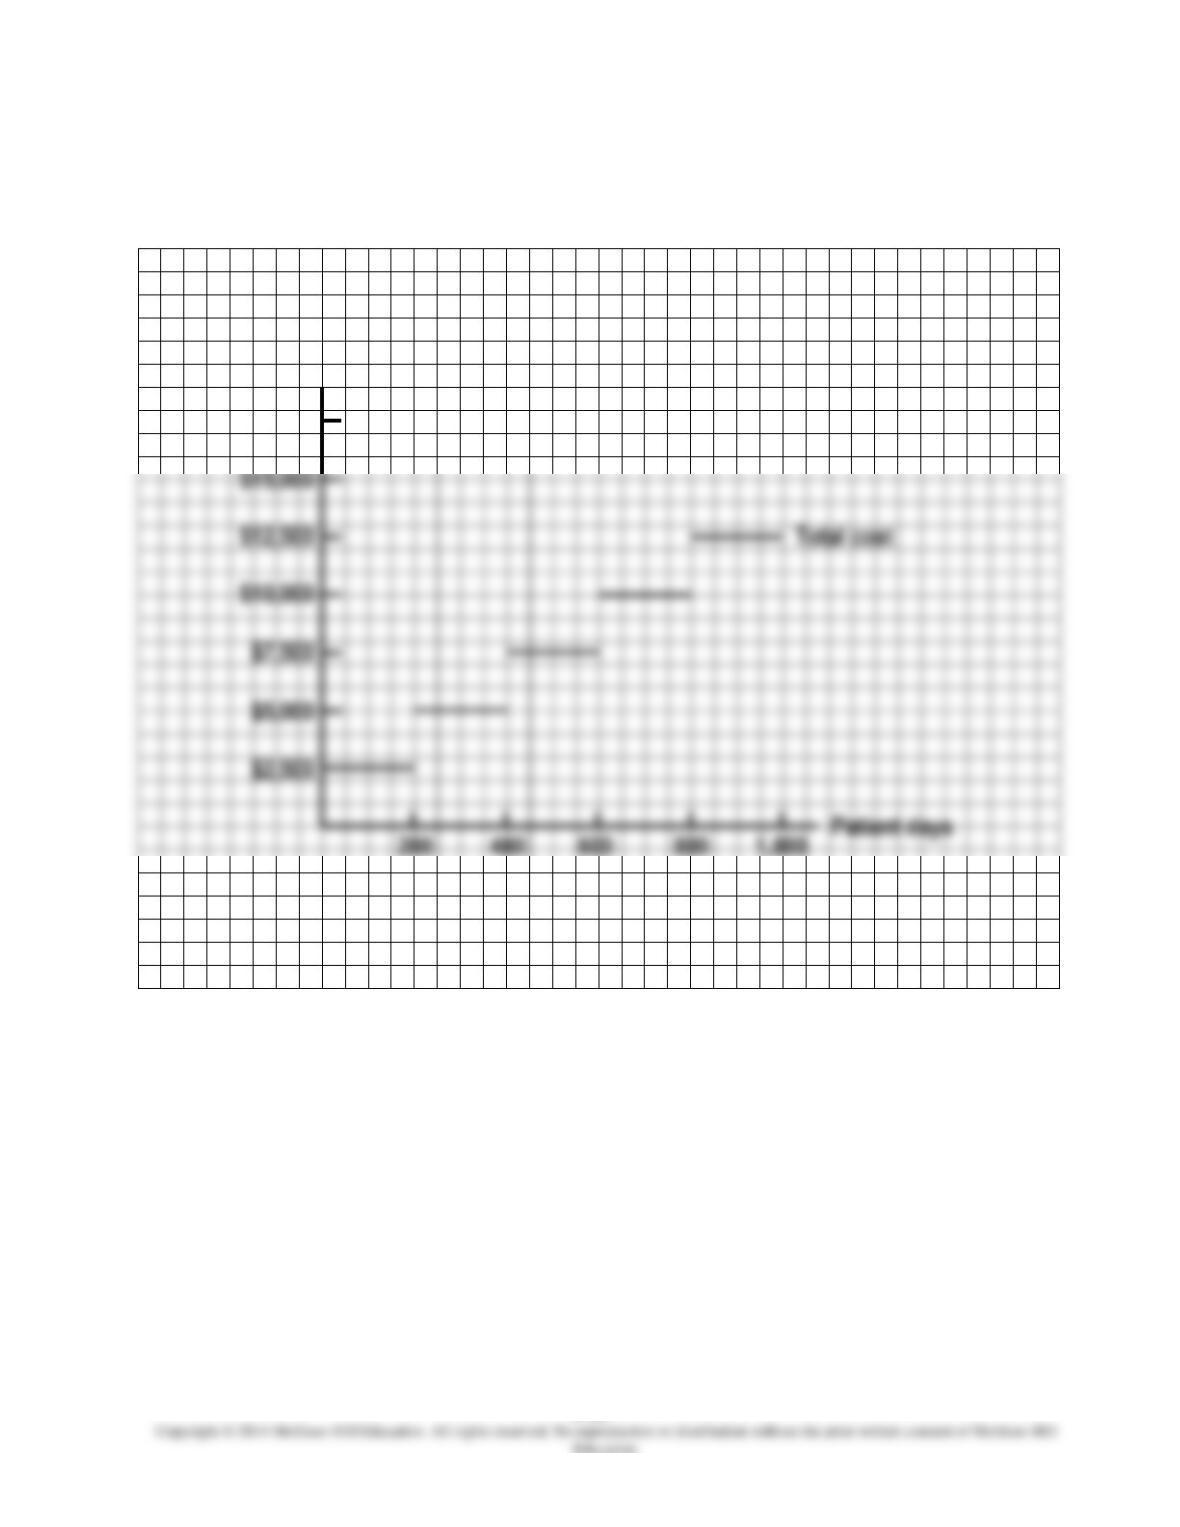
EXERCISE 6-23 (CONTINUED)
4.
Cost of utilities:
Patient days
Total cost
Cost per month
Chapter 06 – Activity Analysis, Cost Behavior, and Cost Estimation
6-12
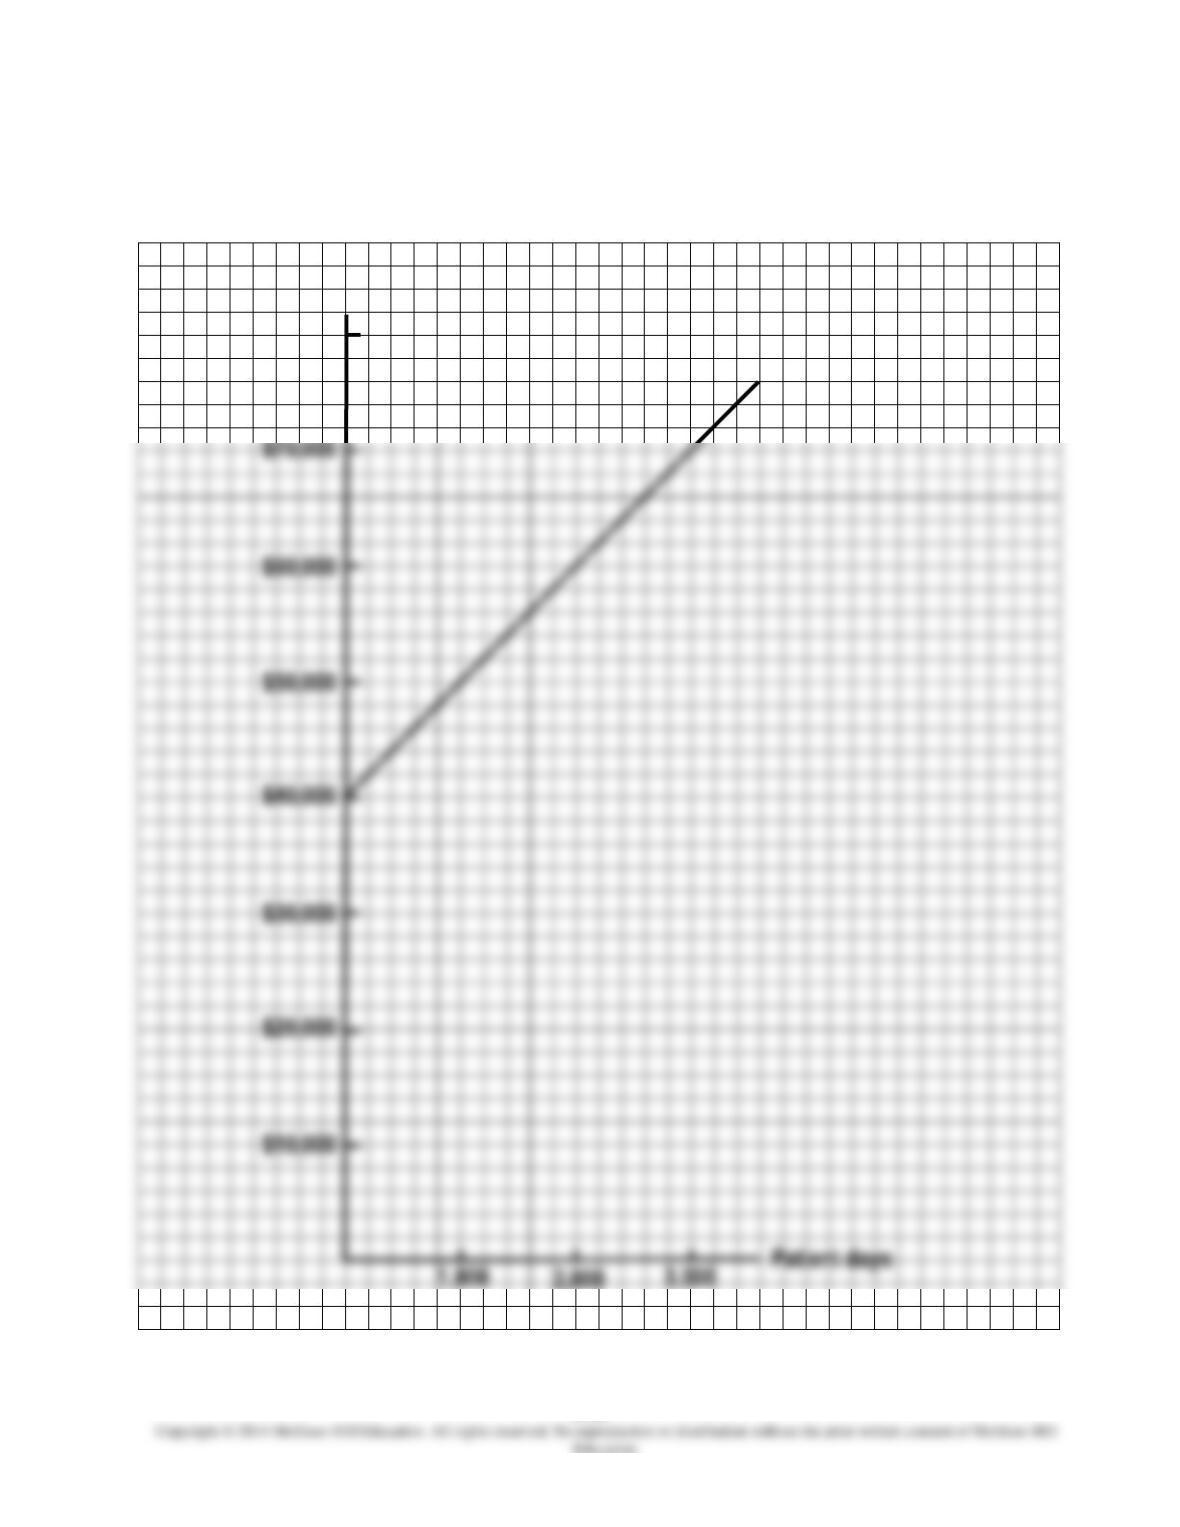
EXERCISE 6-23 (CONTINUED)
5.
Nursing costs:
$15,000
$12,500
$10,000
Cost per month
$17,500
Chapter 06 – Activity Analysis, Cost Behavior, and Cost Estimation
6-13
EXERCISE 6-24 (15 MINUTES)
1.
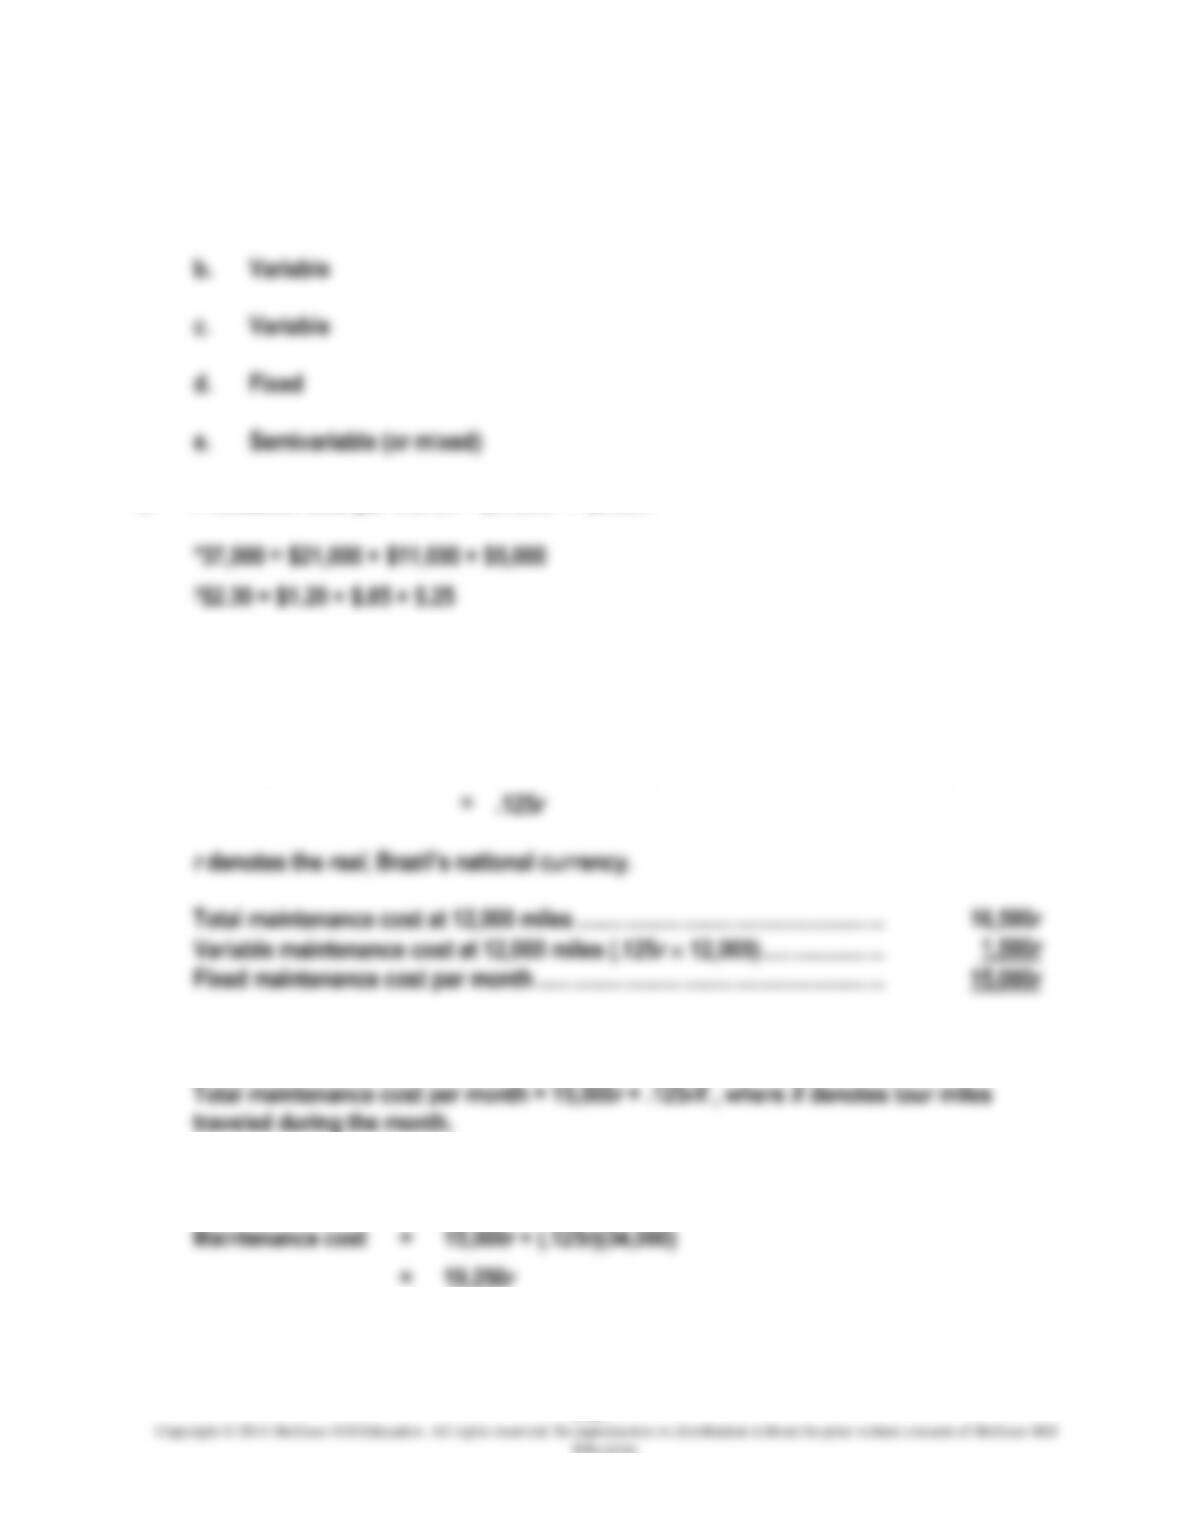
a.
Fixed
Variable
c.
Variable
Fixed
e.
Semivariable (or mixed)
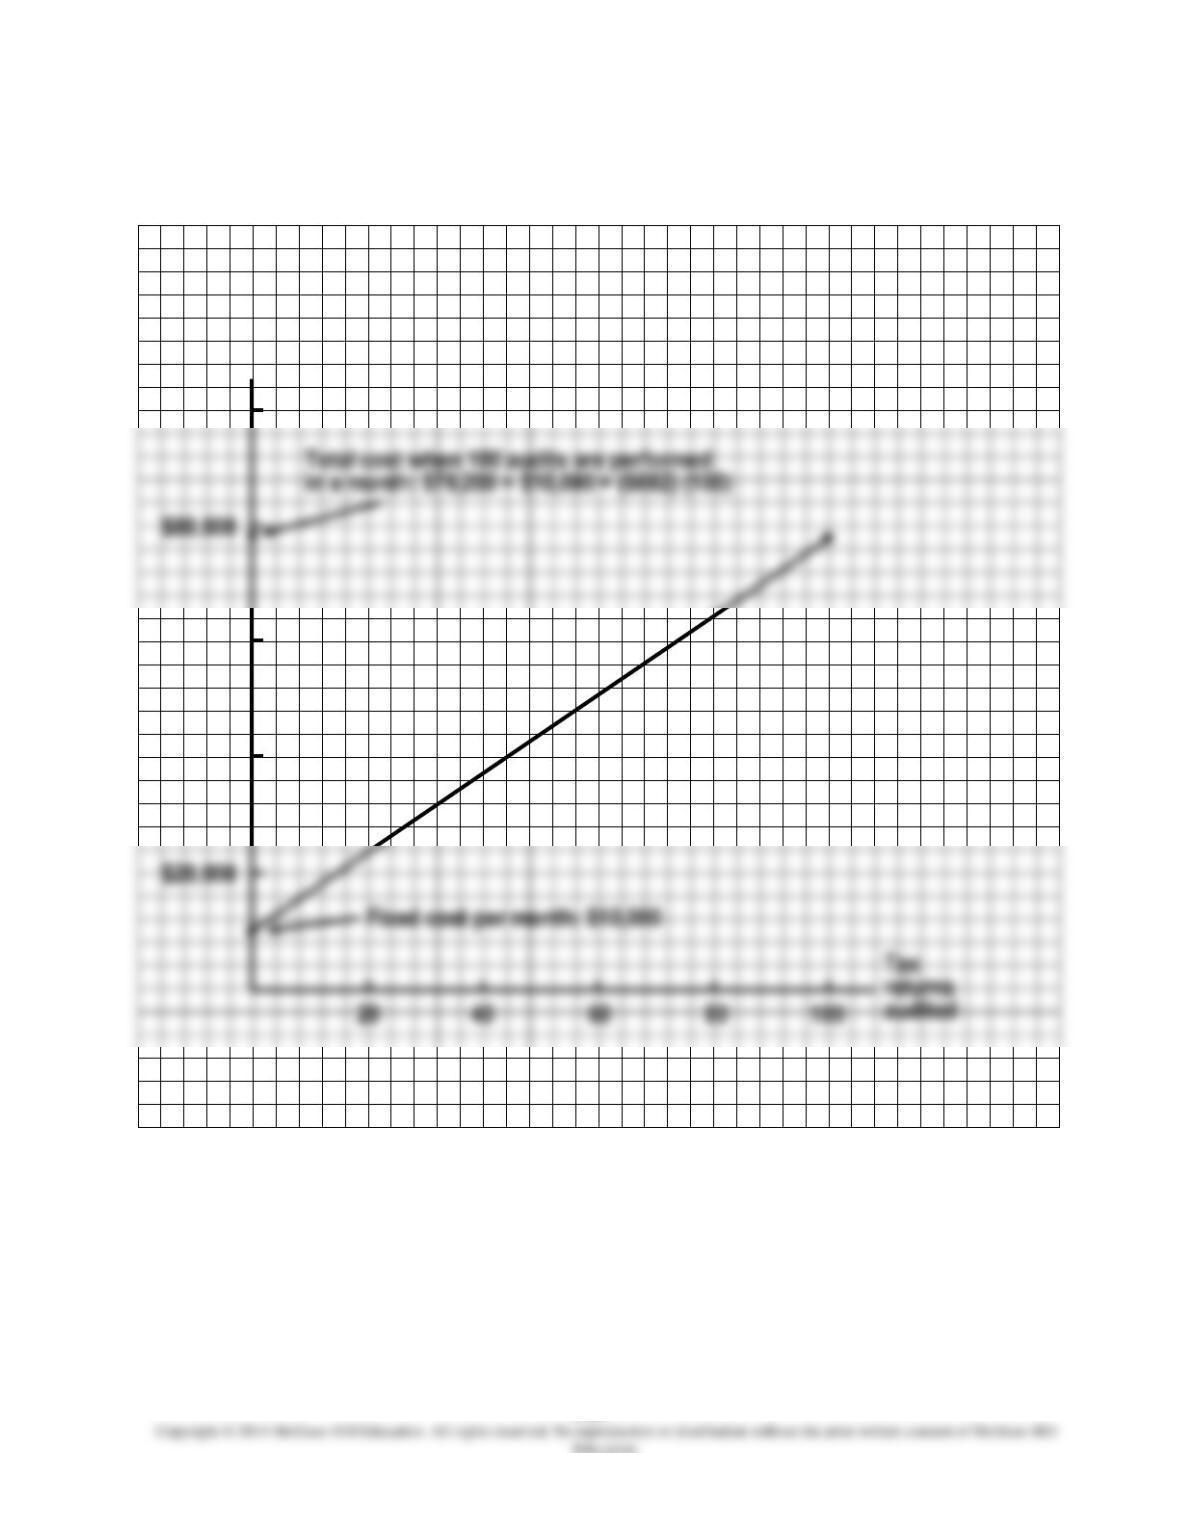
2.
Production cost per month = $37,000* + $2.30X †
*37,000 = $21,000 + $11,000 + $5,000
EXERCISE 6-25 (15 MINUTES)
1.
Variable maintenance
cost per tour mile
=
(18,750r-16,500r) / (30,000 miles – 12,000 miles)
=
Total maintenance cost at 12,000 miles ……………………………………………..
2.
Cost formula:
3.
Cost prediction at the 34,000-mile activity level:
Maintenance cost
=
=
6-14
EXERCISE 6-25 (CONTINUED)
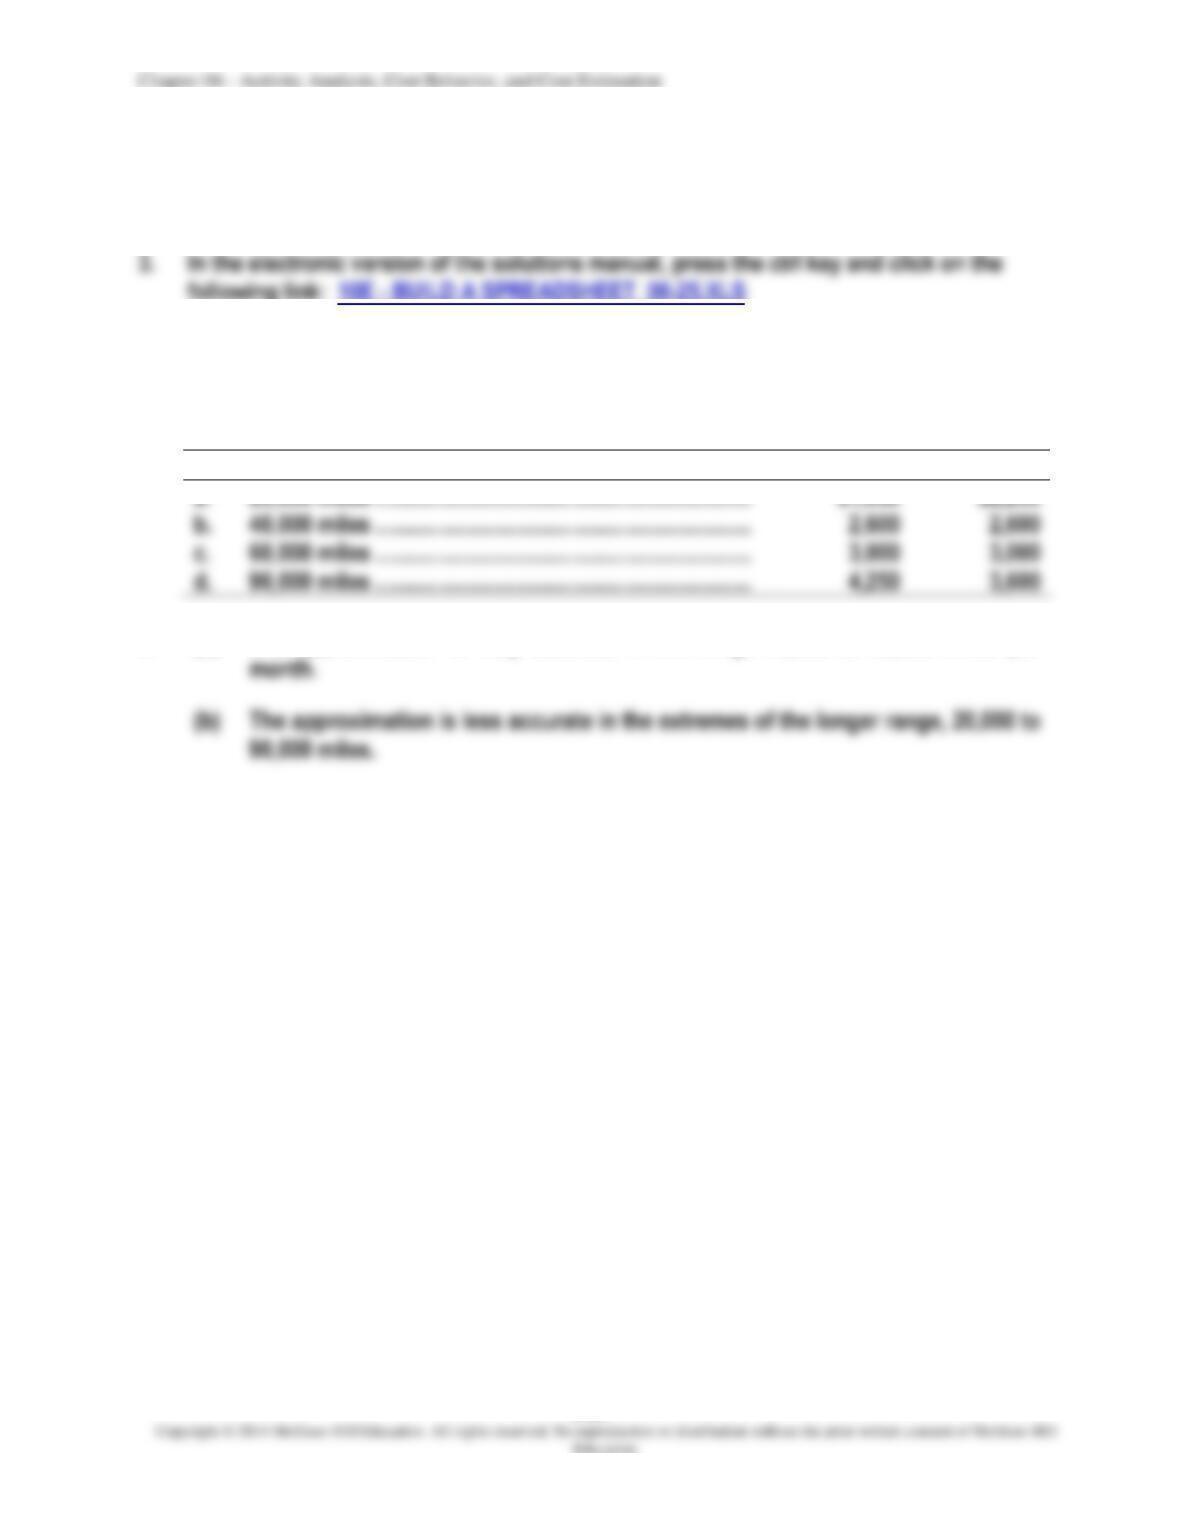
EXERCISE 6-26 (15 MINUTES)
1.
Actual
Estimated
a.
20,000 miles ………………………………………………………..
$1,950
40,000 miles ………………………………………………………..
c.
60,000 miles ………………………………………………………..
90,000 miles ………………………………………………………..
2.
(a)
(b)
The approximation is less accurate in the extremes of the longer range, 20,000 to
The approximation is very accurate in the range 40,000 to 60,000 miles per
6-15
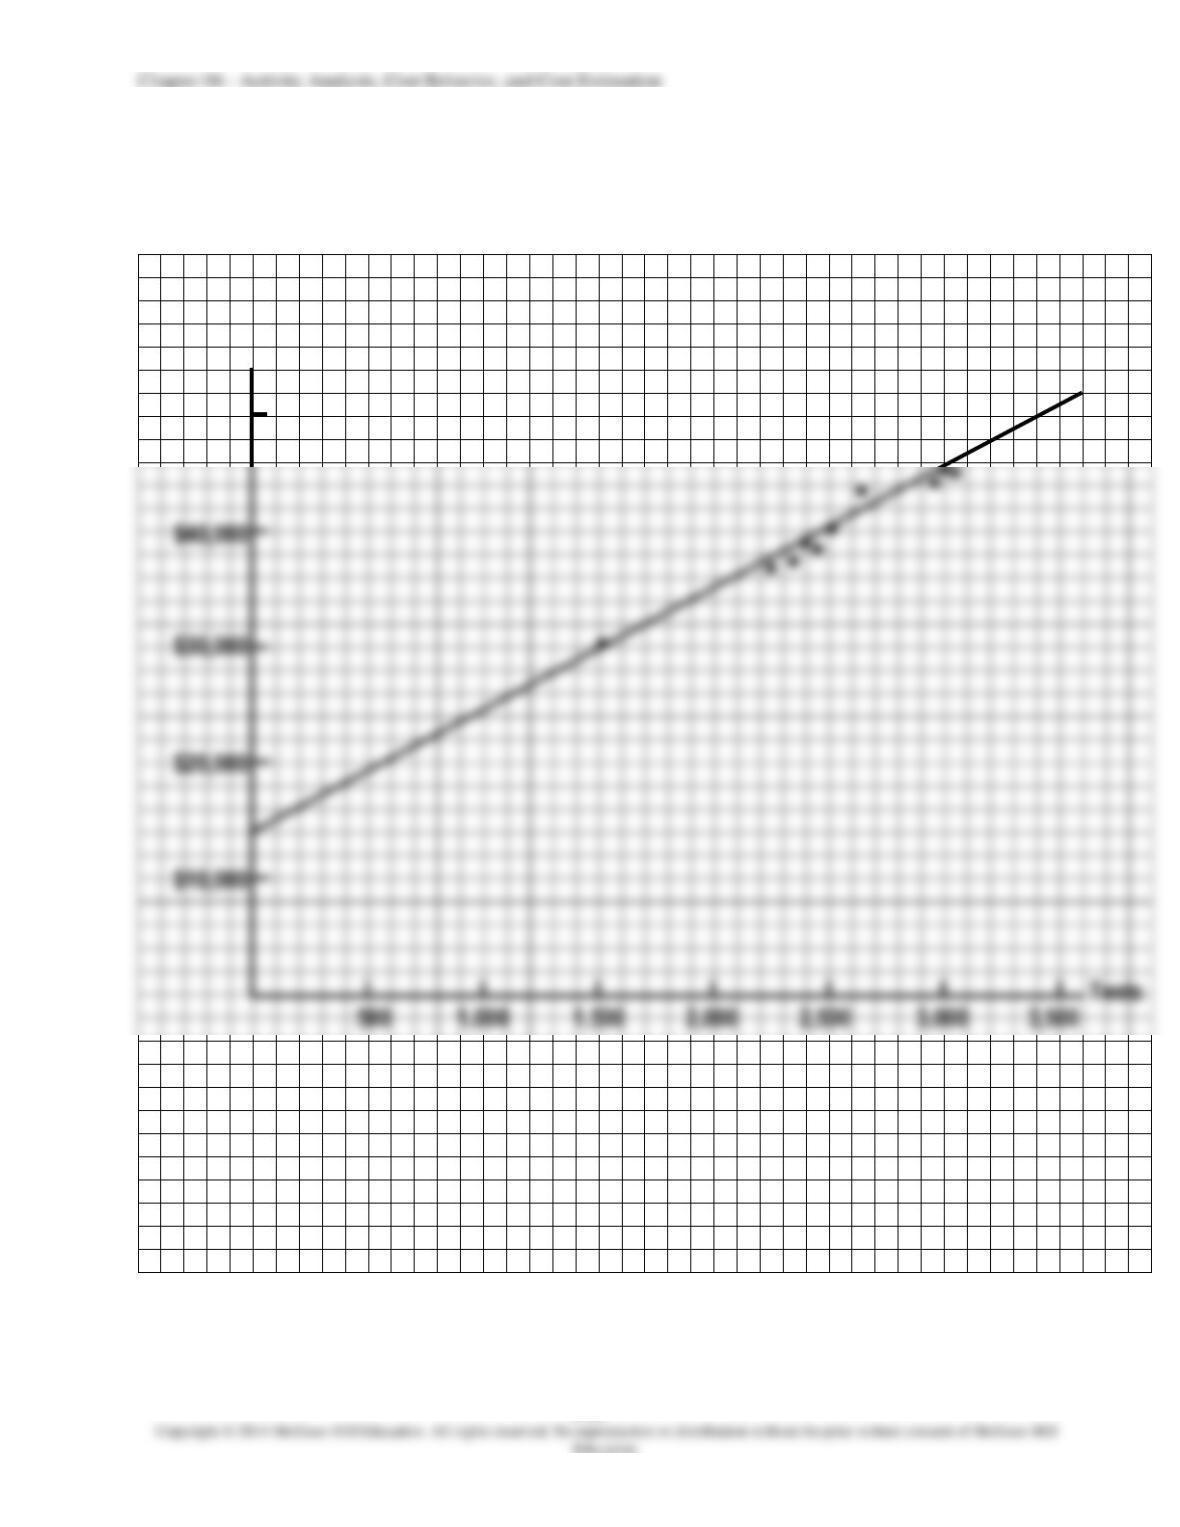
EXERCISE 6-27 (30 MINUTES)
1.
Scatter diagram and visually-fitted line:
Cost of diagnostic testing
$50,000
$40,000
•
•
•
•
•
•
•
•
•
•
6-16
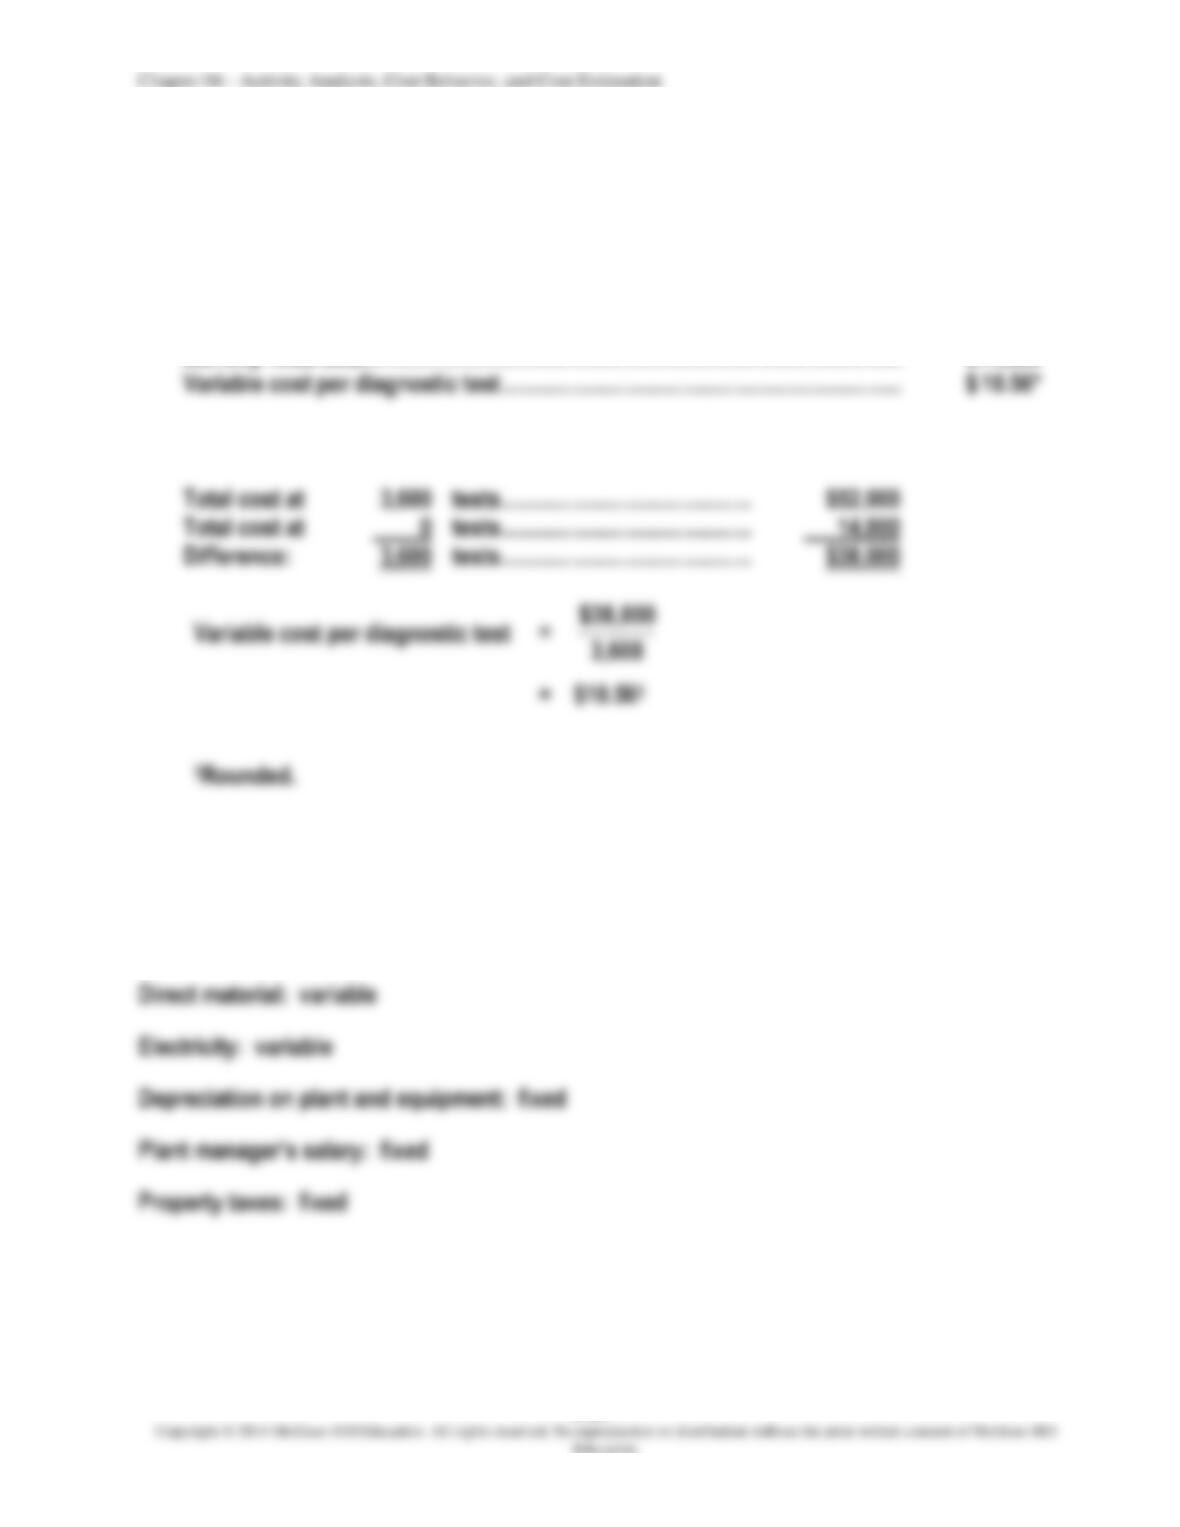
EXERCISE 6-27 (CONTINUED)
2.
The requirement asks for an estimate based on the visually-fit cost line. Therefore,
answers will vary on this requirement because of variation in the visually-fitted lines.
Based on the preceding plot:
Monthly fixed cost…………………………………………………………………………………
$14,000
Variable cost per diagnostic test ……………………………………………………………
*Calculation of variable cost:
Total cost at
tests …………………………………….
Total cost at
tests …………………………………….
Difference:
tests …………………………………….
=
EXERCISE 6-28 (30 MINUTES)
Answers will vary widely, depending on the company and costs selected. Some examples
of typical manufacturing costs follow.
Chapter 06 – Activity Analysis, Cost Behavior, and Cost Estimation
6-17
EXERCISE 6-29 (15 MINUTES)
1.
Variable cost per pint of applesauce produced =
$.10
63,000 123,000
$66,300 $72,300 =
−
−
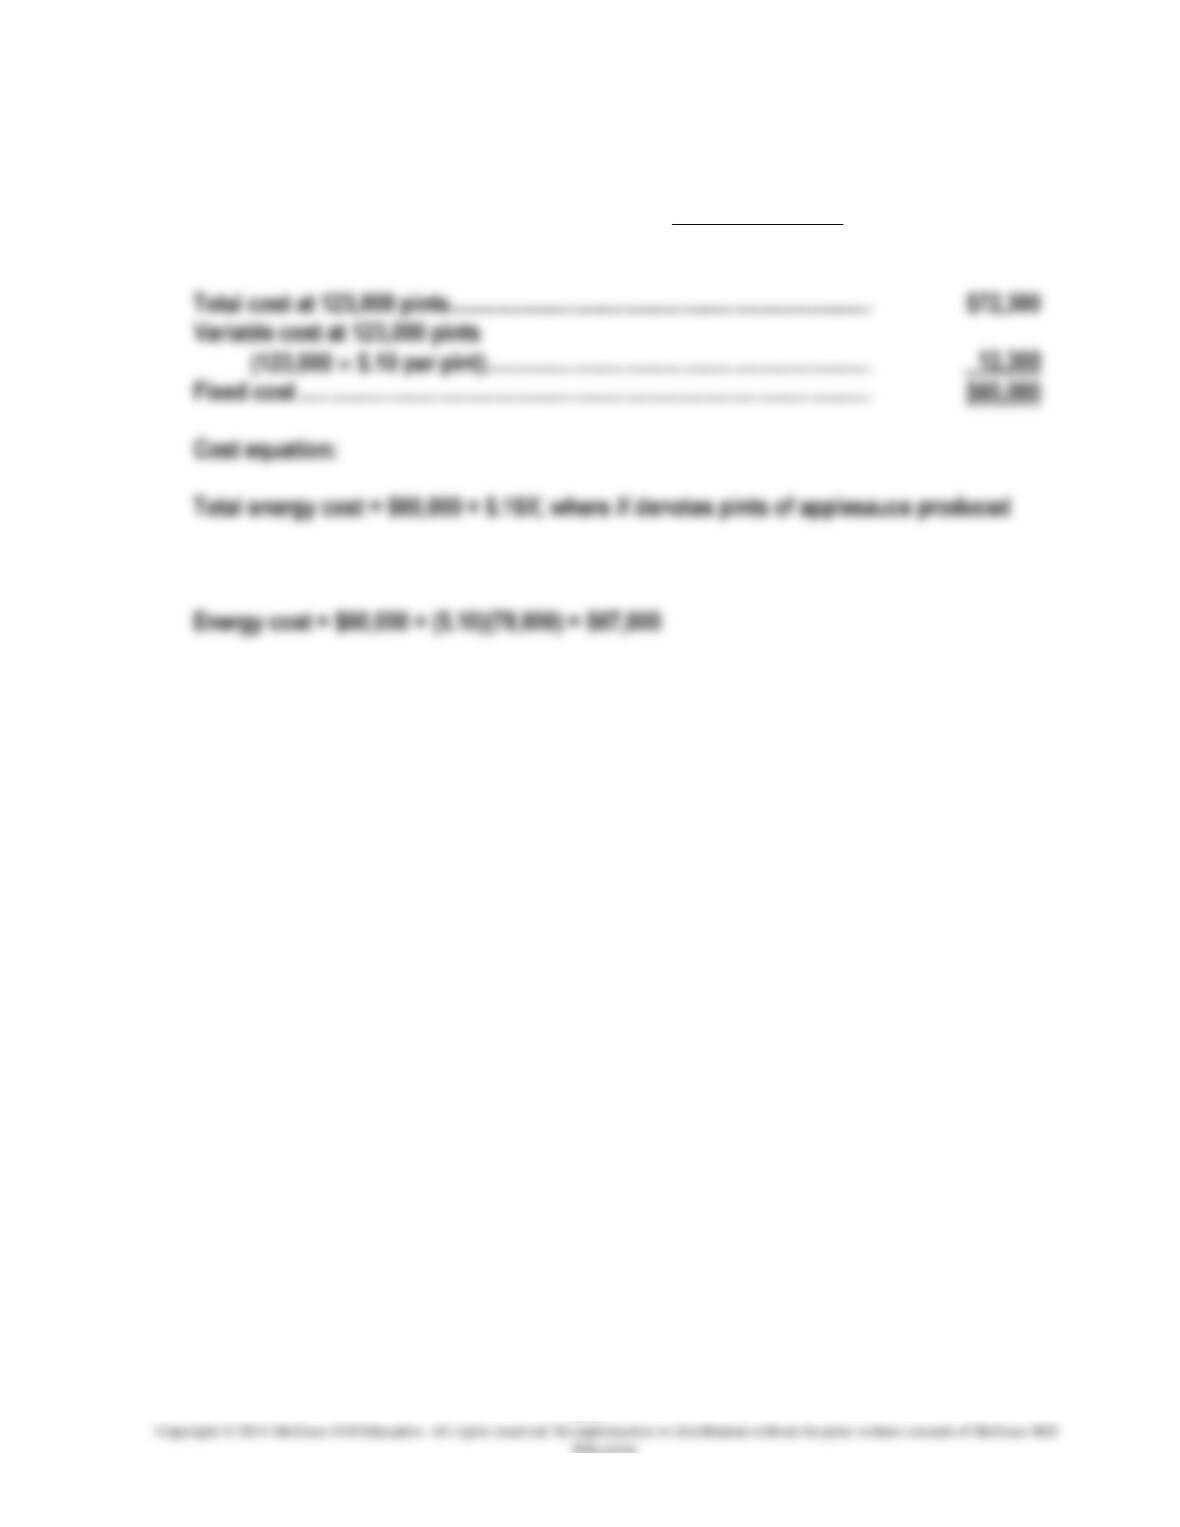
Total cost at 123,000 pints …………………………..…………………………………..
Fixed cost ………………………………………………………………………………………
Cost equation:
Total energy cost = $60,000 + $.10X, where X denotes pints of applesauce produced
2.
Cost prediction when 78,000 pints of applesauce are produced
Energy cost = $60,000 + ($.10)(78,000) = $67,800
6-18
EXERCISE 6-30 (30 MINUTES)
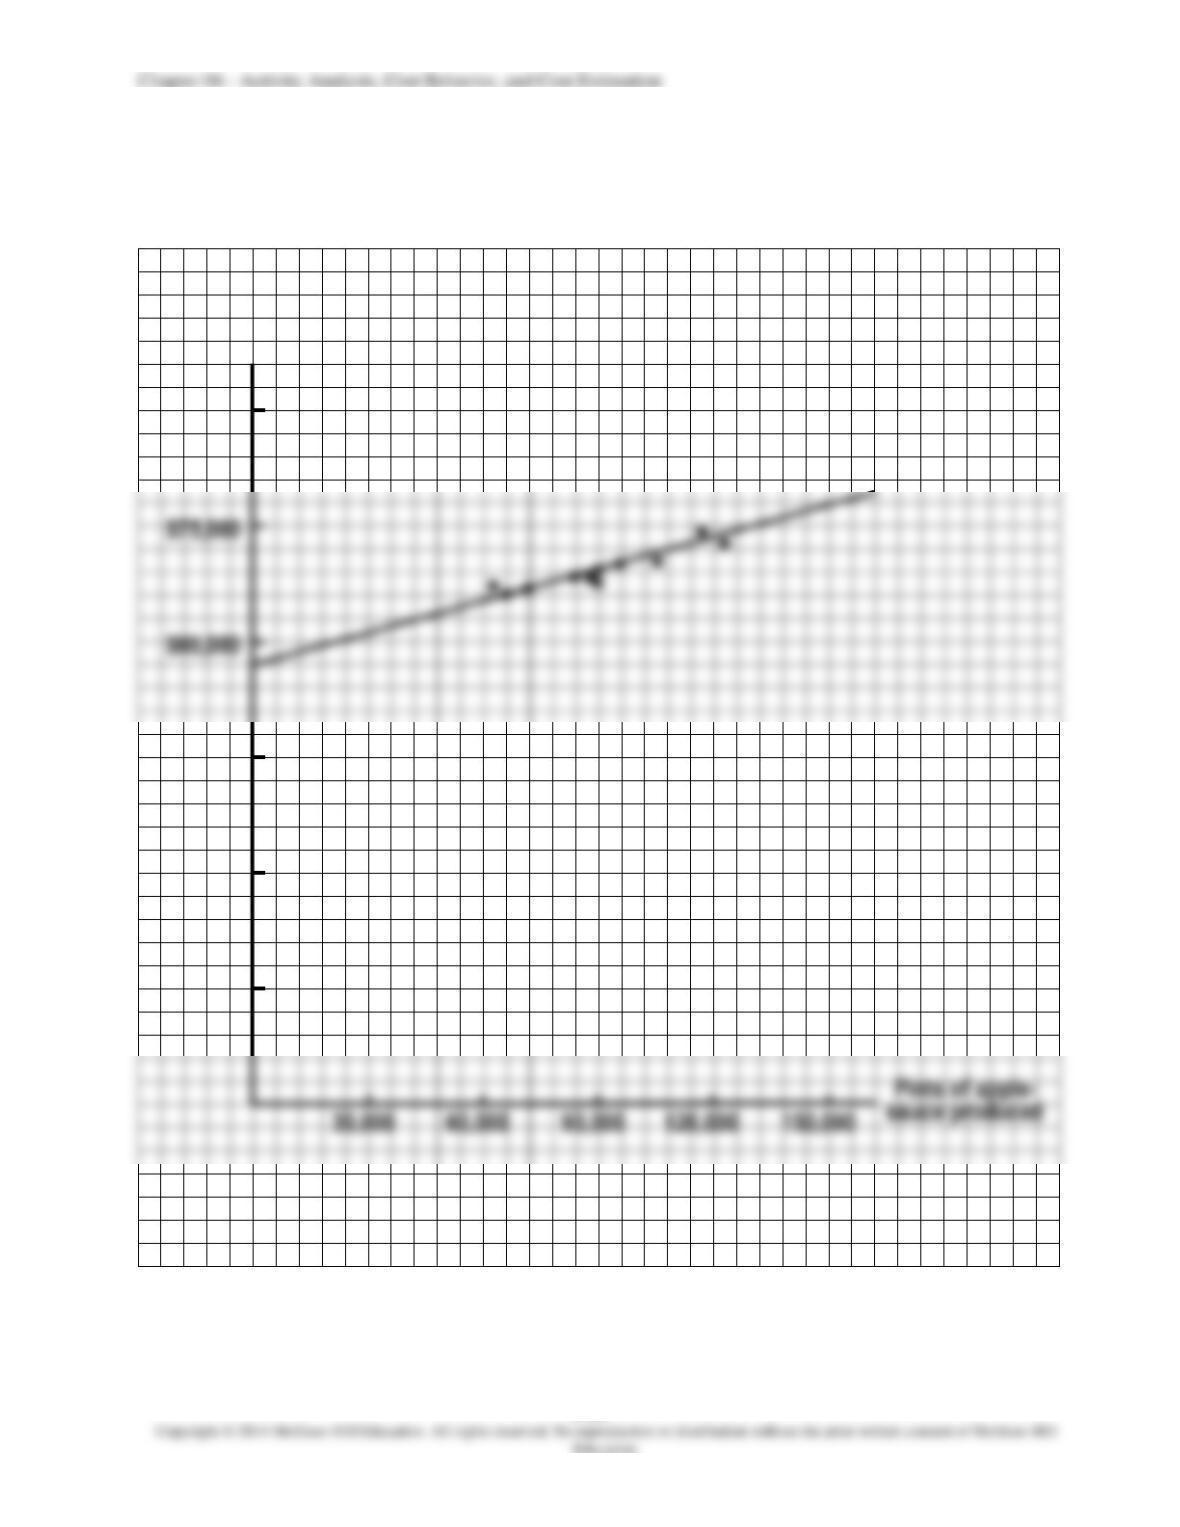
1.
Scatter diagram and visually-fitted line:
•
Monthly energy cost
$90,000
$75,000
$60,000
•
•
•
•
•
•
$45,000
$30,000
$15,000
120,000
150,000
6-19
EXERCISE 6-30 (CONTINUED)
2.
Answers will vary on this requirement because of variation in the visually-fitted lines.
3.
The July cost observation at the 120,000-pint activity level appears to be an outlier.
EXERCISE 6-31 (10 MINUTES)
1.
(a)
Average time for 4 satellites ……………………………………………………..
195 hours
(b)
Average time for 8 satellites ……………………………………………………..
150 hours
2.
(a)
Total time for 4 satellites (195 hr. X 4)……………………………………….
780 hours
(b)
Total time for 8 satellites (150 hr. X 8)……………………………………….
1,200 hours
3.
Learning curves indicate how labor costs will change as the company gains
Chapter 06 – Activity Analysis, Cost Behavior, and Cost Estimation
6-20
EXERCISE 6-32 (15 MINUTES)
$80,000
Monthly audit cost
$100,000
$60,000
$40,000
$20,000
40