EXERCISE 6-13
(a)
Inventory
turnover
$16,255
($3,042 + $2,397) ÷ 2 = $16,255
$2,719.5 = 5.98
(b) Based on data presented:
Current ratio $30,857 ÷ $12,753 = 2.42 : 1
(c) After adjusting for the LIFO reserve, Deere’s current ratio increases
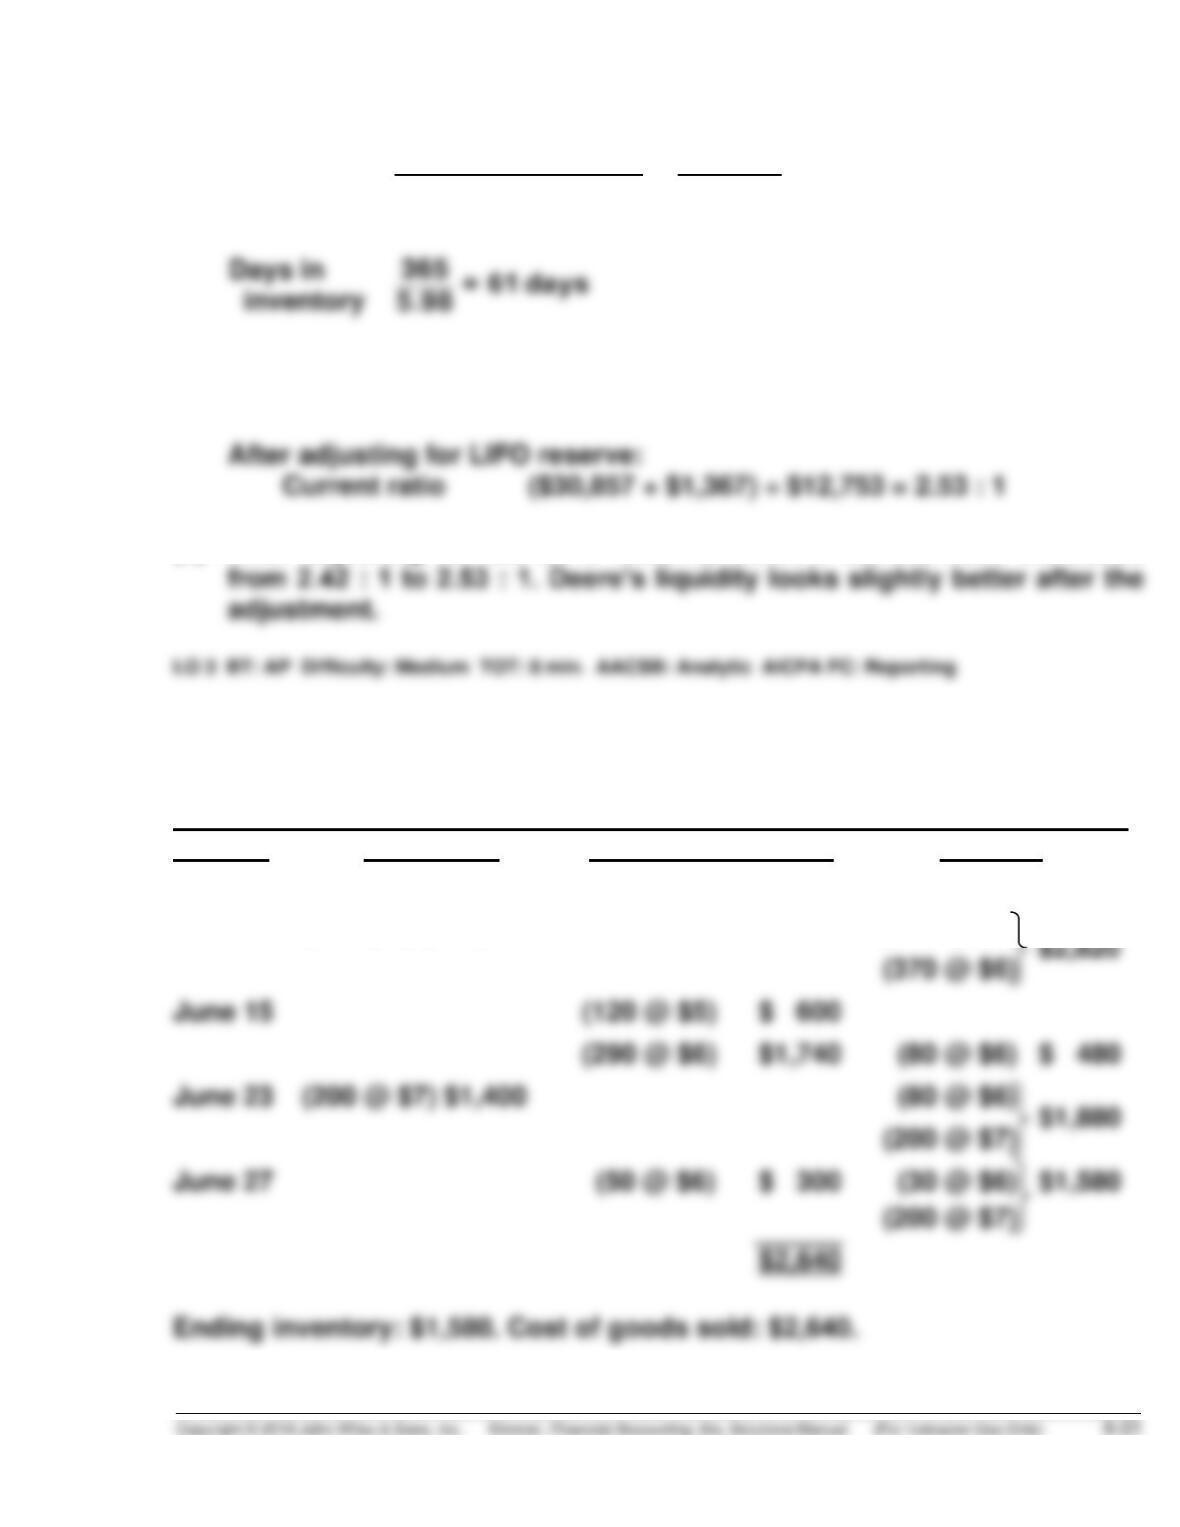
*EXERCISE 6-14
(a)
FIFO
Date
Purchases
Cost of goods sold
Balance
June 1
(120 @ $5)
$ 600
June 12
(370 @ $6) $2,220
(120 @ $5)
(370 @ $6)
June 15
(120 @ $5)
(290 @ $6)
$ 480
June 23
(200 @ $7) $1,400
(200 @ $7)
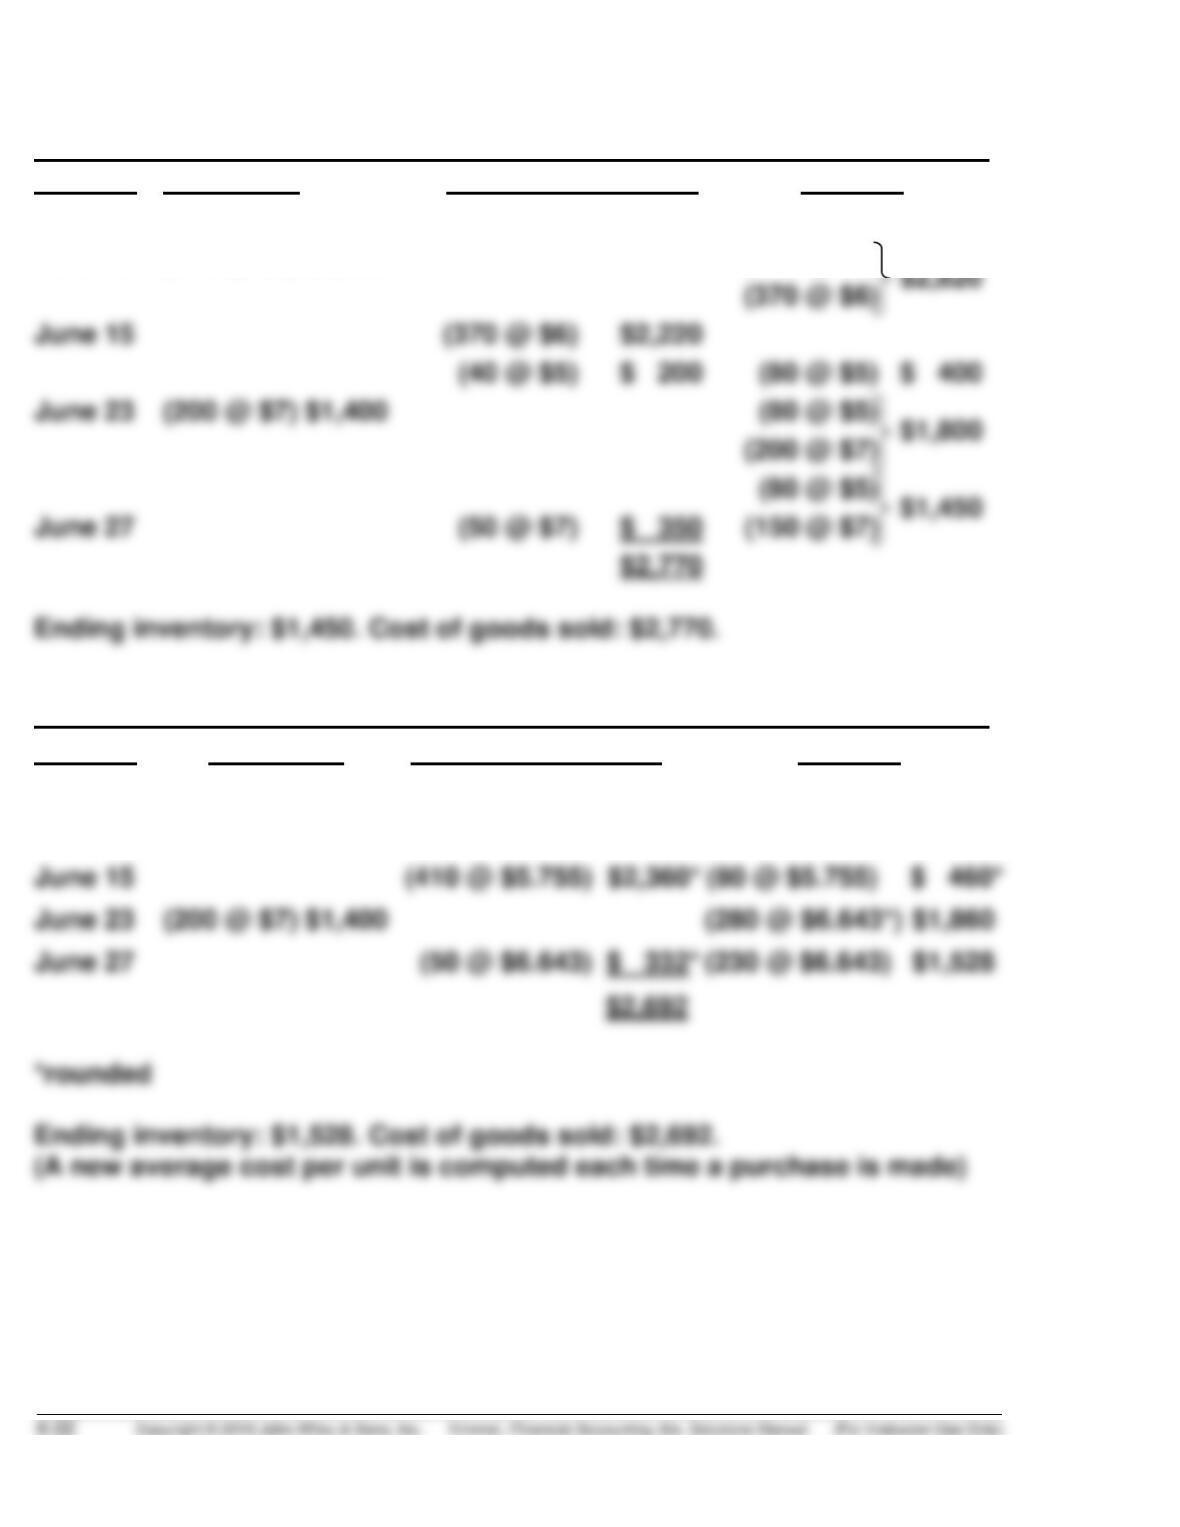
*EXERCISE 6-14 (Continued)
LIFO
Date
Purchases
Cost of Goods Sold
Balance
June 1
(120 @ $5)
$ 600
June 12
(370 @ $6) $2,220
(120 @ $5)
June 15
(370 @ $6)
$ 400
June 23
(200 @ $7) $1,400
(200 @ $7)
June 27
Moving-Average
Date
Purchases
Cost of Goods Sold
Balance
June 1
(120 @ $5)
$ 600
June 12
(370 @ $6) $2,220
(490 @ $5.755)
$2,820
June 15
(410 @ $5.755)
(80 @ $5.755)
$ 460*
*EXERCISE 6-14 (Continued)
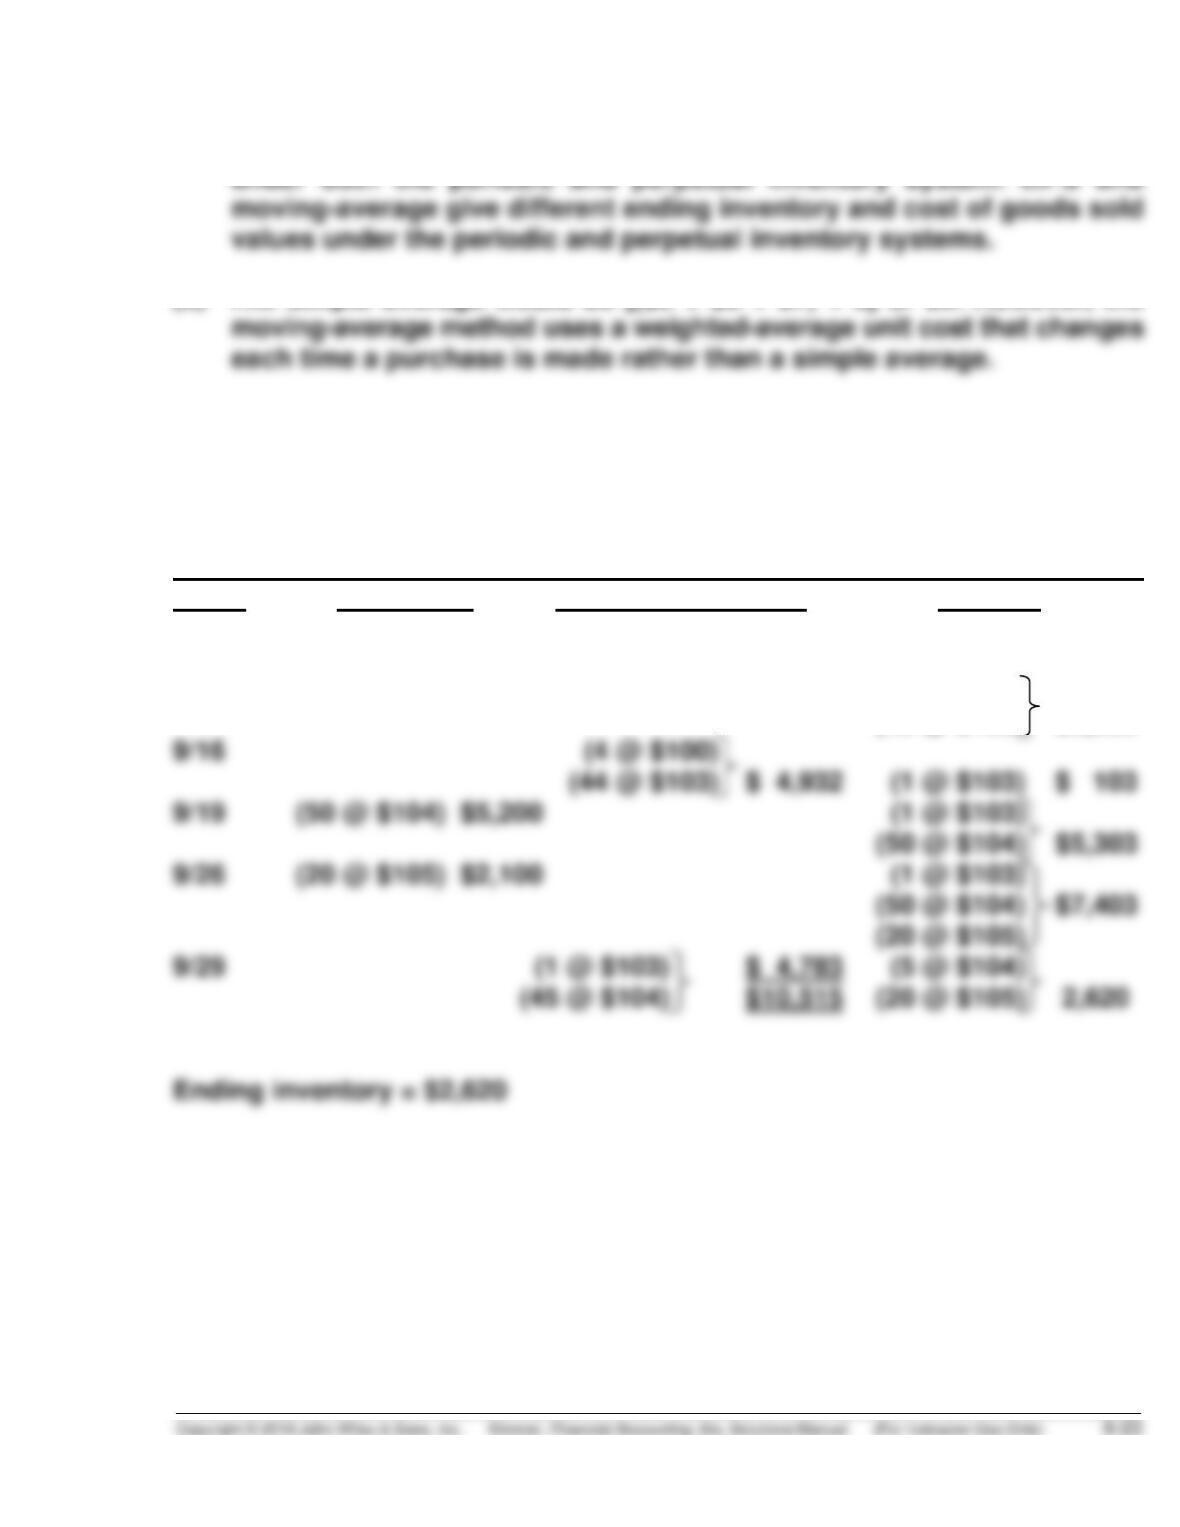
(b) FIFO gives the same ending inventory and cost of goods sold values
(c) The simple average would be [($5 + $6 + $7) ÷ 3] or $6. However, the
LO 4 BT: AP Difficulty: Hard TOT: 20 min. AACSB: Analytic AICPA FC: Measurement and Reporting
*EXERCISE 6-15
FIFO
Date Purchases Cost of Goods Sold Balance
9/1 (12 @ $100) $1,200
9/5 (8 @ $100) $ 800 (4 @ $100) $ 400
9/12 (45 @ $103) $4,635 (4 @ $100)
(45 @ $103) $5,035
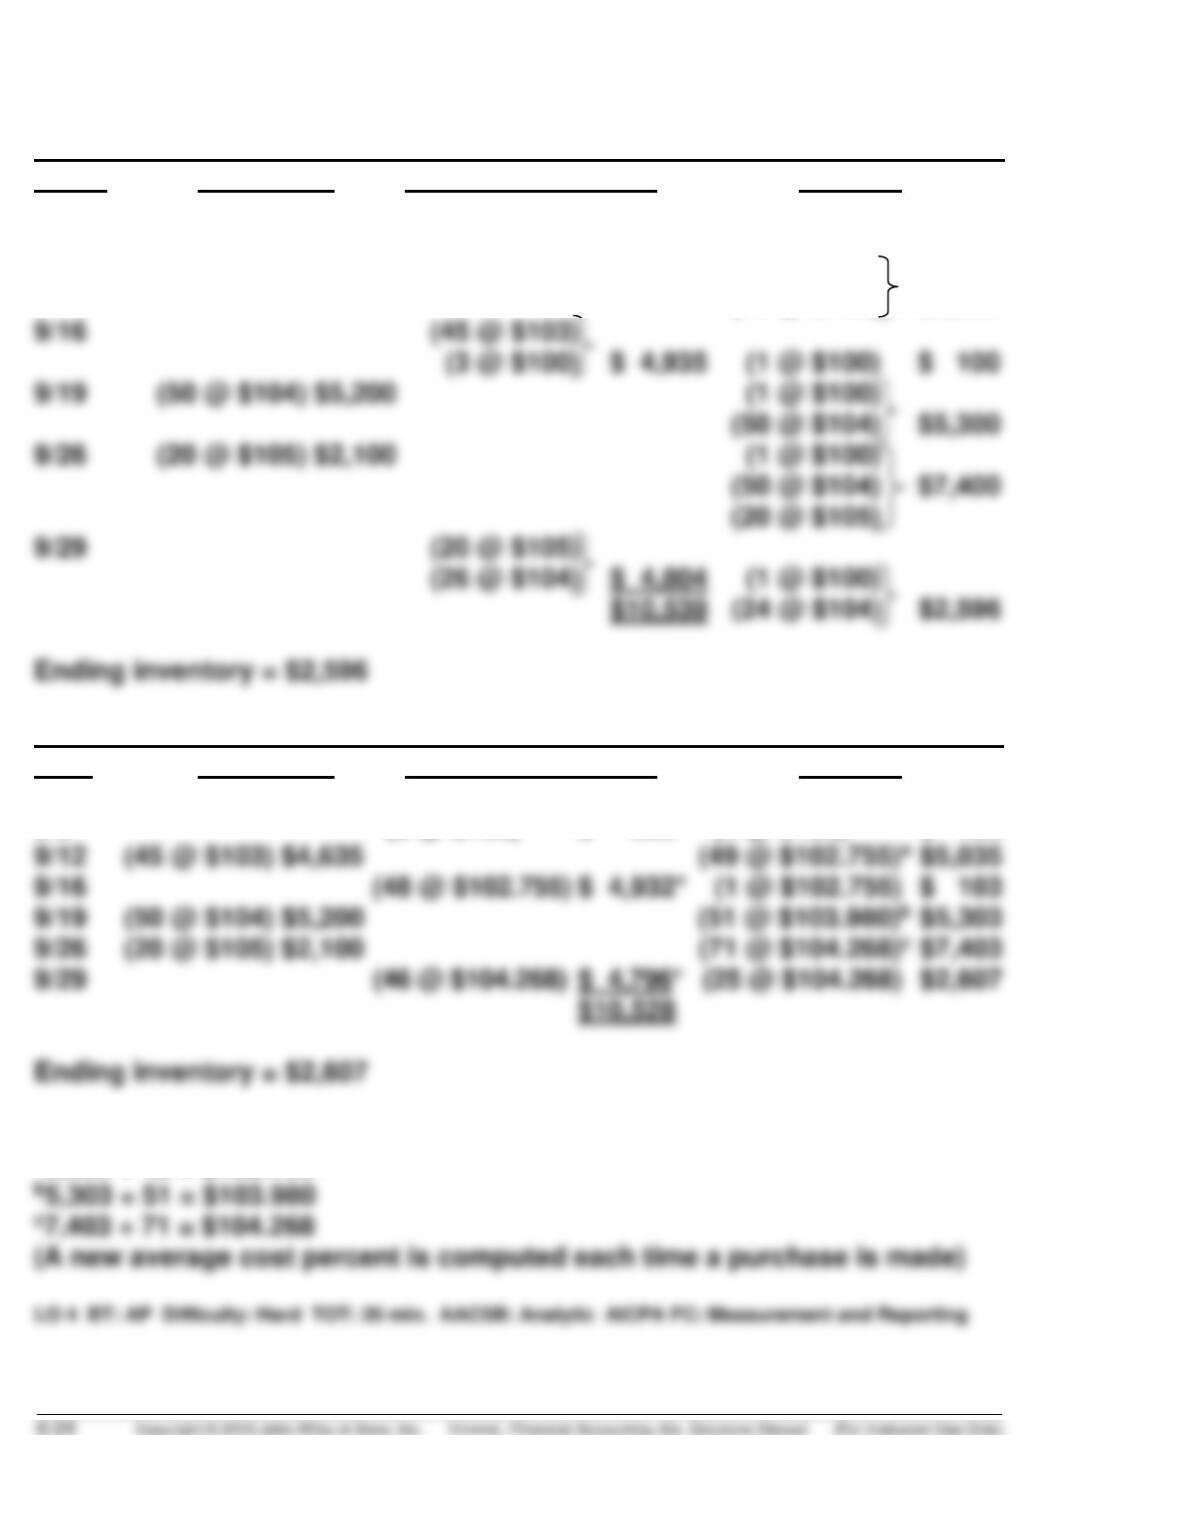
*EXERCISE 6-15 (Continued)
LIFO
Date Purchases Cost of Goods Sold Balance
9/1 (12 @ $100) $1,200
9/5 (8 @ $100) $ 800 (4 @ $100) $ 400
9/12 (45 @ $103) $4,635 (4 @ $100)
(45 @ $103) $5,035
MOVING-AVERAGE
Date Purchases Cost of Goods Sold Balance
9/1 (12 @ $100) $1,200
9/5 (8 @ $100) $ 800 (4 @ $100) $ 400
*Rounded
a5,035 ÷ 49 = $102.755
*EXERCISE 6-16
2016 2017
Beginning inventory ……………………………………………. $ 20,000 $ 28,000
*EXERCISE 6-17
(a)
2016 2017
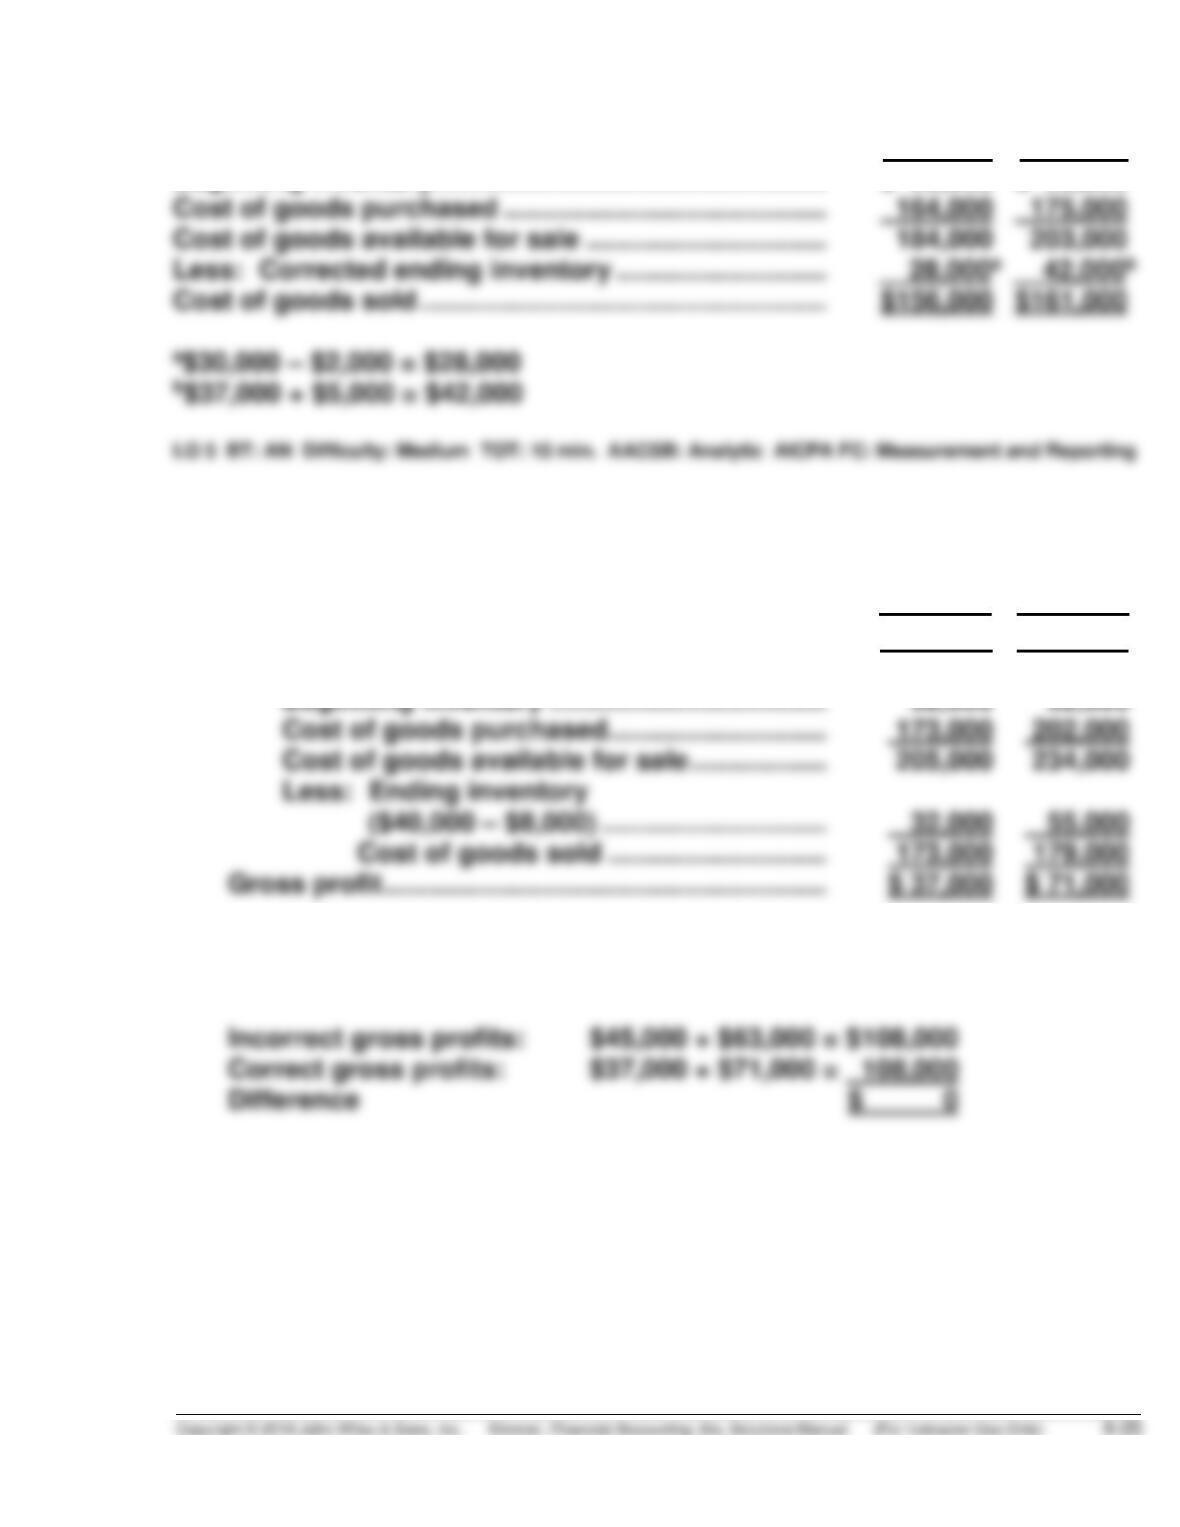
Sales ……………………………………………………………. $210,000 $250,000
Cost of goods sold
(b) The cumulative effect on total gross profit for the two years is zero as
shown below:
*EXERCISE 6-17 (Continued)
(c) Dear Mr./Ms. President:
Because your ending inventory of December 31, 2016 was overstated
by $8,000, your net income for 2016 was overstated and net income for
2017 was understated by $8,000.
SOLUTIONS TO PROBLEMS
PROBLEM 6-1A
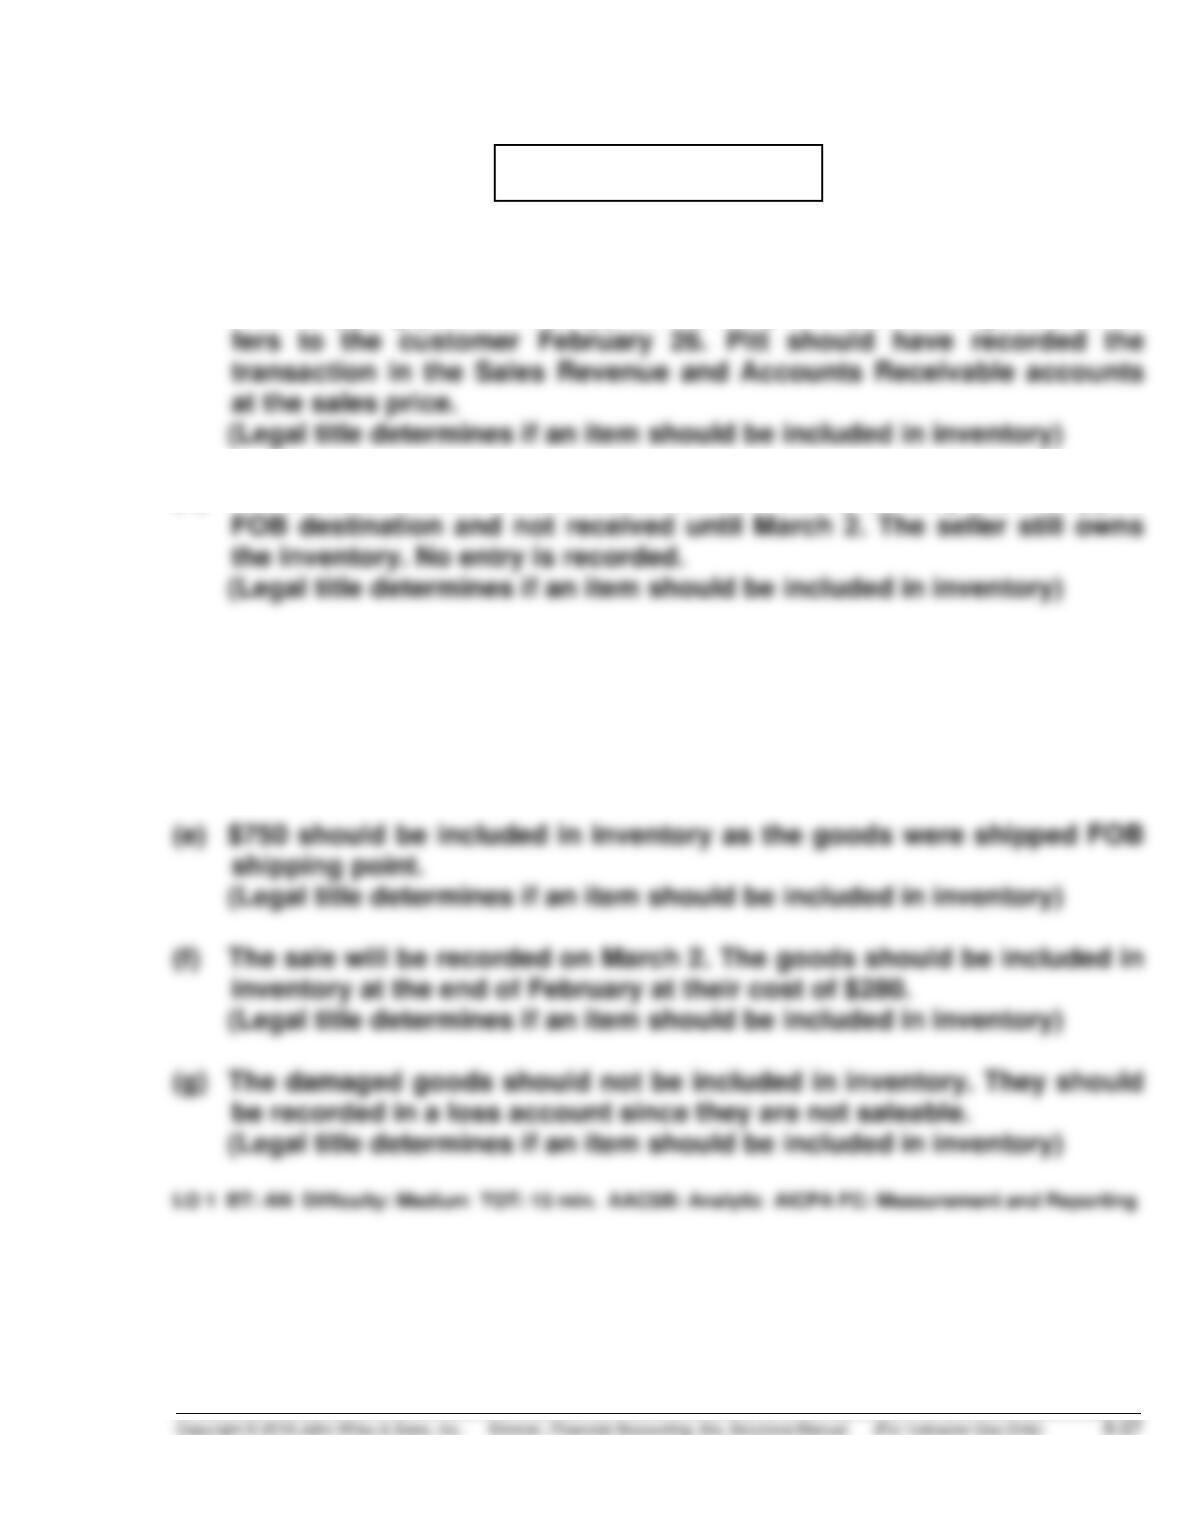
(a) The goods should not be included in inventory as they were shipped
FOB shipping point and shipped February 26. Title to the goods trans-
(b) The amount should not be included in inventory as they were shipped
(c) Include $500 in inventory.
(Legal title determines if an item should be included in inventory)
(d) Include $400 in inventory.
(Legal title determines if an item should be included in inventory)
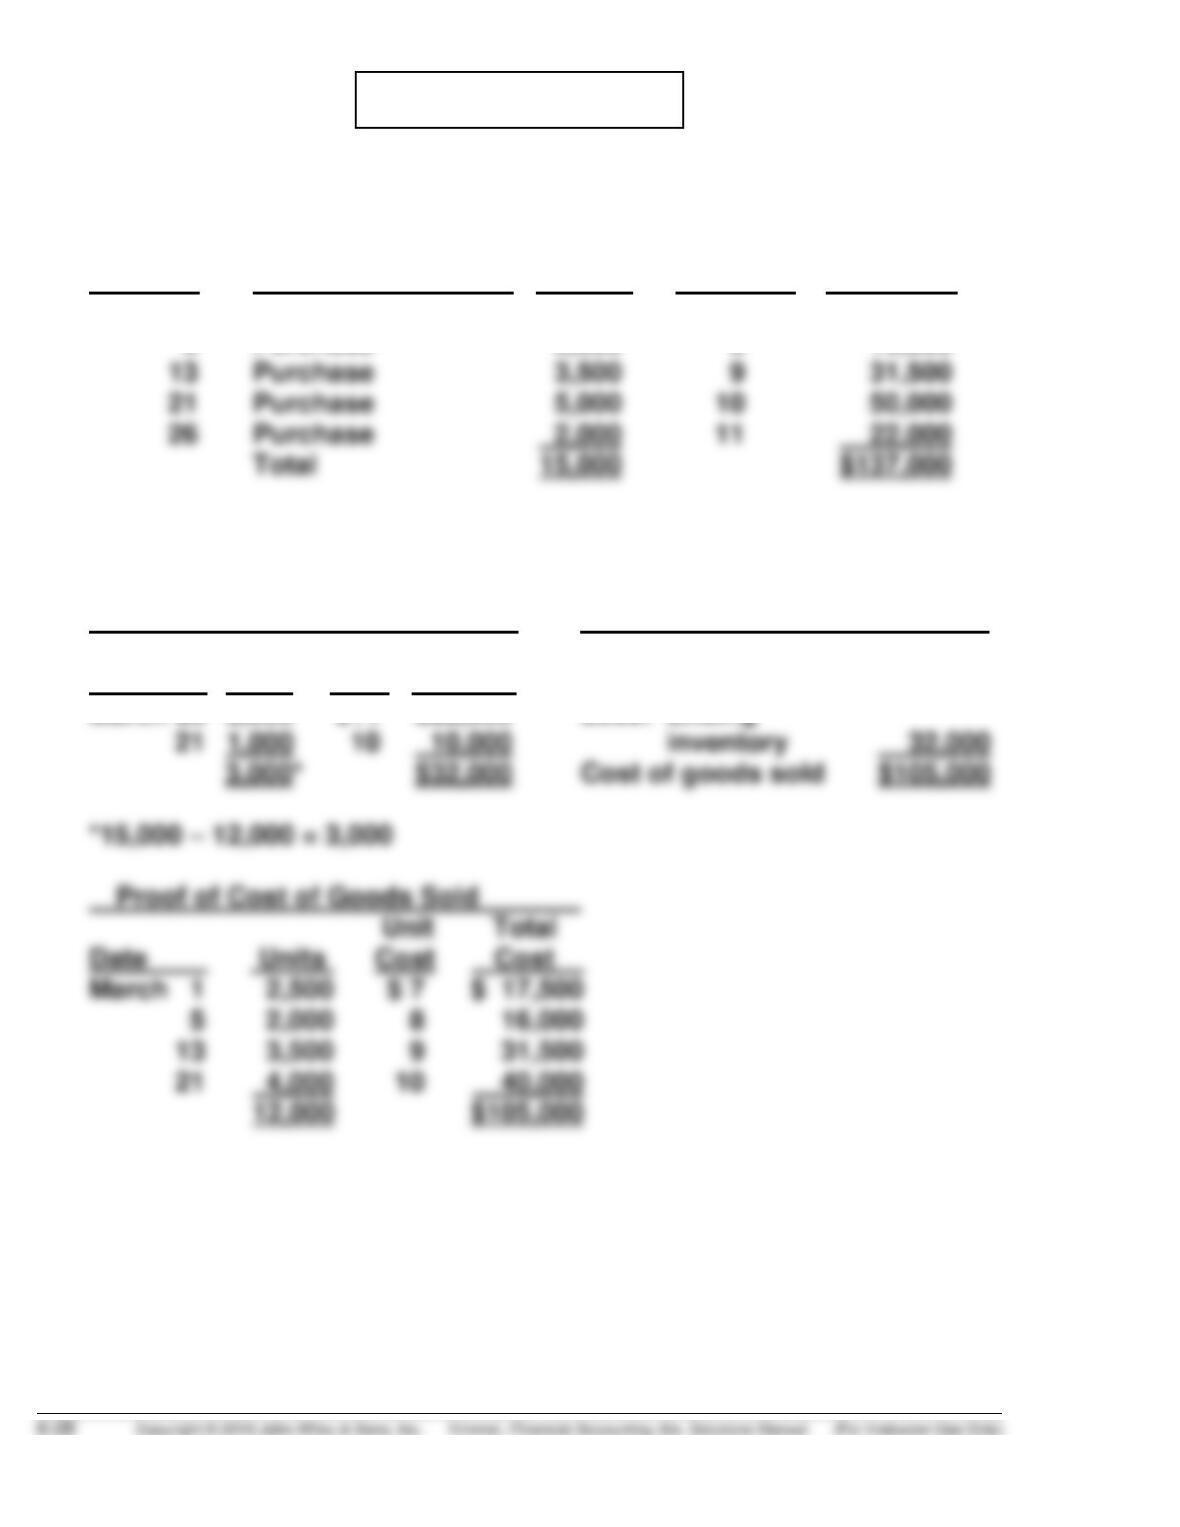
PROBLEM 6-2A
(a)
COST OF GOODS AVAILABLE FOR SALE
Date Explanation Units Unit Cost Total Cost
March 1 Beginning inventory 2,500 $ 7 $ 17,500
5 Purchase 2,000 8 16,000
(b)
FIFO
(1) Ending Inventory (2) Cost of Goods Sold
Unit Total Cost of goods
Date Units Cost Cost available for sale $137,000
March 26 2,000 $11 $22,000 Less: Ending
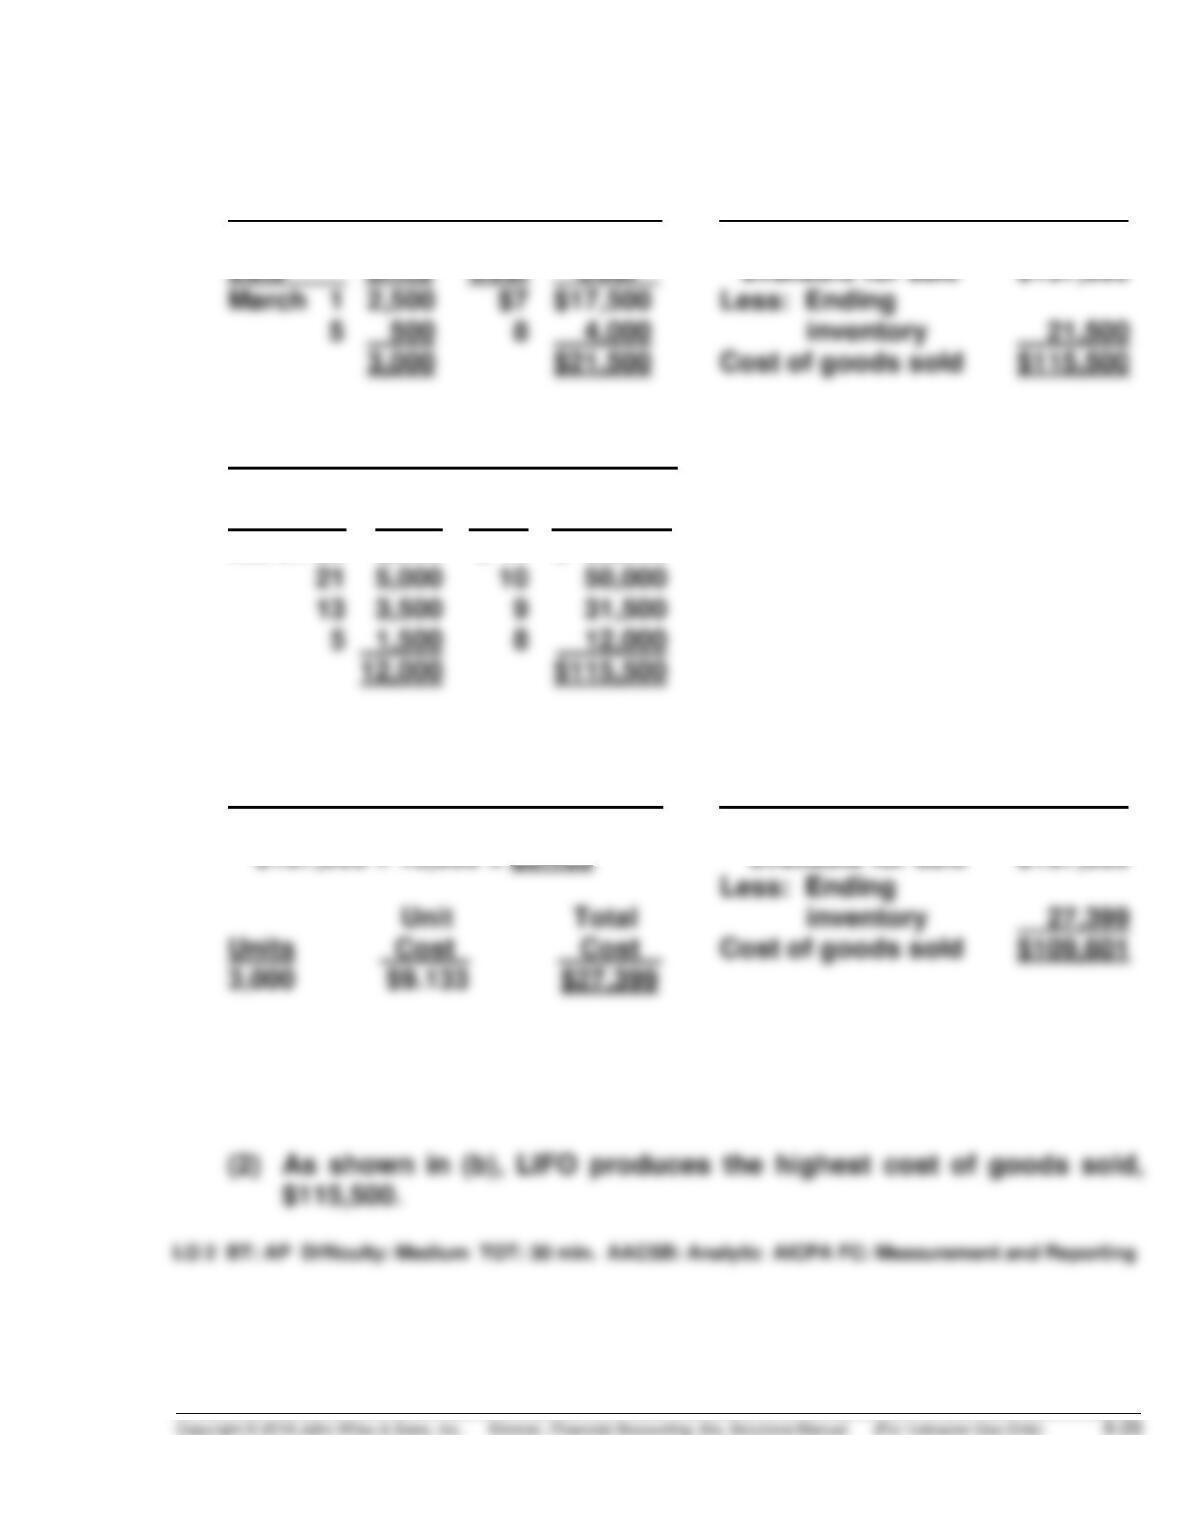
PROBLEM 6-2A (Continued)
LIFO
(1) Ending Inventory (2) Cost of Goods Sold
Unit Total Cost of goods
Proof of Cost of Goods Sold
Unit Total
Date Units Cost Cost
March 26 2,000 $ 11 $ 22,000
AVERAGE-COST
(1) Ending Inventory (2) Cost of Goods Sold
Cost of goods
$137,000 ÷ 15,000 = $9.133 available for sale $137,000
(c) (1) As shown in (b), FIFO produces the highest inventory amount,
$32,000.
PROBLEM 6-3A
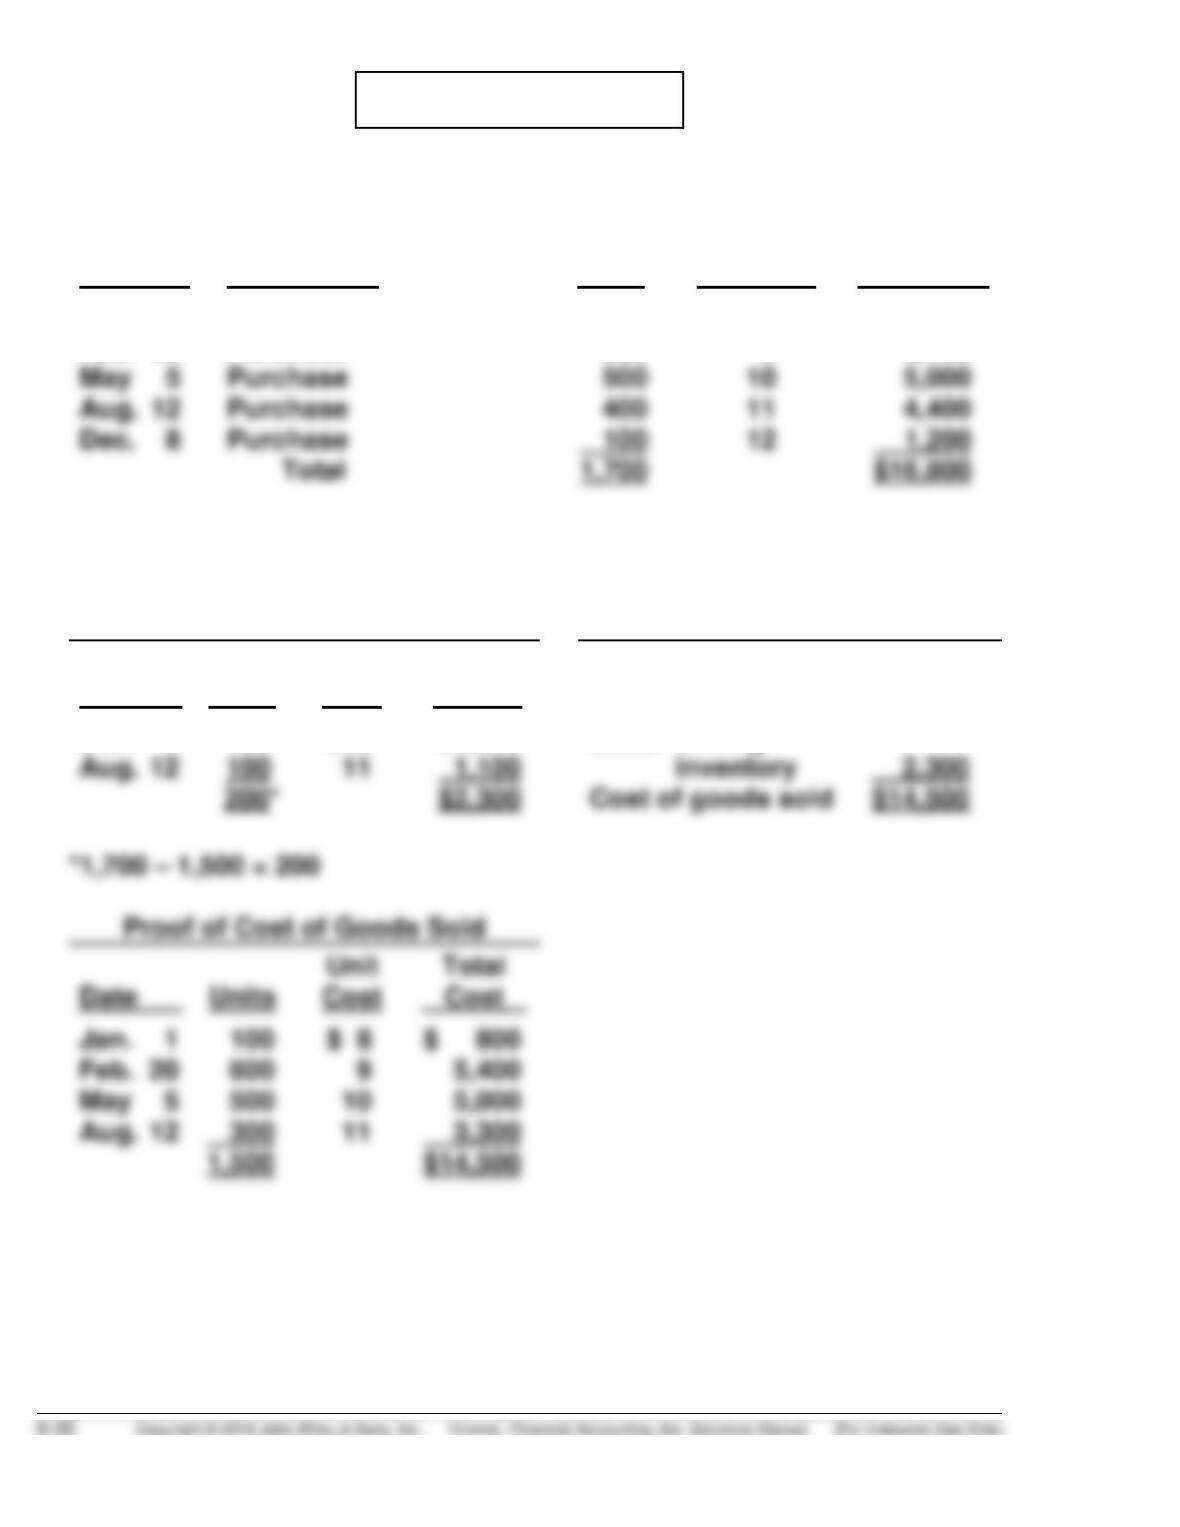
(a) COST OF GOODS AVAILABLE FOR SALE
Date
Explanation
Units
Unit Cost
Total Cost
Jan. 1
Beginning inventory
100
$ 8
$ 800
Feb. 20
Purchase
600
9
5,400
May 5
Purchase
500
5,000
Aug. 12
Purchase
400
4,400
Dec. 8
Purchase
Total
$16,800
(b)
FIFO
(1) Ending Inventory
(2) Cost of Goods Sold
Date
Units
Unit
Cost
Total
Cost
Cost of goods
available for sale
$16,800
Dec. 8
100
$12
$1,200
Less: Ending
Aug. 12
100
inventory
$14,500
Date
Jan. 1
Feb. 20
May 5
Aug. 12
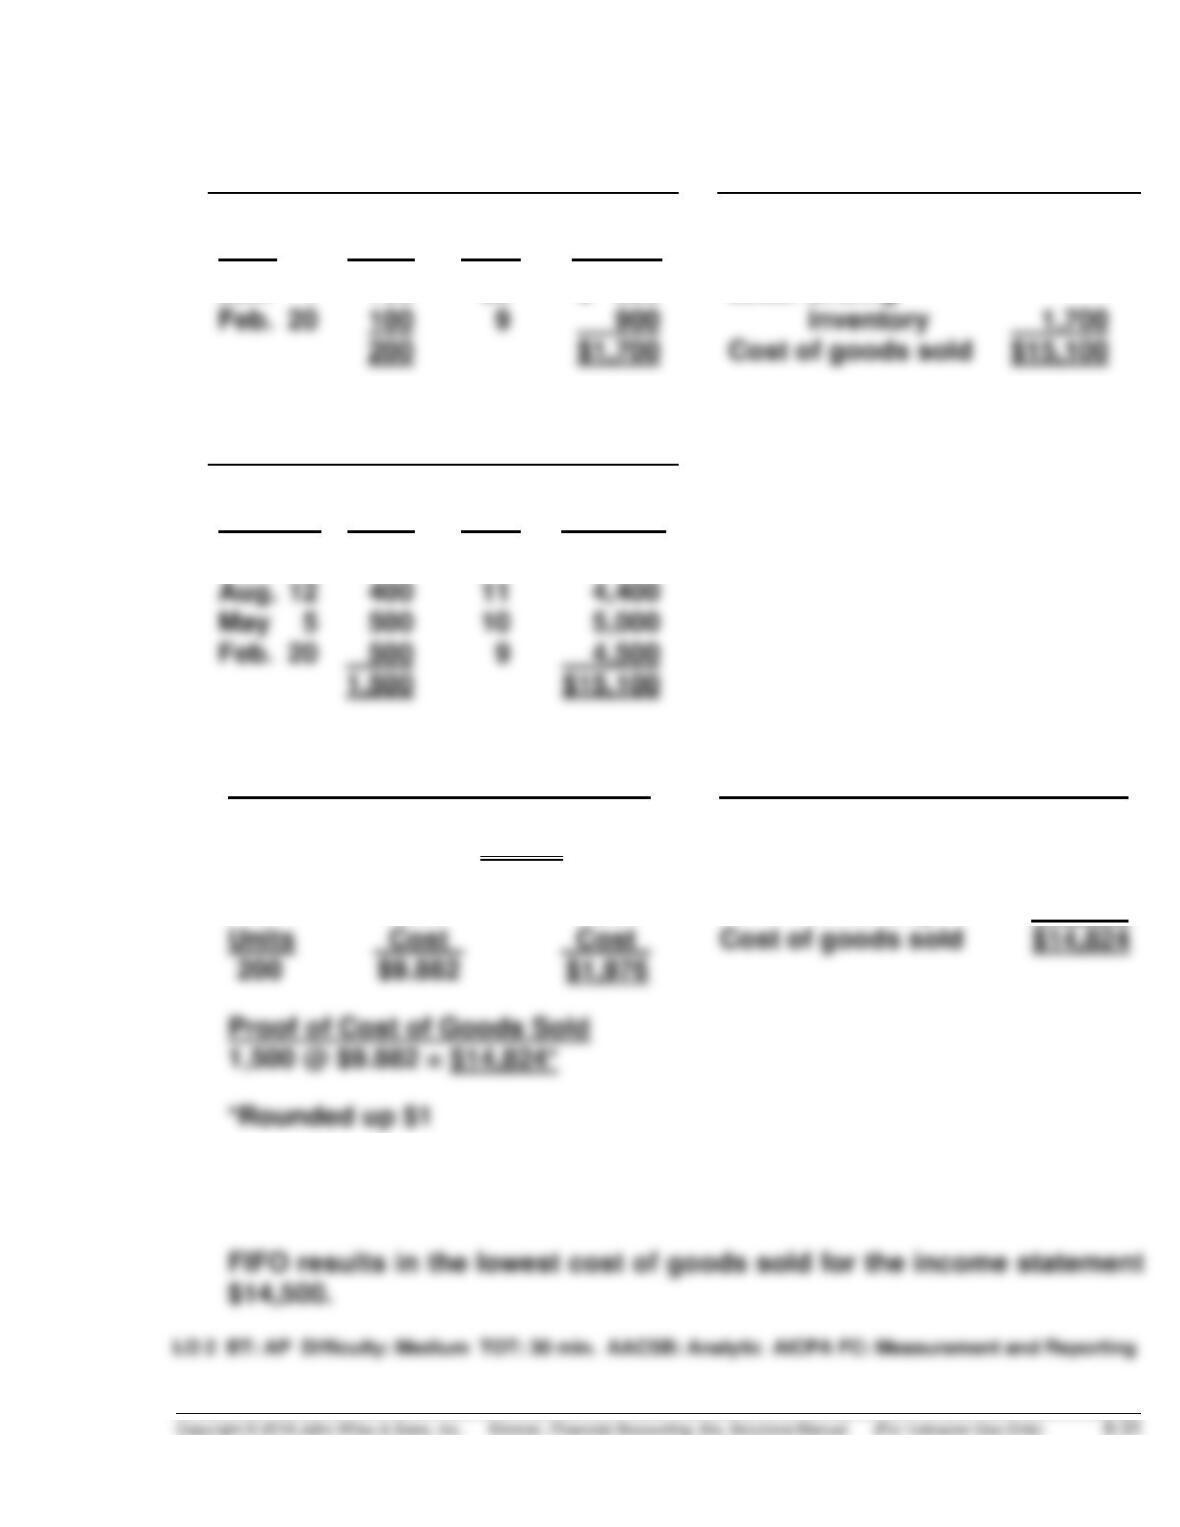
PROBLEM 6-3A (Continued)
LIFO
(1) Ending Inventory
(2) Cost of Goods Sold
Date
Units
Unit
Cost
Total
Cost
Cost of goods
available for sale
$16,800
Jan. 1
100
$8
$ 800
Less: Ending
Feb. 20
100
inventory
Cost of goods sold
$15,100
Proof of Cost of Goods Sold
Date
Units
Unit
Cost
Total
Cost
Dec. 8
100
$12
$ 1,200
Aug. 12
400
11
May 5
500
10
Feb. 20
$15,100
AVERAGE-COST
(1) Ending Inventory (2) Cost of Goods Sold
Cost of goods
$16,800 ÷ 1,700 = $9.882 available for sale $16,800
Less: Ending
Unit Total inventory 1,976
(c) LIFO results in the lowest inventory amount for the balance sheet,
$1,700.
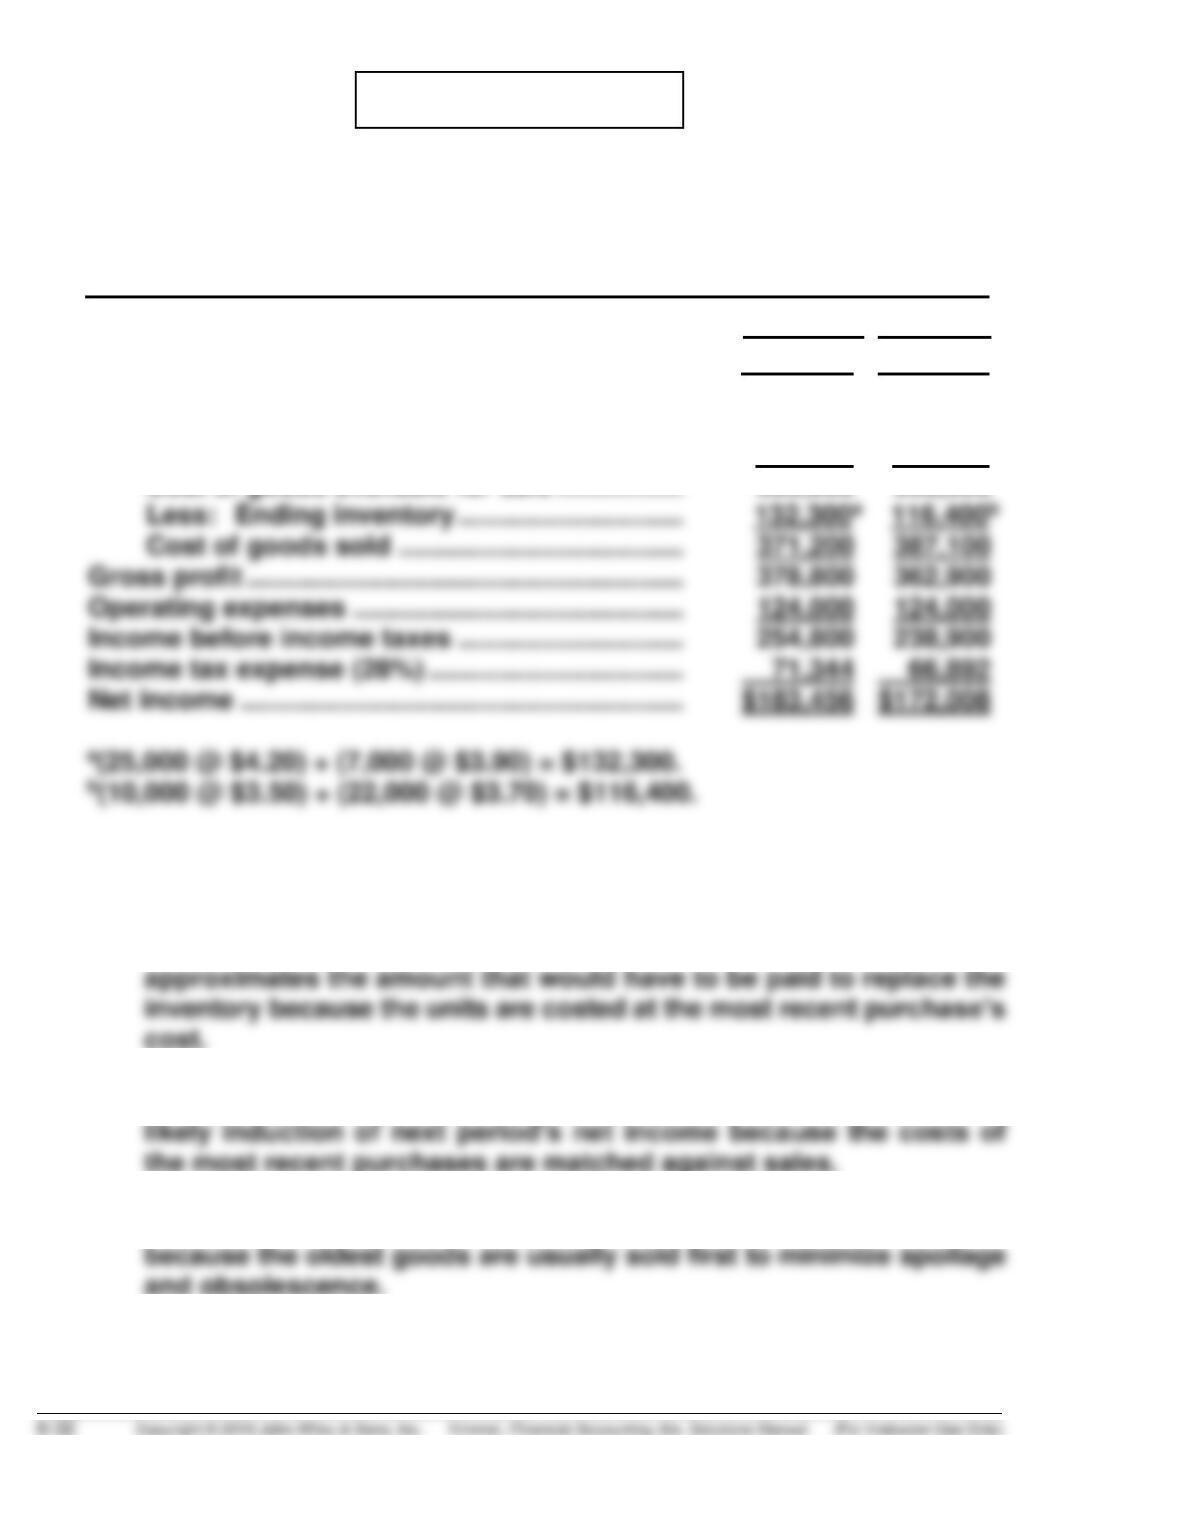
PROBLEM 6-4A
(a) NATIONAL, INC.
Condensed Income Statements
For the Year Ended December 31, 2017
FIFO LIFO
Sales …………………………………………………………… $750,000 $750,000
Cost of goods sold
Beginning inventory ……………………………… 35,000 35,000
Cost of goods purchased ………………………. 468,500 468,500
Cost of goods available for sale …………….. 503,500 503,500
(b) Answers to questions:
(1) The FIFO method produces the inventory amount that most closely
(2) The LIFO method produces the net income amount that is a more
(3) The FIFO method is most likely to approximate actual physical flow
PROBLEM 6-4A (Continued)
(4) There will be $4,452 additional cash available under LIFO because
income taxes are $66,892 under LIFO and $71,344 under FIFO.
(5) The illusionary gross profit is $15,900 ($378,800 – $362,900) under
FIFO. Under LIFO, National Inc. has recovered the current
replacement cost of the units ($387,100), whereas under FIFO, it
has only recovered the earlier costs ($371,200). This means that
under FIFO, the company must reinvest $15,900 of the gross profit
to replace the units used.
Answer in business-letter form:
Dear National Inc.
After preparing the comparative condensed income statements for
2017 under the FIFO and LIFO methods, we have found the following:
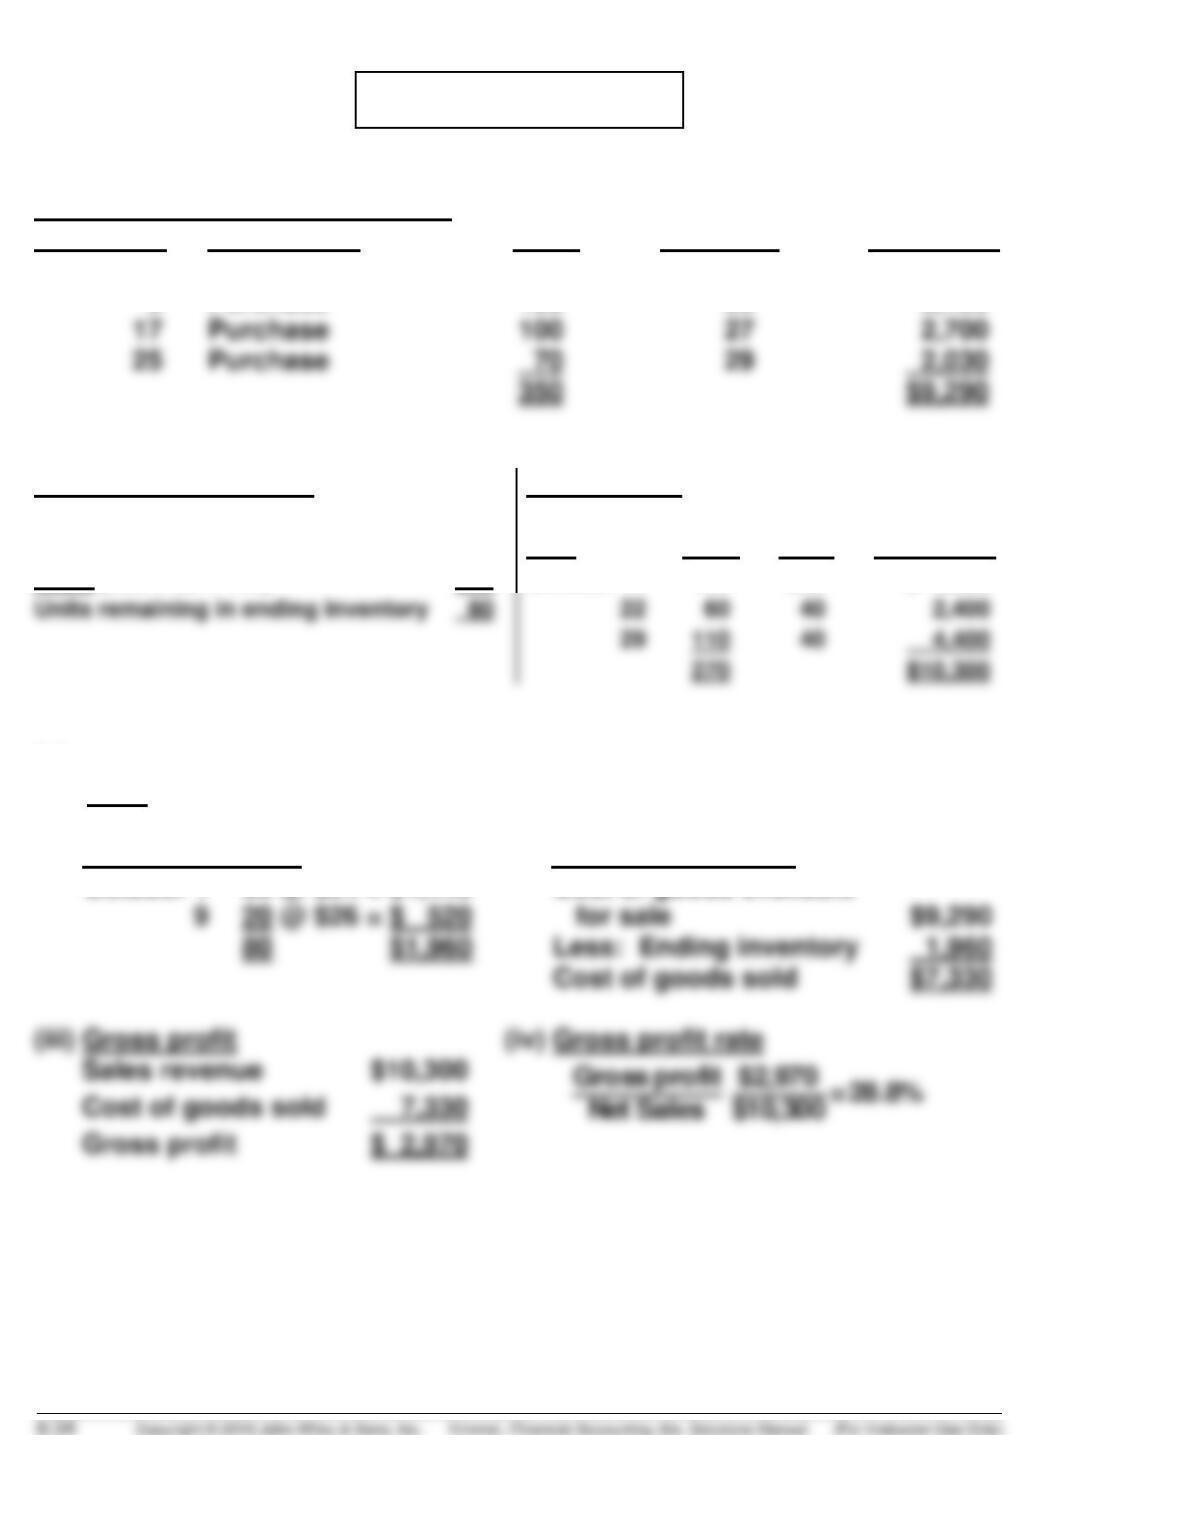
PROBLEM 6-5A
Cost of Goods Available for Sale
Date Explanation Units Unit Cost Total Cost
October 1 Beginning inventory 60 $24 $1,440
9 Purchase 120 26 3,120
Ending Inventory in Units
Sales revenue
Units available for sale
350
Date
Units
Unit
Price
Total Sales
Sales (100 + 60 + 110)
270
October 11
100
$35
$ 3,500
Units remaining in ending inventory
110
4,400
270
$10,300
(a)
(1) LIFO
(i) Ending inventory
(ii) Cost of goods sold
80 $1,960
Less: Ending inventory
Cost of goods sold
(iii) Gross profit
(iv) Gross profit rate
October 1 60 @ $24 = $1,440
Cost of goods available
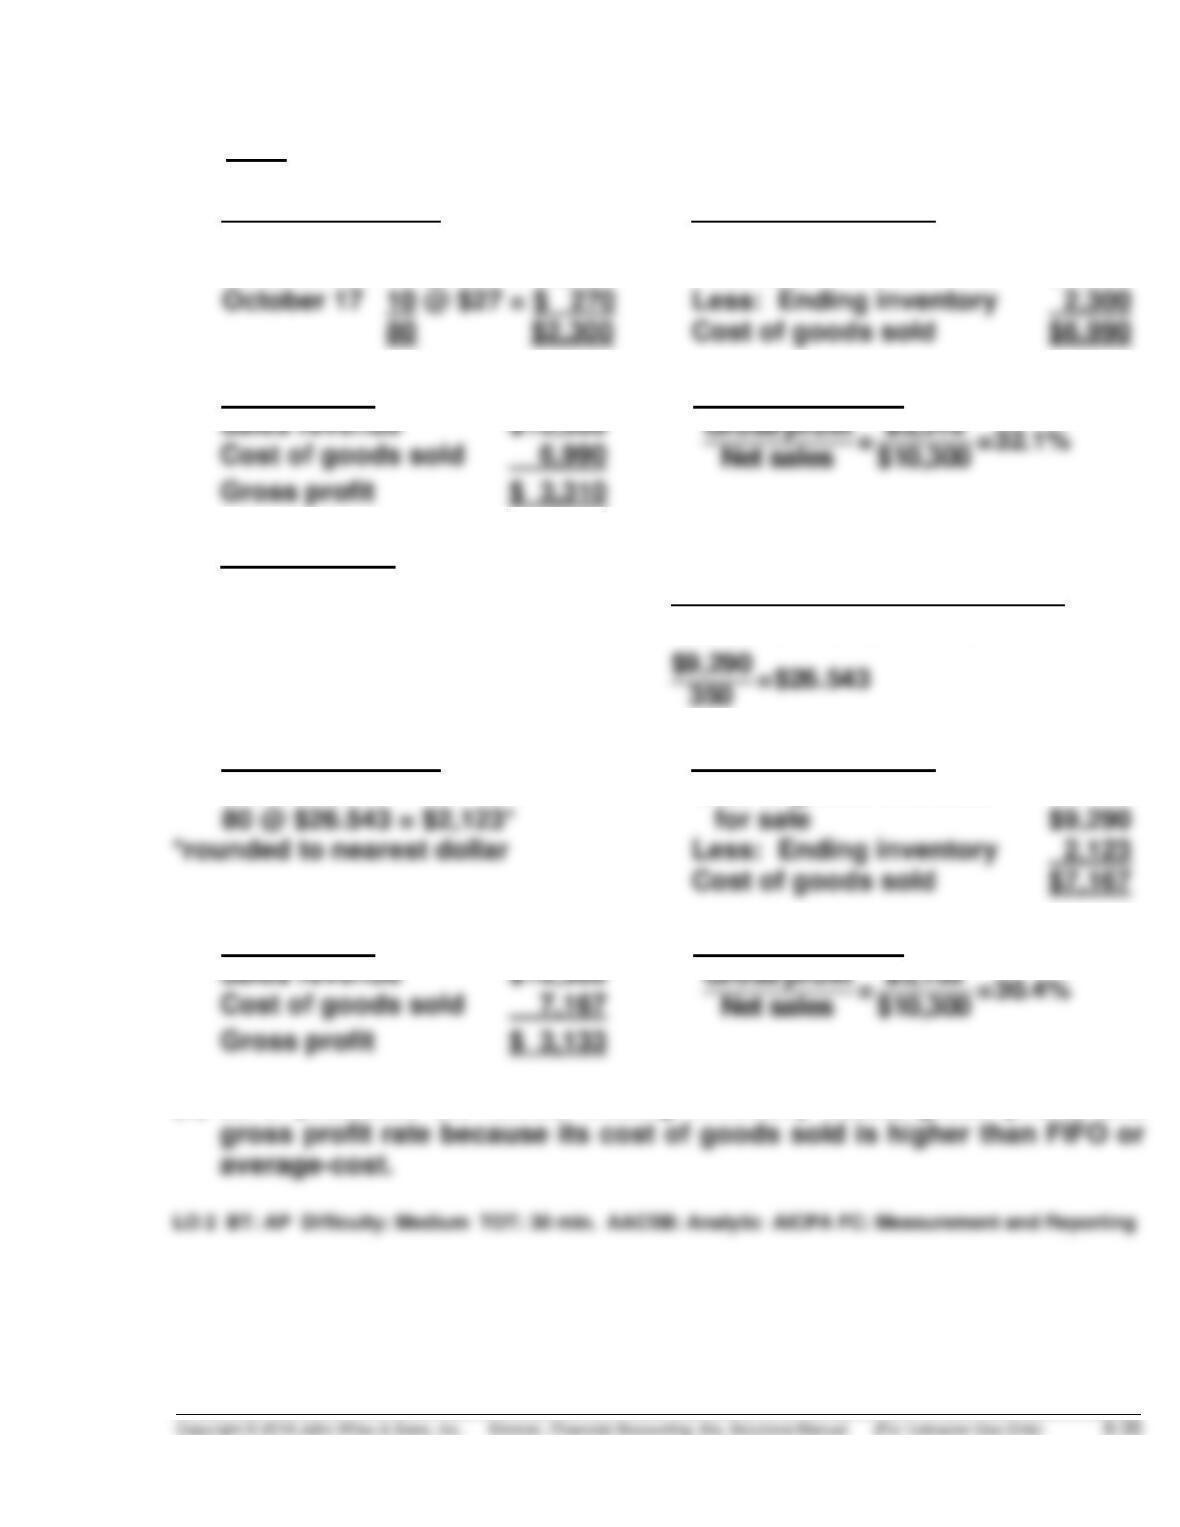
PROBLEM 6-5A (Continued)
(2) FIFO
(i) Ending inventory
(ii) Cost of goods sold
October 25 70 @ $29 = $2,030
Cost of goods available
for sale
$9,290
October 17 10 @ $27 = $ 270
Less: Ending inventory
Cost of goods sold
(iii) Gross profit
(iv) Gross profit rate
Sales revenue
Gross profit
(3) Average-Cost
Weighted-average cost per unit:
Cost of goods available for sale
Units available for sale
(i) Ending inventory
(ii) Cost of goods sold
*rounded to nearest dollar
Less: Ending inventory
Cost of goods sold
Cost of goods available
(iii) Gross profit
(iv) Gross profit rate
Sales revenue
Gross profit
(b) LIFO produces the lowest ending inventory value, gross profit, and
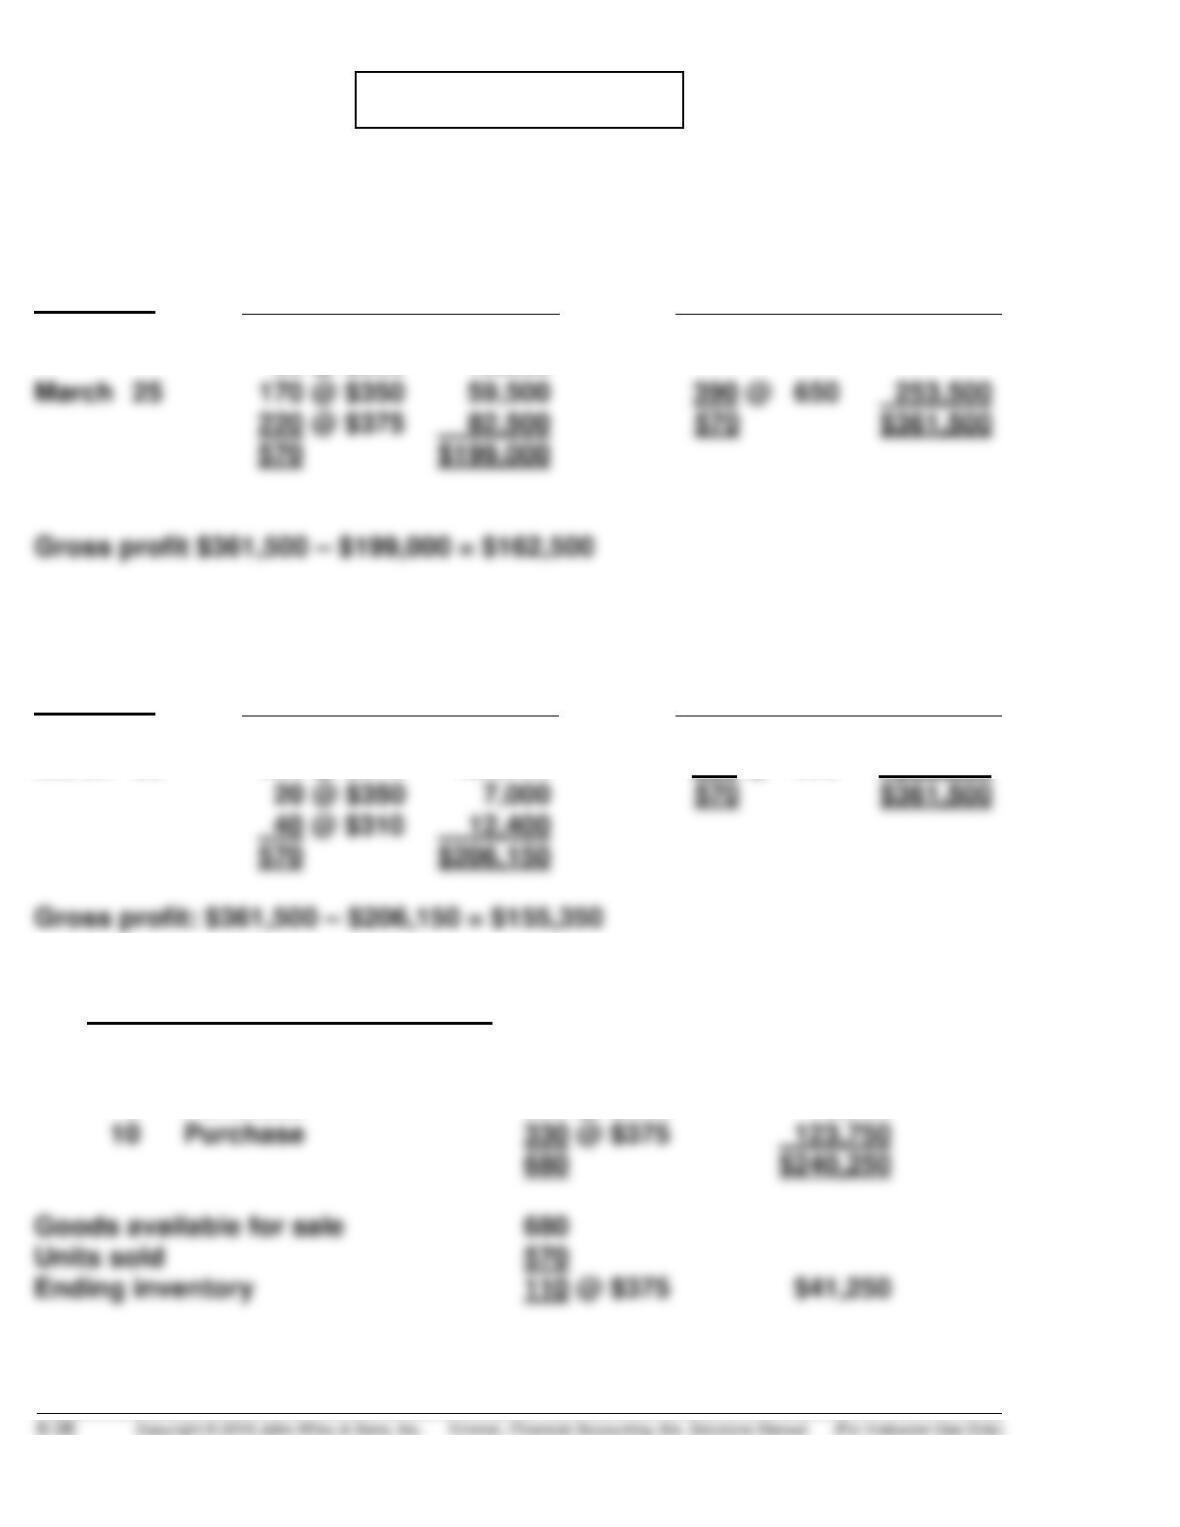
PROBLEM 6-6A
(a) (1) To maximize gross profit, Jewels’ Gems should sell the diamonds
with the lowest cost.
Sale Date
Cost of goods sold
Sales Revenue
March 5
150 @ $310
$ 46,500
180 @ $600
$108,000
30 @ $350
10,500
March 25
170 @ $350
59,500
390 @ 650
253,500
220 @ $375
$361,500
570
$199,000
(2) To minimize gross profit, Jewels’ Gems should sell the diamonds
with the highest cost.
Sale Date
Cost of goods sold
Sales Revenue
March 5
180 @ $350
$ 63,000
180 @ $600
$108,000
March 25
330 @ $375
123,750
390 @ 650
253,500
40 @ $310
570
$206,150
(b) FIFO
Cost of goods available for sale
March 1
Beginning inventory
150 @ $310
$ 46,500
3
Purchase
200 @ $350
70,000
Purchase
$240,250
Goods available for sale
Units sold
Ending inventory
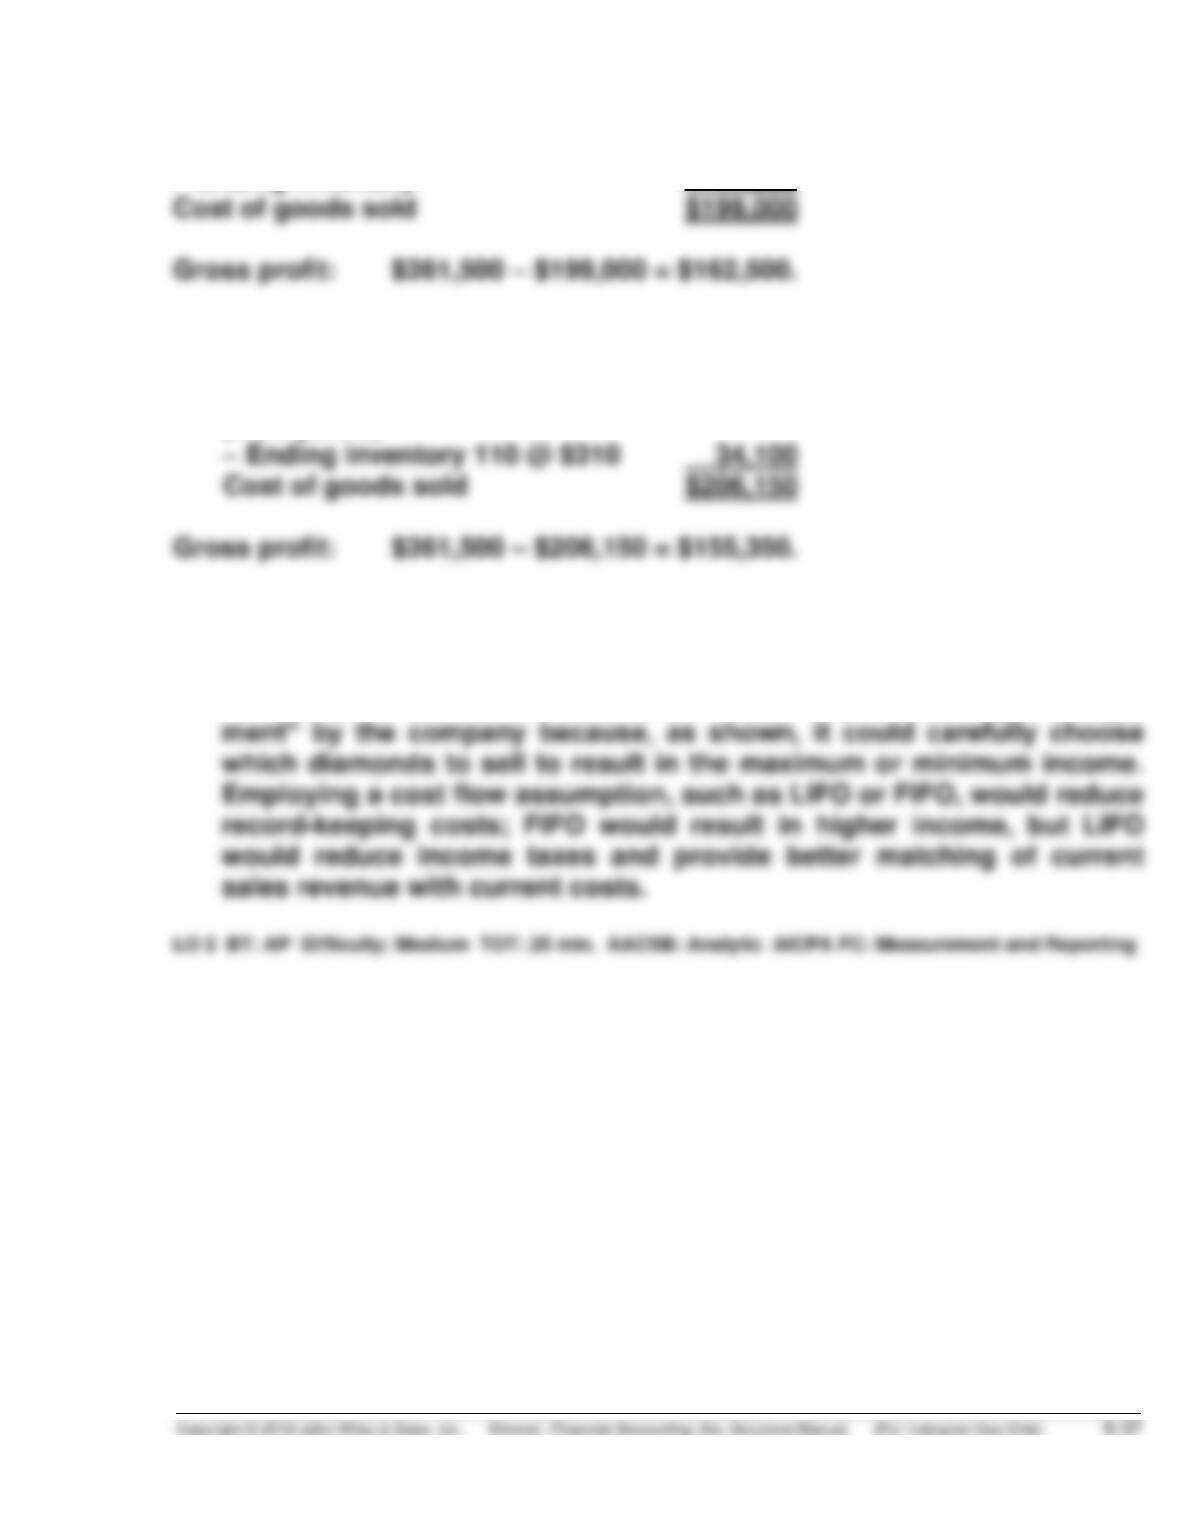
PROBLEM 6-6A (Continued)
Cost of goods available for sale $240,250
– Ending inventory 41,250
(c) LIFO
Cost of goods available for sale $240,250
(from part b)
(d) The choice of inventory method depends on the company’s objectives.
Since the diamonds are marked and coded, the company could use
specific identification. This could, however, result in “earnings manage–
PROBLEM 6-7A
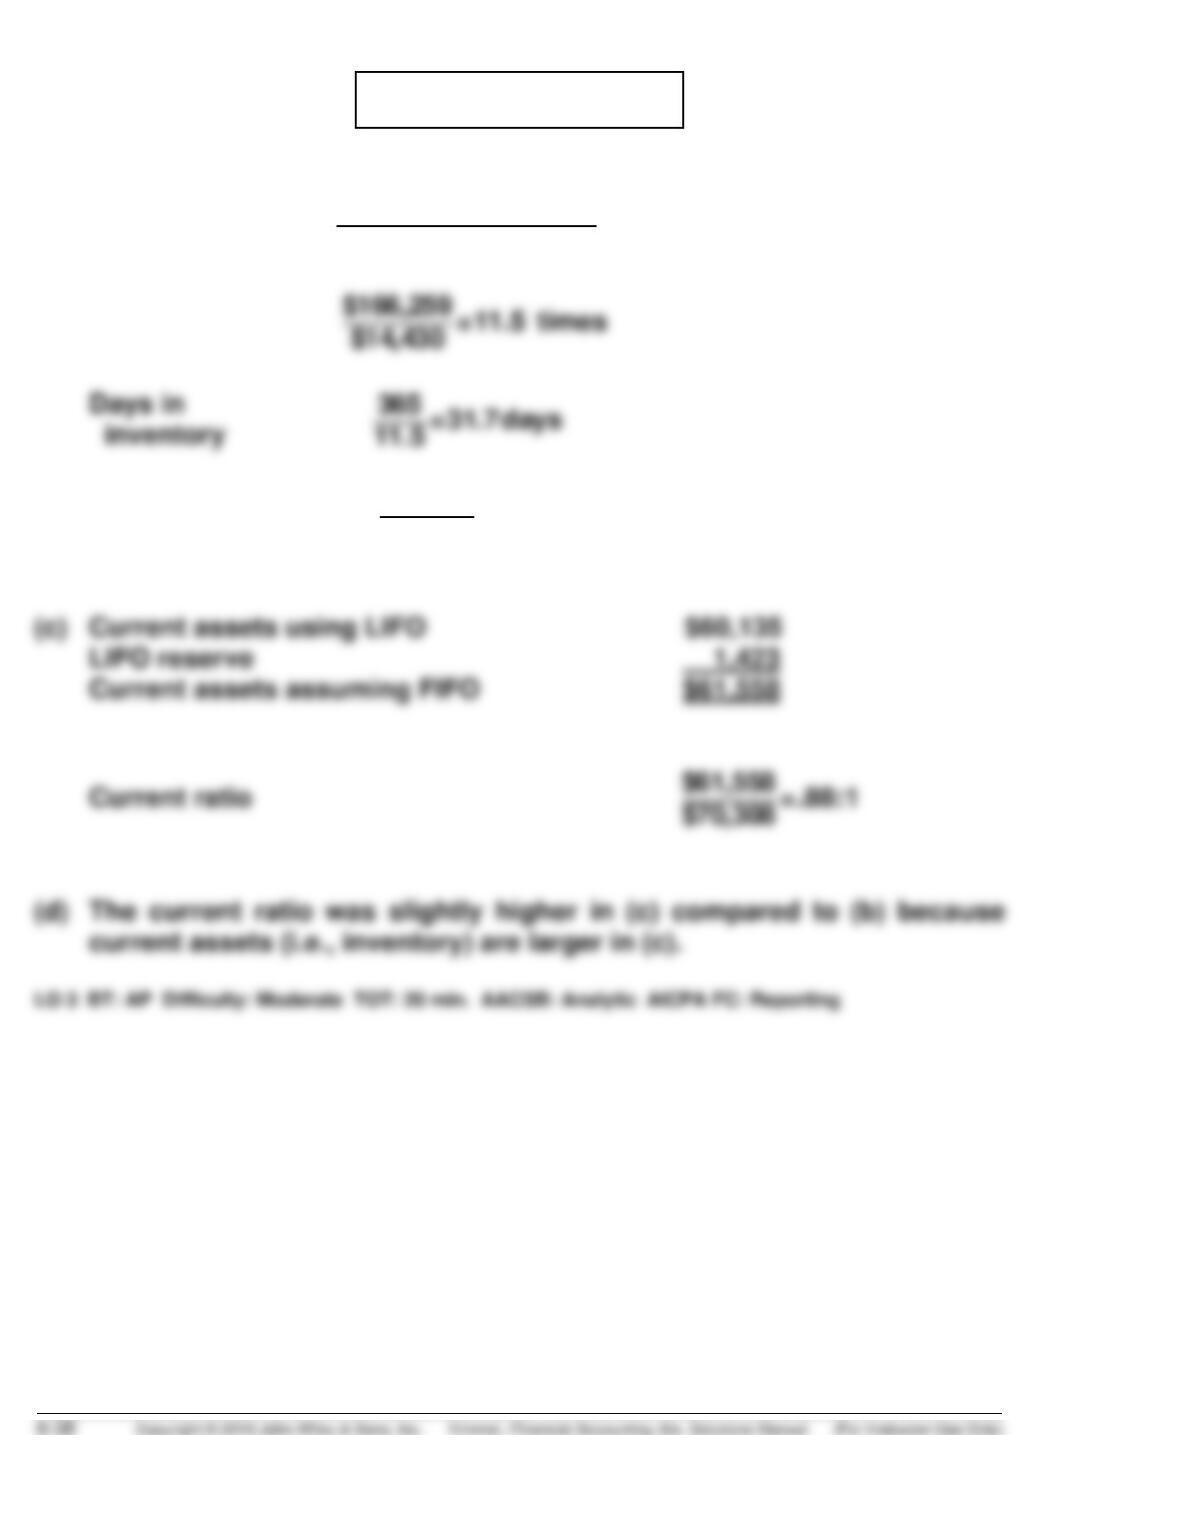
(a) Inventory
turnover
$166,259
($13,921+ $14,939)÷2
(b) Current
ratio
$60,135
$70,308 =.86:1
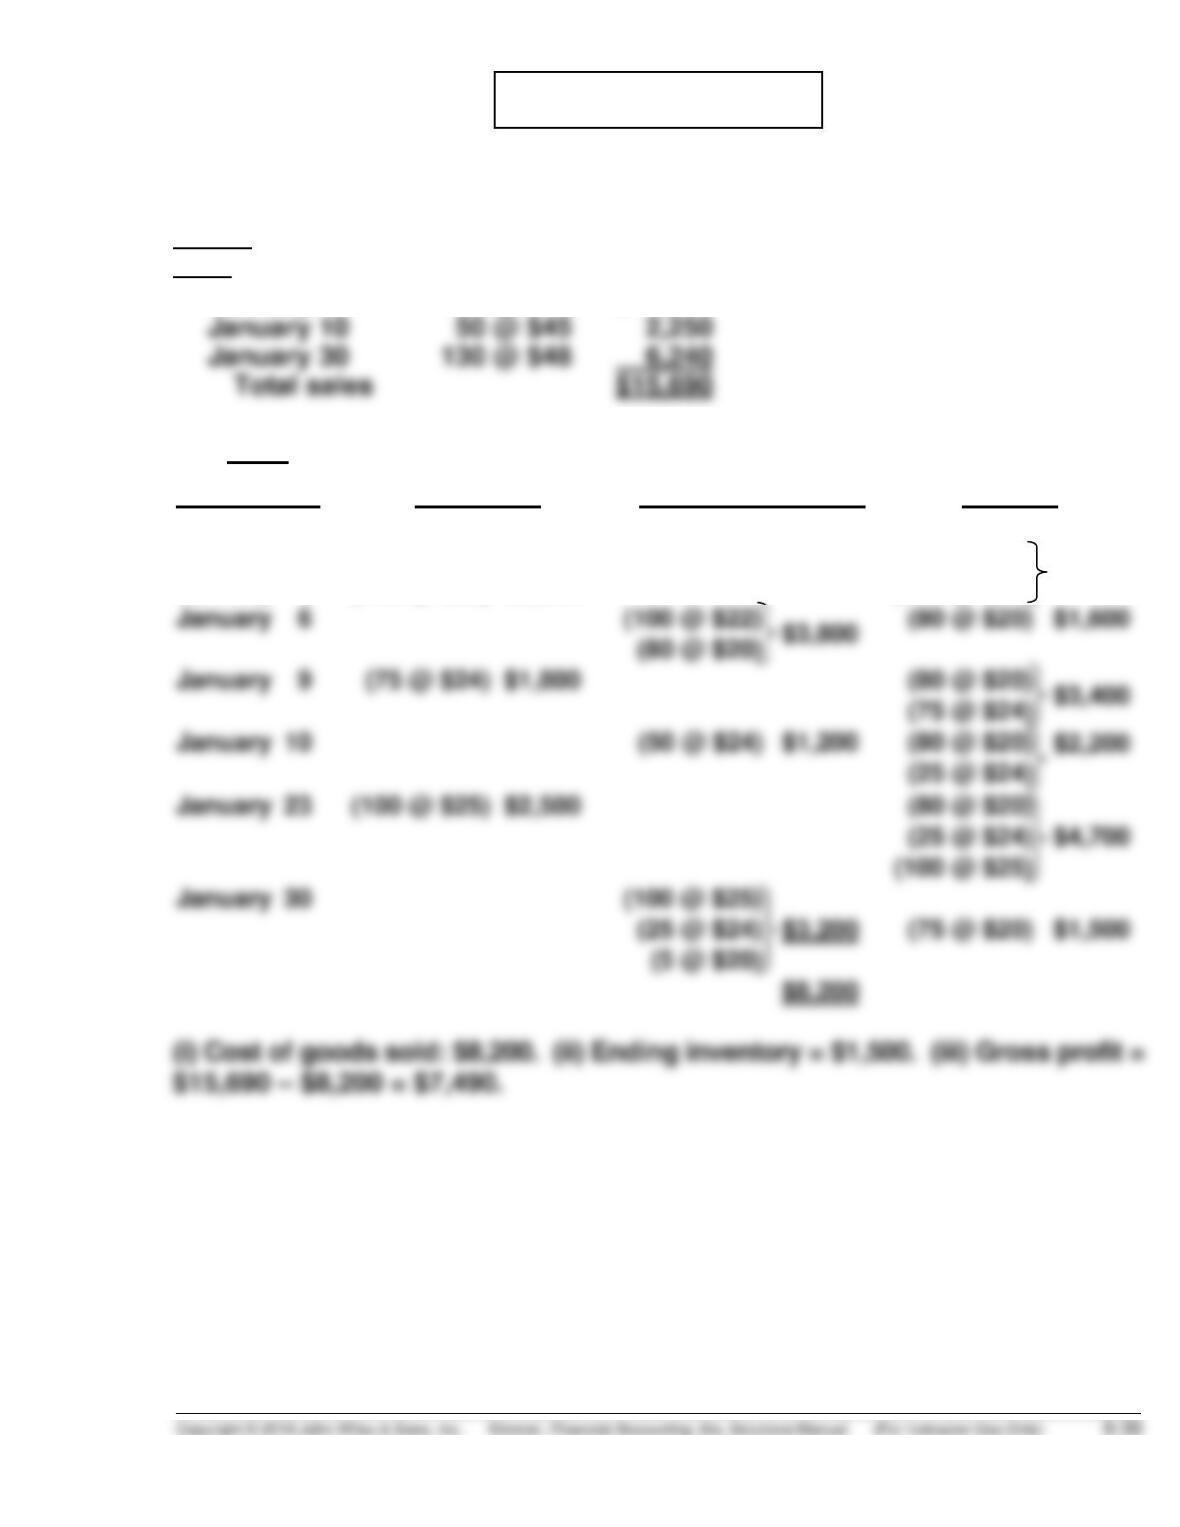
*PROBLEM 6-8A
(a)
Sales:
Date
January 6
180 @ $40
$ 7,200
January 10
January 30
130 @ $48
(1) LIFO
Date
Purchases
Cost of goods sold
Balance
January 1
(160 @ $20)
$3,200
January 2
(100 @ $22) $2,200
(160 @ $20)
(100 @ $22)
$5,400
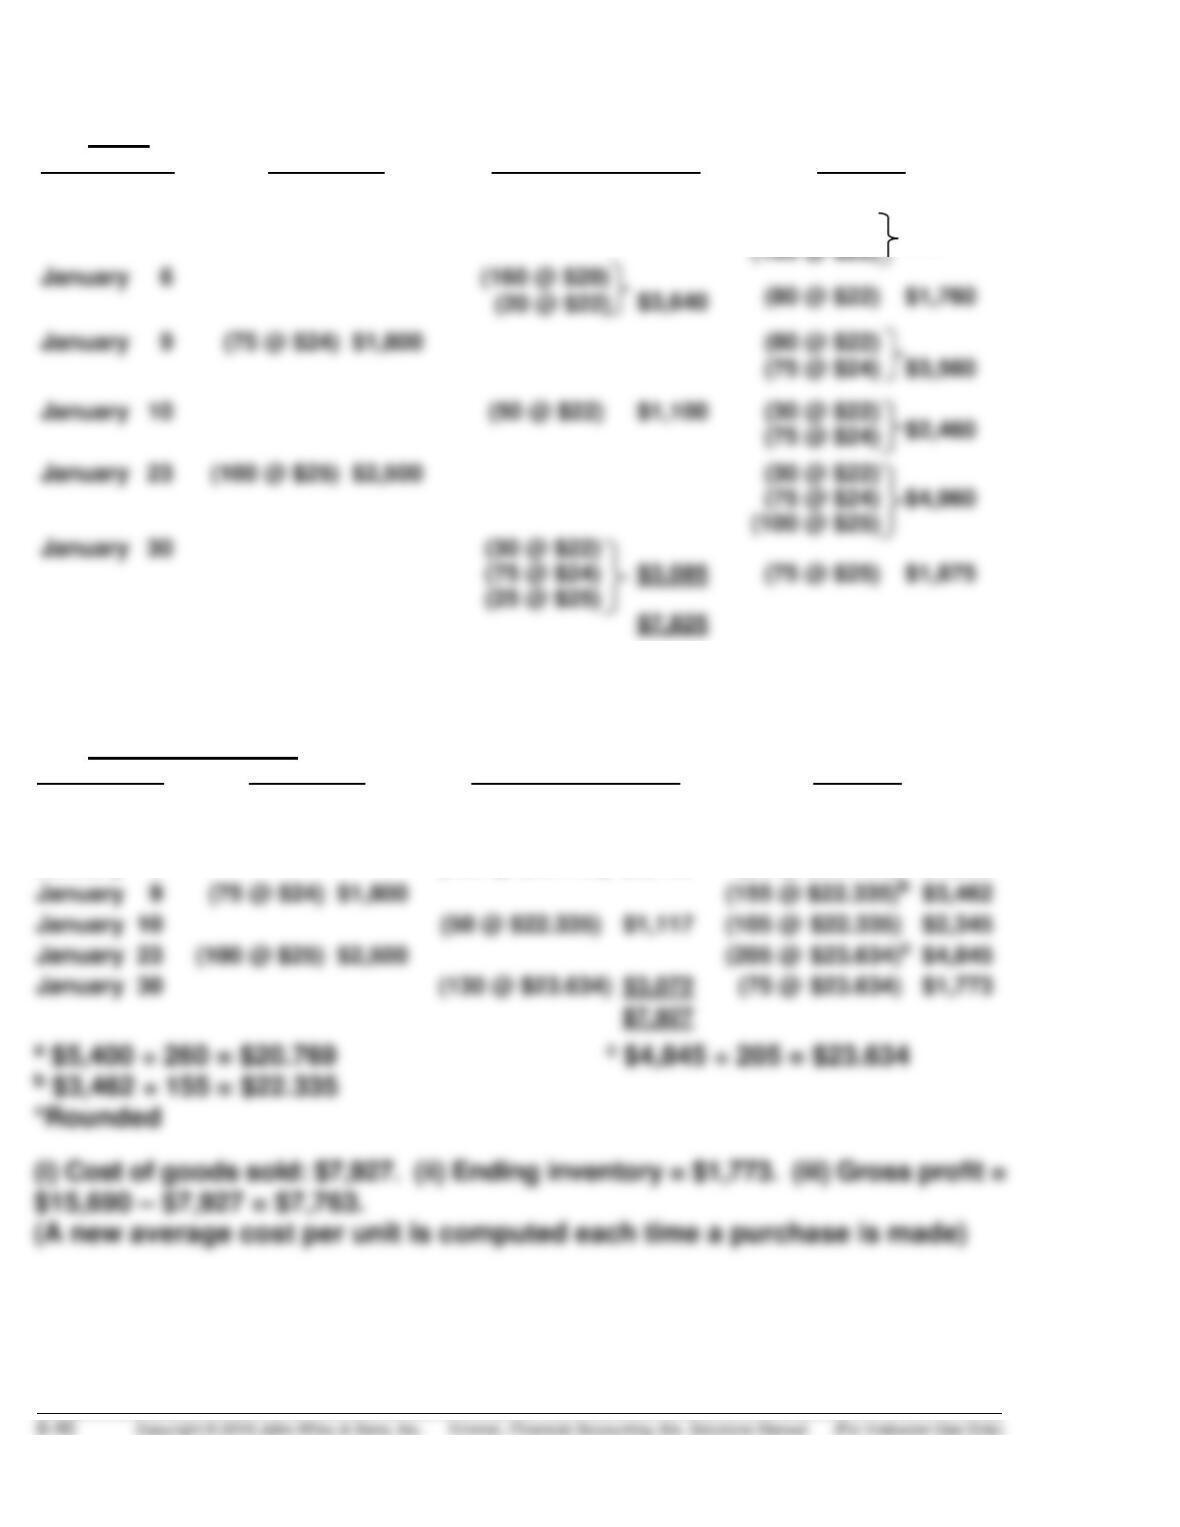
*PROBLEM 6-8A (Continued)
(2) FIFO
Date
Purchases
Cost of goods sold
Balance
January 1
(160 @ $20)
$3,200
January 2
(100 @ $22) $2,200
(160 @ $20)
$5,400
(i) Cost of goods sold: $7,825. (ii) Ending inventory = $1,875. (iii) Gross profit =
$15,690 – $7,825 = $7,865.
(3) Moving-Average:
Date
Purchases
Cost of goods sold
Balance
January 1
(160 @ $20)
$3,200
January 2
(100 @ $22) $2,200
(260 @ $20.769)a
$5,400
January 6
(180 @ $20.769) $3,738*
(80 @ $20.769)
$1,662
January 10
(105 @ $22.335)
January 23
(100 @ $25) $2,500
January 30
(130 @ $23.634) $3,072