SOLUTIONS TO PROBLEMS—SET B
PROBLEM 6-1B
(a) Include $1,000 in inventory.
The goods should be included in inventory as they were shipped FOB
destination and were not received by the customer until April 1. Title to
the goods transfers to the customer April 1.
(b) Include $620 in inventory.
The amount should be included in inventory as the goods were
shipped FOB shipping point March 28. Sun, the buyer, owns the
inventory as soon as it is shipped.
PROBLEM 6-2B
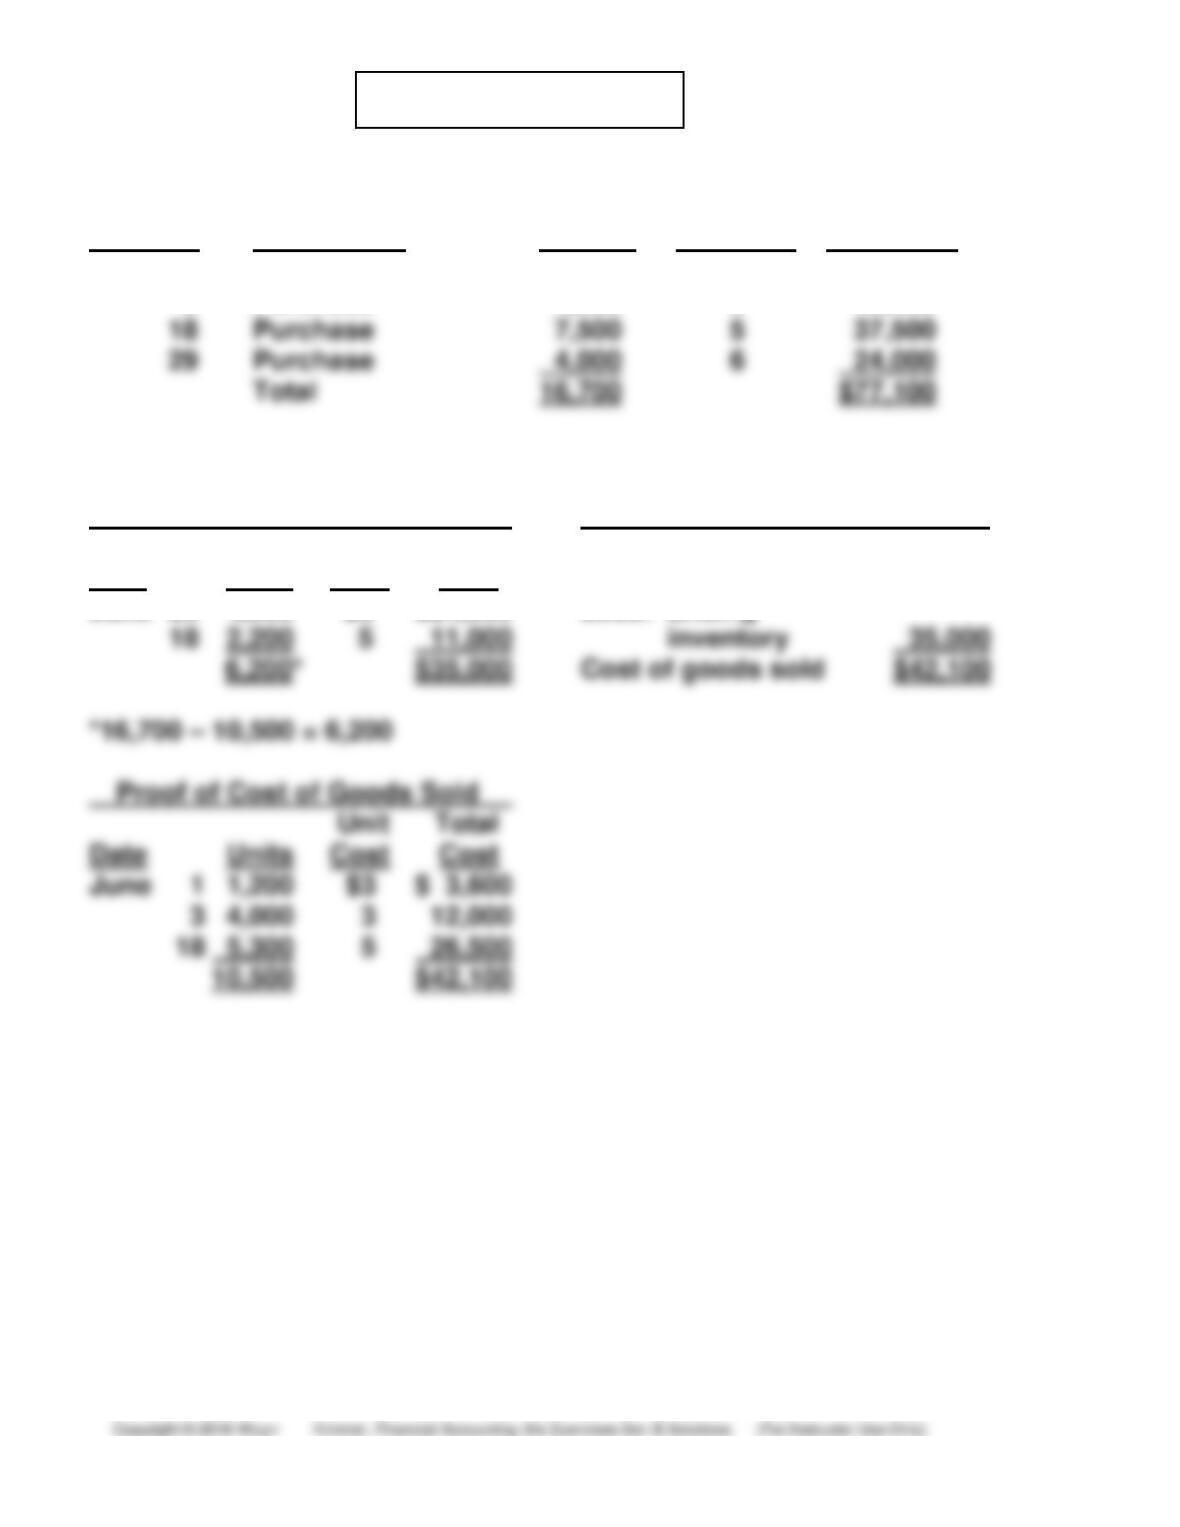
(a) COST OF GOODS AVAILABLE FOR SALE
Date Explanation Units Unit Cost Total Cost
June 1 Beginning inventory 1,200 $3 $ 3,600
3 Purchase 4,000 3 12,000
(b) FIFO
(1) Ending Inventory (2) Cost of Goods Sold
Unit Total Cost of goods
Date Units Cost Cost available for sale $77,100
June 29 4,000 $6 $24,000 Less: Ending
PROBLEM 6-2B (Continued)
LIFO
(1) Ending Inventory (2) Cost of Goods Sold
Unit Total Cost of goods
Date Units Cost Cost available for sale $77,100
June 1 1,200 $3 $ 3,600 Less: Ending
Proof of Cost of Goods Sold
Unit Total
Date Units Cost Cost
June 29 4,000 $6 $24,000
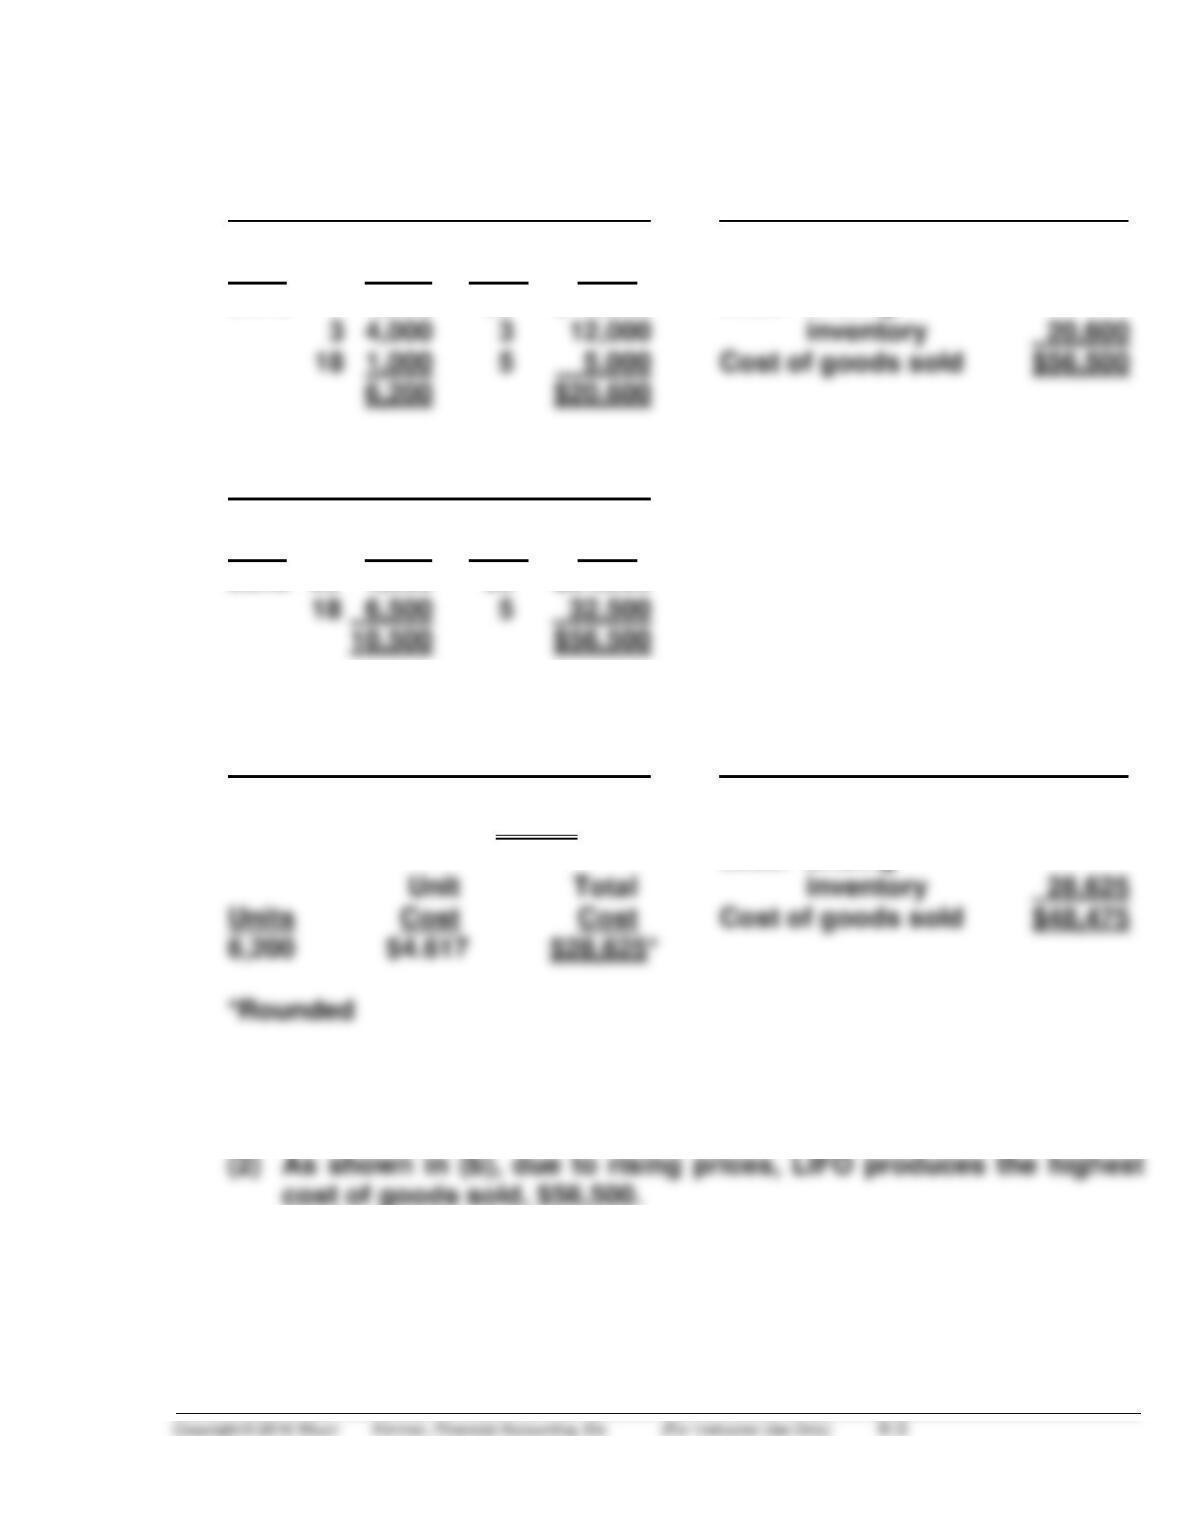
AVERAGE-COST
(1) Ending Inventory (2) Cost of Goods Sold
Cost of goods
$77,100 ÷ 16,700 = $4.617 available for sale $77,100
Less: Ending
(c) (1) As shown in (b), due to rising prices, FIFO produces the highest
inventory amount, $35,000.
PROBLEM 6-3B
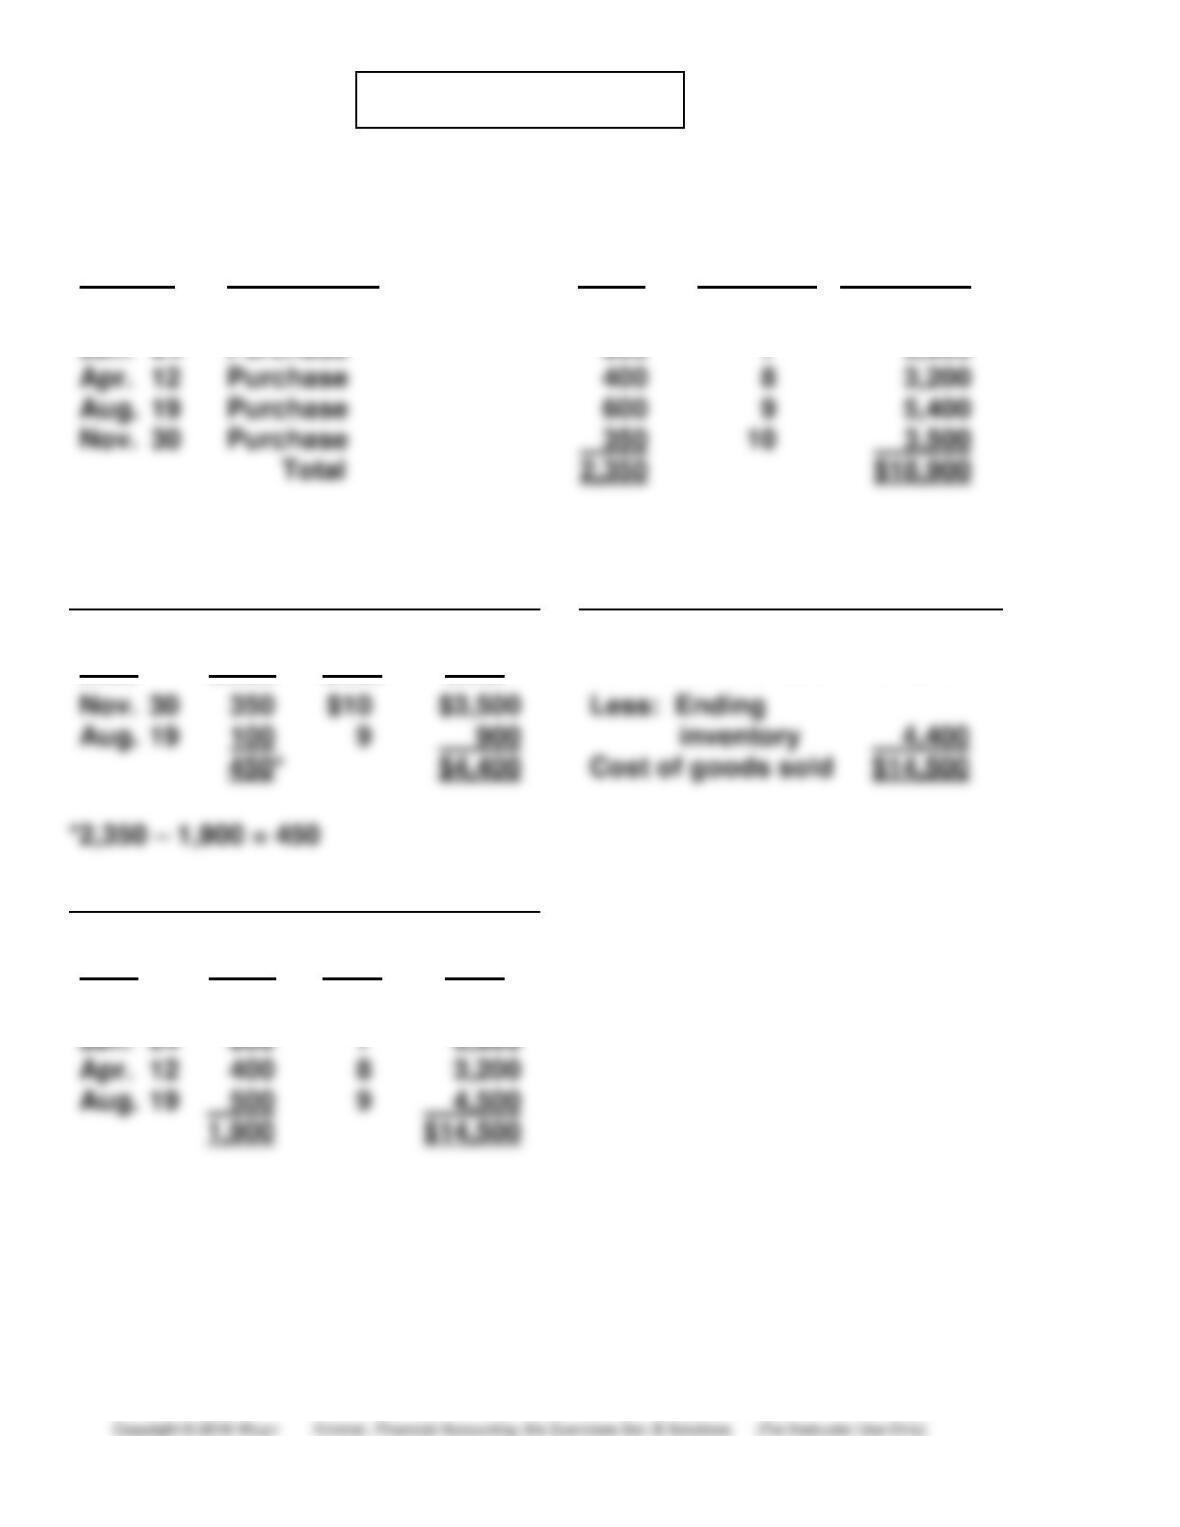
(a) COST OF GOODS AVAILABLE FOR SALE
Date
Explanation
Units
Unit Cost
Total Cost
Jan. 1
Beginning inventory
200
$ 6
$ 1,200
Jan. 24
Purchase
800
7
5,600
Apr. 12
Purchase
400
8
3,200
Aug. 19
Purchase
600
9
5,400
Nov. 30
Purchase
Total
$18,900
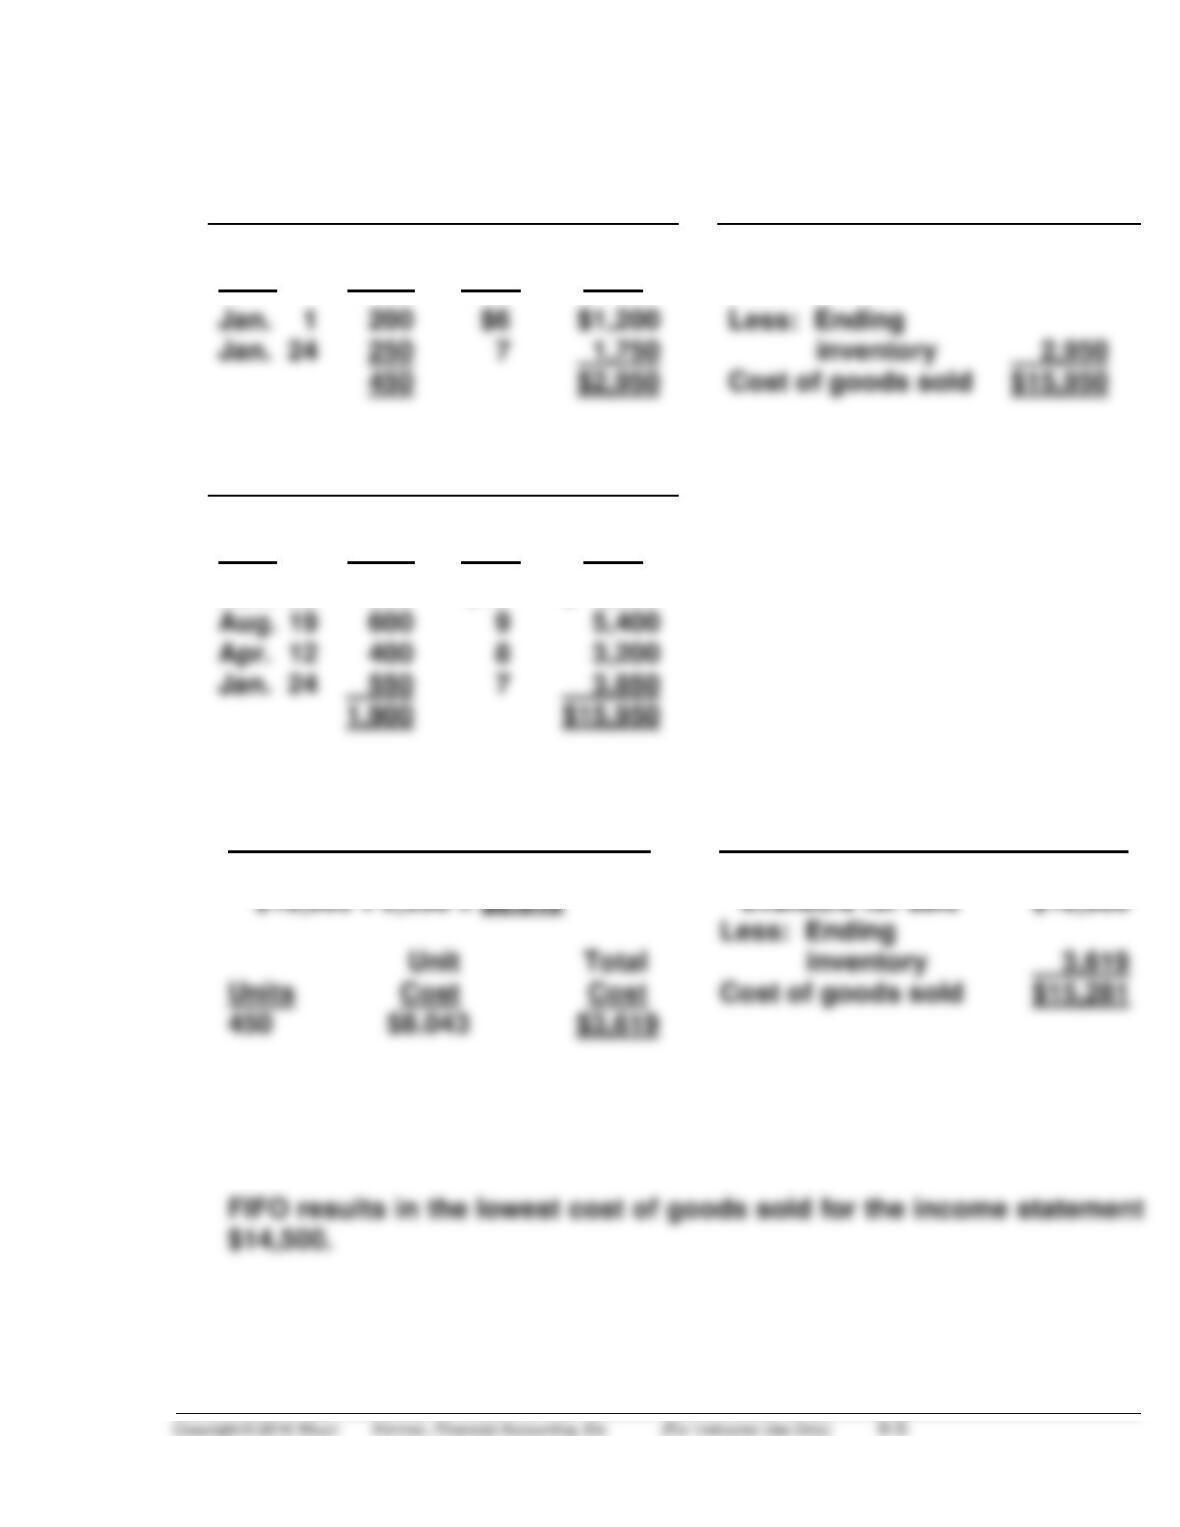
(b) FIFO
(1) Ending Inventory
(2) Cost of Goods Sold
Date
Units
Unit
Cost
Total
Cost
Cost of goods
available for sale
$18,900
Nov. 30
350
Less: Ending
Aug. 19
100
$4,400
Cost of goods sold
$14,500
Proof of Cost of Goods Sold
Date
Units
Unit
Cost
Total
Cost
Jan. 1
200
$6
$ 1,200
Jan. 24
800
Apr. 12
Aug. 19
$14,500
PROBLEM 6-3B (Continued)
LIFO
(1) Ending Inventory
(2) Cost of Goods Sold
Date
Units
Unit
Cost
Total
Cost
Cost of goods
available for sale
$18,900
Jan. 1
200
Less: Ending
Jan. 24
250
inventory
$2,950
$15,950
Proof of Cost of Goods Sold
Date
Units
Unit
Cost
Total
Cost
Nov. 30
350
$10
$ 3,500
Aug. 19
600
Apr. 12
400
Jan. 24
$15,950
AVERAGE-COST
(1) Ending Inventory (2) Cost of Goods Sold
Cost of goods
(c) Due to rising prices, LIFO results in the lowest inventory amount for
the balance sheet, $2,950.
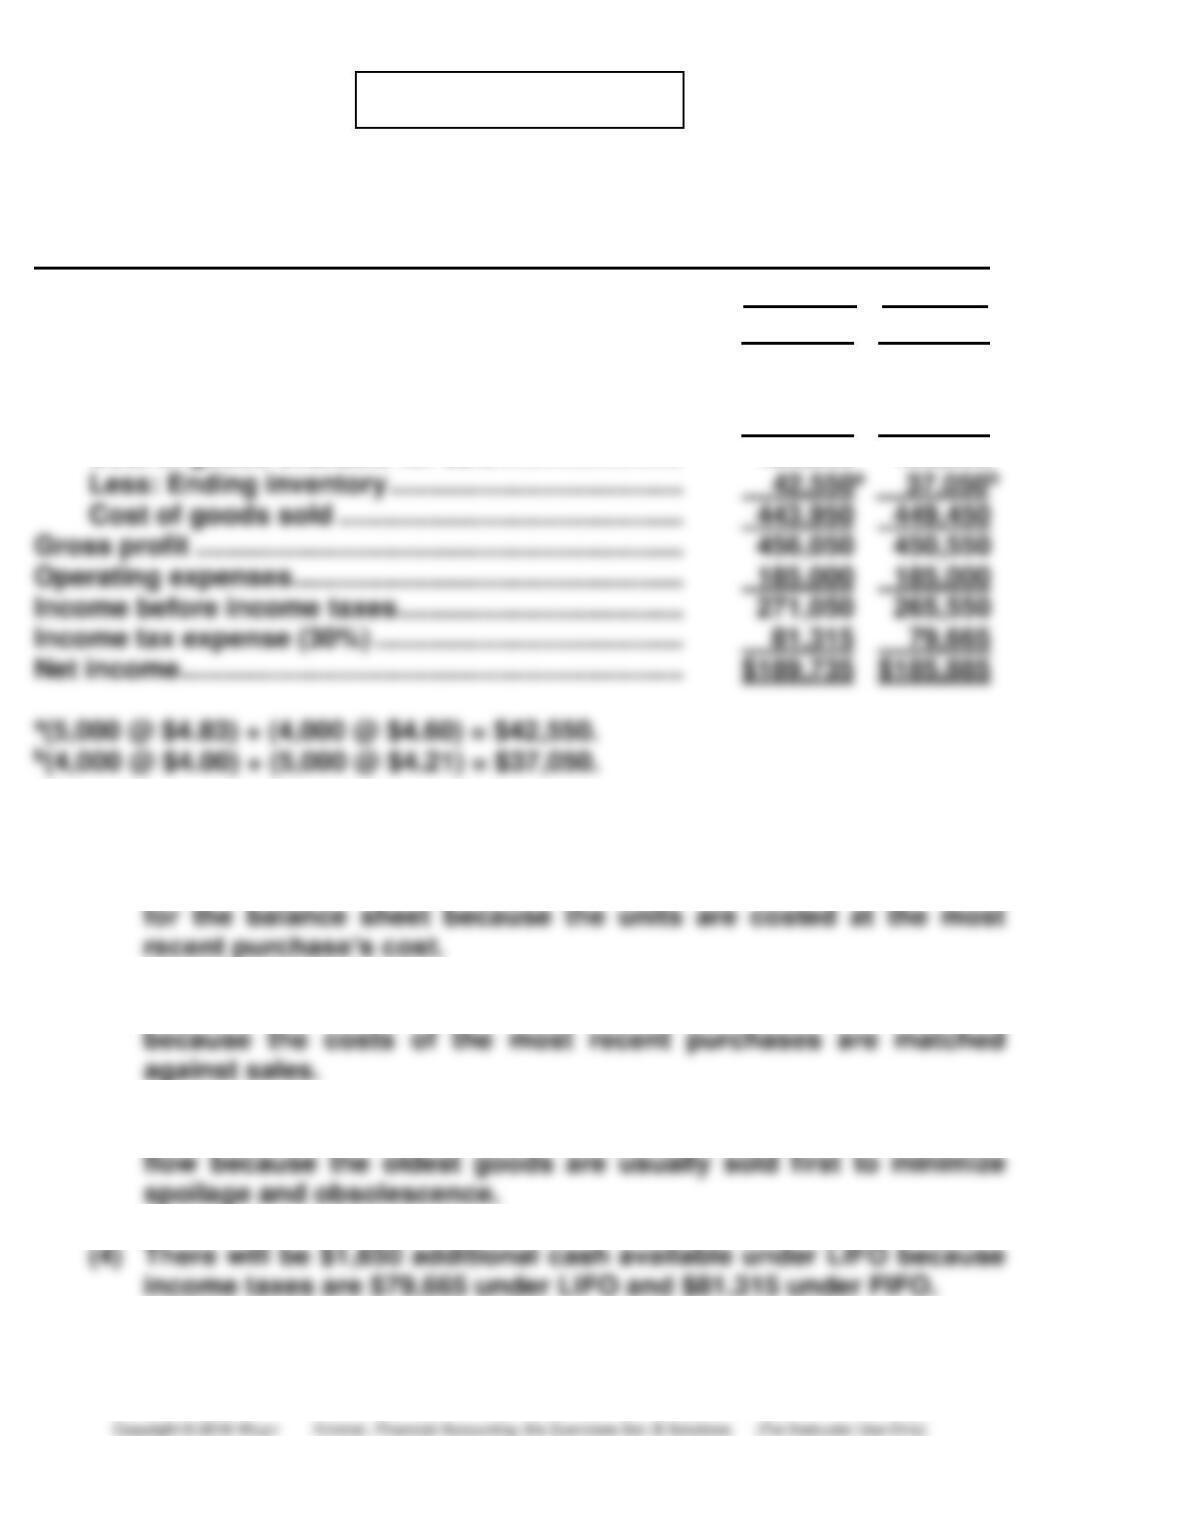
PROBLEM 6-4B
(a) WEIGEL INC.
Condensed Income Statements
For the Year Ended December 31, 2014
FIFO LIFO
Sales………………………………………………………………….. $900,000 $900,000
Cost of goods sold
Beginning inventory …………………………………….. 16,000 16,000
Cost of goods purchased …………………………….. 470,500 470,500
Cost of goods available for sale ……………………. 486,500 486,500
(b) Answers to questions:
(1) The FIFO method produces the most meaningful inventory amount
(2) The LIFO method produces the most meaningful net income
(3) The FIFO method is most likely to approximate actual physical
PROBLEM 6-4B (Continued)
(5) The illusionary gross profit is $5,500 ($456,050 – $450,550) under
FIFO. Under LIFO, Weigel Inc. has recovered the current
replacement cost of the units ($449,450), whereas under FIFO, it
has only recovered the earlier costs ($443,950). This means that
under FIFO, the company must reinvest $5,500 of the gross profit to
replace the units used.
Answer in business-letter form:
Dear Weigel Inc.
After preparing the comparative condensed income statements for
2014 under the FIFO and LIFO methods, we have found the following:
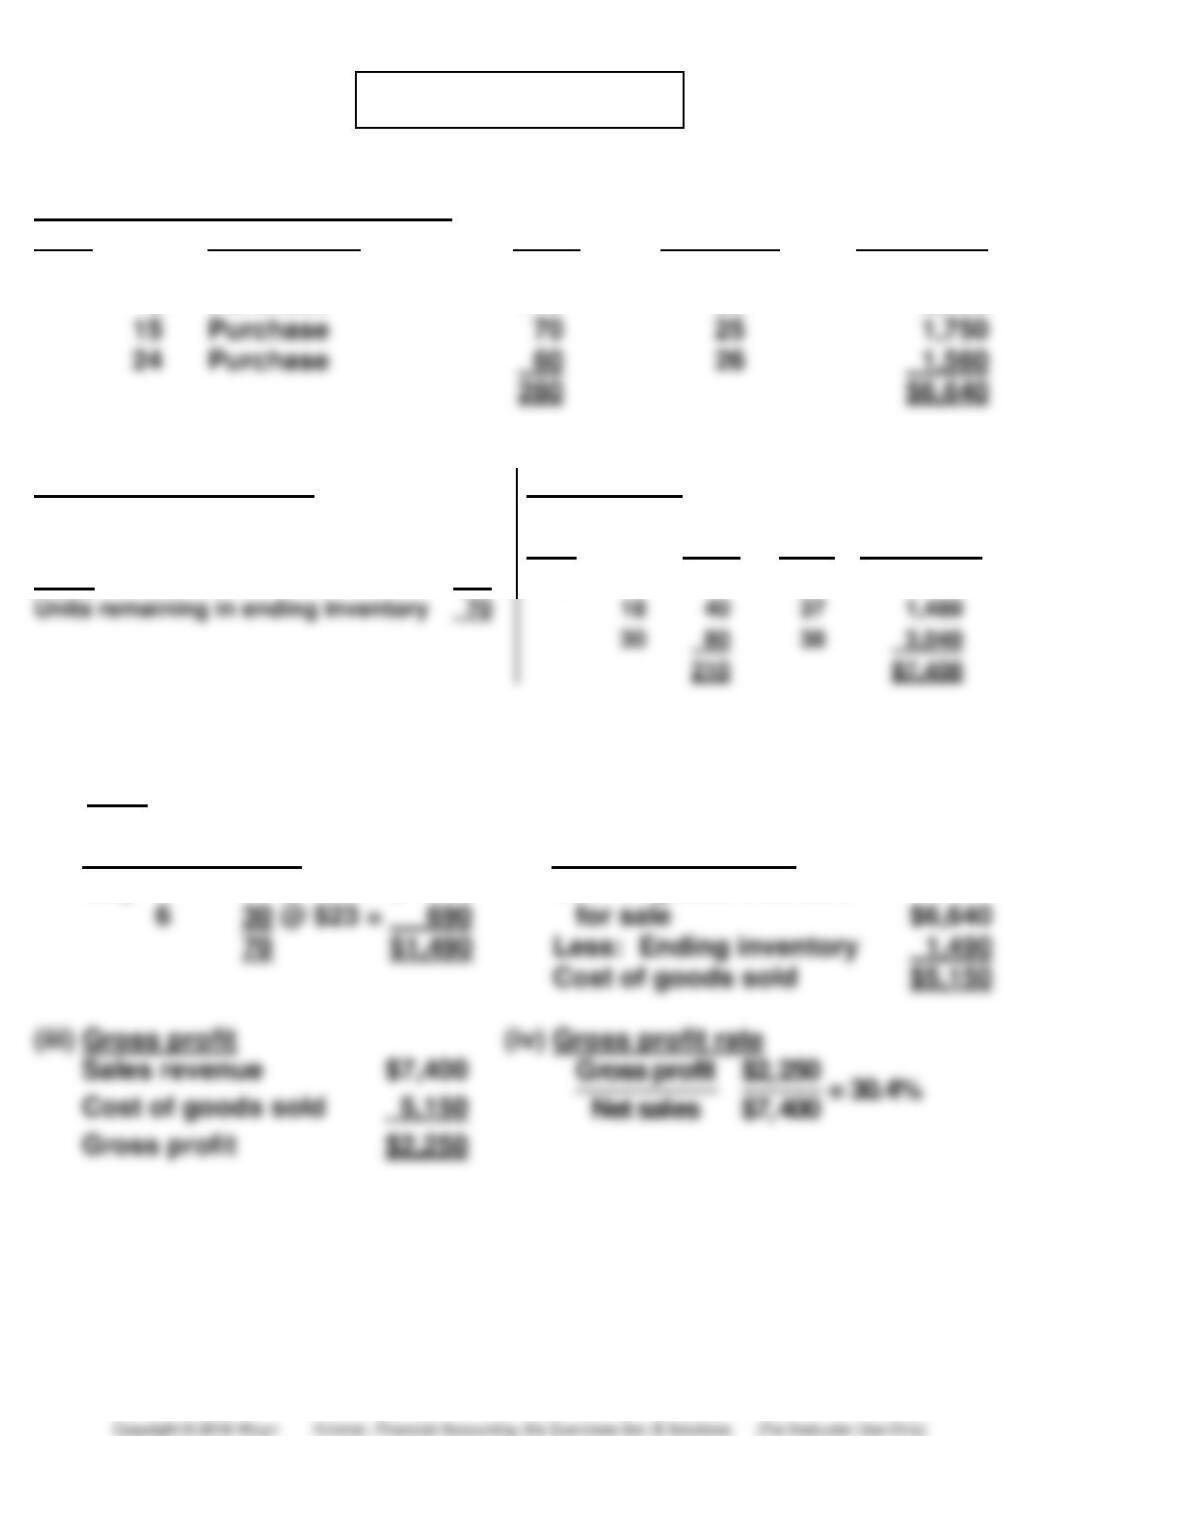
PROBLEM 6-5B
Cost of Goods Available for Sale
Date Explanation Units Unit Cost Total Cost
May 1 Beginning inventory 40 $20 $ 800
6 Purchase 110 23 2,530
Ending Inventory in Units
Sales revenue
Units available for sale
280
Date
Units
Unit
Price
Total Sales
Sales (90 + 40 + 80)
210
May 7
90
$32
$2,880
Units remaining in ending inventory
40
37
38
210
$7,400
(a)
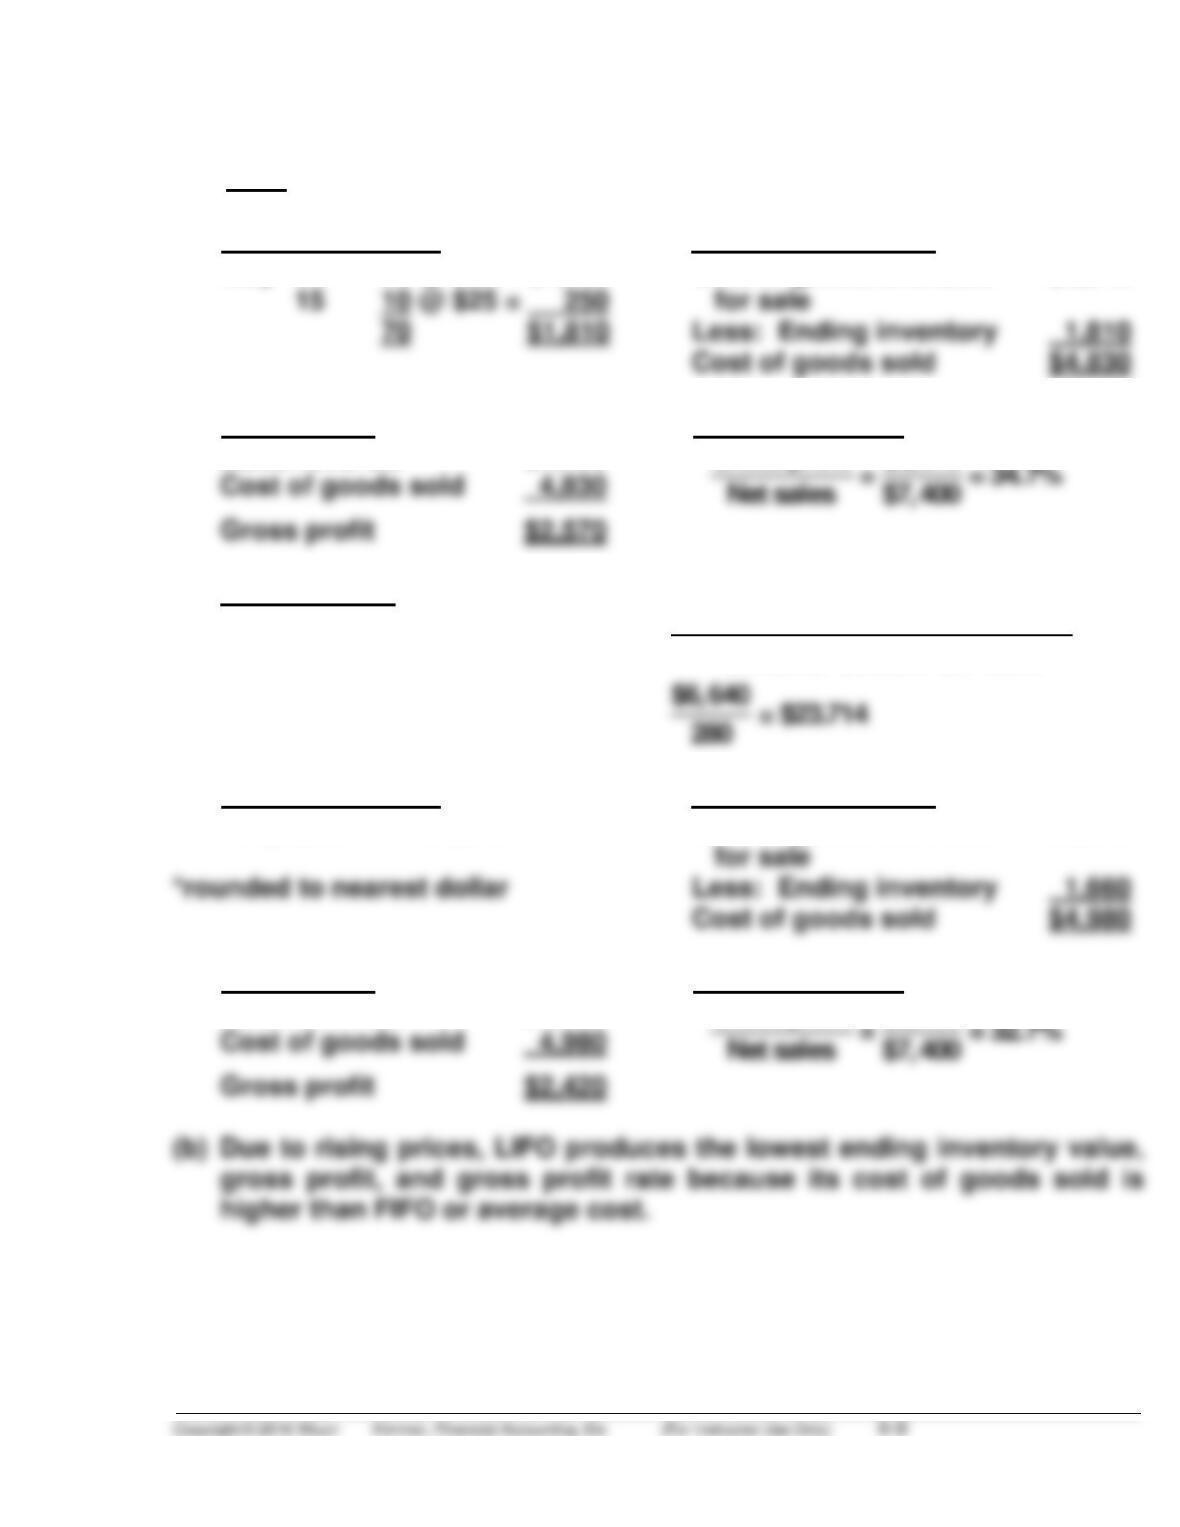
(1) LIFO
(i) Ending inventory
(ii) Cost of goods sold
6 30 @ $23 = 690
70 $1,490
Less: Ending inventory
Cost of goods sold
(iii) Gross profit
(iv) Gross profit rate
May 1 40 @ $20 = $ 800
Cost of goods available
PROBLEM 6-5B (Continued)
(2) FIFO
(i) Ending inventory
(ii) Cost of goods sold
15 10 @ $25 = 250
70 $1,810
Less: Ending inventory
Cost of goods sold
May 24 60 @ $26 = $1,560
Cost of goods available
$6,640
(iii) Gross profit
(iv) Gross profit rate
Sales revenue
$7,400
Gross profit
$2,570
Gross profit
(3) Average-Cost
Weighted-average cost per unit:
cost of goods available for sale
units available for sale
(i) Ending inventory
(ii) Cost of goods sold
70 @ $23.714 = $1,660*
*rounded to nearest dollar
Less: Ending inventory
Cost of goods sold
Cost of goods available
$6,640
(iii) Gross profit
(iv) Gross profit rate
Sales revenue
$7,400
Gross profit
$2,420
Gross profit
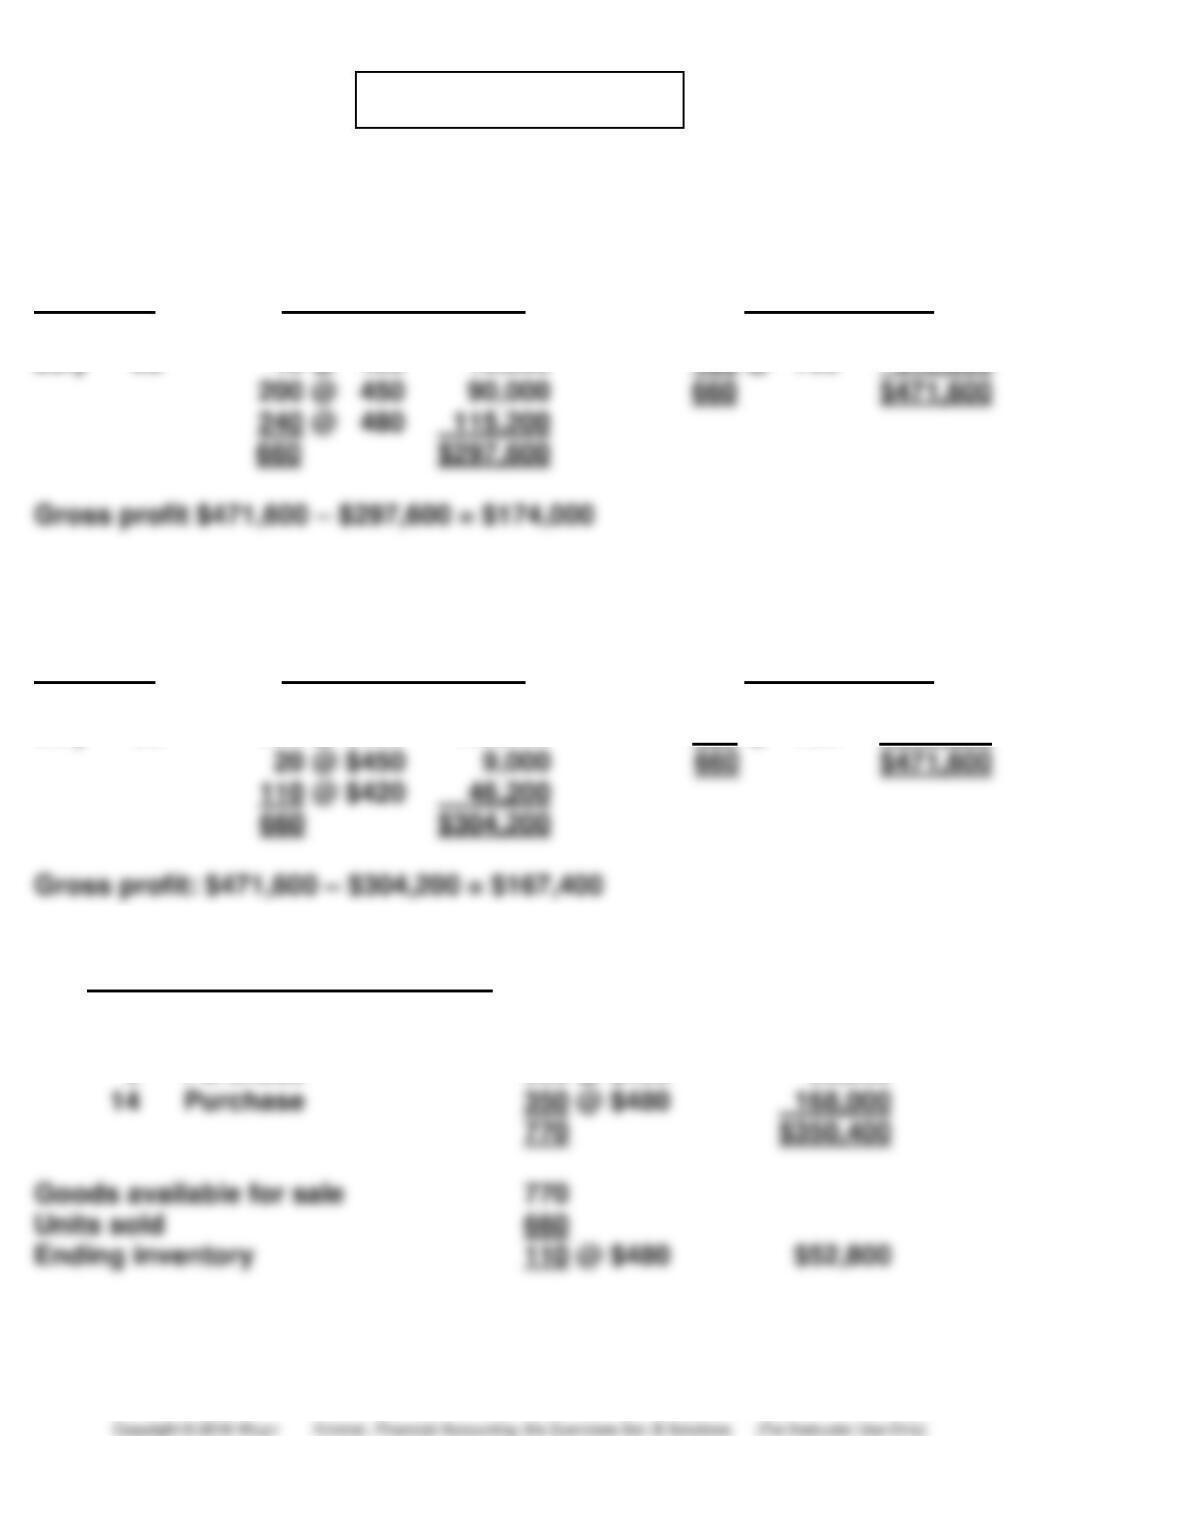
PROBLEM 6-6B
(a) (1) To maximize gross profit, Limex Watches should sell the watches
with the lowest cost.
Sale Date
Cost of goods sold
Sales Revenue
July 5
180 @ $420
$ 75,600
180 @ $700
$126,000
July 28
40 @ 420
16,800
480 @ 720
345,600
200 @ 450
90,000
660
$471,600
$297,600
(2) To minimize gross profit, Limex Watches should sell the watches
with the highest cost.
Sale Date
Cost of goods sold
Sales Revenue
July 5
180 @ $450
$ 81,000
180 @ $700
$126,000
July 28
350 @ $480
168,000
480 @ 720
345,600
20 @ $450
$471,600
$304,200
(b) FIFO
Cost of goods available for sale
July 1
Beginning inventory
220 @ $420
$ 92,400
2
Purchase
200 @ $450
90,000
Purchase
Goods available for sale
Units sold
Ending inventory
$52,800
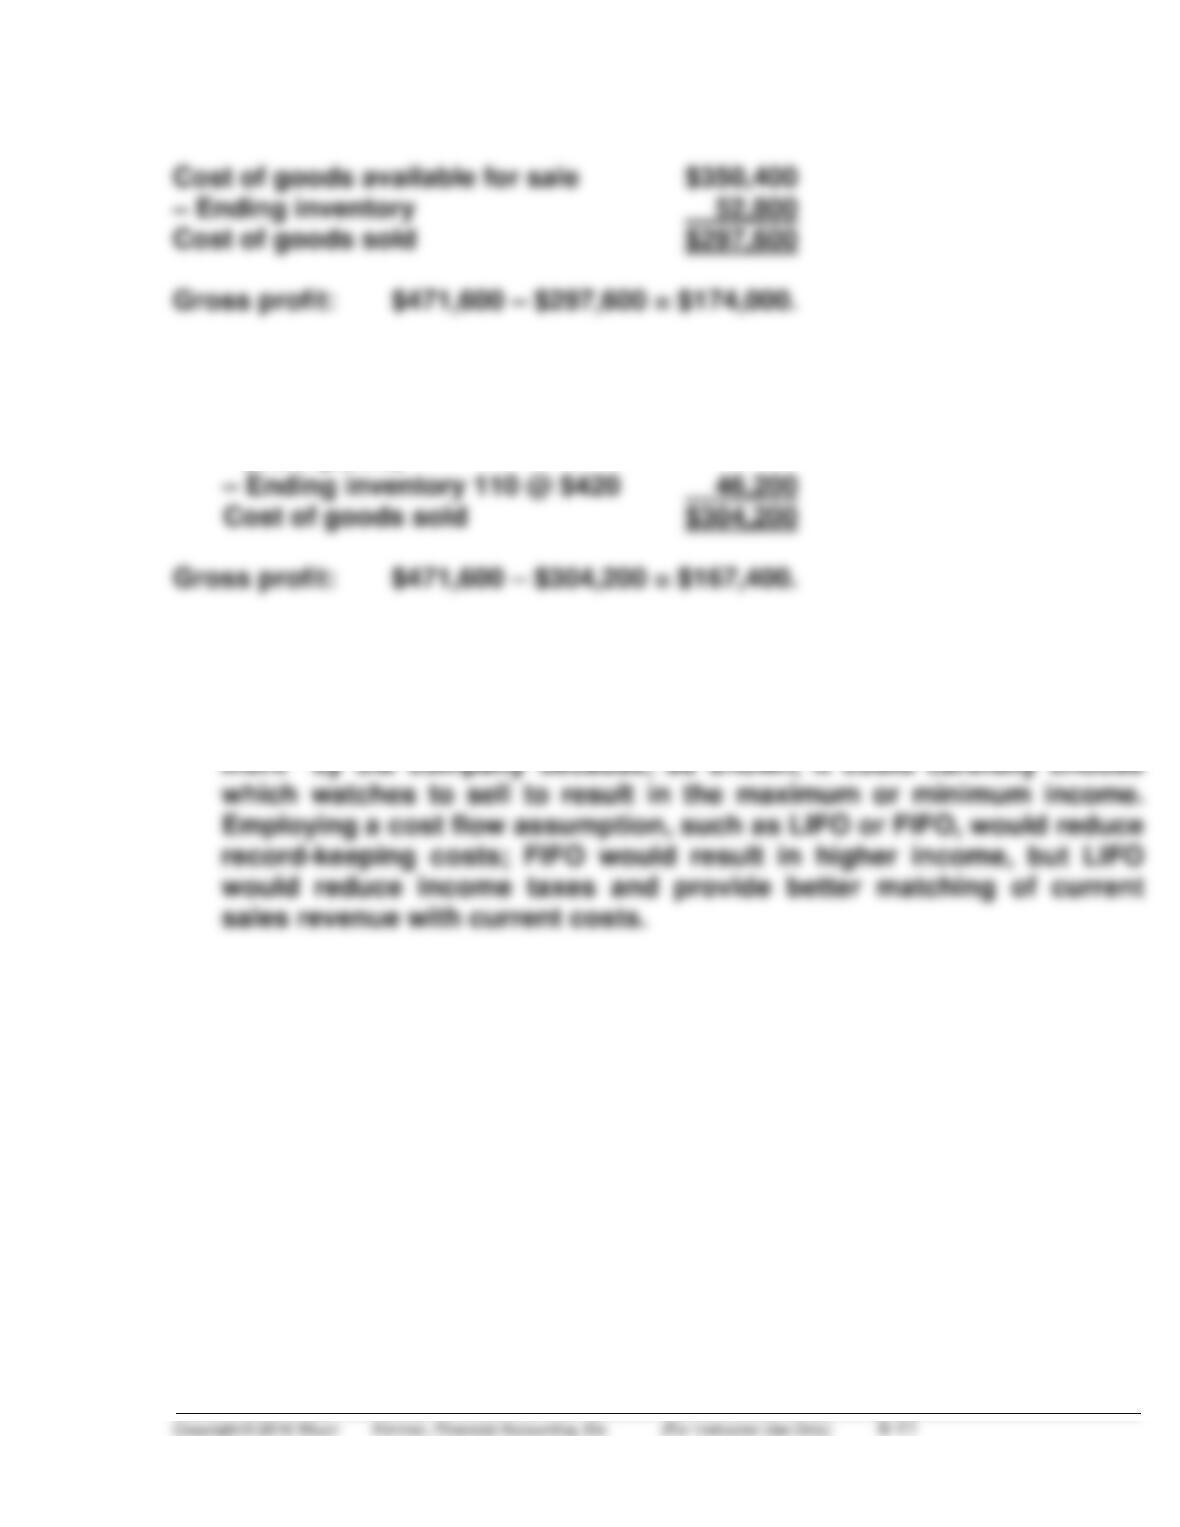
PROBLEM 6-6B (Continued)
(c) LIFO
Cost of goods available for sale $350,400
(from part b)
(d) The choice of inventory method depends on the company’s objectives.
Since the watches are marked and coded, the company could use
specific identification. This could, however, result in “earnings manage–
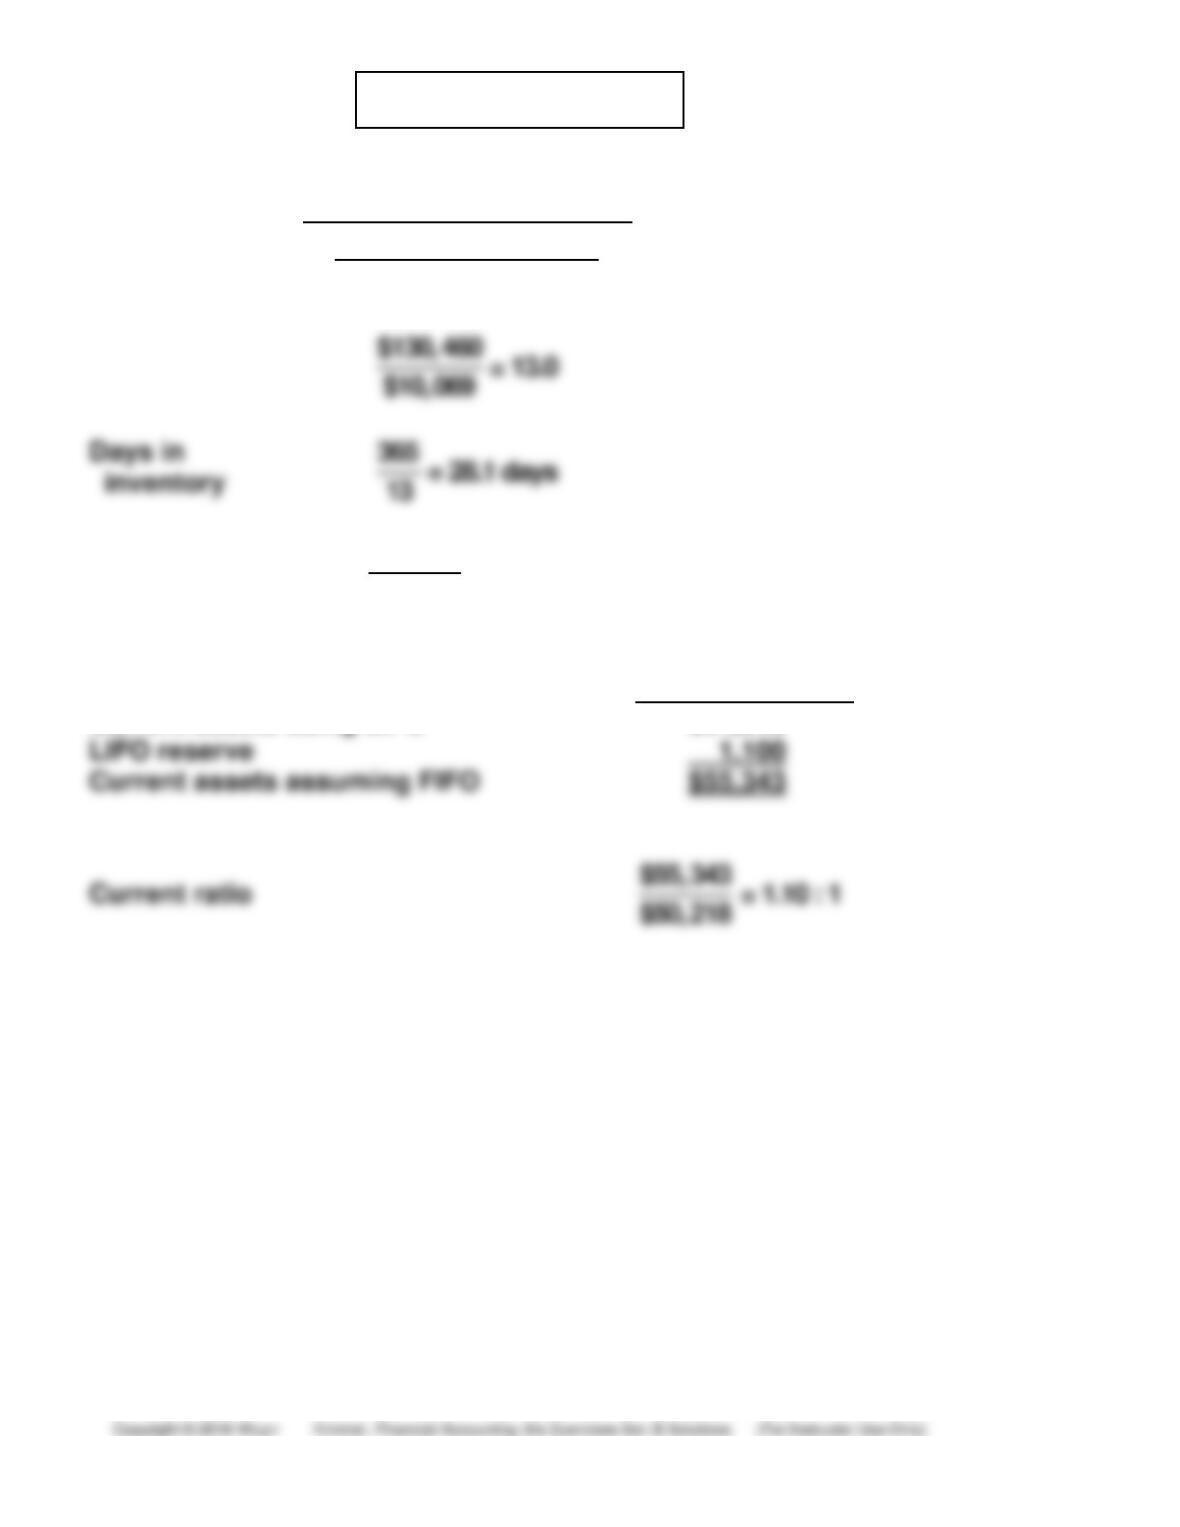
PROBLEM 6-7B
(a)
2014
Inventory
turnover
$130,460
($10,017 +$10,121)÷ 2
(b) Current
ratio
$54,243
$50,218 = 1.08:1
(c) 2014
Current assets using LIFO $54,243
(d) The current ratio was slightly higher in (c) compared to (b) because
current assets (i.e., inventory) are larger in (c).
*PROBLEM 6-8B
(a)
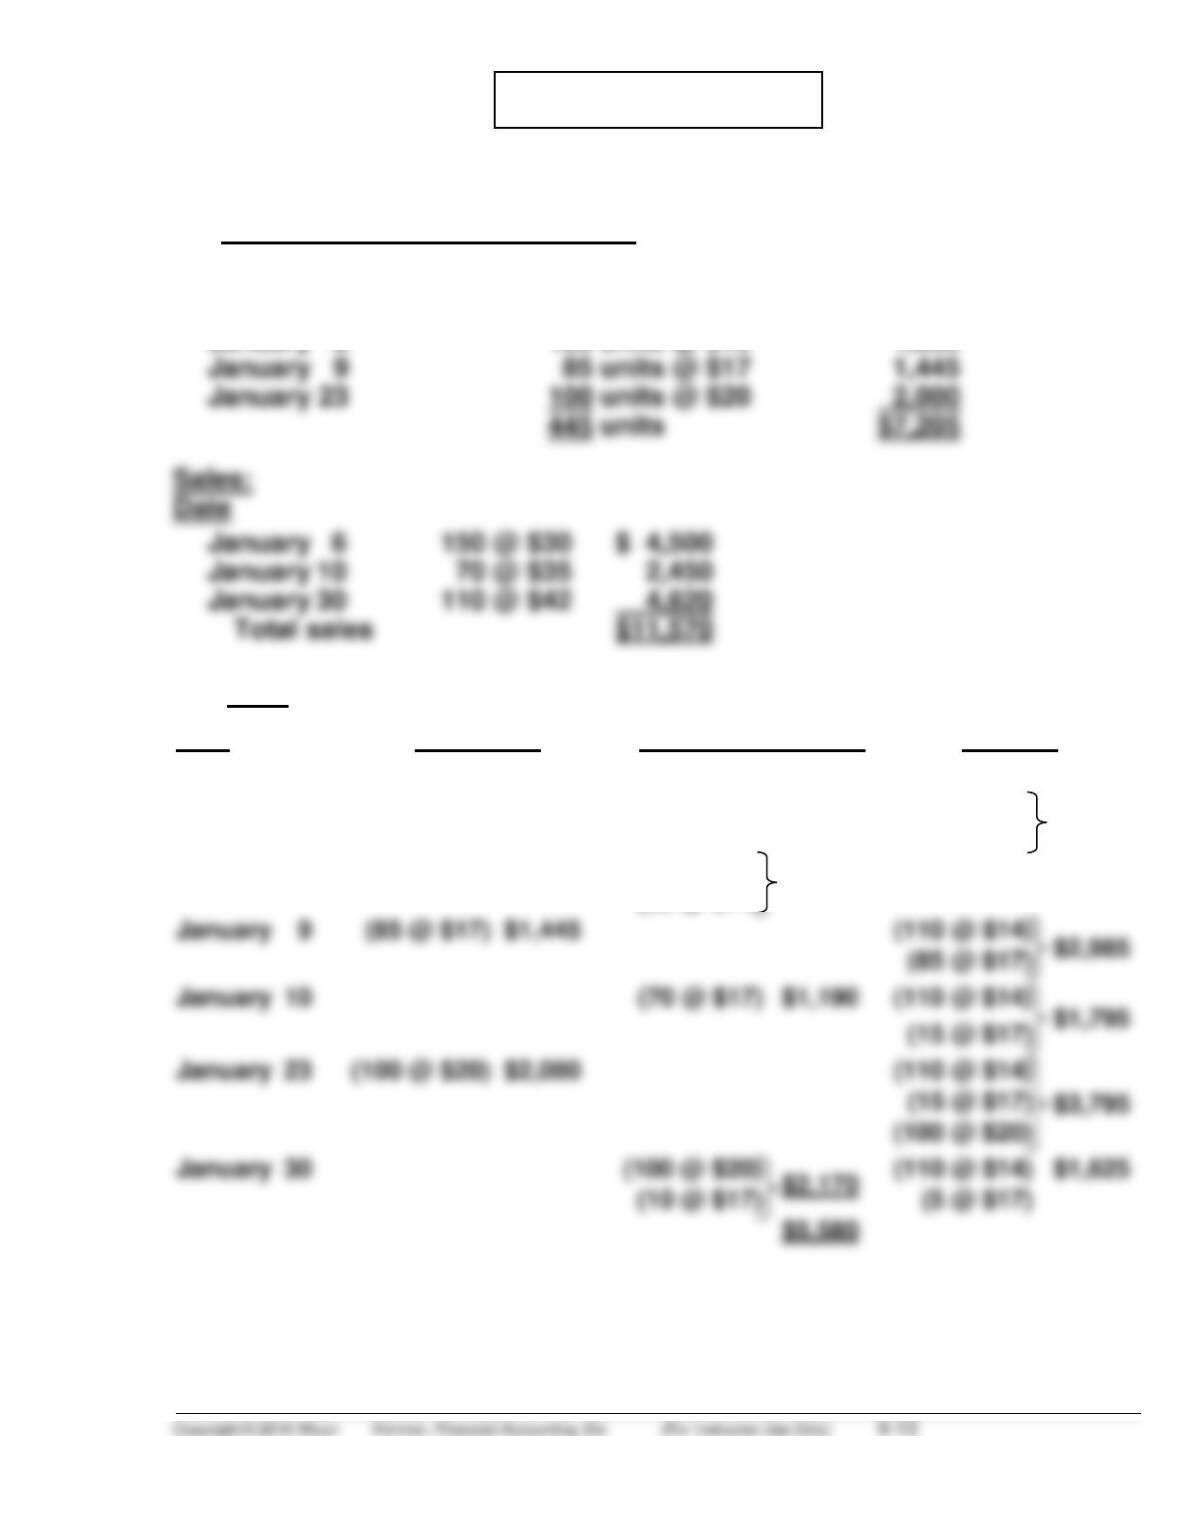
Cost of goods available for sale:
Inventory
Purchases
140 units @ $14
$1,960
January 2
120 units @ $15
1,800
January 9
1,445
Total sales
(1) LIFO
Date
Purchases
Cost of goods sold
Balance
January 1
(140 @ $14)
$1,960
January 2
(120 @ $15) $1,800
(140 @ $14)
(120 @ $15)
$3,760
January 6
(120 @ $15)
(30 @ $14)
$2,220
(110 @ $14)
$1,540
January 30
(100 @ $20)
(10 @ $17)
$2,170
*PROBLEM 6-8B (Continued)
(i) Cost of goods sold: $7,205 – $1,625 = $5,580. (ii) Ending inventory = $1,625.
(iii) Gross profit = $11,570 – $5,580 = $5,990.
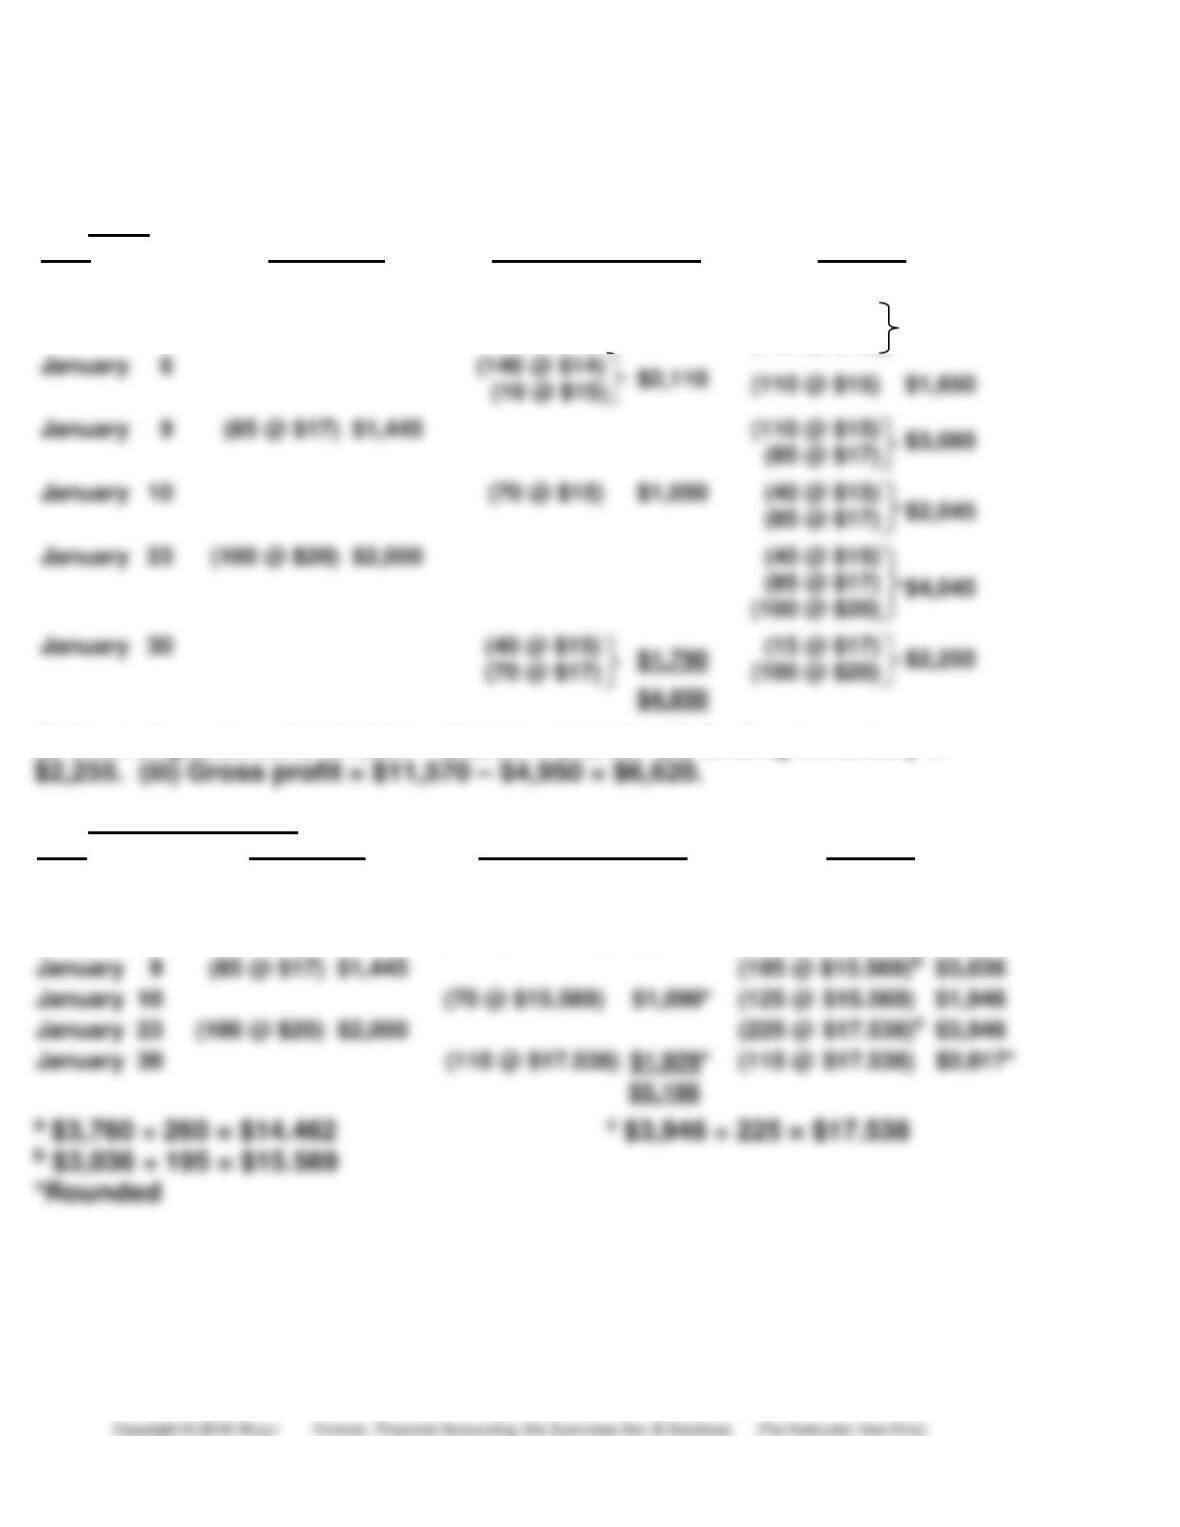
(2) FIFO
Date
Purchases
Cost of goods sold
Balance
January 1
(140 @ $14)
$1,960
January 2
(120 @ $15) $1,800
(140 @ $14)
(120 @ $15)
$3,760
January 6
(140 @ $14)
(85 @ $17)
January 30
(i) Cost of goods sold: $7,205 – $2,255 = $4,950. (ii) Ending inventory =
(3) Moving-Average:
Date
Purchases
Cost of goods sold
Balance
January 1
(140 @ $14)
$1,960
January 2
(120 @ $15) $1,800
(260 @ $14.462)a
$3,760
January 6
(150 @ $14.462) $2,169*
(110 @ $14.462)
$1,591
January 9
January 10
(70 @ $15.569) $1,090*
January 23
(100 @ $20) $2,000
January 30
(110 @ $17.538) $1,929*
*PROBLEM 6-8B (Continued)
(i) Cost of goods sold: $7,205 – $2,017 = $5,188. (ii) Ending inventory = $2,017.
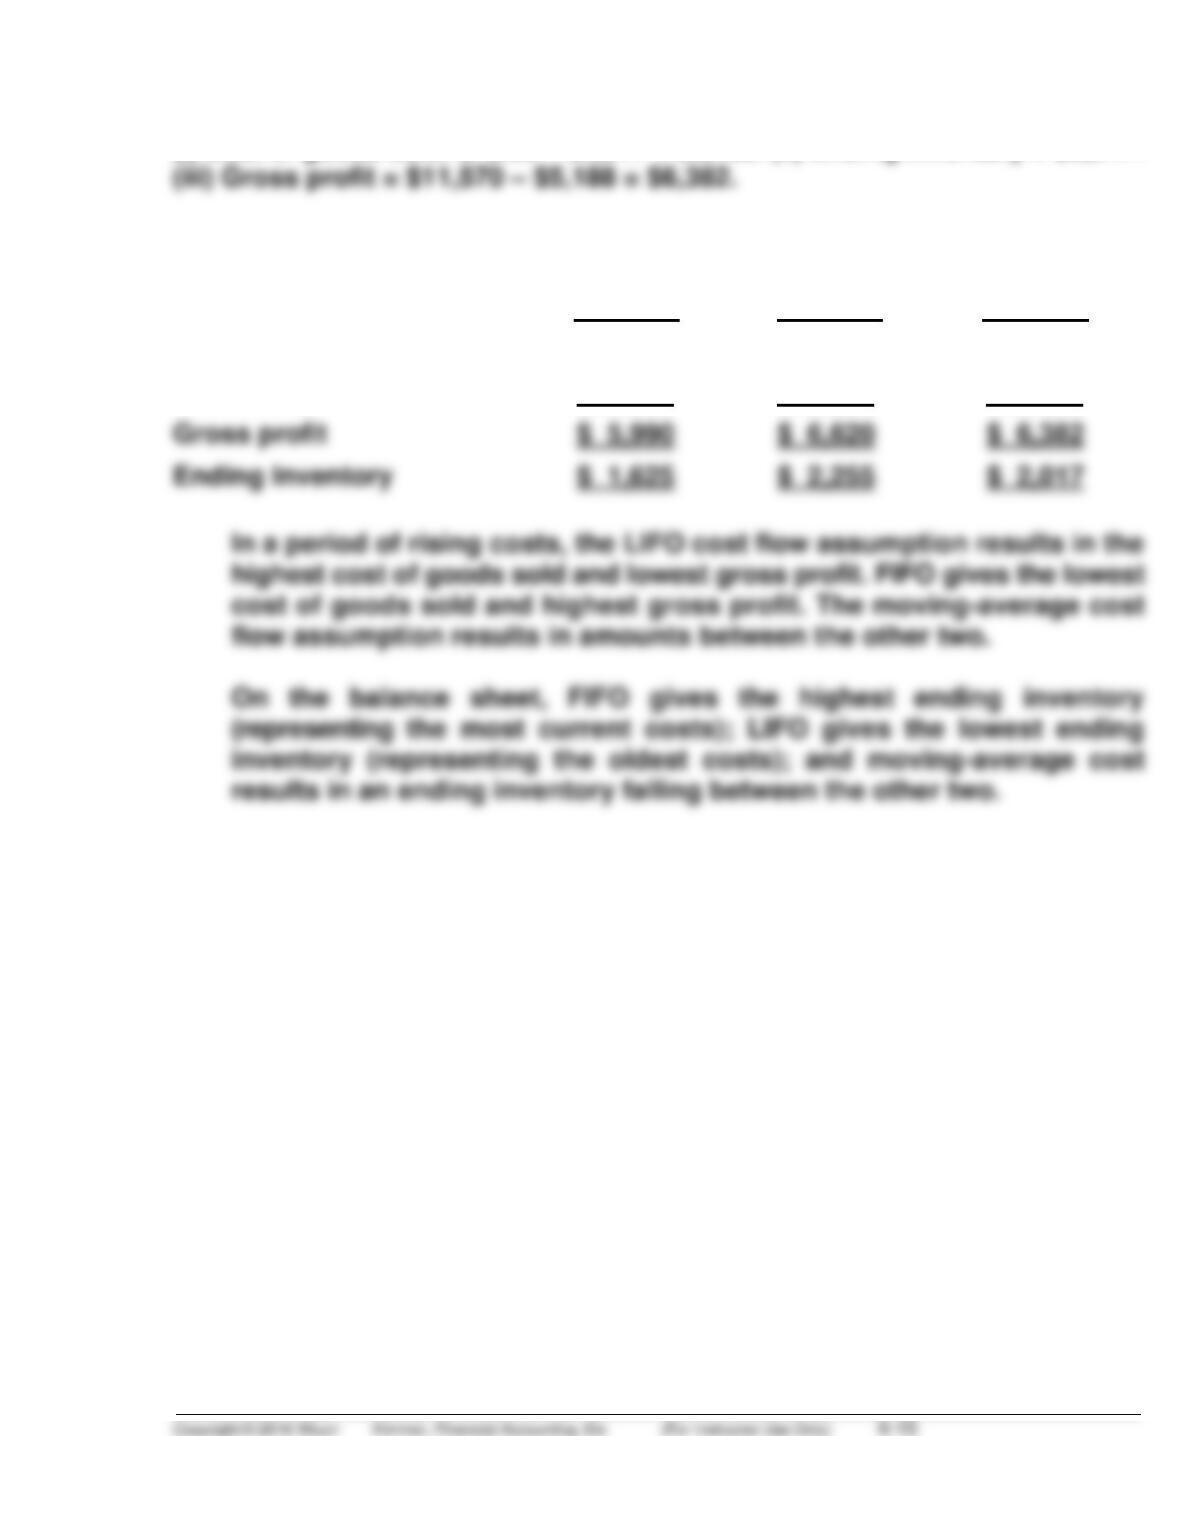
(b)
Gross profit:
LIFO
FIFO
Moving-
Average
Sales
$11,570
$11,570
$11,570
– Cost of goods sold
5,580
4,950
5,188
$ 5,990
Ending Inventory
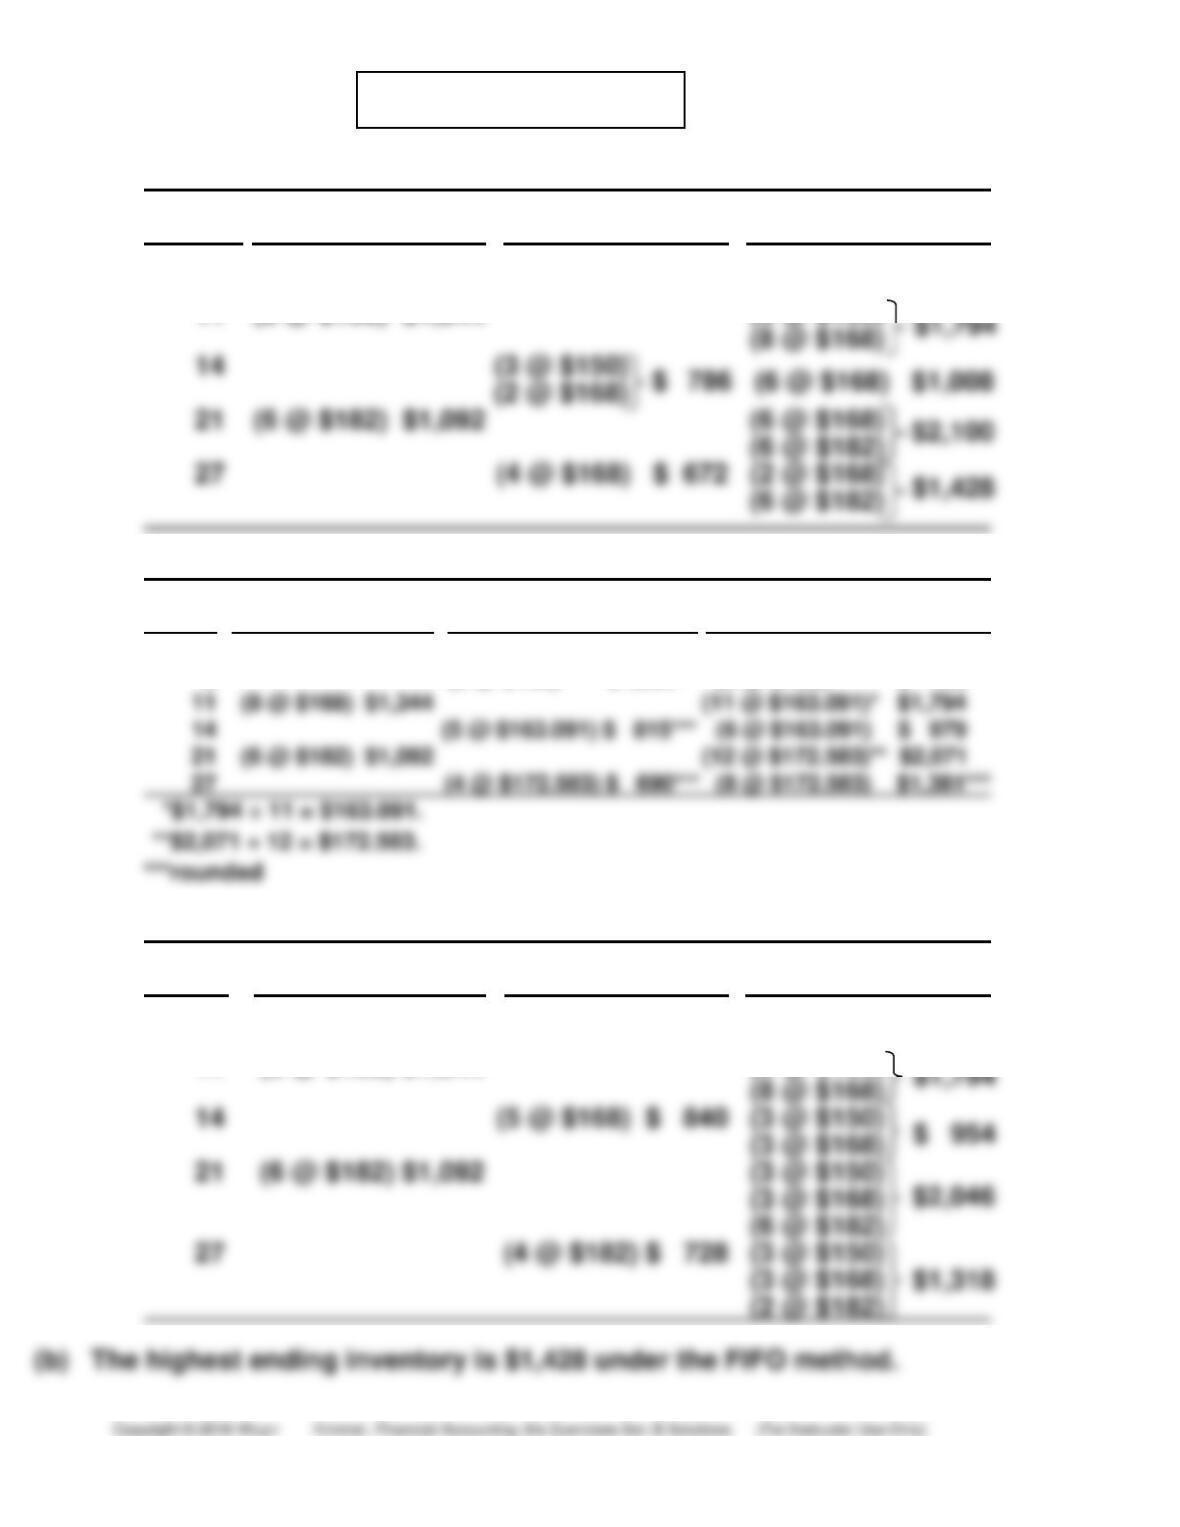
*PROBLEM 6-9B
(a) (1) FIFO
Cost of
Date Purchases Goods Sold Balance
Feb. 1 (12 @ $150) $1,800 (12 @ $150) $1,800
6 (9 @ $150) $1,350 (3 @ $150) $ 450
11 (8 @ $168) $1,344 (3 @ $150)
(2) MOVING-AVERAGE
Cost of
Date Purchases Goods Sold Balance
Feb. 1 (12 @ $150) $1,800 (12 @ $150) $1,800
6 (9 @ $150) $1,350 (3 @ $150) $ 450
(3) LIFO
Cost of
Date Purchases Goods Sold Balance
Feb. 1 (12 @ $150) $1,800 (12 @ $150) $1,800
6 (9 @ $150) $1,350 (3 @ $150) $ 450
11 (8 @ $168) $1,344 (3 @ $150)