Chapter 6
Creating and Using Reports
Notes to the Instructor
In this chapter students will create reports based on tables and queries stored in the database. Upon
completion of this chapter, students should have sufficient database skills to create fundamental
accounting systems. Completed files have been included on the Companion CD to aid students in their
learning process. These files are referred to in the process of completing the textbook exercises. The
exercises presented in this chapter convey the chapter’s content via a hands-on approach.
Before beginning, copy the Chapter 6 database Ch06.accdb from the book’s companion Web site
to your hard disk (I assume you can do this part on your own computer). The instructor’s version,
Ch06Inst.accdb, has answers on it you may not want to distribute to students.
Lecture Outline
This chapter assumes you have some hands-on experience using Access and are familiar with relational
databases. Reviewing Chapter 6 in the text will help you use this outline to lead discussions of chapter
materials and concepts.
Objectives
➢ This chapter extends the knowledge gained in previous chapters with information about
Microsoft Access reports.
➢ In Chapter 6 the students will learn how to:
➢ Build a report quickly from a selected table.
➢ Modify a report in layout view.
➢ Create a report using the Report Wizard.
We continue using the Coffee Merchant invoice system as the backdrop application in this chapter.
Creating a Basic Report Quickly
• The simplest way to create a form is to select the table and then click Report in the Create
tab.
• Reports have these views: Report, Print Preview, Layout and Design.
Exercise 6.1: Creating a One-Table Report. This exercise shows the students how to create a
Exercise 6.2 simply closes the report. Students have done this repeatedly and it is simple. Exercise 6.3 is a
6-2 CHAPTER 6 • CREATING AND USING REPORTS
Modifying a Report in Layout View
• Layout view is new, so emphasize that when to use it: when you want to adjust controls and
Adding a Logo and a Title
• The report logo button allows you to pick a graphic for the report header logo.
• The logo appears in the Report Header.
• Click the Logo command to insert a custom logo.
Exercise 6.4: Adding a Logo and Modifying a Report’s Title in Layout View. This exercise
shows the students how to add a logo to a report. Click Logo in the Controls group, locate a
suitable logo graphic through navigating, and click OK. Click Title in the Controls group to add a
title by typing the new title.
Deleting, Moving, and Resizing Columns
• Delete, move, or resize report columns in Layout view—it is the easiest way.
• Click and drag a column to move it; select a column and press Delete to delete it.
Exercise 6.5: Deleting Unneeded Columns. This exercise shows the students how to delete a
column in Layout view. Select a column label and press Delete.
Exercise 6.7: Resizing Columns. This exercise shows the students how to resize columns by
double-clicking the right edge when a column is selected to create an optimal width column.
Modifying Column Titles
Exercise 6.8: Changing Column Titles. This exercise shows the students how to change the
label at the top of the column by double-clicking it and then typing the change.
• A Try it exercise illustrates how to navigate through a report’s pages while in Print Preview.
These are simple, familiar page navigation buttons found throughout Access.
Sorting and Grouping
• Sorting and grouping are very important concepts. Be sure to take enough time explaining
and illustrating this concept. Make sure students understand that report rows appear in no
particular order in the report. Basing a report on a query that sorts rows will not yield sorted
Exercise 6.9: Adding a Group to the Customer Report. This exercise shows the students
how to form groups in the customer report. Open the Group, Sort, and Total pane, click Add a
Exercise 6.10: Sorting within a Group. This exercise shows the students how to sort
individual rows within each group. Click Add a sort within the group and select the sorting field
(CustCity in this example).
Formatting Reports
• AutoFormat layouts are available to apply several predefined formatting features at once to
your report.
• Layouts are located in the Format contextual tab.
Applying Conditional Formatting to a Control
Previewing a Report
• Always preview a report before printing it by selecting Print Preview.
• Print Preview renders the report as it will appear on the printer.
• Report view has the advantage that you can filter the data before printing it.
Exercise 6.11: Filtering Rows in Report View. This exercise shows students how to filter a
report in Report view based on the value in one or more of its columns. Display the report in
Report view, right-click a city name in the City column, and click any of the available text filters.
Building a Report Using the Report Wizard
• Access’ report wizard is the fastest and easiest way to create a report.
• You first select a table or tables upon which to build a report.
• The wizard asks you to choose grouping fields if any and fields you want tallied.
Exercise 6.12: Creating a Report with the Report Wizard. This exercise shows students how
to create a report with the Report Wizard. Students use the tblEmployee and
tblEmployeeDivision tables as the basis of the report and include in the report just a few of the
available fields. Report rows are grouped by Title, sorted by employees’ last and then first
names, and the average commission rate is tallied. In other words, students use most of the
features available in the Report Wizard.
A Few Guidelines for Good Report Design
• Take a few moments to go over the guidelines for good report design.
• These suggestions are not comprehensive, but they are intended to get students to think
before they create.
• Guidelines include:
6-4 CHAPTER 6 • CREATING AND USING REPORTS
o Keep the format simple: do not over embellish with too many fonts and special
effects.
Creating a Report from Scratch in Design View
• When your report needs require a high degree of customization, create it from scratch.
• Creating a report from scratch gives you more control than using a Wizard or the Create
Report command.
Creating a Blank Report and Adding Fields
• This section and related ones that follow show students how to create a report beginning with
a blank slate.
• Exercise 6.13 starts the process.
Exercise 6.13: Opening a New, Blank Report in Design View and Adding Fields. This
exercise launches the process of creating a custom report from scratch. Click Create and the
Selecting Fields from Related Tables
• You can add fields from related tables to a report. They are related fields if they are in a table
that has a connection in the Relationships window.
Exercise 6.14: Adding a Related Field from another Table to a Report. This exercise
illustrates how to add a field from another, related table. Expand the fields in the Field List panel
and double-click the desired field, CountryName, from the tblCountry table.
Creating a Tabular Control Layout
Exercise 6.15: Creating a Tabular Control Layout from Independent Controls. This
exercise illustrates how to create a group or tabular control layout so the controls—both bound
and unbound—act as one. This causes the unbound controls to appear in the Page Header and
the bound controls to appear in the Detail report section.
Grouping and Sorting
• Grouping and sorting in a report make it easier to understand—as long as the groups make
Exercise 6.16: Grouping and Sorting Report Lines. This exercise illustrates how to add a
Exercise 6.17: Moving a Field to the Group Header. This exercise illustrates how to move a
field from the Detail section to the Group header section. First, you must remove the field from
the control layout. Next, cut the field from the Detail section, click the Group header section
CHAPTER 6 • CREATING AND USING REPORTS 6-5
Adding Calculations to a Report
• Adding calculations to a report is a very important concept.
• By using the Group, Sort, and Total pane to add an aggregate expression to the group footer.
• Exercise 6.18 walks students through adding aggregate information to the group footer.
Exercise 6.18: Adding Calculations to the Group Footer. This exercise illustrates how to add
calculated fields to the group footer. Students add a control to compute the average units on
Exercise 6.19: Adding a Section Page Break. This exercise illustrates how to add a page
break so that each new section appears at the top of a new page. Students set the Force New
Page property in the Property sheet. By selecting “Before Section” (see Figure 6.18), each new
section starts on a new page.
• A Try it exercise asks students to preview the report to see that each section starts on a new
page.
Modifying Report Properties
• Every report you create in Access has hundreds of properties you can set.
Exercise 6.20: Modifying Report Properties. This exercise illustrates how to modify the
default view of the entire report. Setting this property causes the report to appear in the selected
Applying Conditional Formatting to a Control
Exercise 6.21: Applying Conditional Formatting to a Report Control. This exercise shows
how to apply conditional formatting to the UnitsOnHand field. In this exercise, students set the
conditional format so that UnitsOnHand values less than 123 appear bold and underlined.
Otherwise, values above the limit appear with no special formatting.
Fine-Tuning the Report
• Other report improvements could be made to the report.
6-6 CHAPTER 6 • CREATING AND USING REPORTS
Creating a Multitable Report Based on a Query
• This is a particularly instructive section because it is a complete guide to creating an
attractive invoice report.
• The report is based on a query.
• The query is required because an extended price field is needed to complete an invoice line.
• A report line cannot compute a value from fields in the same detail line, but a query can.
• Each of the sections in the part of the book improve the invoice report more and more.
• Students begin by creating a query to supply all the required data.
Examining a Query Supplying Report Data
• Sometimes you must use a query to supply data to a report.
• A report requiring a calculation within the detail section is an example of a report whose data
must come from a query, not a table.
• Students are reminded how to reveal hidden objects by executing a Try it exercise.
Creating the First Draft of an Invoice Report
• Exercise 6.22 leads students through creating the first, rough draft of the invoice report.
Exercise 6.22: Creating a Report Based on a Query. This exercise shows how to create the
first draft of the invoice report using a pre-existing query that delivers all the required fields to
Manually Adding Fields
Exercise 6.23: Adding Fields to the InvoiceID Header. This exercise shows how to select
Exercise 6.24: Adding Fields to the Detail Band. This exercise shows how to select fields
from the query and add them to the Detail section. Drag the selected fields and drop them in the
Detail section. Next, create a Tabular control layout group to quickly organize the fields into a
CHAPTER 6 • CREATING AND USING REPORTS 6-7
Rearranging and Reorganizing Fields
Exercise 6.25: Arranging Fields in the Detail Band and Minimizing Its Vertical Height. This
Exercise 6.26: Deleting Labels Associated with Bound Controls. This exercise shows
Exercise 6.27: Rearranging Other InvoiceID Controls. This exercise shows students how to
rearrange bound controls so they are moved to positions that resemble those in Figure 6.21.
Saving a Report Under a New Name
• Saving a report under a new name allows you to save the latest changes and simultaneously
Exercise 6.28: Saving a Report with a New Name. This exercise shows students how to save
an existing object under a new name. Click the Office button, point to Save As, click Save
Object As, type the new name, and click OK.
Adding Calculated Controls
• A definition of a calculated control with an example appears in this section.
Exercise 6.29: Creating the Subtotal Calculated Control. This exercise shows students how
to add a text box control to a report and then write an expression that computes and displays a
Exercise 6.30: Making Small Changes to a Calculated Control and Its Label. This exercise
shows students how to adjust the length and location of the newly added subtotal calculated
6-8 CHAPTER 6 • CREATING AND USING REPORTS
Adding Labels and Graphics
Exercise 6.31: Adding Labels to the Page Header. This exercise shows students how to add
Exercise 6.32: Adding Lines and a Rectangle. This exercise shows students how to add lines
to the report. Click the Line button in the Controls group and hold down the Shift key as you
drag the right resizing handle to the right. Holding down Shift guarantees that the line is
Publishing a Report
• Popular ways to publish a completed report are in PDF, Word, or XPS format.
• The best choice is PDF because most people have the free Acrobat reader that renders PDF
files.
Printing a Paper Report
• This section lists the steps required to print a report.
• Click the File Tab, click the Print tab, and click the Print button.
• Be very careful: reports can be long, so preview a report before printing some or all of it to
check its length.
Exporting a Report to Word
• Exporting a report to RTF, or Rich Text Format is one option.
• Anyone with Word of any version can open an RTF report in Word and subsequently print it.
Exercise 6.33: Producing an RTF Format Report. This exercise shows students how to
export a file to RTF format. Click the External Data tab, , click More, click Word, browse to the
Producing a PDF- or XPS-Format Report
• Creating a PDF or XPS format exported report is easy.
• We suggest you emphasize PDF is a better, more universal export format choice.
• Exercise 6.34 illustrates how to create a PDF format report from an Access report.
Exercise 6.34: Producing a PDF-Format Report. This exercise shows students how to export
a file to PDF format. Click the Office button, point to Save As, click PDF or XPS, navigate to an
appropriate folder, type a report name, select PDF in the Save as type list box, click the
CHAPTER 6 • CREATING AND USING REPORTS 6-9
Publishing to E-mail
Creating Mailing Labels
• The most specialized Access report type is the mailing labels report.
• A wizard guides readers through the process, as does exercise 6.35.
Exercise 6.35: Producing Mailing Labels. This exercise shows students how to create mailing
labels using the mailing label wizard. Click Create and then click Labels. Make choices in the
Exercise 6.36: Filtering Labels with a Query Behind the Report. This exercise shows
students how to create a filter behind the report to produce mailing labels for a subset of all
6-10 CHAPTER 6 • CREATING AND USING REPORTS
Answers to Review Exercises
Multiple-Choice Questions
Discussion Questions
The solutions presented here come from the textbook discussion. Your students may include other insight
that is relevant but not presented in your solutions.
1. It makes sense to create a query and use it as the basis of a report whenever you want to use
the query to include an expression derived from fields of the same table. Report Wizards do a
2. Layout view allows you to modify the size of bound controls as you view the data within
them. Resizing controls in Design view is hazardous because the bound control sizes are, at
3. The Report Wizard allows you to select tables and individual fields within the tables to
include in the report. If you choose multiple, related tables, the wizard offers to form groups
4. Conditional formatting is dynamic formatting. You can define several formats for a bound
control. The format selected depends on the actual value of each instance of that control. For
CHAPTER 6 • CREATING AND USING REPORTS 6-11
Practice Exercises
A note to the instructor: We have created, in the Navigation Pane of the instructor’s version of the
database, a custom category called Review Questions: Answers. That custom category contains the
custom groups: In-Chapter Exercises, Practice Exercises, Problems, and Student Database. In-Chapter
Exercises contains the solutions to all of the numbered exercises within the chapter. You will find all the
solutions to the practice exercises in the second group, all answers to the problems in the third group, and
the original student database in the last of these four groups. If the custom category Review Questions:
Answers does not appear in the Navigation Pane, click the category name at the top of the Navigation
Pane and click the Review Questions: Answers category name.
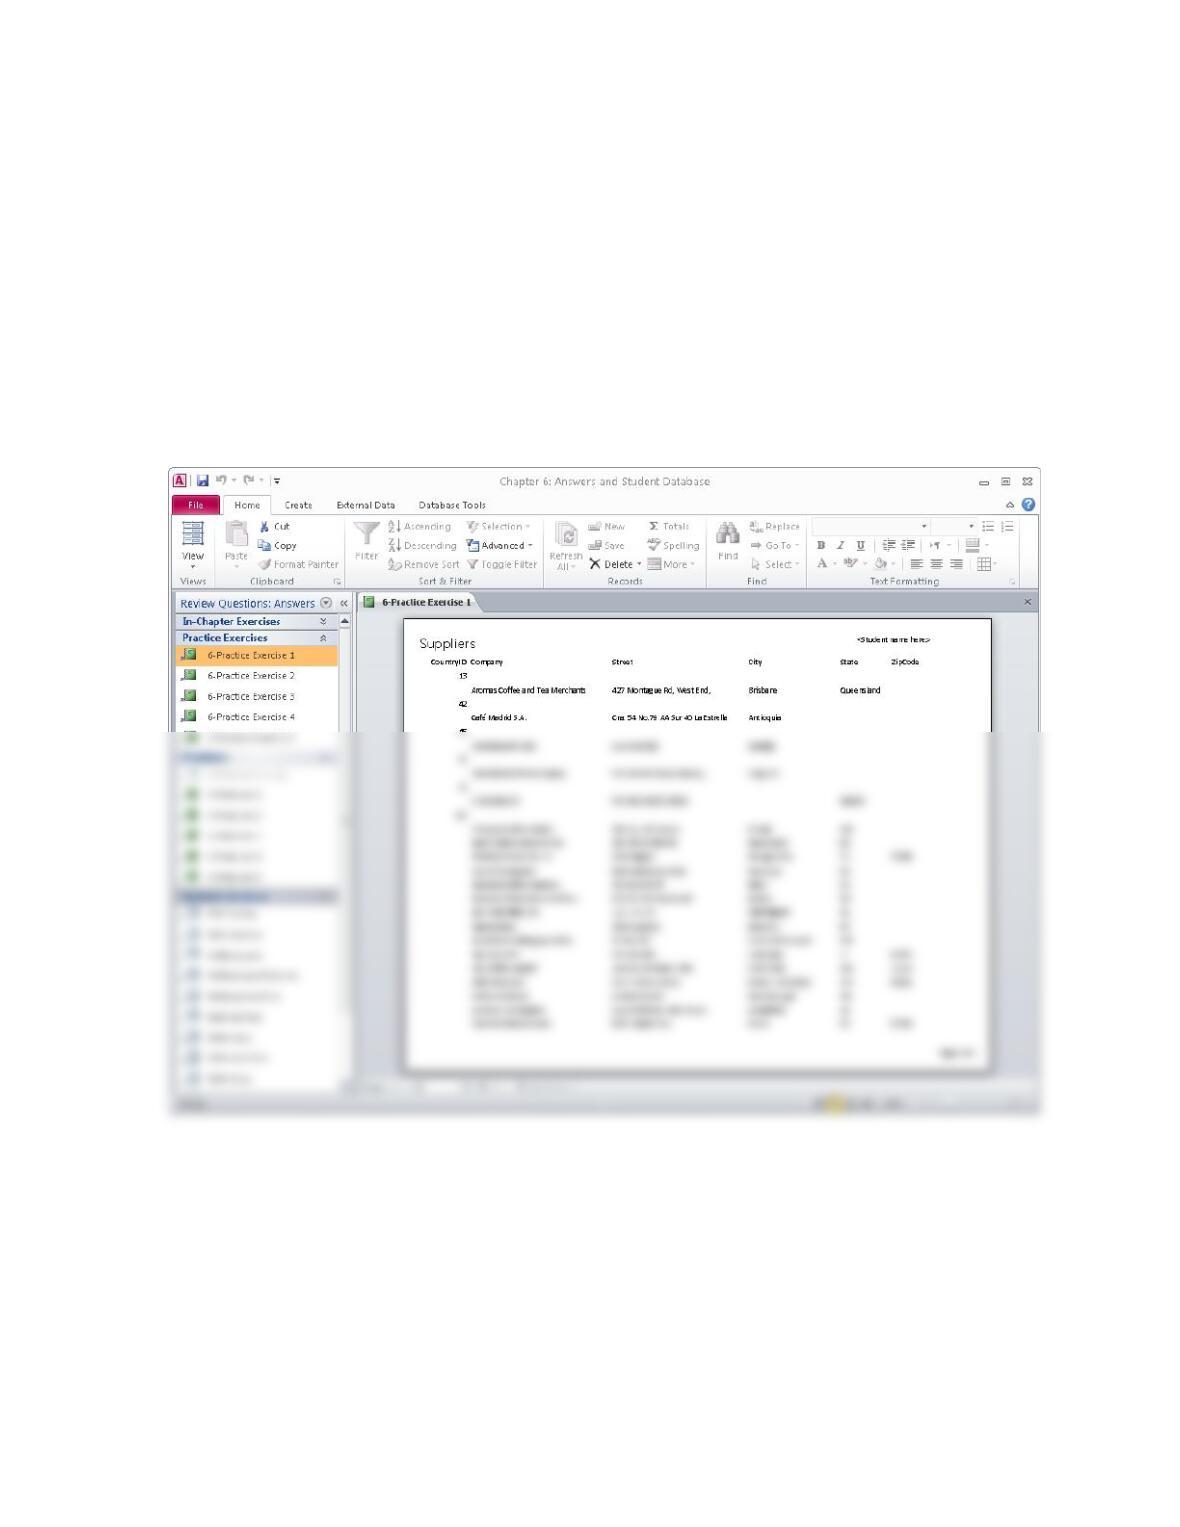
1. The solution is saved in the instructor’s solution database as 6-Practice Exercise 1 in the
custom Navigation Pane group Practice Exercises. The figure that follows shows the Print
Preview view of the solution.
6-12 CHAPTER 6 • CREATING AND USING REPORTS
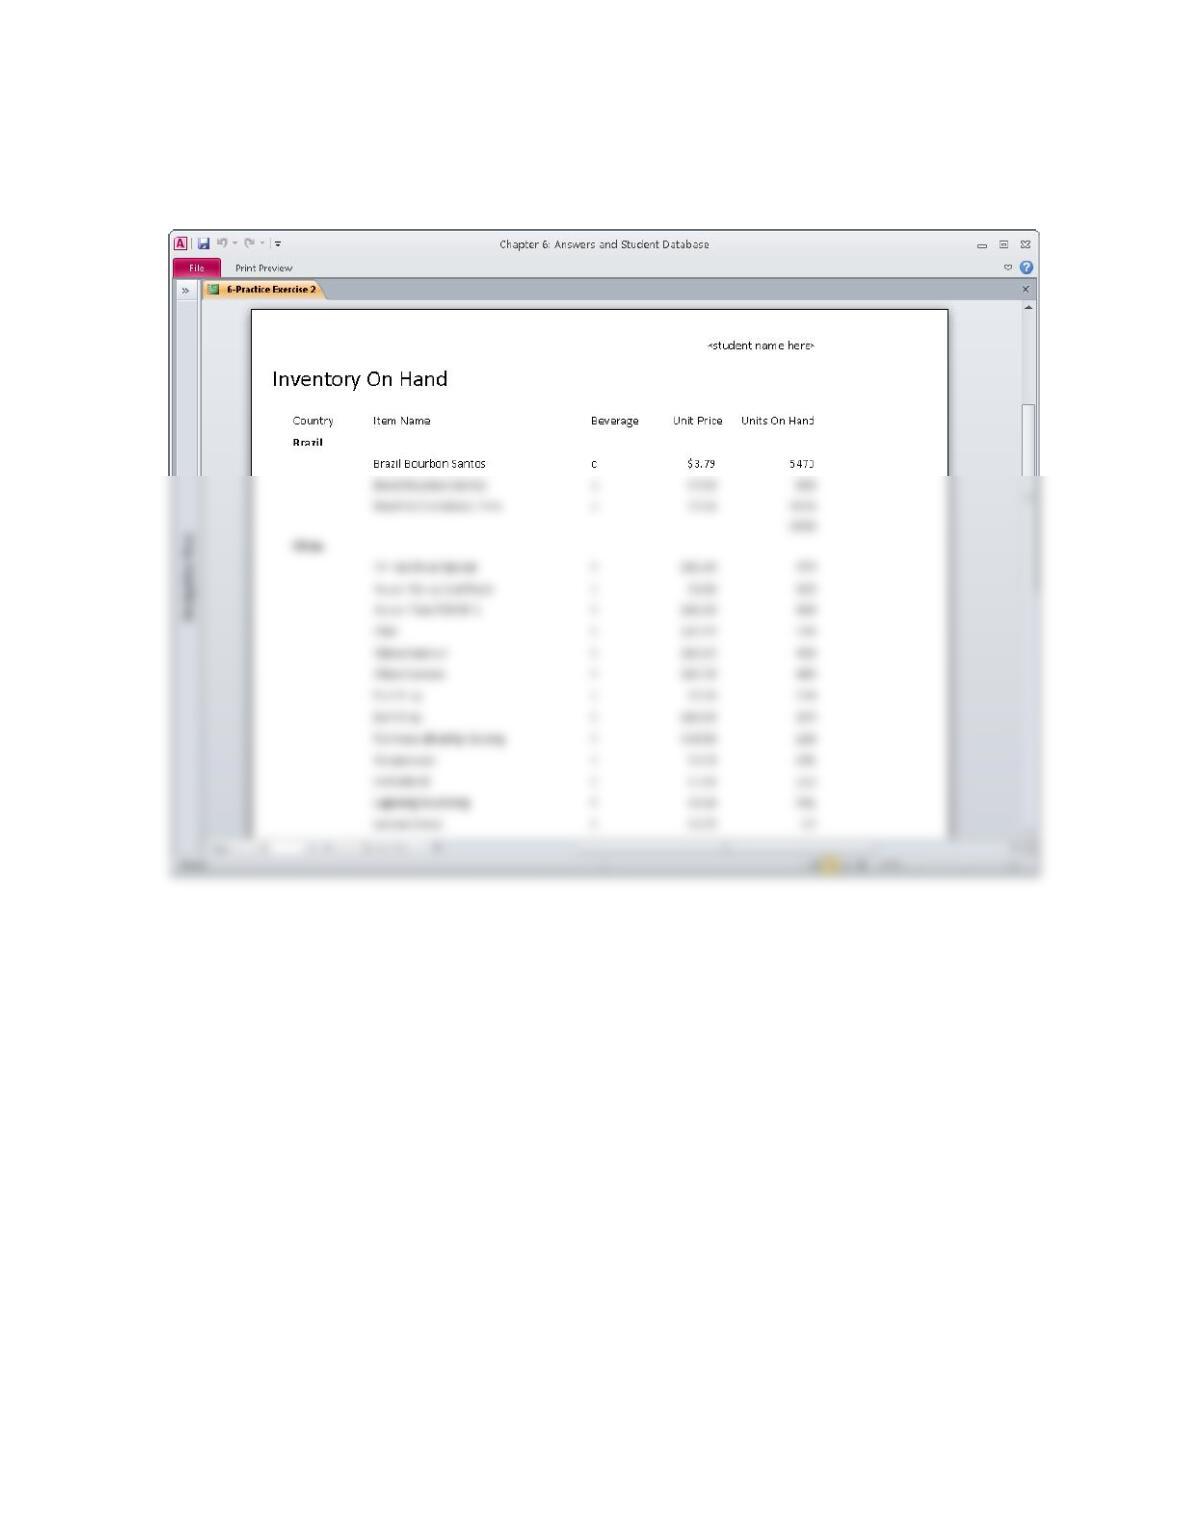
2. The solution is saved in the instructor’s solution database as 6-Practice Exercise 2 in the
custom Navigation Pane group Practice Exercises. The figure that follows shows the Print
Preview view of the solution.
CHAPTER 6 • CREATING AND USING REPORTS 6-13
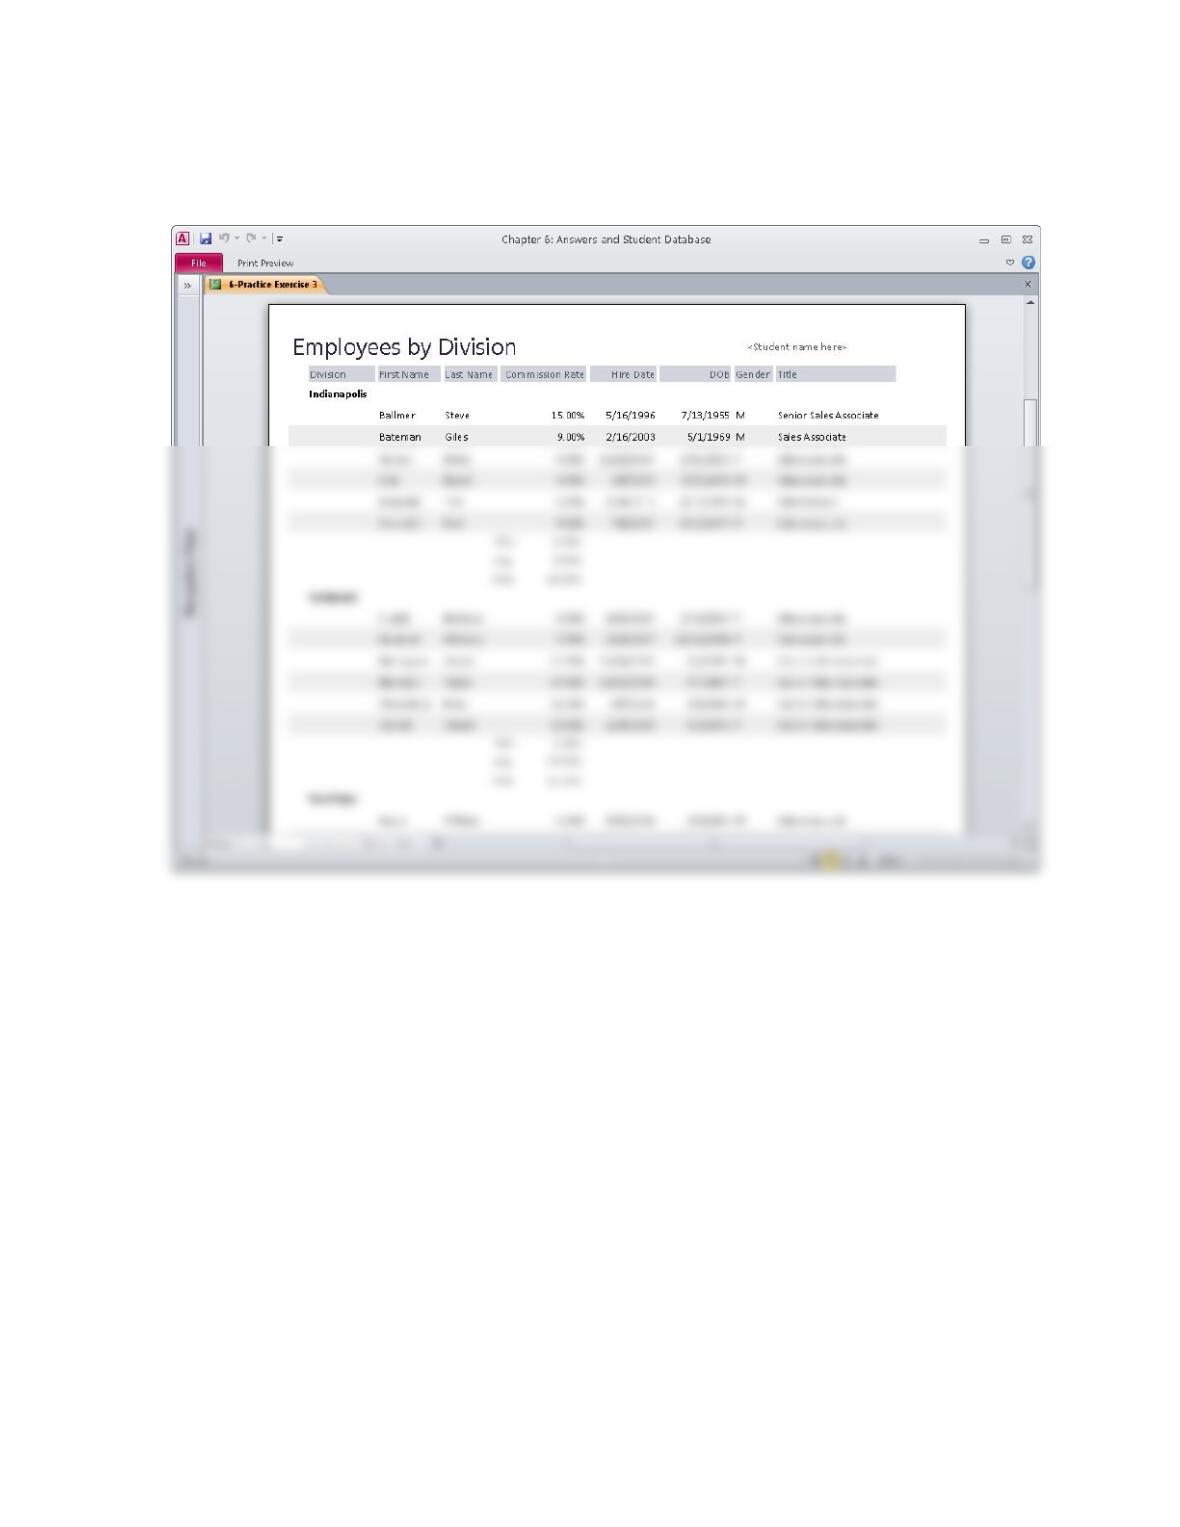
3. The solution is saved in the instructor’s solution database as 6-Practice Exercise 3 in the
custom Navigation Pane group Practice Exercises. The figure that follows shows the Print
Preview view of the solution.
6-14 CHAPTER 6 • CREATING AND USING REPORTS
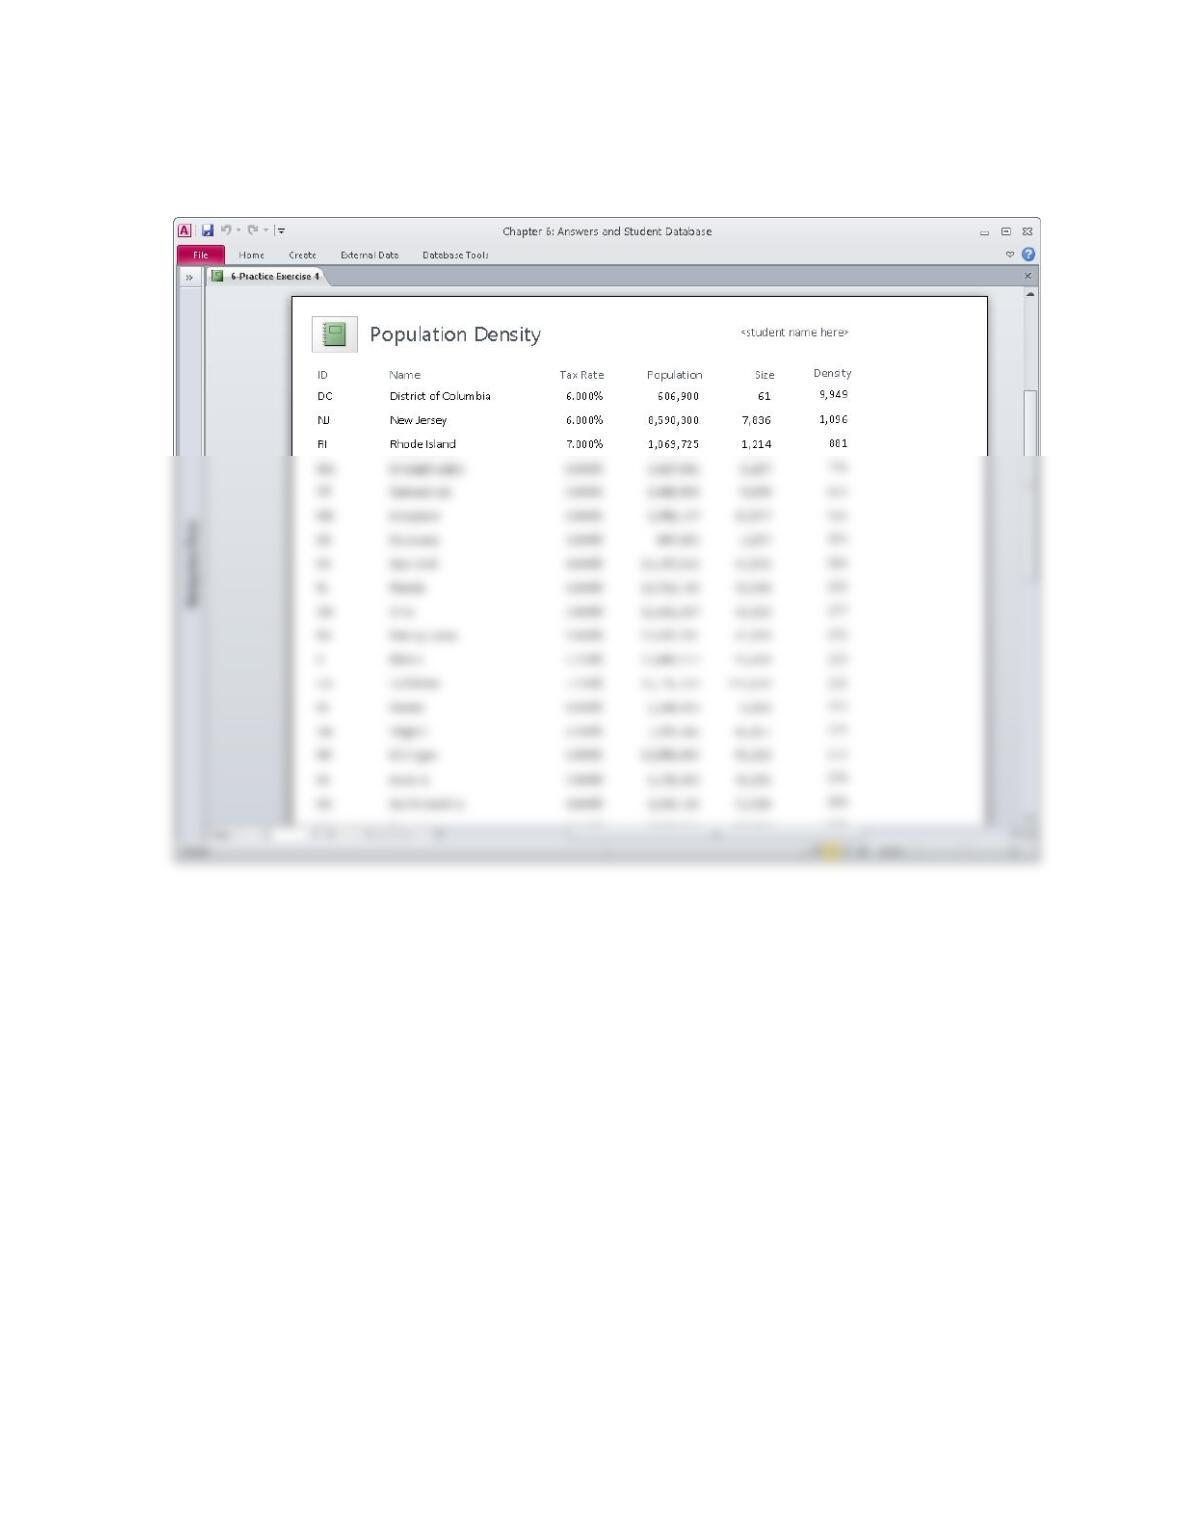
4. The solution is saved in the instructor’s solution database as 6-Practice Exercise 4 in the
custom Navigation Pane group Practice Exercises. The figure that follows shows the Print
Preview view of the solution.
CHAPTER 6 • CREATING AND USING REPORTS 6-15
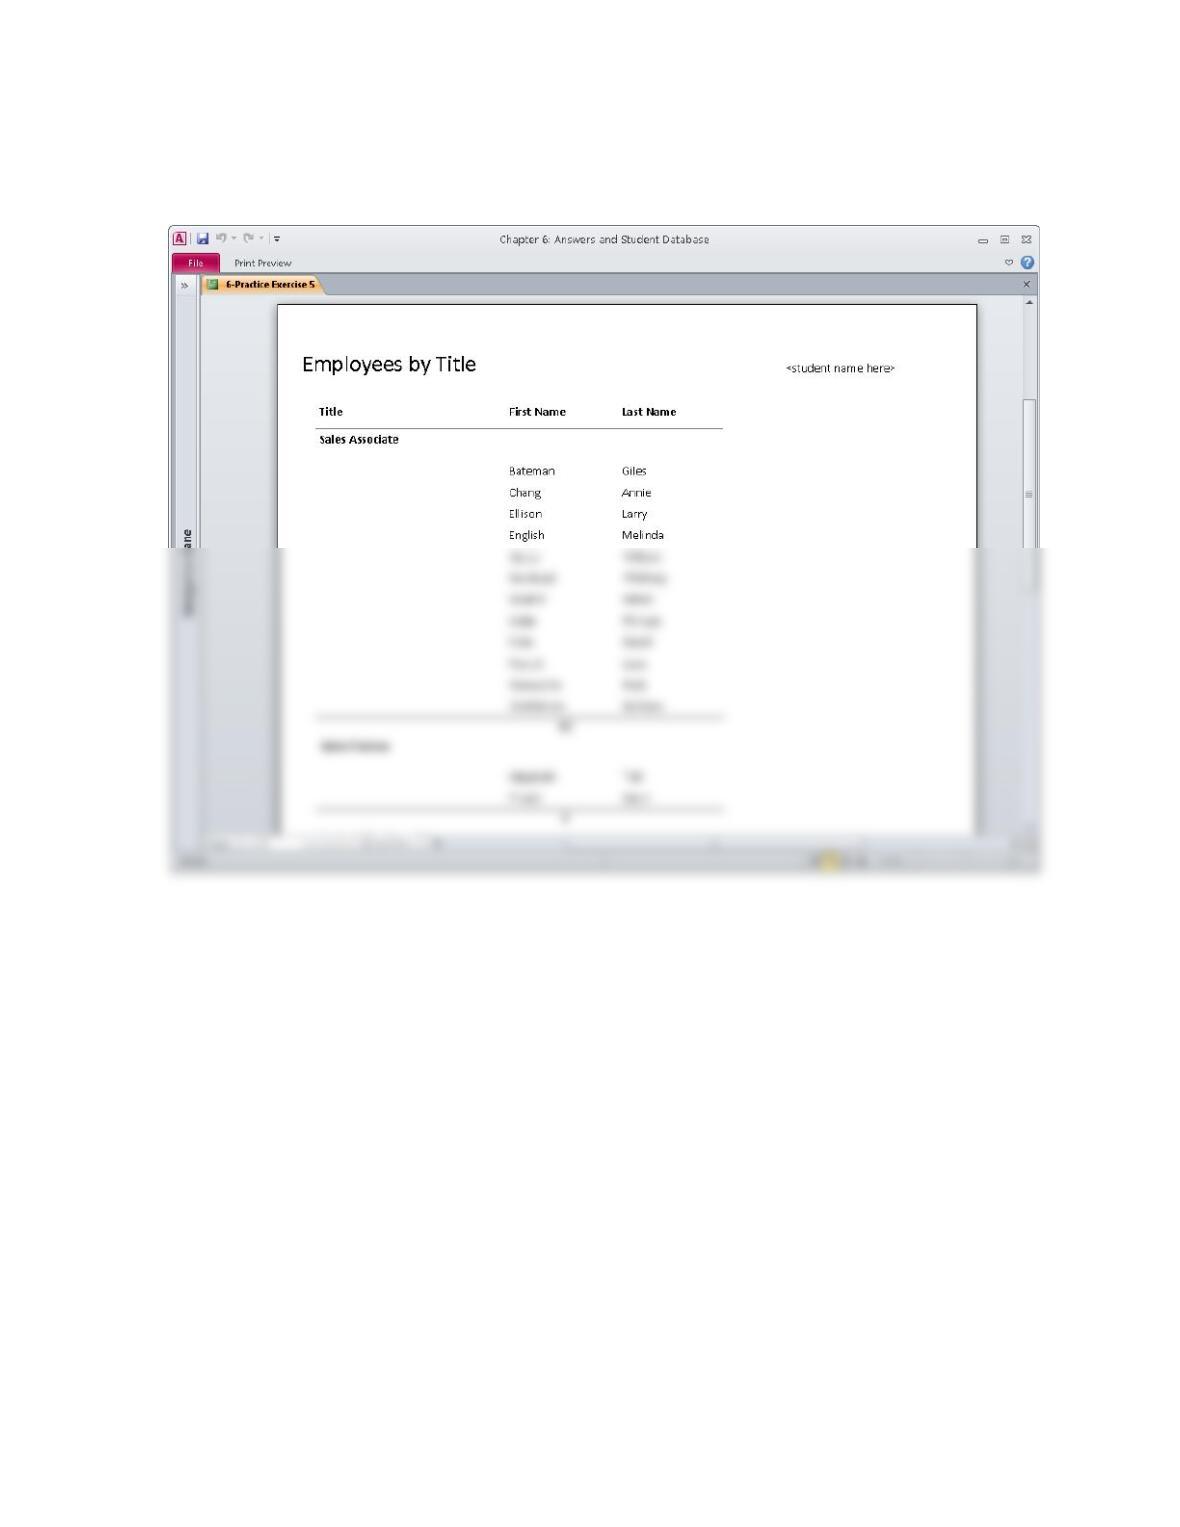
5. The solution is saved in the instructor’s solution database as 6-Practice Exercise 5 in the
custom Navigation Pane group Practice Exercises. The figure that follows shows the Print
Preview view of the solution.
6-16 CHAPTER 6 • CREATING AND USING REPORTS
Problems
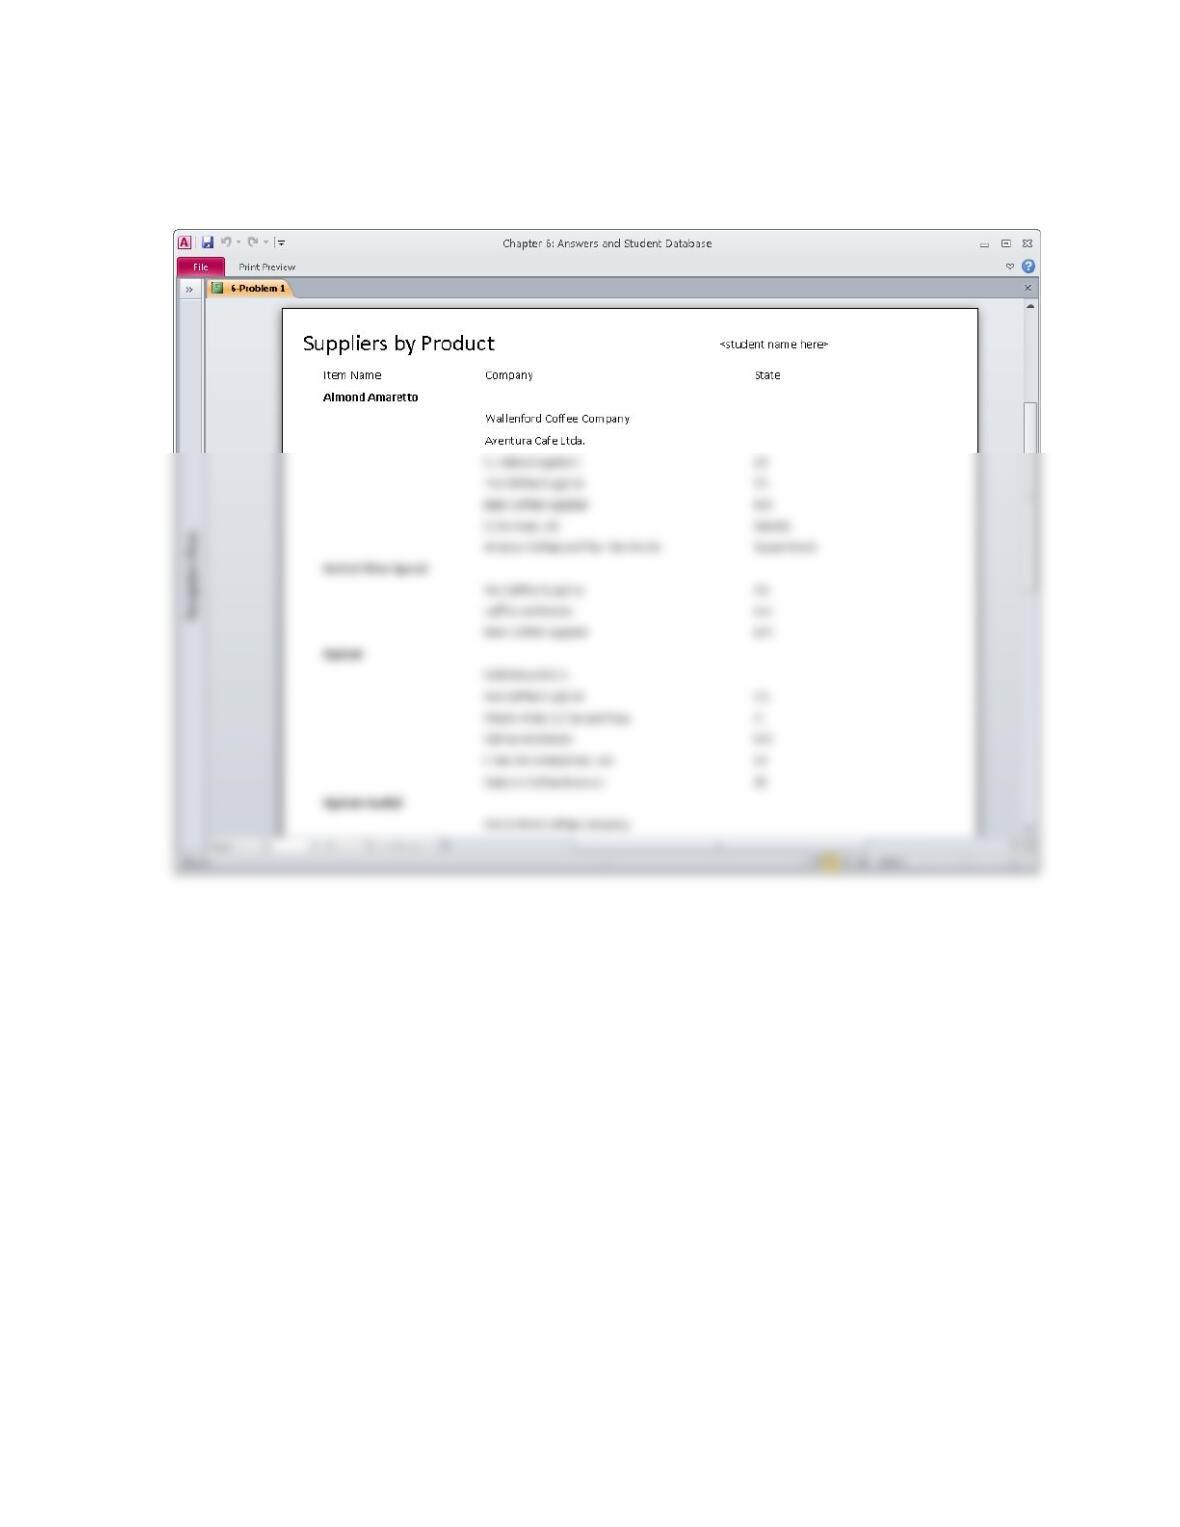
1. The solution is saved in the instructor’s solution database as 6-Problem 1 in the custom Navigation
Pane group Problems. The figure that follows shows the Print Preview view of the solution.
CHAPTER 6 • CREATING AND USING REPORTS 6-17
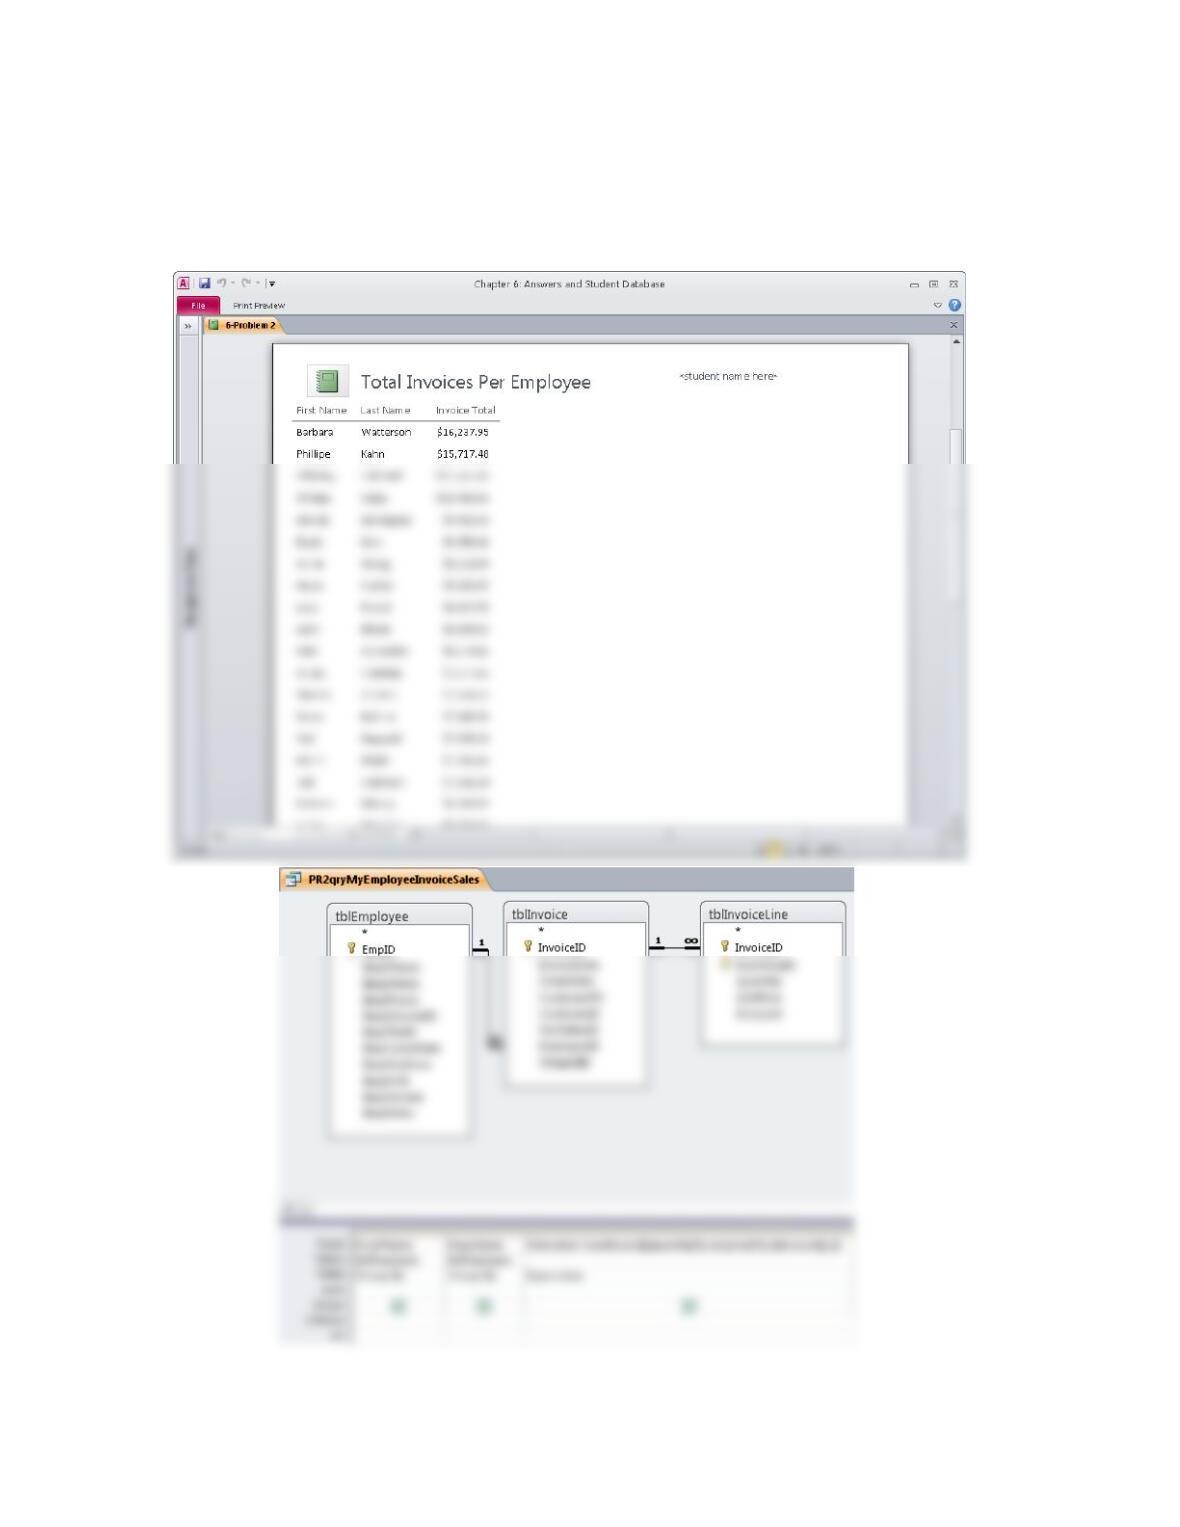
2. The solution is saved in the instructor’s solution database as 6-Problem 2 in the custom
Navigation Pane group Problems. The query, upon which this report is based, is saved as
MyEmployeeInvoiceSales. (It is also saved as the shortcut 6-Problem 2 Query.) The first
figure that follows shows the Print Preview view of the solution. The second one shows the
query that is the data source for the report.
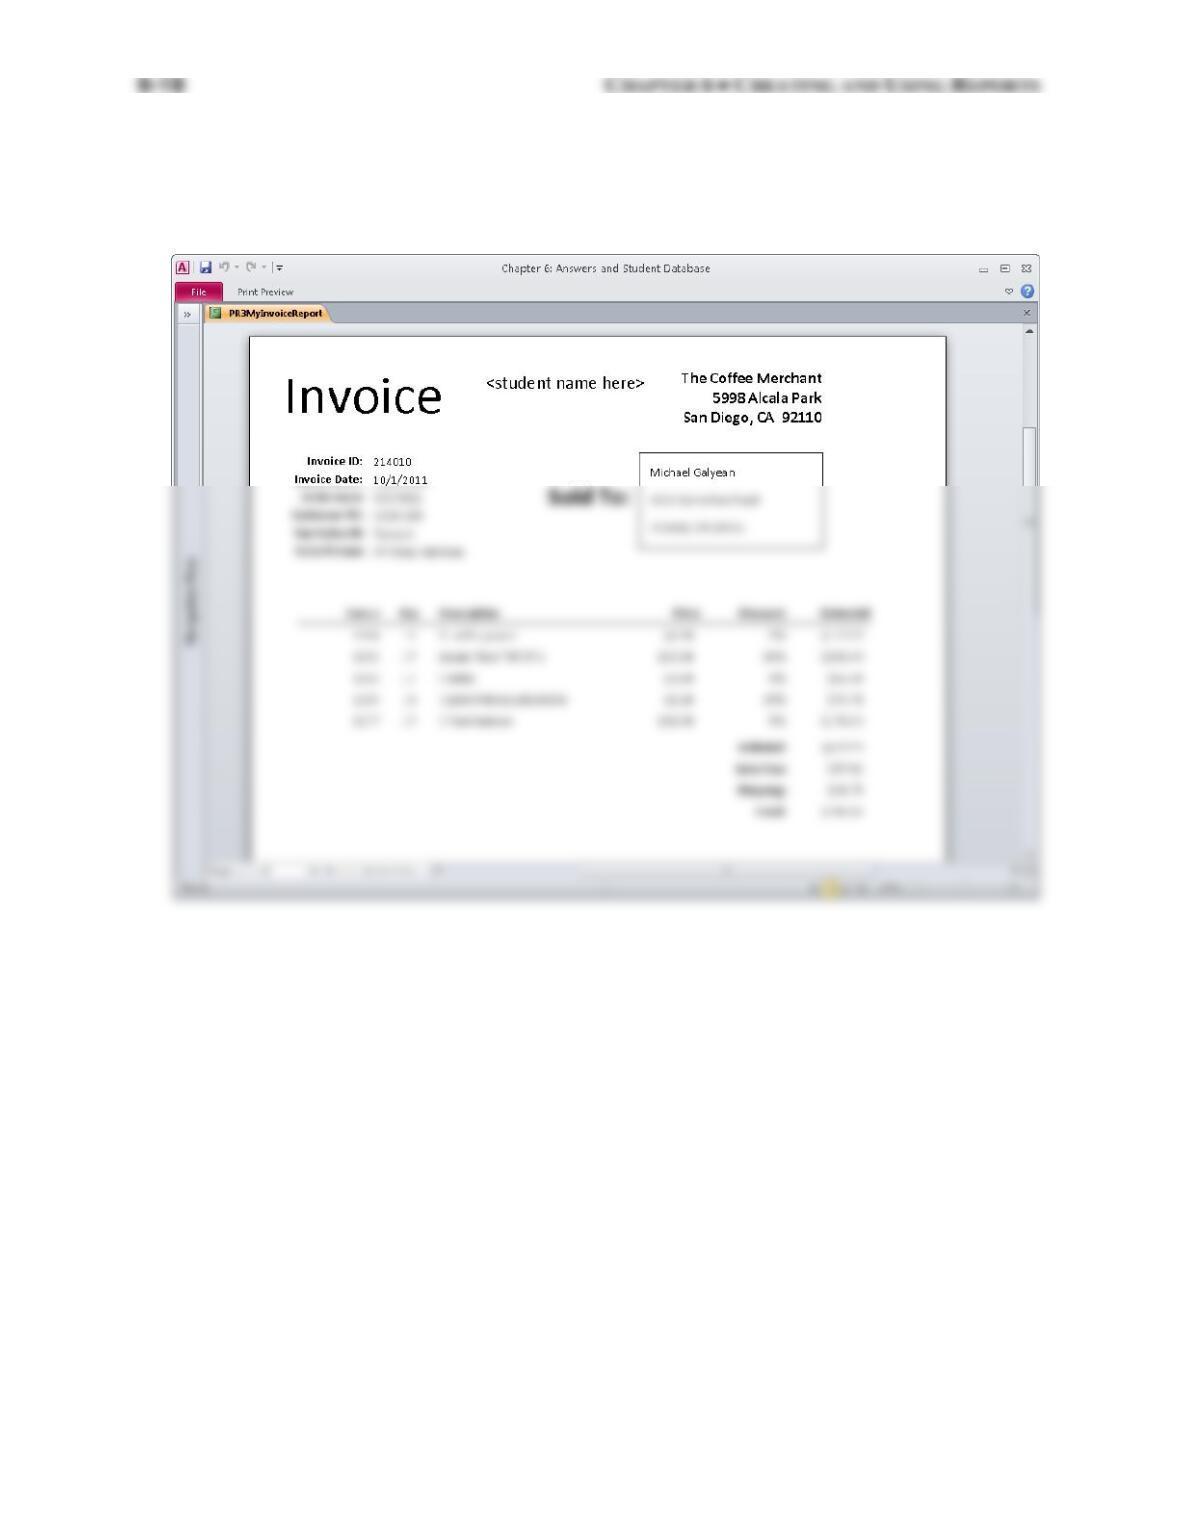
3. The solution is saved in the instructor’s solution database as 6-Problem 3 in the custom
Navigation Pane group Problems. The figure that follows shows the Print Preview view of
the solution. Notice this is page 4, not the first page. It is the invoice for Helen Miller.
Notice, too, that this is a tax exempt invoice. The sales tax should be $0.00.
CHAPTER 6 • CREATING AND USING REPORTS 6-19
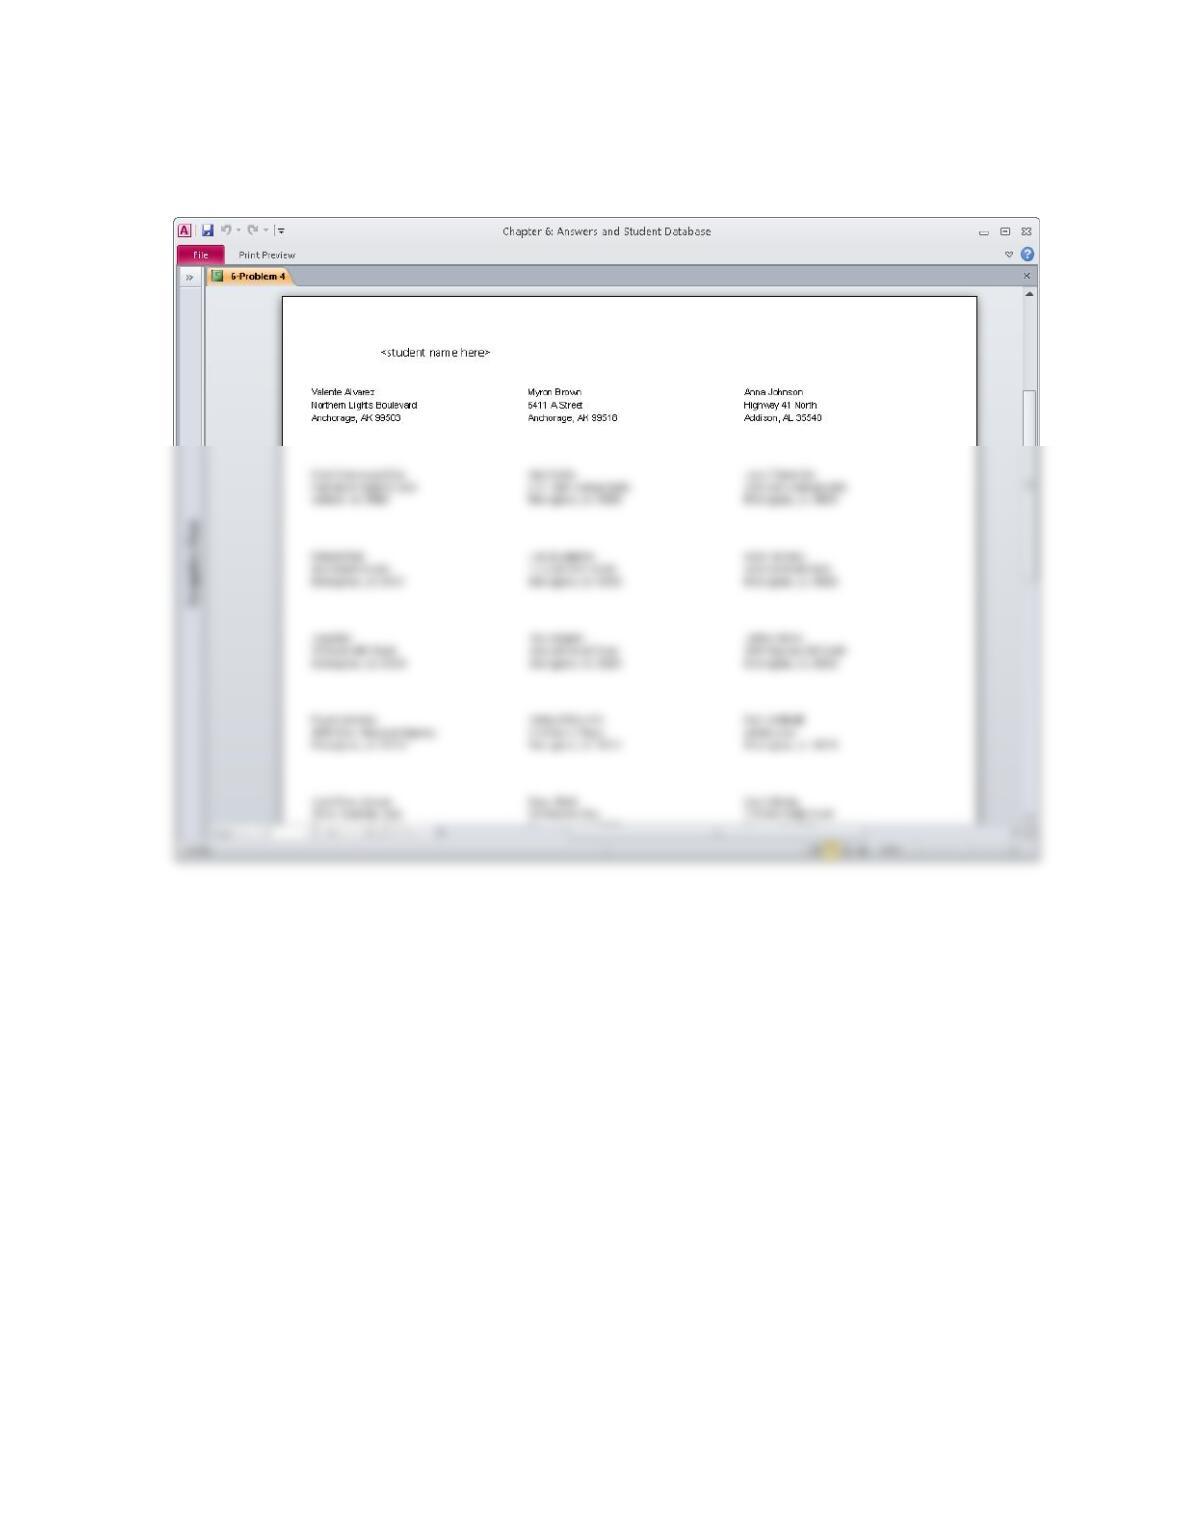
4. The solution is saved in the instructor’s solution database as 6-Problem 4 in the custom
Navigation Pane group Problems. The figure that follows shows the Print Preview view of
the solution.
6-20 CHAPTER 6 • CREATING AND USING REPORTS
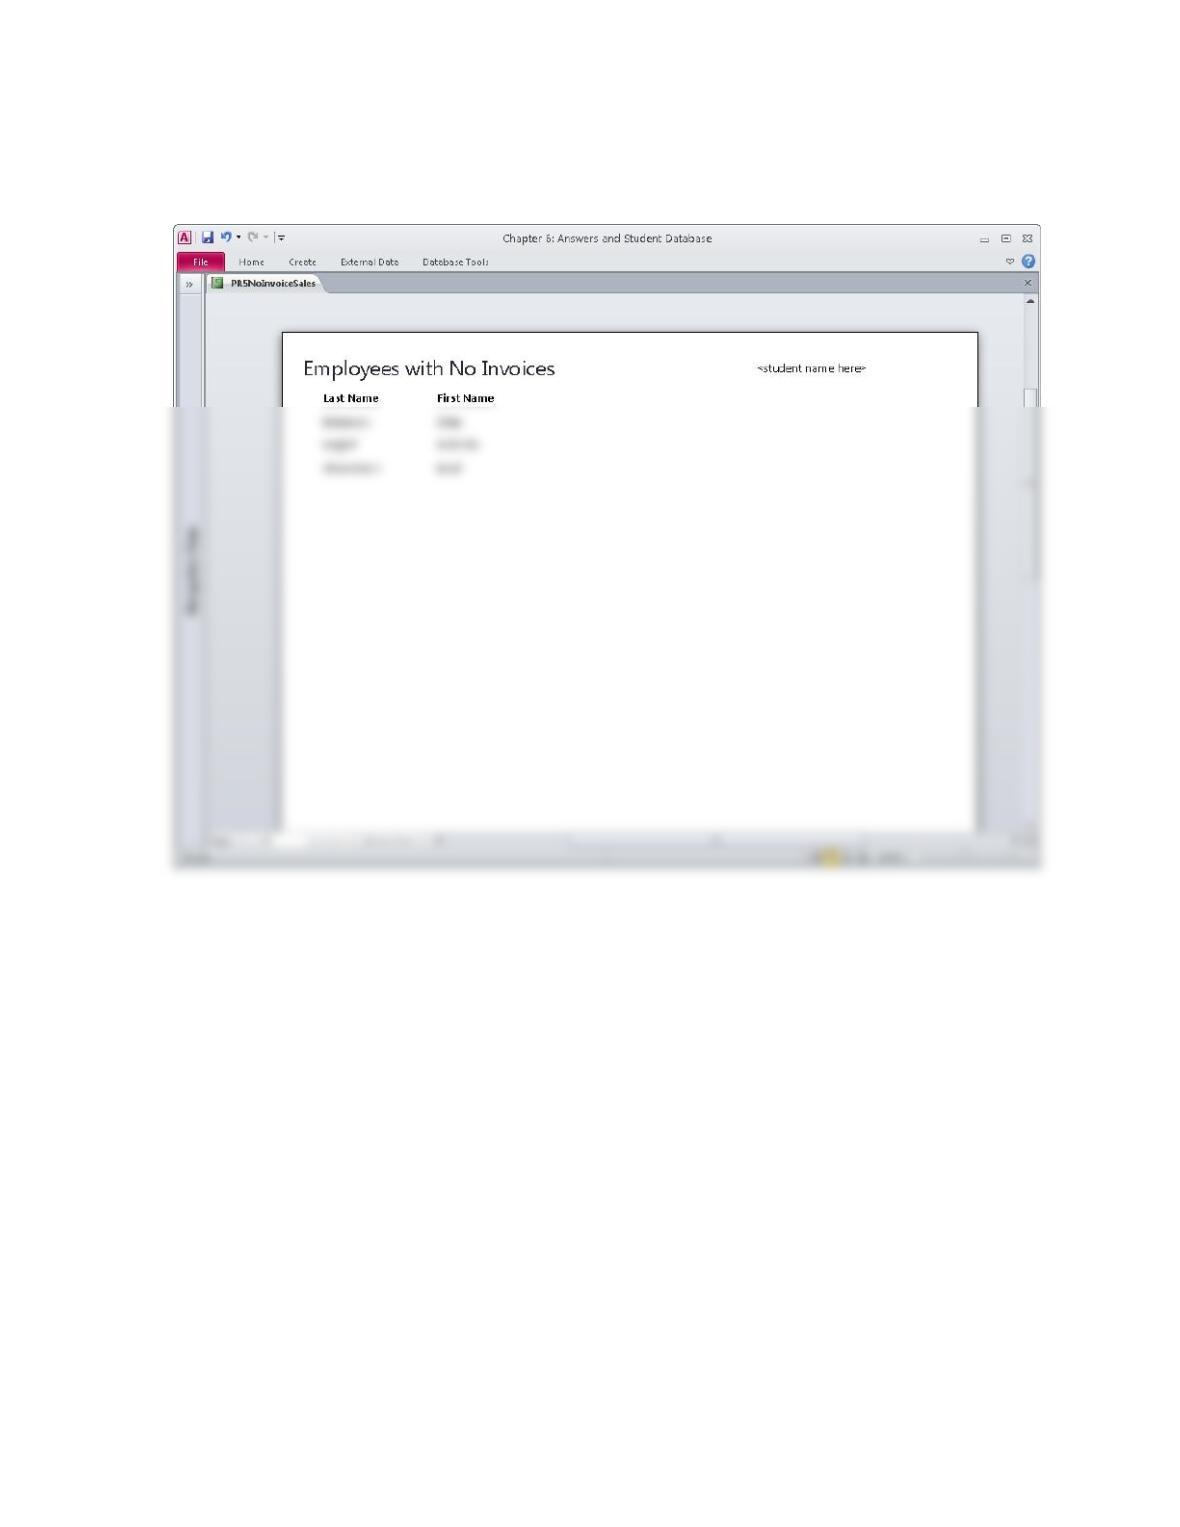
5. The solution is saved in the instructor’s solution database as 6-Problem 5 in the custom
Navigation Pane group Problems. The figure that follows shows the Print Preview view of
the solution.