EXERCISE 6-10 (Continued)
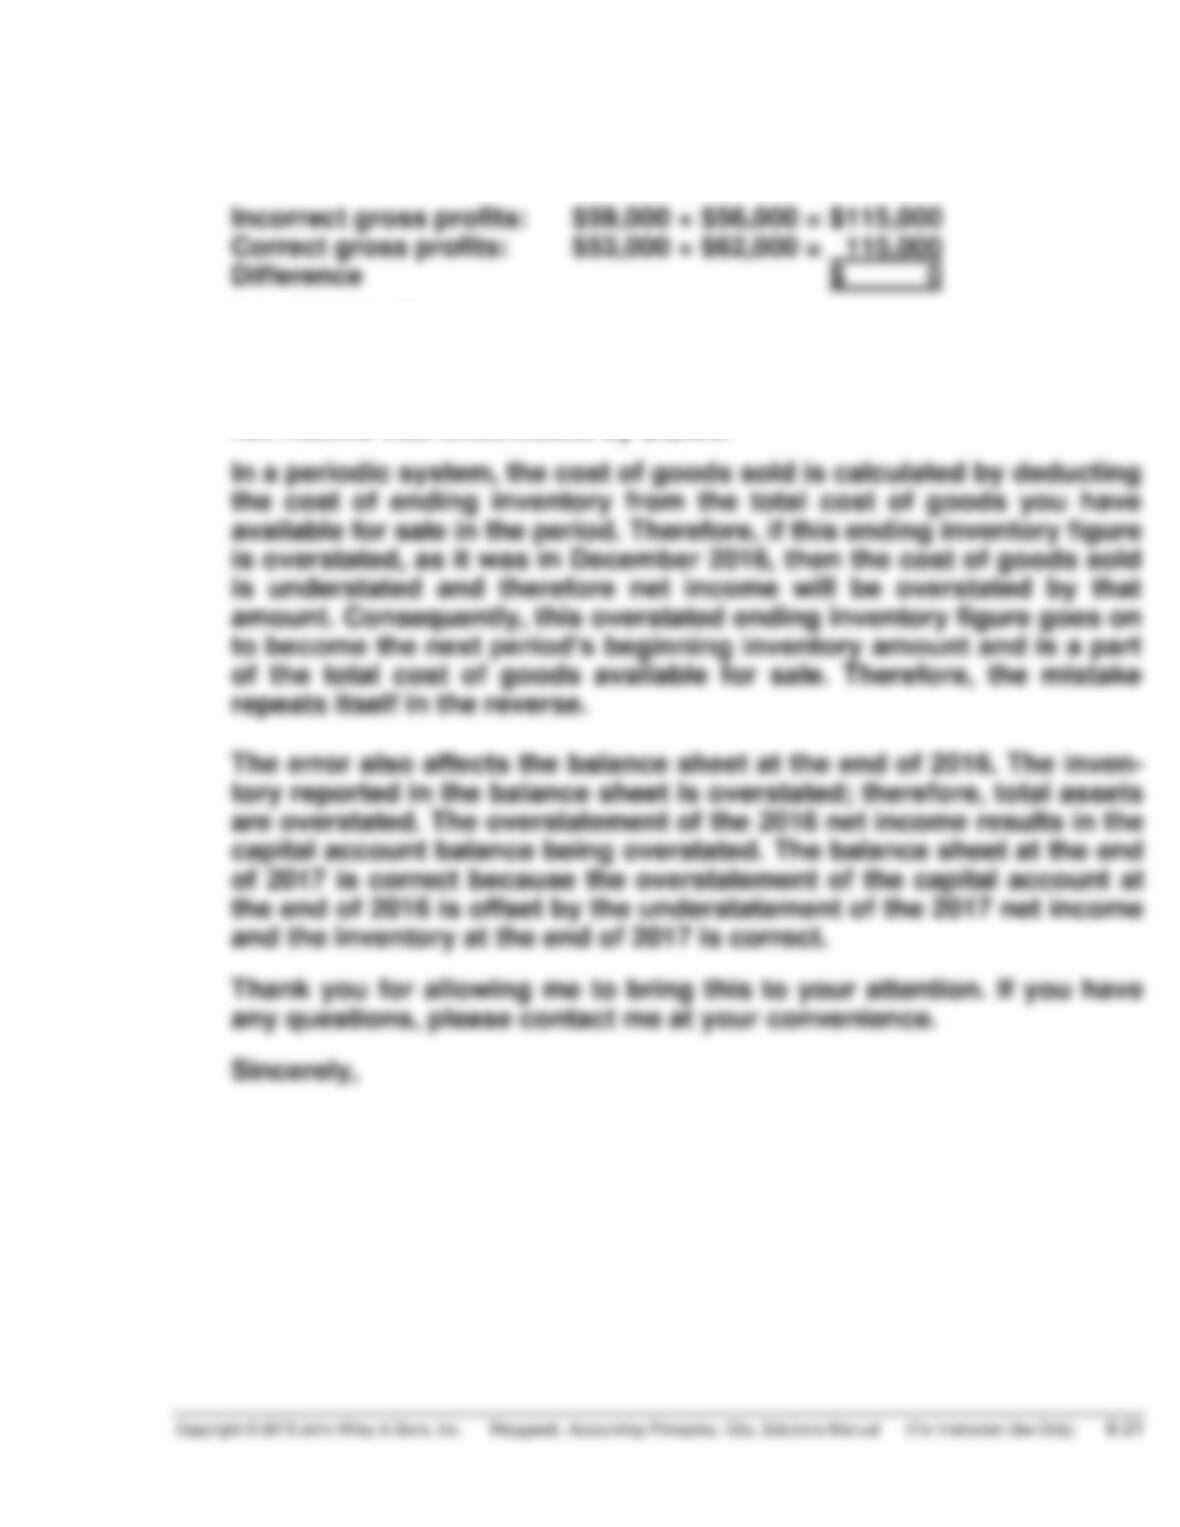
(b) The cumulative effect on total gross profit for the two years is zero as
shown below:
(c) Dear Mr./Ms. President:
Because your ending inventory of December 31, 2016 was overstated
by $6,000, your net income for 2016 was overstated by $6,000. For 2017
net income was understated by $6,000.
In a periodic system, the cost of goods sold is calculated by deducting
the cost of ending inventory from the total cost of goods you have
The error also affects the balance sheet at the end of 2016. The inven–
tory reported in the balance sheet is overstated; therefore, total assets
are overstated. The overstatement of the 2016 net income results in the
EXERCISE 6-11
Cost
Market
Lower
–of-Cost
–or-Market:
Cameras
Minolta
$ 850
$ 780
$ 780
Canon
900
912
Total
Light meters
Vivitar
1,250
1,150
1,150
Kodak
1,680
1,890
1,680
Total
Total inventory
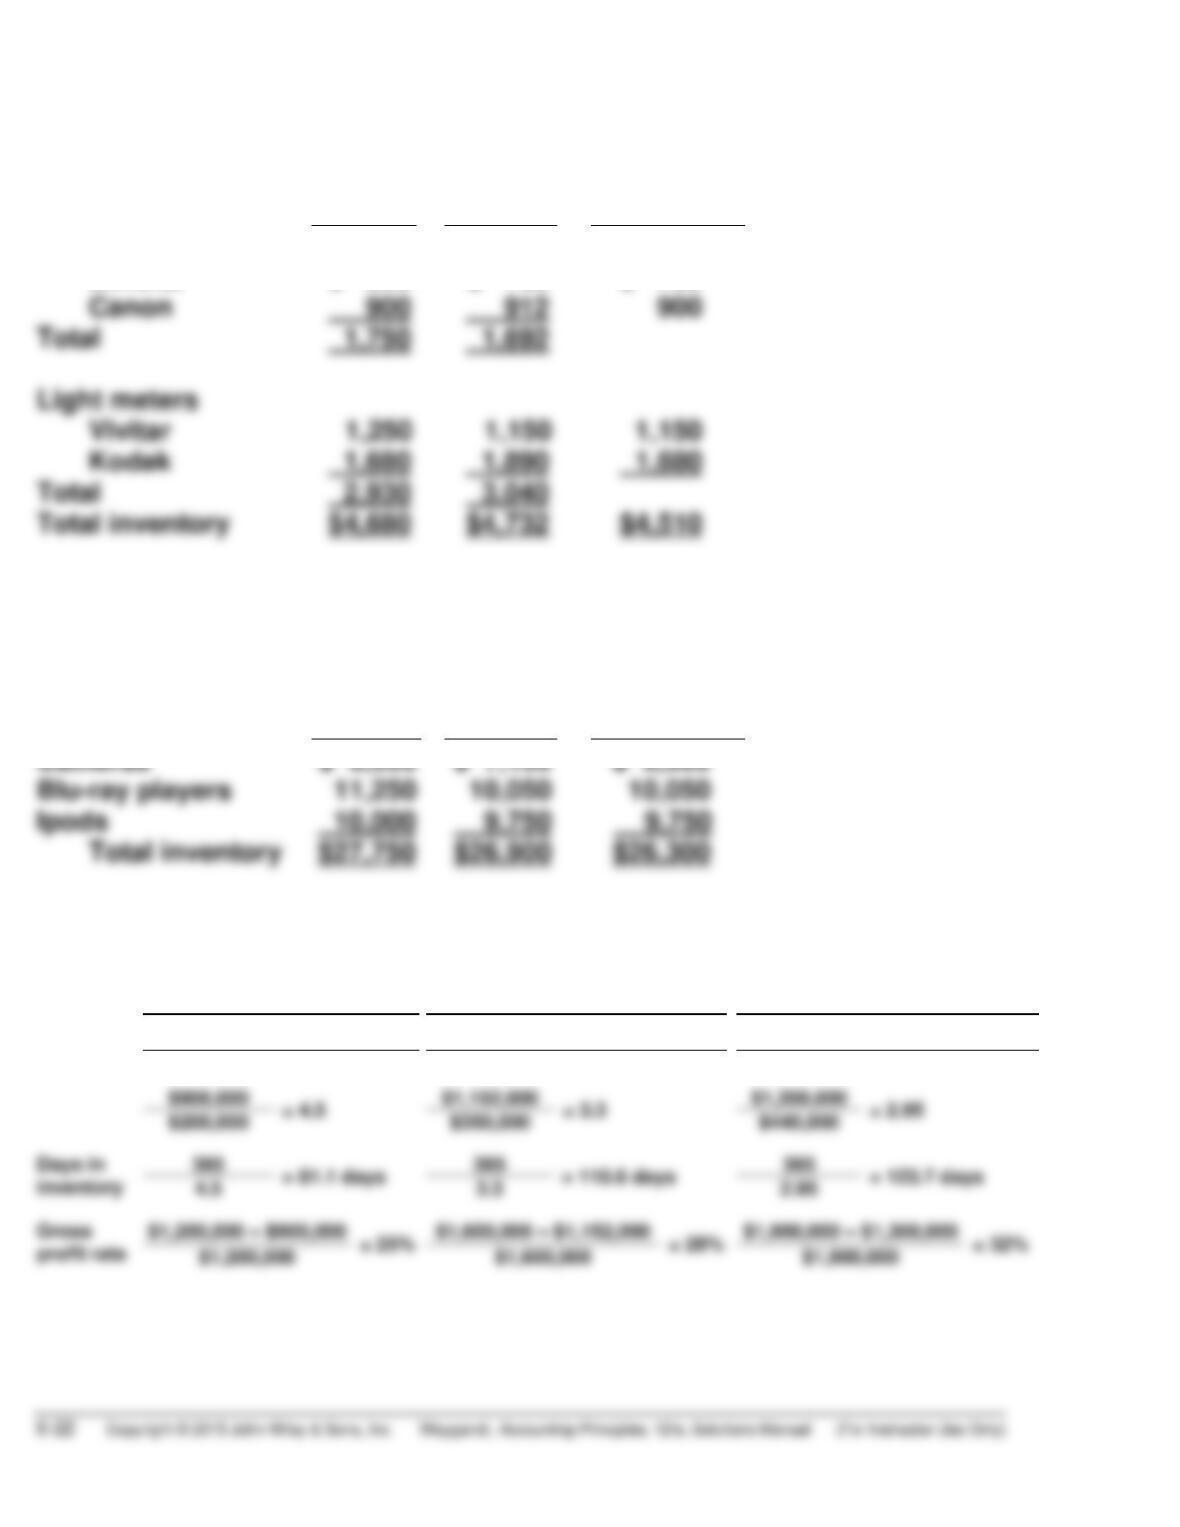
EXERCISE 6-12
Cost
Market
Lower
–of-Cost-
or-Market:
Cameras
$ 6,500
$ 7,100
$ 6,500
Blu-ray players
11,250
10,050
10,050
Ipods
9,750
Total inventory
EXERCISE 6-13
2015
2016
2017
Inventory
turnover
$900,000
$1,152,000
$1,300,000
($100,000 + $300,000) ÷ 2
($300,000 + $400,000) ÷ 2
($400,000 + $480,000) ÷ 2
$900,000
$200,000
Days in
inventory
EXERCISE 6-13 (Continued)
The inventory turnover decreased by approximately 34% from 2015 to 2017
while the days in inventory increased by almost 53% over the same time
period. Both of these changes would be considered negative since it’s
EXERCISE 6-14
(a)
Sooner Company
Later Company
Inventory Turnover
$190,000
$292,000
($45,000 + $55,000)/2
($71,000 + $69,000)/2
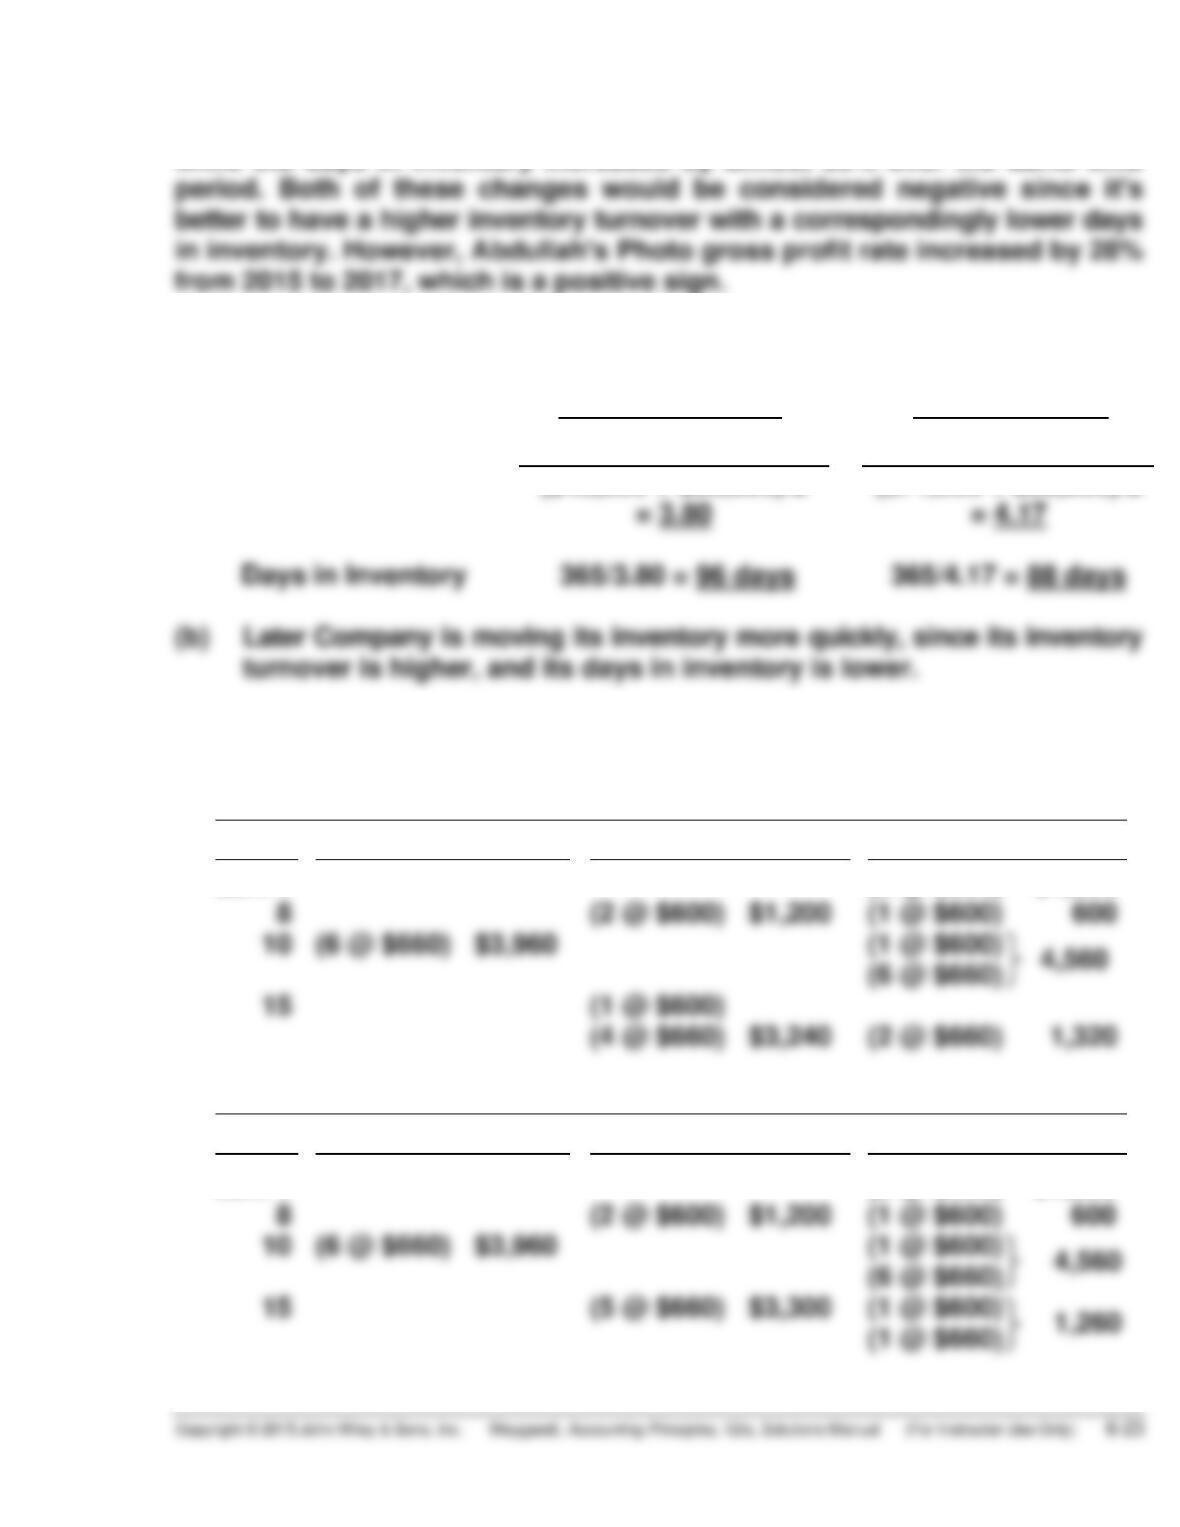
*EXERCISE 6-15
(1)
FIFO
Date
Purchases
Cost of Goods Sold
Balance
Jan. 1
(3 @ $600)
$1,800
8
(2 @ $600) $1,200
(1 @ $600)
600
(6 @ $660) $3,960
(1 @ $600)
(6 @ $660)
(1 @ $600)
(2)
LIFO
Date
Purchases
Cost of Goods Sold
Balance
Jan. 1
(3 @ $600)
$1,800
8
(2 @ $600) $1,200
(1 @ $600)
600
(6 @ $660) $3,960
(1 @ $600)
(6 @ $660)
(1 @ $600)
*EXERCISE 6-15 (Continued)
(3)
MOVING-AVERAGE COST
Date
Purchases
Cost of Goods Sold
Balance
Jan. 1
(3 @ $600) $1,800
8
(2 @ $600) $1,200
(1 @ $600) 600
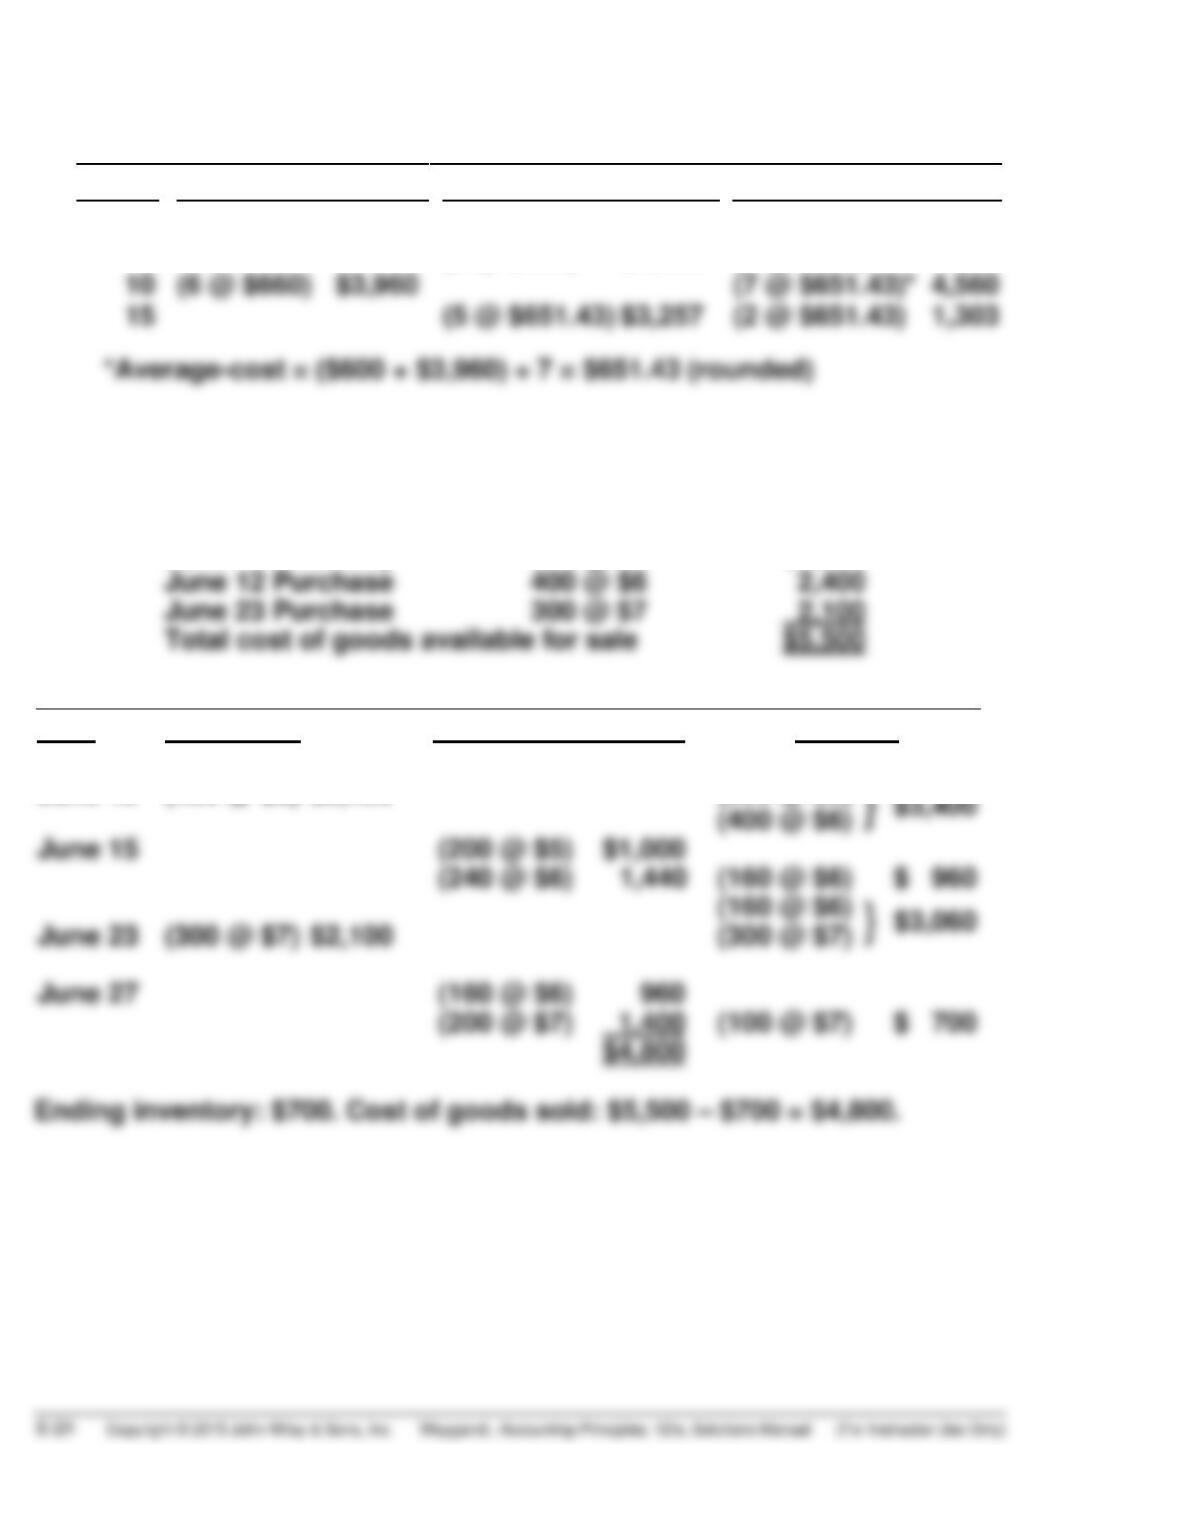
*EXERCISE 6-16
(a) The cost of goods available for sale is:
June 1 Inventory
200 @ $5
$1,000
June 12 Purchase
June 23 Purchase
300 @ $7
Total cost of goods available for sale
FIFO
Date
Purchases
Cost of Goods Sold
Balance
June 1
(200 @ $5)
$1,000
June 12
(400 @ $6) $2,400
(200 @ $5)
June 15
(200 @ $5)
$ 960
June 23
(300 @ $7) $2,100
(300 @ $7)
June 27
$ 700
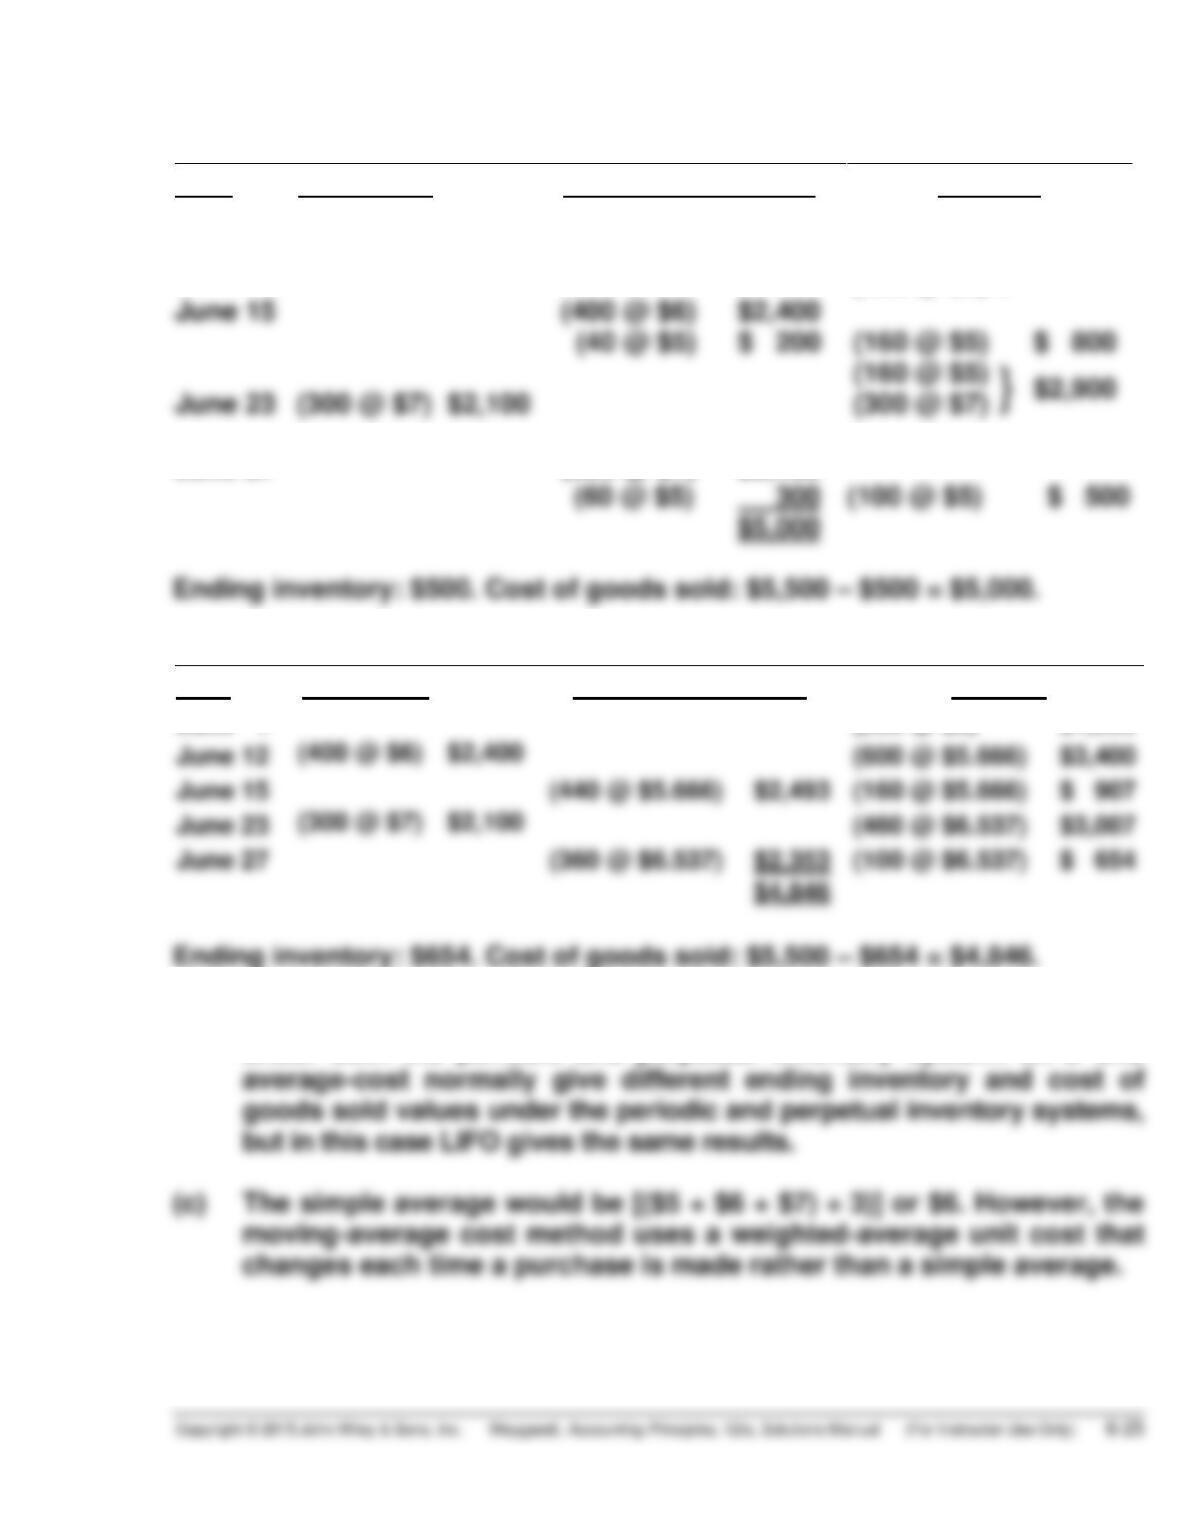
*EXERCISE 6-16 (Continued)
LIFO
Date
Purchases
Cost of Goods Sold
Balance
June 1
(200 @ $5)
$1,000
June 12
(400 @ $6) $2,400
(200 @ $5)
}
$3,400
(400 @ $6)
June 15
$ 200
(160 @ $5)
(160 @ $5)
}
$2,900
June 23
June 27
(300 @ $7)
$2,100
Moving-Average Cost
Date
Purchases
Cost of Goods Sold
Balance
June 1
(200 @ $5) $1,000
June 12
(400 @ $6) $2,400
(600 @ $5.666) $3,400
June 15
June 23
(300 @ $7) $2,100
(460 @ $6.537) $3,007
June 27
(b) FIFO gives the same ending inventory and cost of goods sold values
under both the periodic and perpetual inventory system. LIFO and
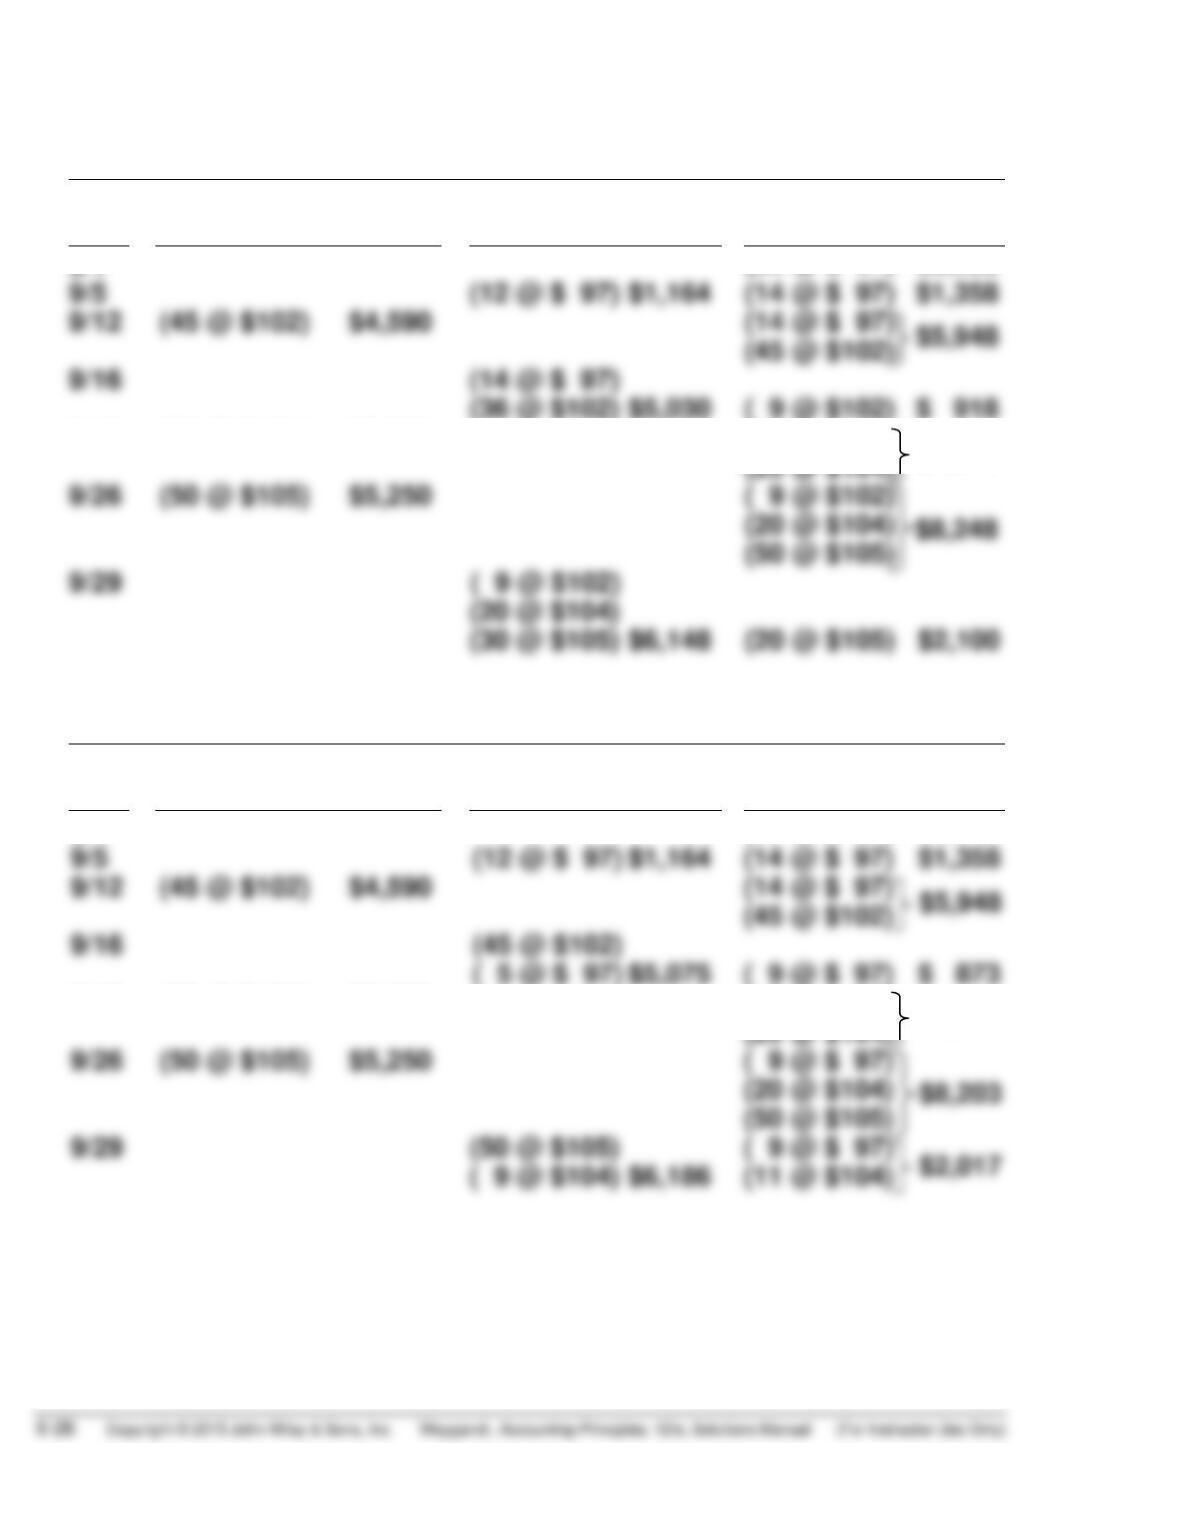
*EXERCISE 6-17
(a)
FIFO
Date
Purchases
Cost of
Goods Sold
Balance
9/1
(26 @ $ 97)
$2,522
9/5
(12 @ $ 97) $1,164
(14 @ $ 97)
$1,358
9/12
(45 @ $102) $4,590
(14 @ $ 97)
(45 @ $102)
9/16
(14 @ $ 97)
(36 @ $102) $5,030
( 9 @ $102)
$ 918
9/19
(20 @ $104) $2,080
( 9 @ $102)
$2,998
(20 @ $104)
9/26
(50 @ $105) $5,250
( 9 @ $102)
(20 @ $104)
(50 @ $105)
9/29
( 9 @ $102)
(20 @ $104)
(30 @ $105) $6,148
(20 @ $105) $2,100
LIFO
Date
Purchases
Cost of
Goods Sold
Balance
9/1
(26 @ $ 97)
$2,522
9/5
(12 @ $ 97) $1,164
(14 @ $ 97)
$1,358
9/12
(45 @ $102) $4,590
(14 @ $ 97)
(45 @ $102)
9/16
(45 @ $102)
( 5 @ $ 97) $5,075
( 9 @ $ 97)
$ 873
9/19
(20 @ $104) $2,080
( 9 @ $ 97)
$2,953
(20 @ $104)
9/26
(50 @ $105) $5,250
( 9 @ $ 97)
$8,203
(20 @ $104)
(50 @ $105)
9/29
(50 @ $105)
( 9 @ $ 97)
( 9 @ $104) $6,186
(11 @ $104)
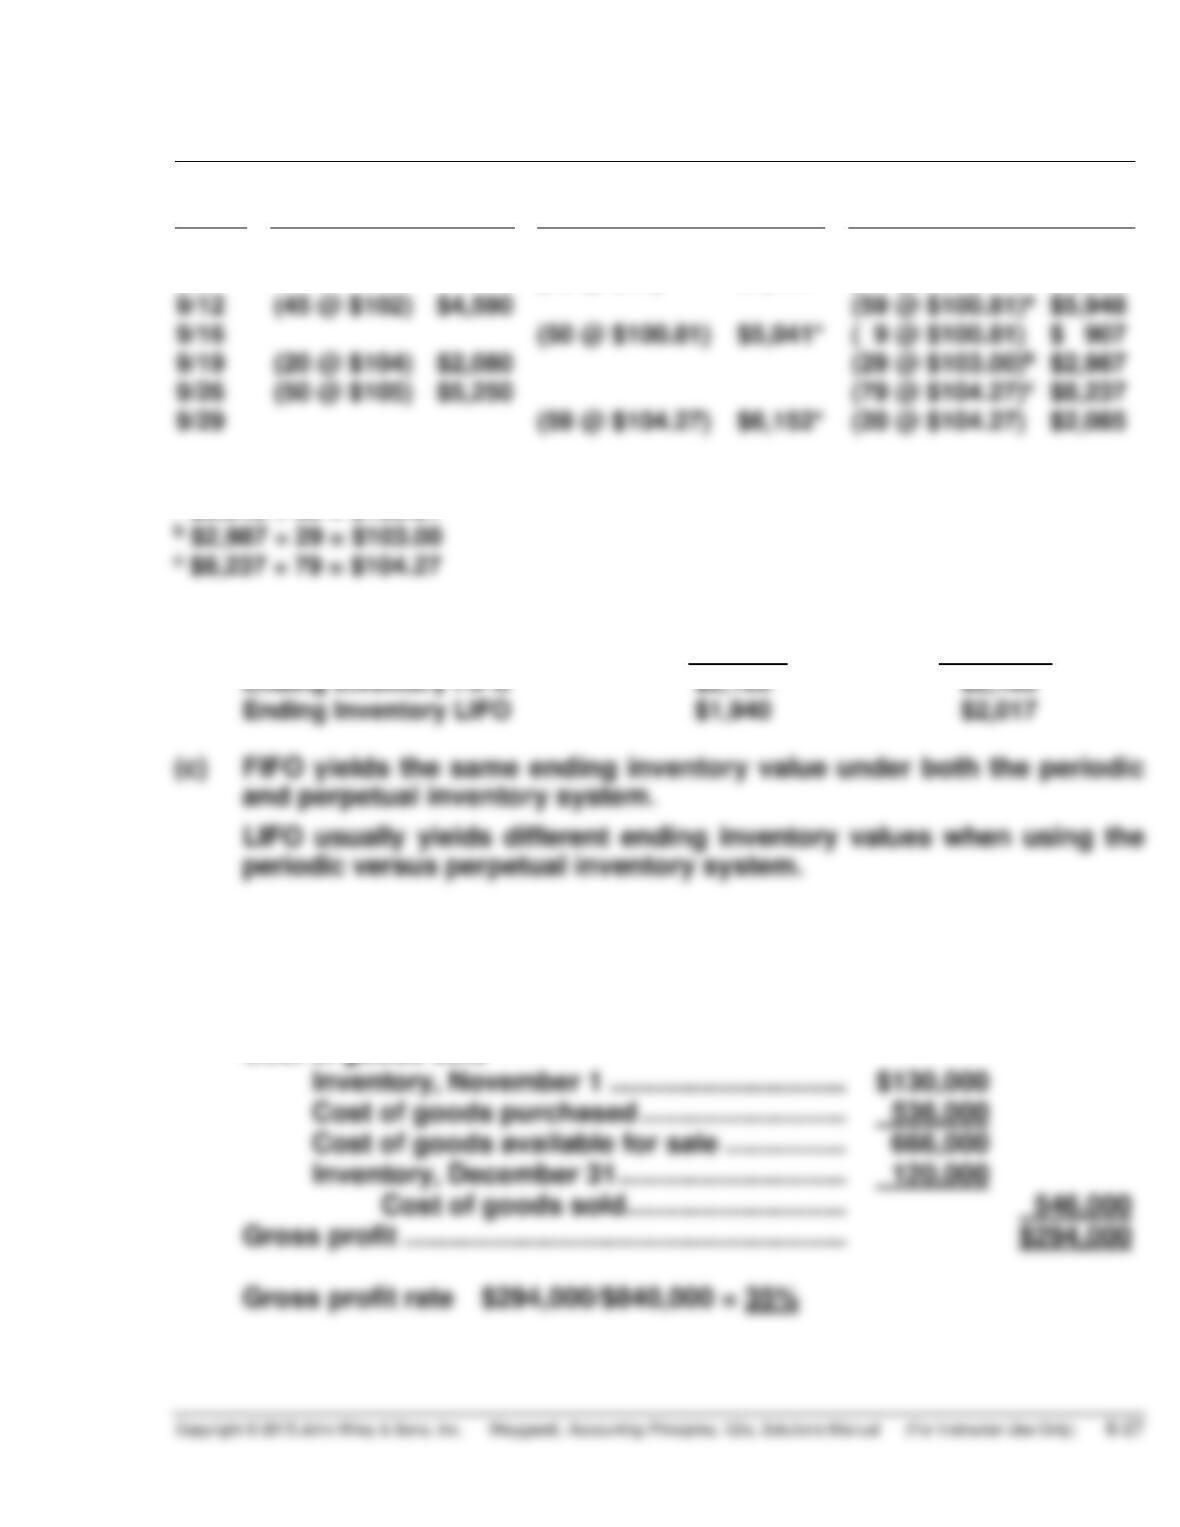
*EXERCISE 6-17 (Continued)
Moving-Average Cost
Date
Purchases
Cost of
Goods Sold
Balance
9/1
(26 @ $97) $2,522
9/5
(12 @ $97) $1,164
(14 @ $97) $1,358
9/12
(45 @ $102) $4,590
9/16
(50 @ $100.81) $5,041*
( 9 @ $100.81) $ 907
9/19
(20 @ $104) $2,080
9/26
(50 @ $105) $5,250
9/29
(59 @ $104.27) $6,152*
(20 @ $104.27) $2,085
*Rounded
a $5,948 ÷ 59 = $100.81
(b)
Periodic
Perpetual
Ending Inventory FIFO
$2,100
$2,100
Ending Inventory LIFO
$1,940
$2,017
*EXERCISE 6-18
(a) Sales …………………………………………………………… $840,000
Cost of goods sold
Inventory, November 1 …………………………. $130,000
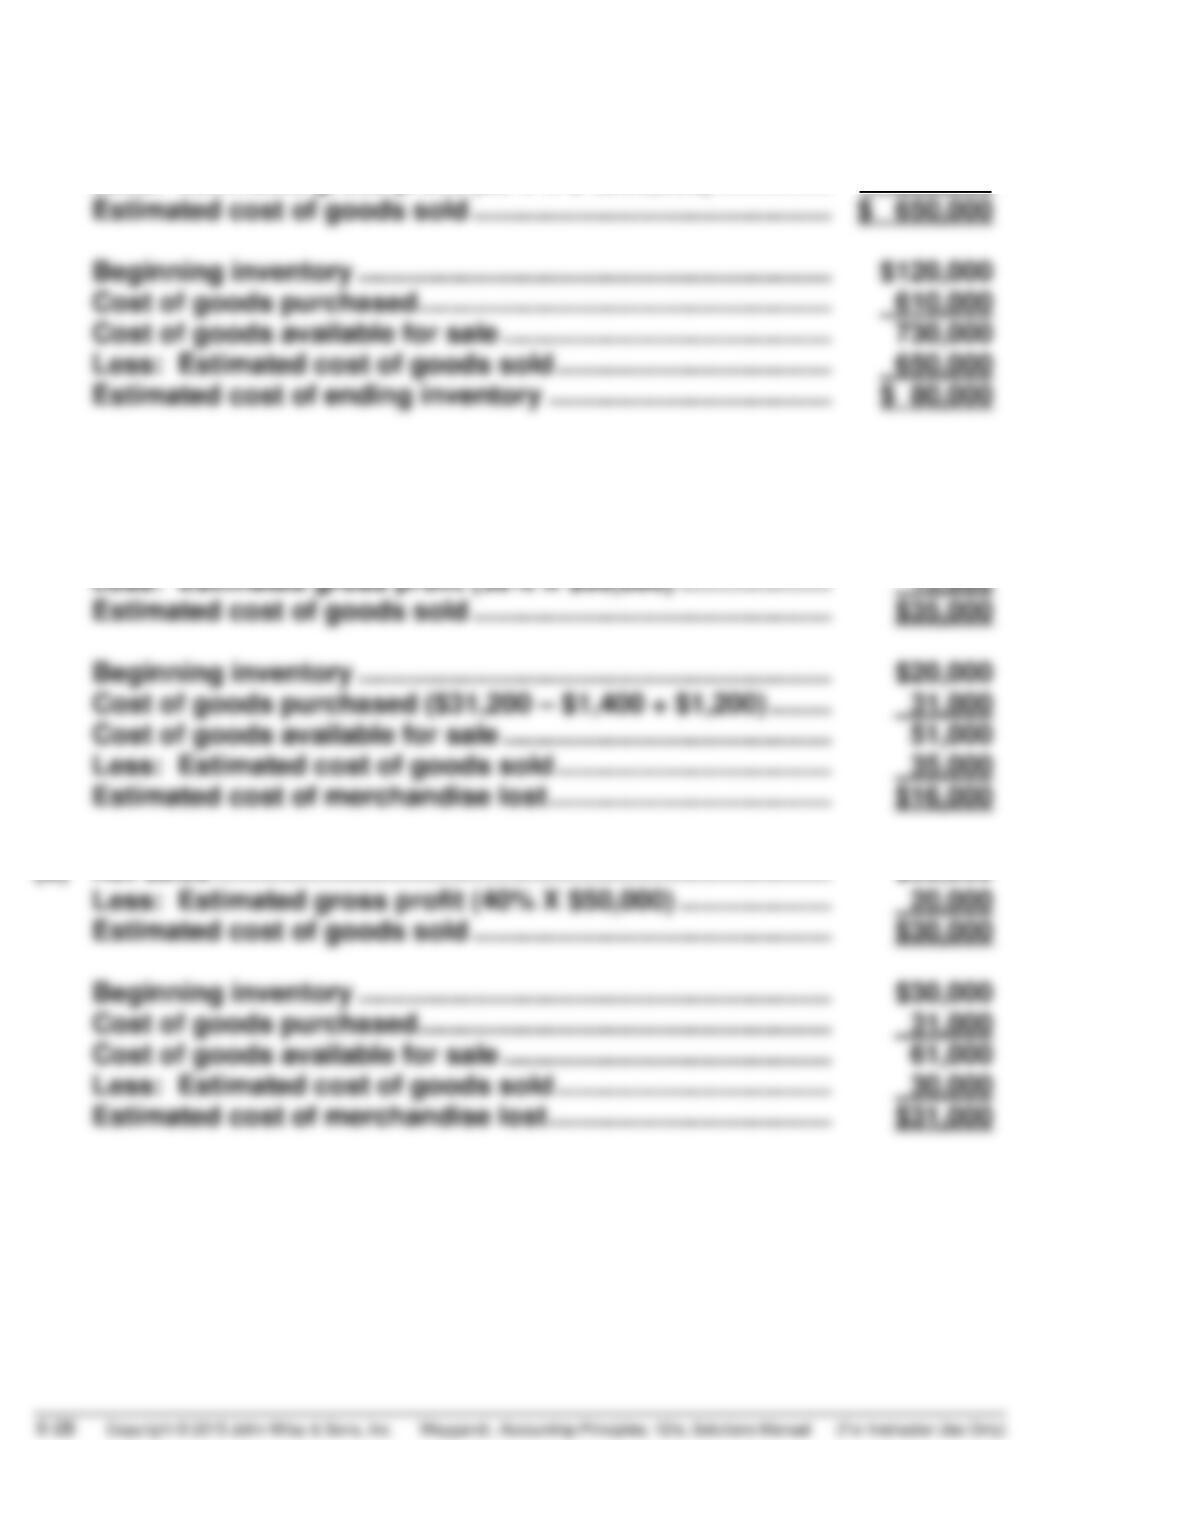
*EXERCISE 6-18 (Continued)
(b) Sales …………………………………………………………………………… $1,000,000
Less: Estimated gross profit (35% X $1,000,000) …………… 350,000
*EXERCISE 6-19
(a) Net sales ($51,000 – $1,000) ………………………………………….. $50,000
Less: Estimated gross profit (30% X $50,000) ……………….. 15,000
Estimated cost of goods sold ……………………………………….. $35,000
(b) Net sales ……………………………………………………………………… $50,000
Less: Estimated gross profit (40% X $50,000) ……………….. 20,000
Estimated cost of goods sold ……………………………………….. $30,000
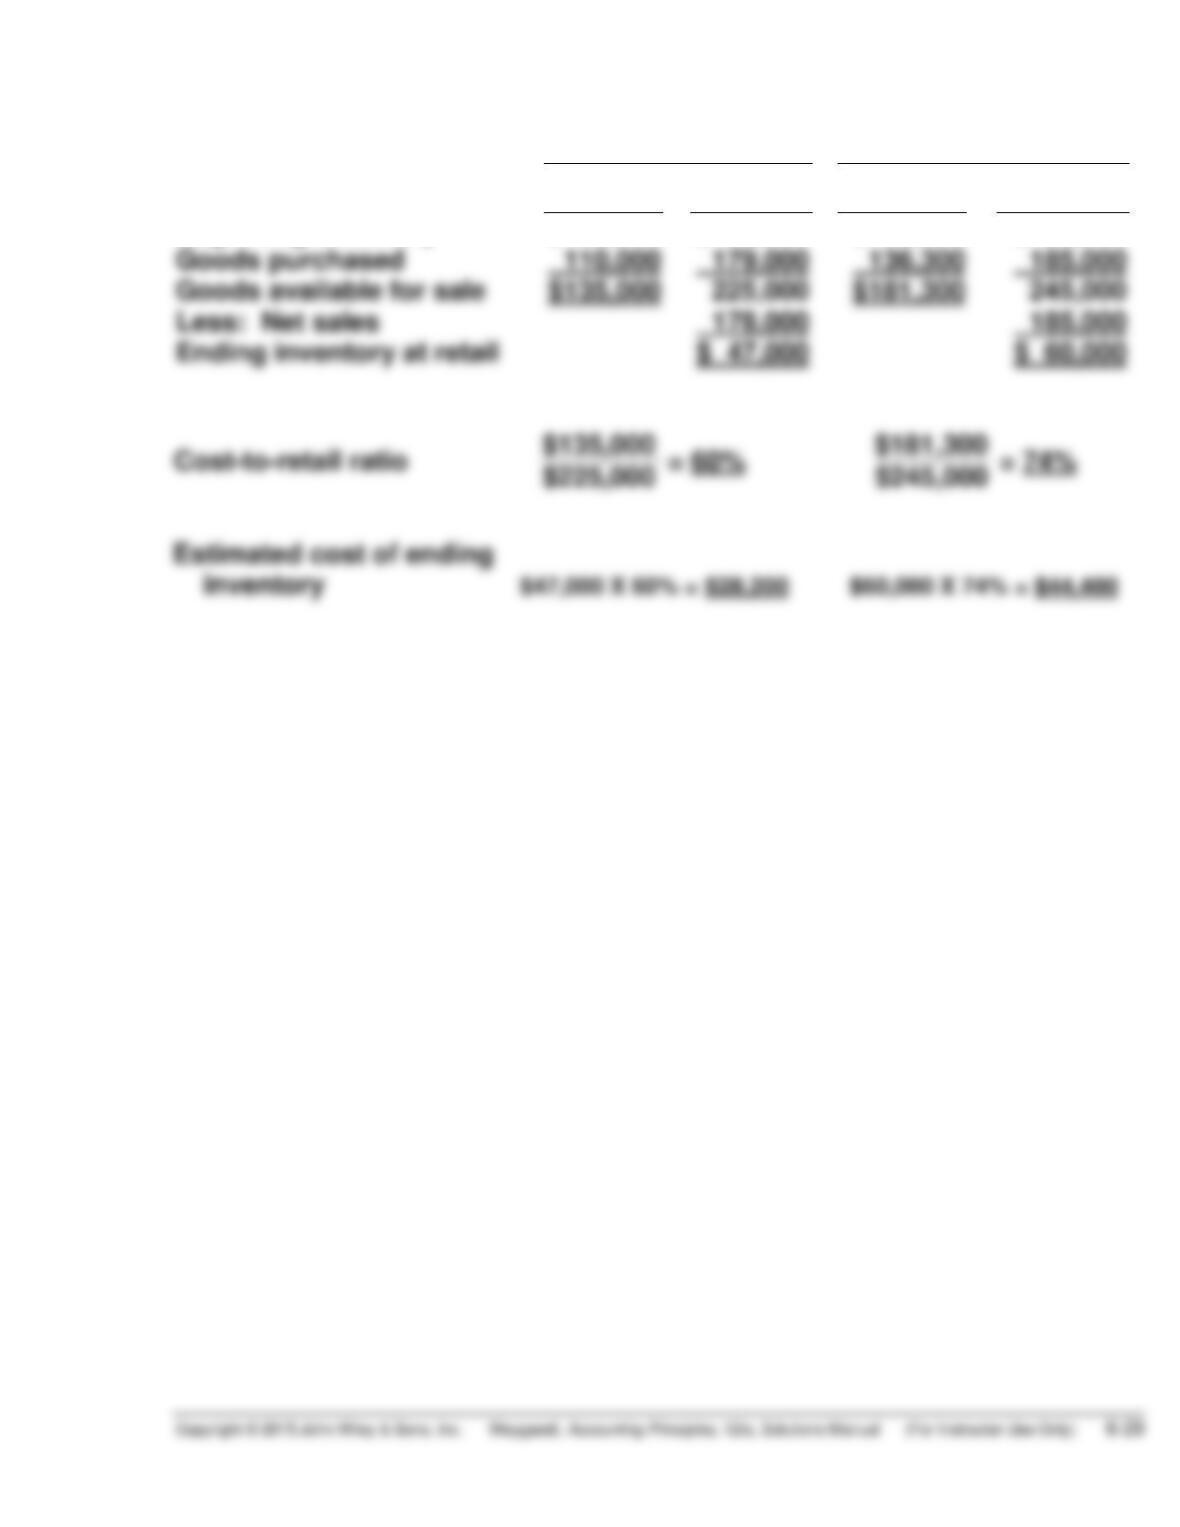
*EXERCISE 6-20
Women’s Shoes
Men’s Shoes
Cost
Retail
Cost
Retail
Beginning inventory
$ 25,000
$ 46,000
$ 45,000
$ 60,000
Goods purchased
110,000
179,000
136,300
185,000
Less: Net sales
178,000
185,000
Ending inventory at retail
$ 47,000
$ 60,000
PROBLEM 6-1A
(a) The sale will be recorded on February 26. The goods (cost, $800) should
be excluded from Houghton’s February 28 inventory.
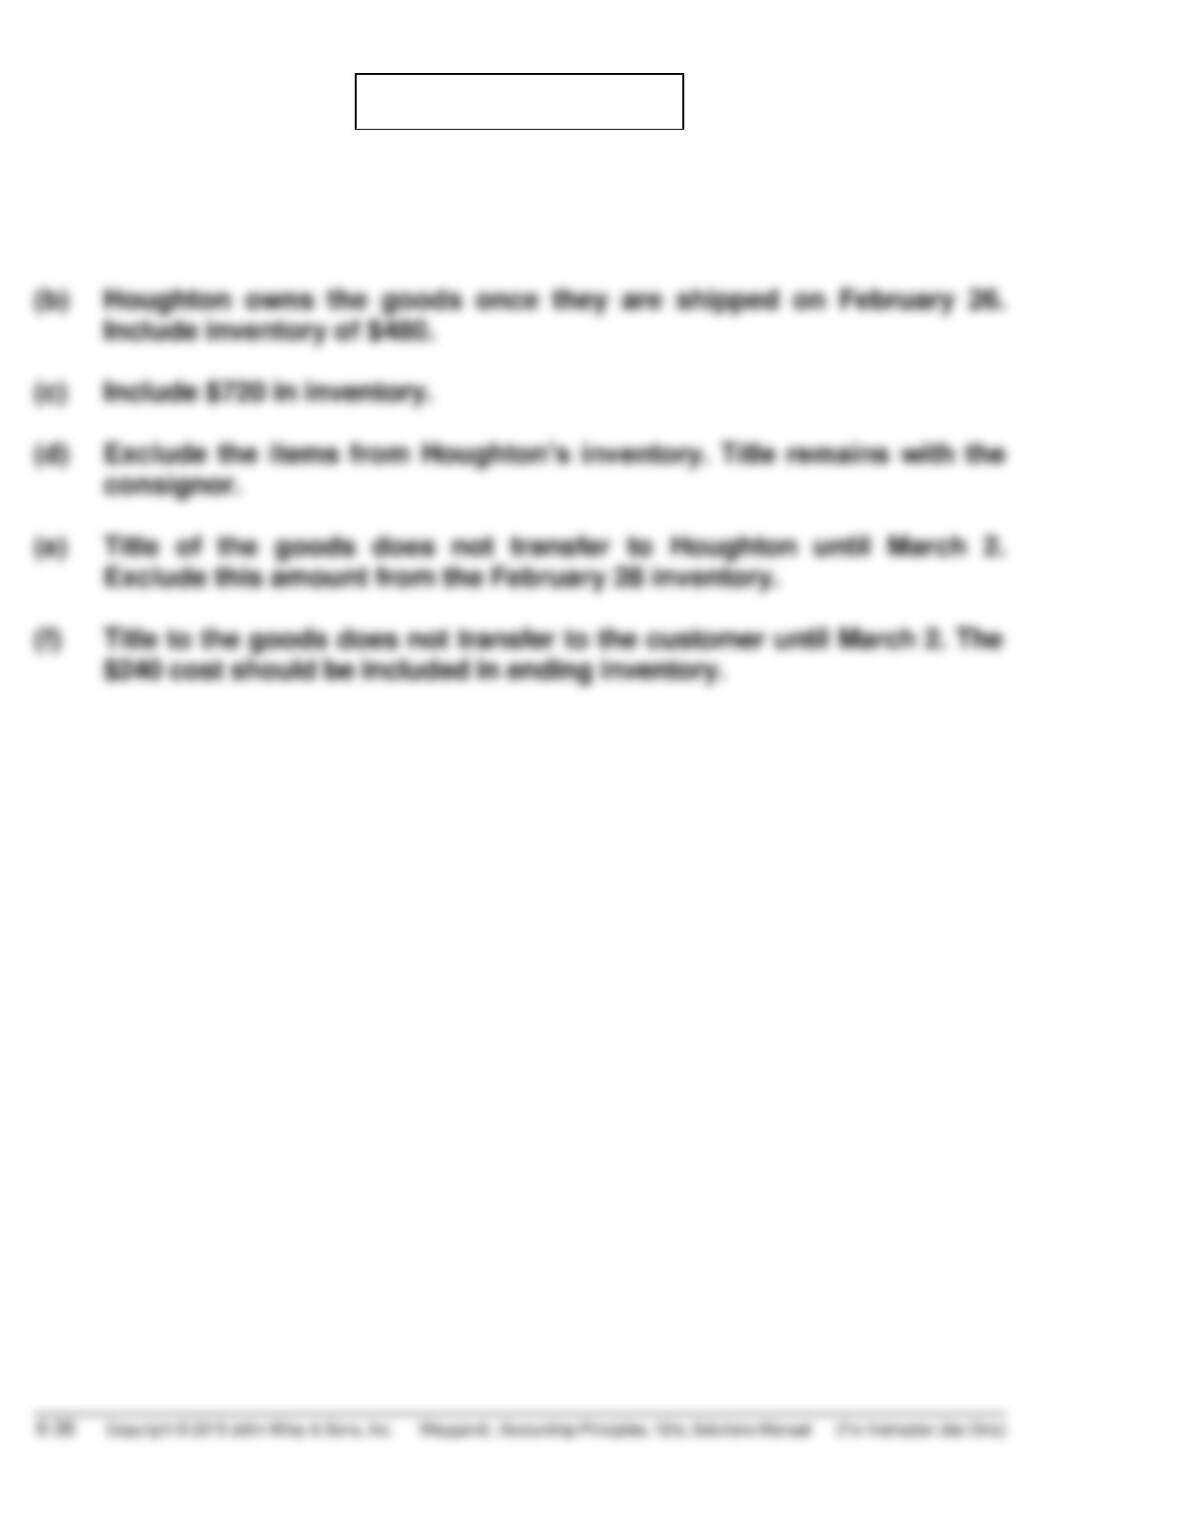
(b) Houghton owns the goods once they are shipped on February 26.
Include inventory of $480.
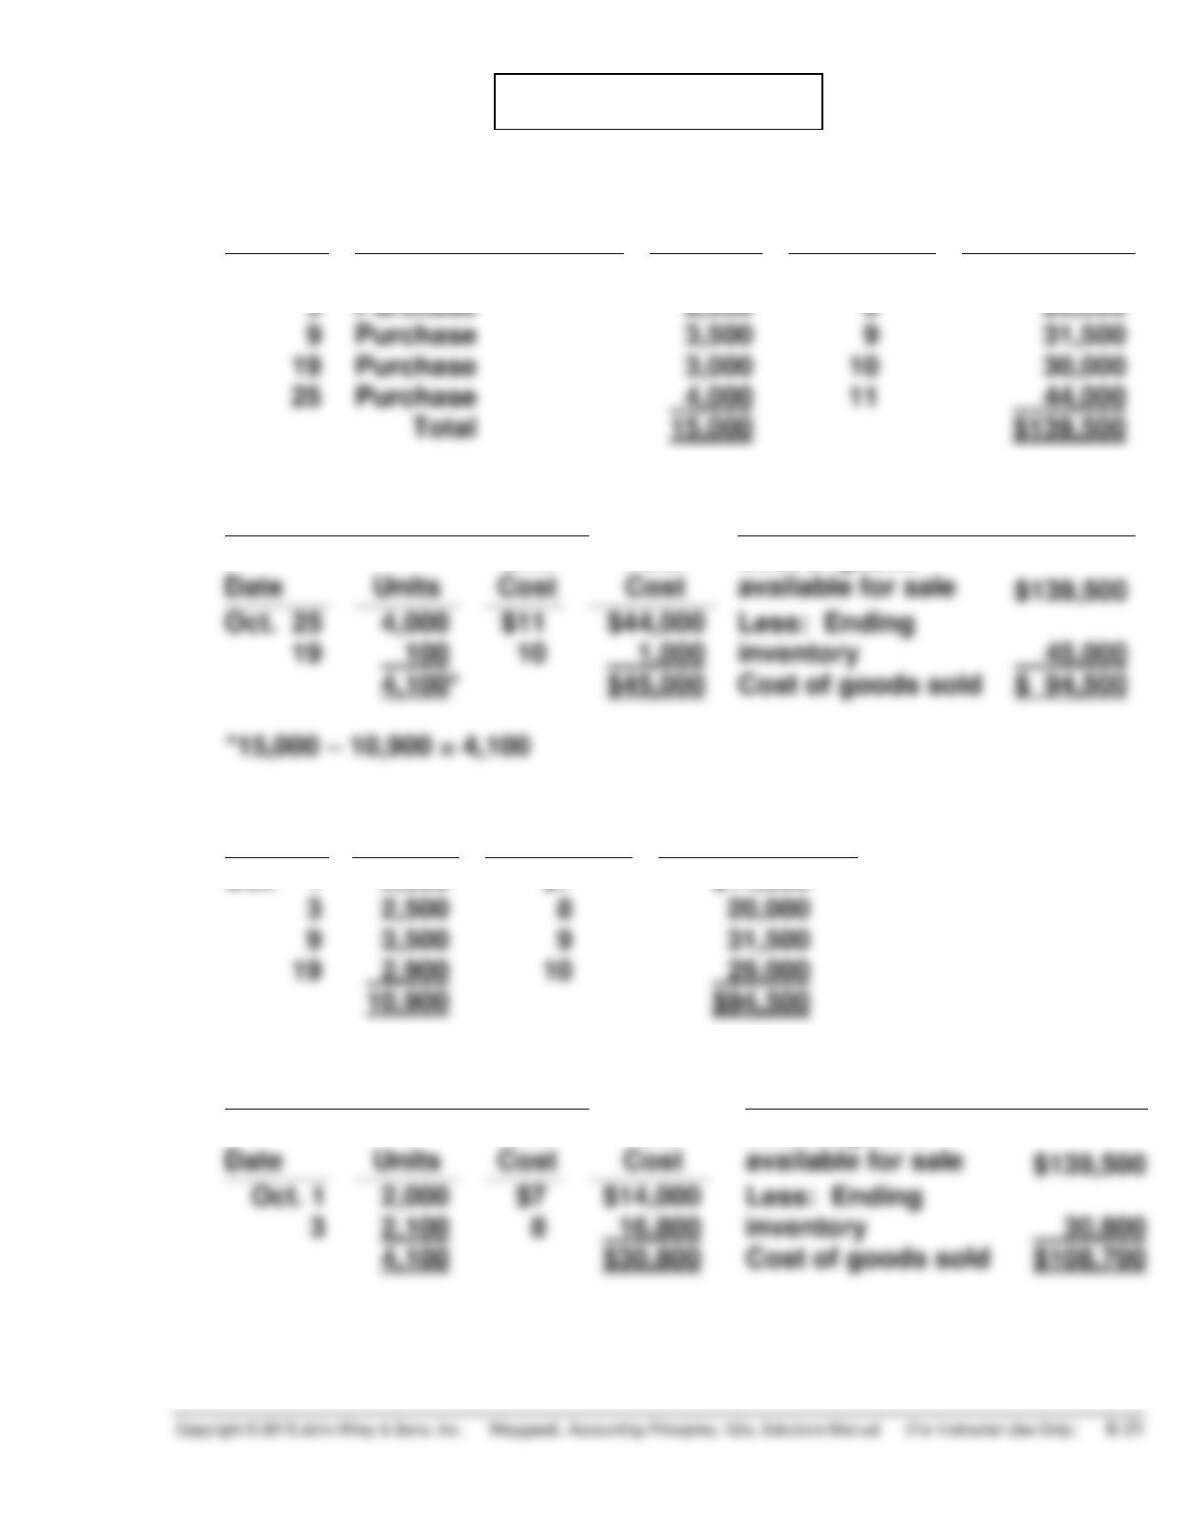
PROBLEM 6-2A
(a)
COST OF GOODS AVAILABLE FOR SALE
Date
Explanation
Units
Unit Cost
Total Cost
Oct. 1
Beginning Inventory
2,000
$7
$ 14,000
3
Purchase
2,500
8
20,000
Purchase
3,500
Purchase
Purchase
(b)
FIFO
(1)
Ending Inventory
(2)
Cost of Goods Sold
Date
Units
Unit
Cost
Total
Cost
Cost of goods
available for sale
$139,500
$11
Cost of goods sold
Proof of Cost of Goods Sold
Date
Units
Unit Cost
Total Cost
Oct. 1
2,000
$7
$14,000
3
2,500
8
20,000
9
3,500
9
10
LIFO
(1)
Ending Inventory
(2)
Cost of Goods Sold
Date
Units
Unit
Cost
Total
Cost
Cost of goods
available for sale
$139,500
8
Cost of goods sold
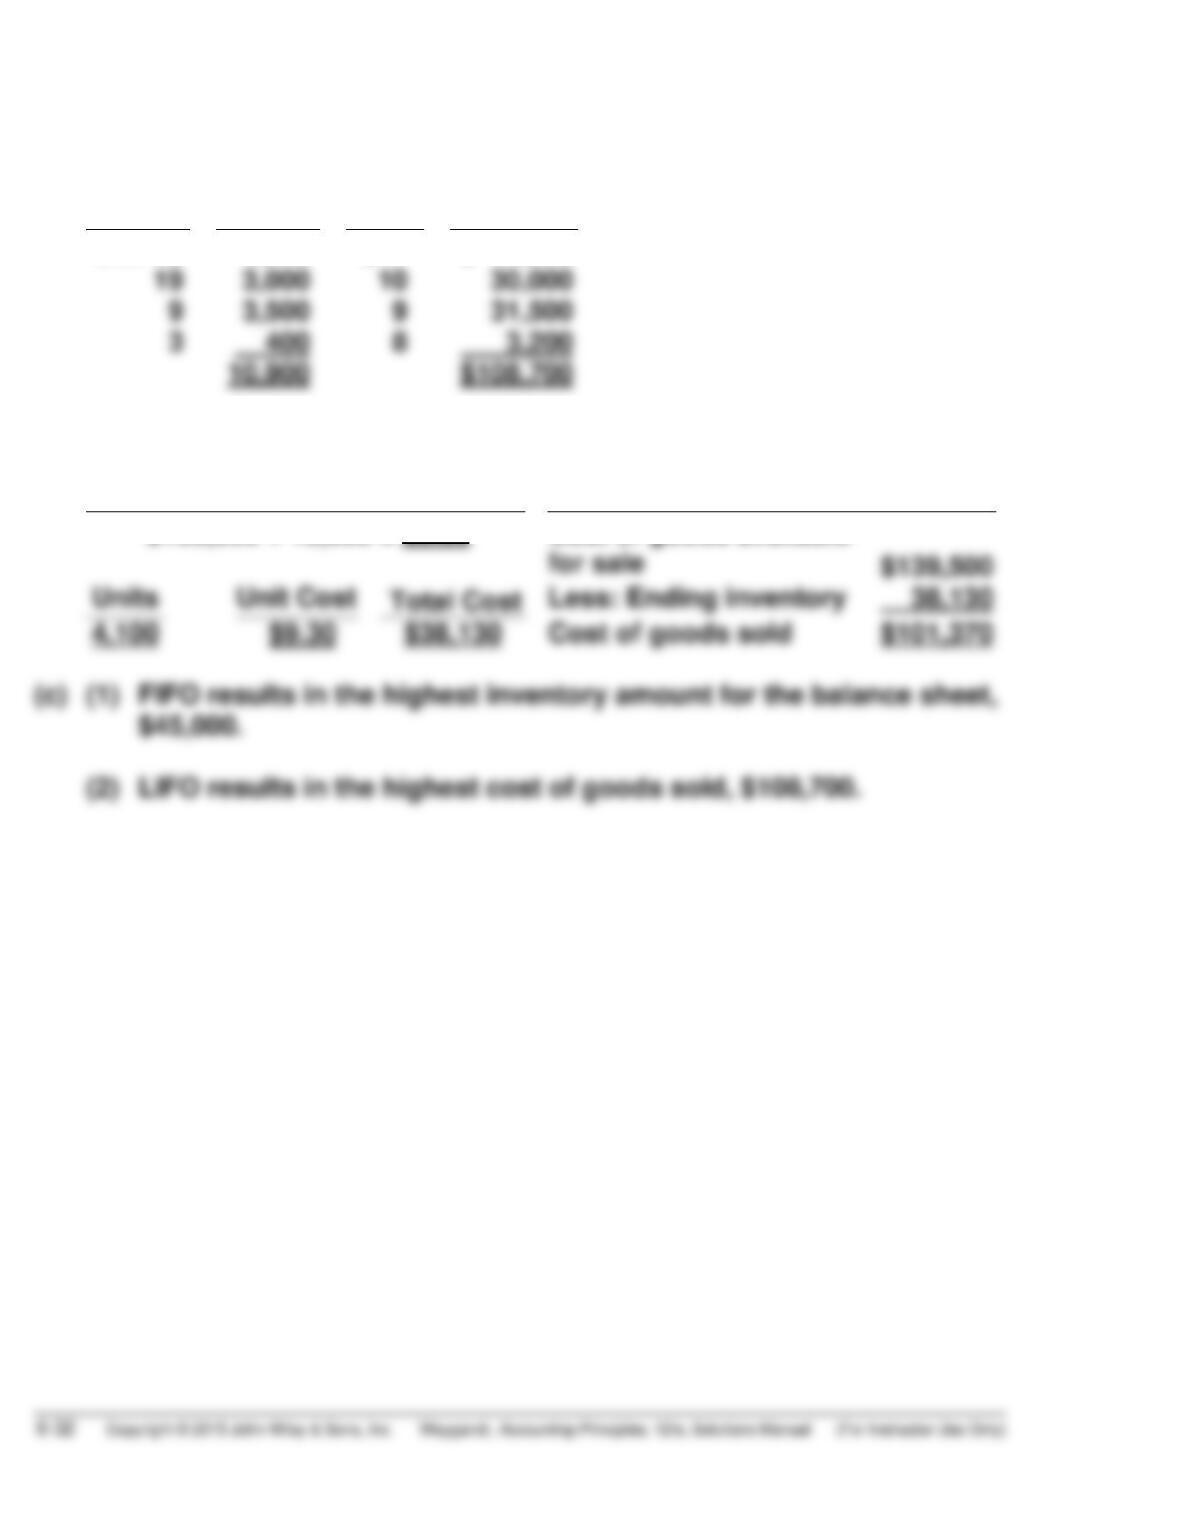
PROBLEM 6-2A (Continued)
Proof of Cost of Goods Sold
Date
Units
Unit
Cost
Total
Cost
Oct. 25
4,000
$11
$ 44,000
9
9
AVERAGE COST
(1)
Ending Inventory
(2)
Cost of Goods Sold
$139,500 ÷ 15,000 = $9.30
Cost of goods available
for sale
Total Cost
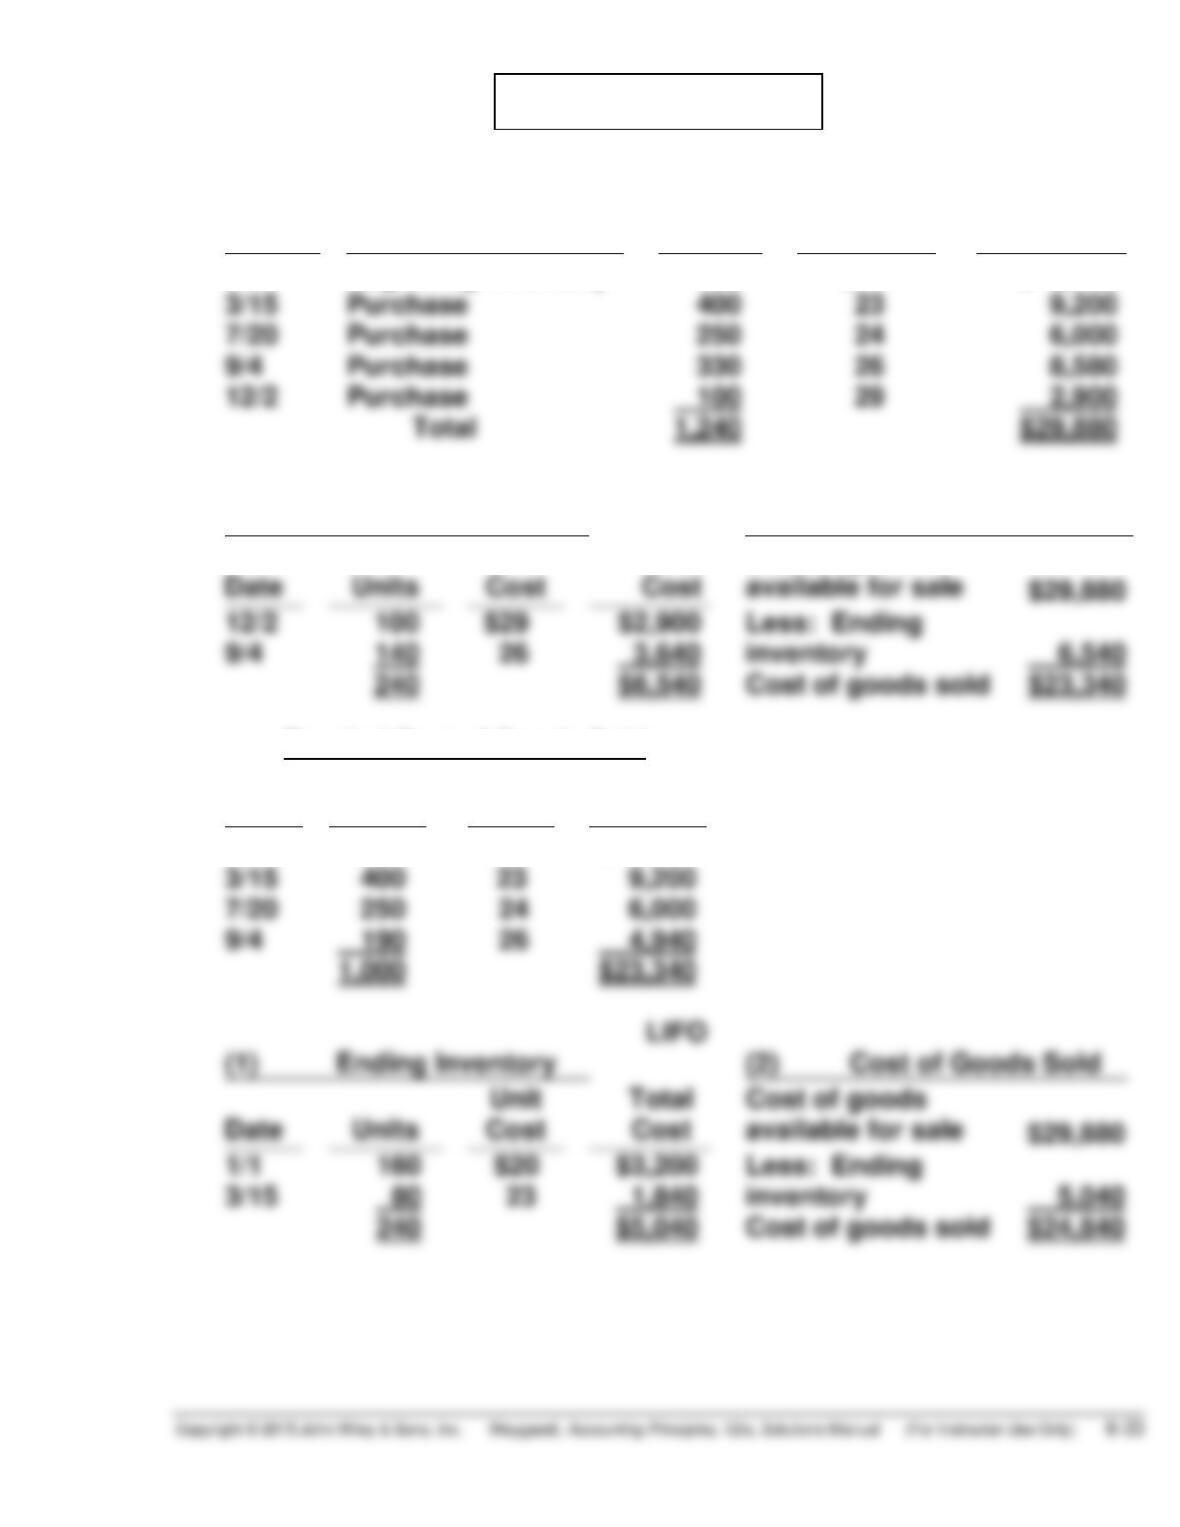
PROBLEM 6-3A
(a)
COST OF GOODS AVAILABLE FOR SALE
Date
Explanation
Units
Unit Cost
Total Cost
1/1
Beginning Inventory
160
$20
$ 3,200
3/15
Purchase
400
23
9,200
7/20
Purchase
250
9/4
Purchase
330
26
12/2
Purchase
100
29
(b)
FIFO
(1)
Ending Inventory
(2)
Cost of Goods Sold
Date
Units
Unit
Cost
Total
Cost
Cost of goods
available for sale
12/2
$29
9/4
Cost of goods sold
Proof of Cost of Goods Sold
Date
Units
Unit
Cost
Total
Cost
1/1
160
$20
$ 3,200
3/15
400
23
9,200
7/20
9/4
190
4,940
1,000
Ending Inventory
(2)
1/1
3/15
Cost of goods sold
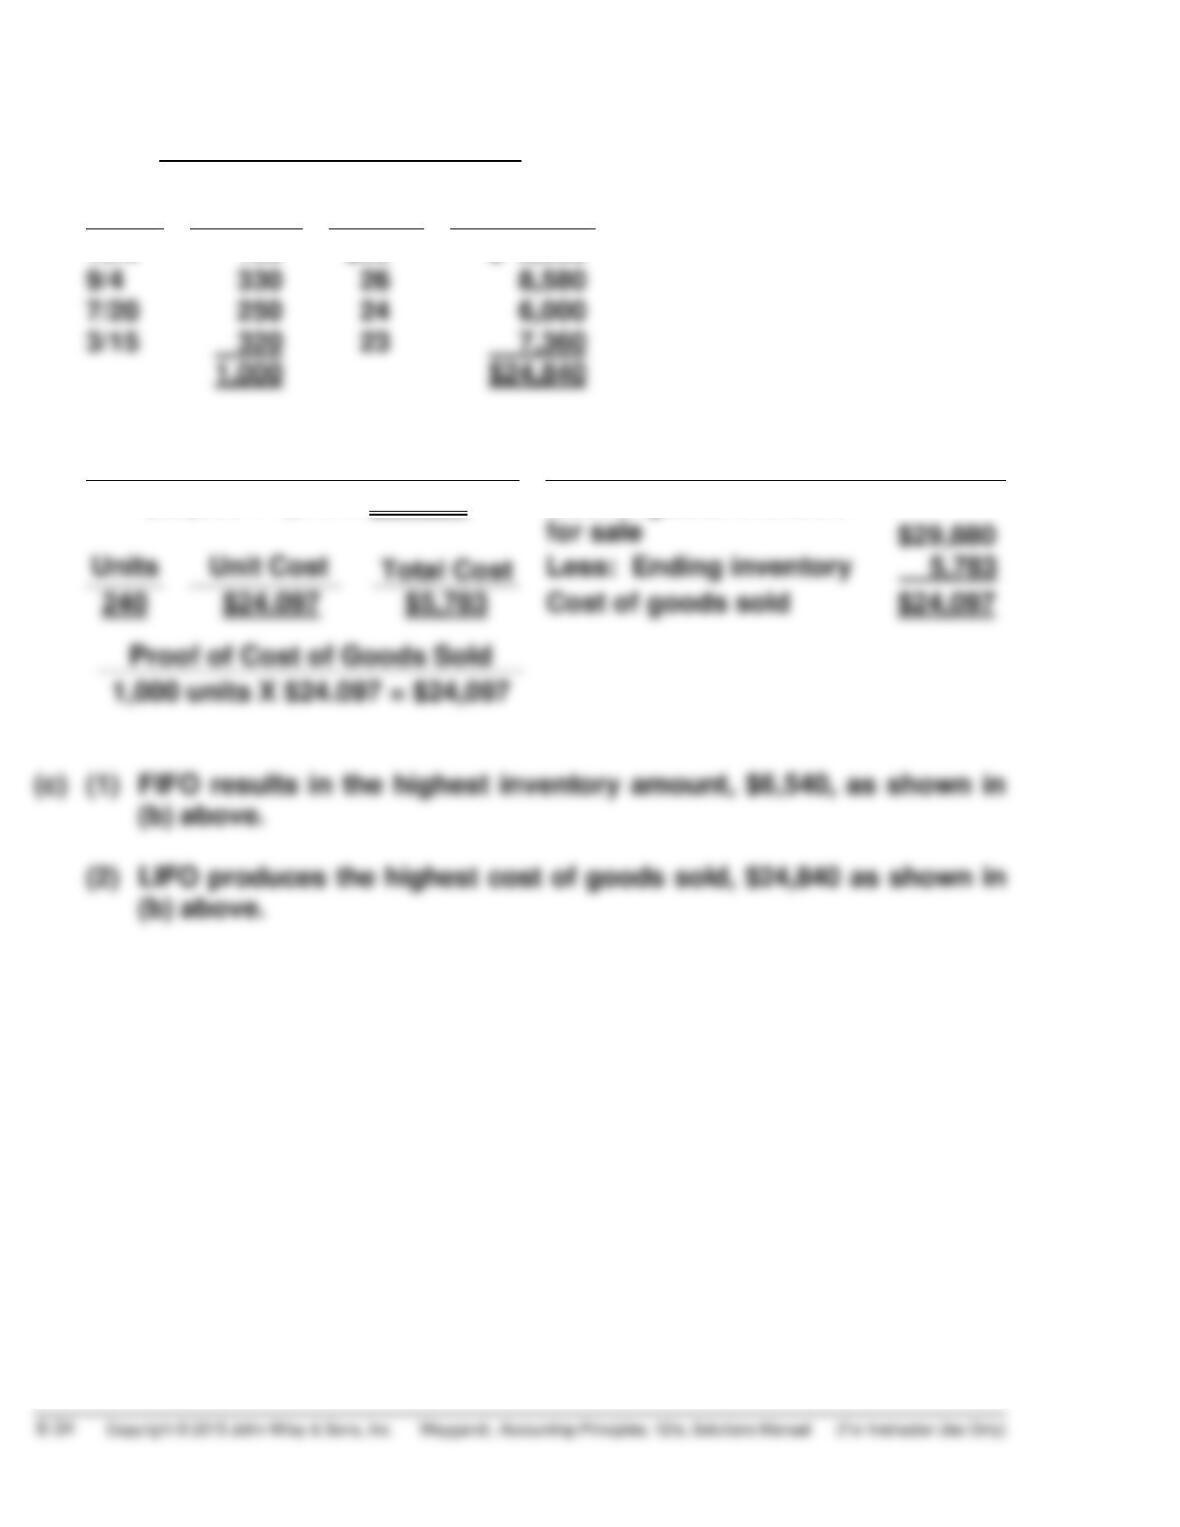
PROBLEM 6-3A (Continued)
Proof of Cost of Goods Sold
Date
Units
Unit
Cost
Total Cost
12/2
100
$29
$ 2,900
9/4
330
26
8,580
7/20
250
3/15
23
AVERAGE COST
(1)
Ending Inventory
(2)
Cost of Goods Sold
$29,880 ÷ 1,240 = $24.097
Cost of goods available
for sale
Cost of goods sold
(c) (1) FIFO results in the highest inventory amount, $6,540, as shown in
(b) above.
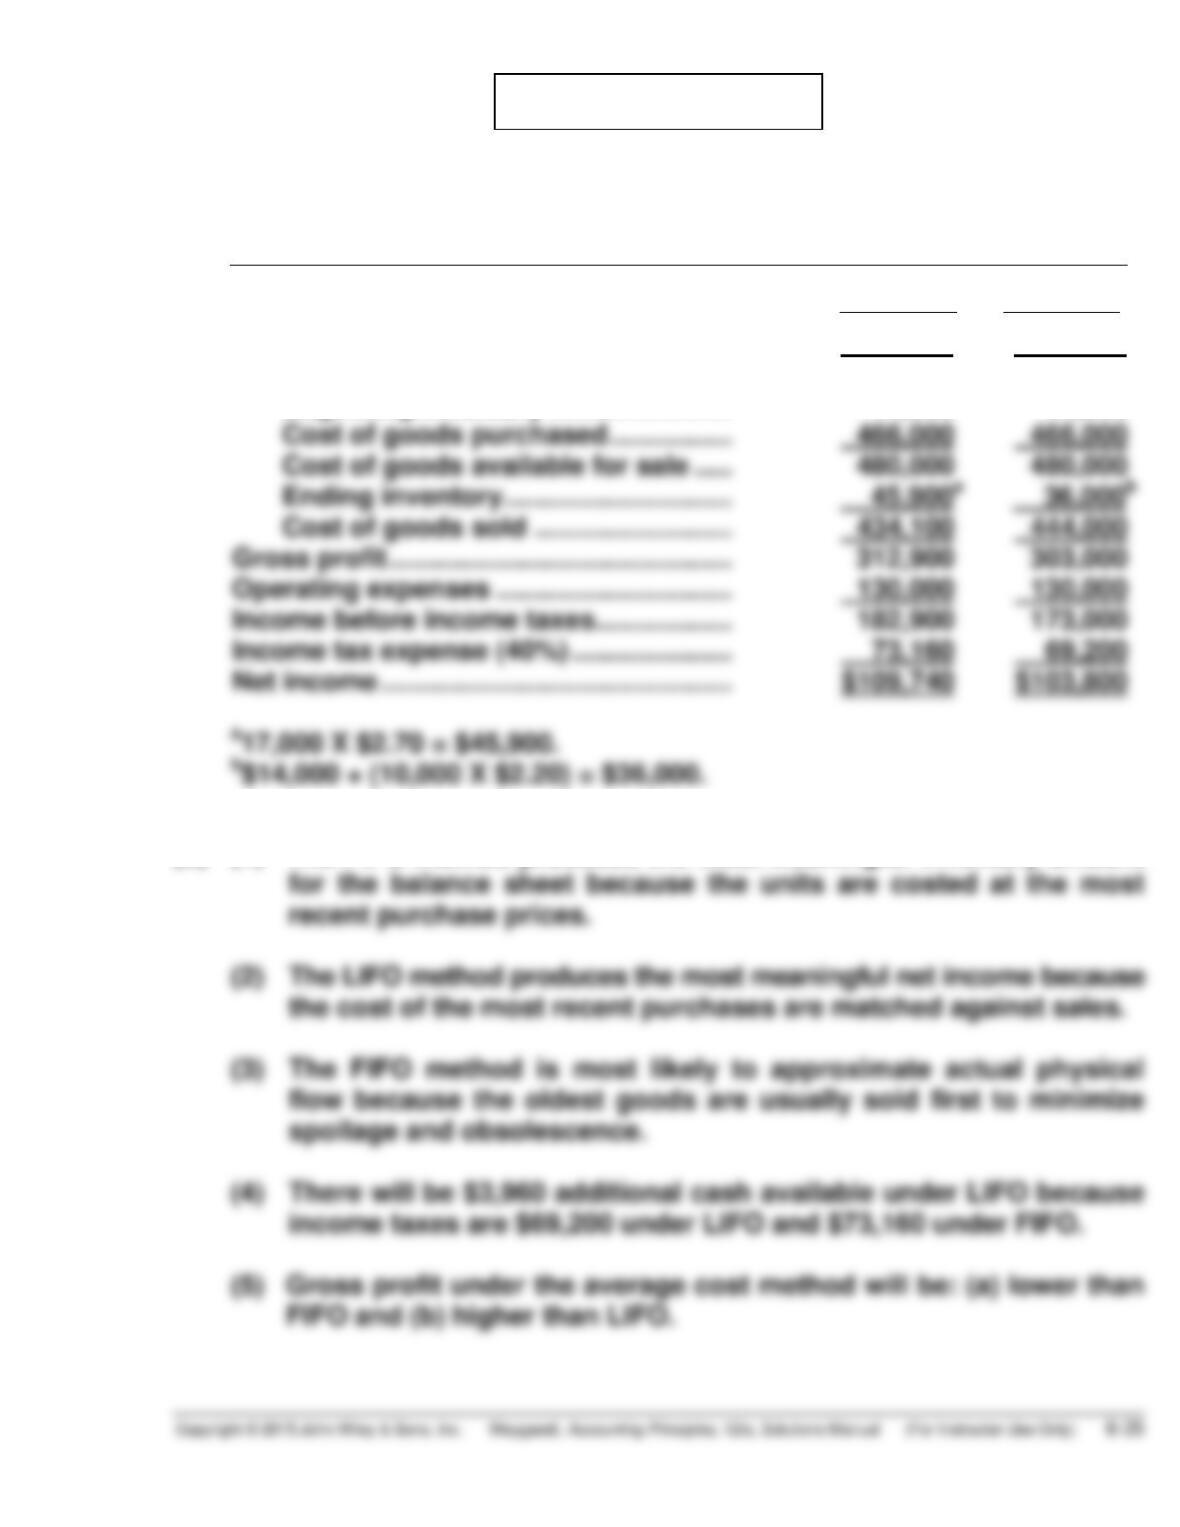
PROBLEM 6-4A
(a) GRESA INC.
Condensed Income Statements
For the Year Ended December 31, 2017
FIFO
LIFO
Sales revenue ………………………………….. $747,000 $747,000
Cost of goods sold
Beginning inventory …………………… 14,000 14,000
Cost of goods purchased ……………. 466,000 466,000
Cost of goods available for sale ….. 480,000 480,000
(b) (1) The FIFO method produces the most meaningful inventory amount
for the balance sheet because the units are costed at the most
recent purchase prices.
(4) There will be $3,960 additional cash available under LIFO because
income taxes are $69,200 under LIFO and $73,160 under FIFO.
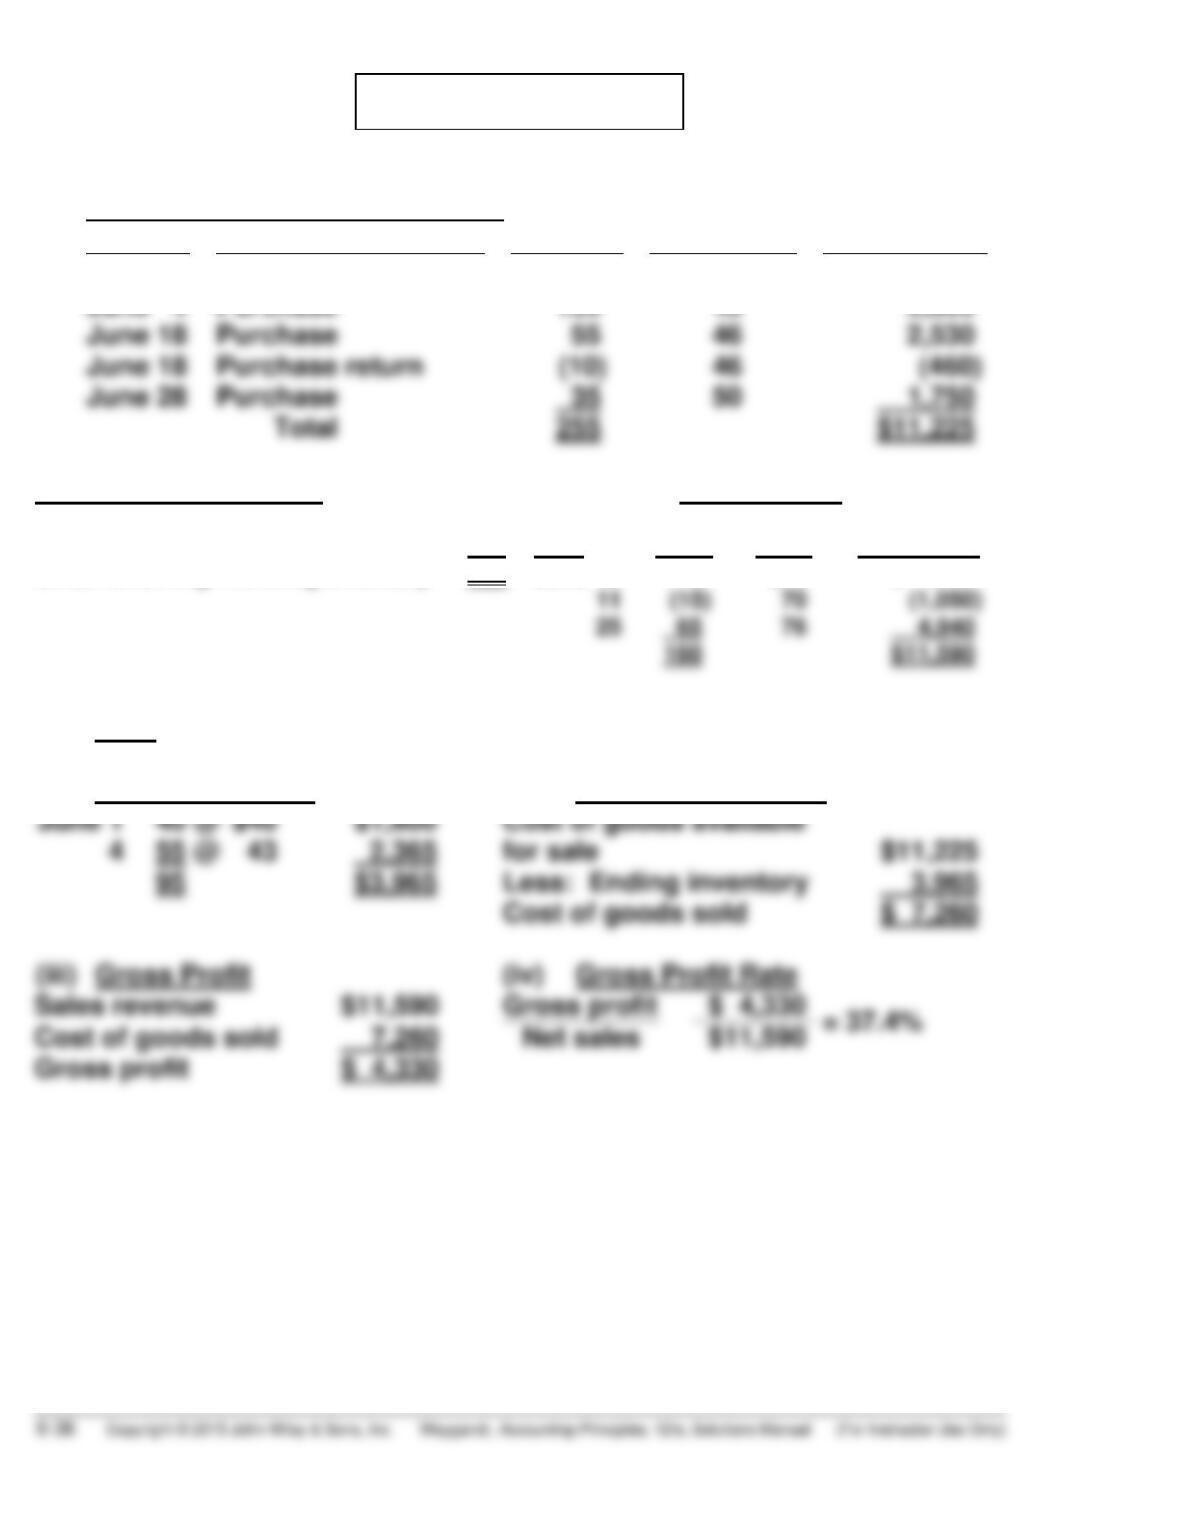
PROBLEM 6-5A
(a)
Cost of Goods Available for Sale
Date
Explanation
Units
Unit Cost
Total Cost
June 1
Beginning Inventory
40
$40
$ 1,600
June 4
Purchase
135
43
5,805
June 18
Purchase
55
2,530
June 18
Purchase return
46
(460)
June 28
Purchase
50
1,750
Ending Inventory in Units:
Sales Revenue
Units available for sale
255
Unit
Sales (110 – 15 + 65)
160
Date
Units
Price
Total Sales
Units remaining in ending inventory
95
June 10
110
$70
$ 7,700
(15)
65
4,940
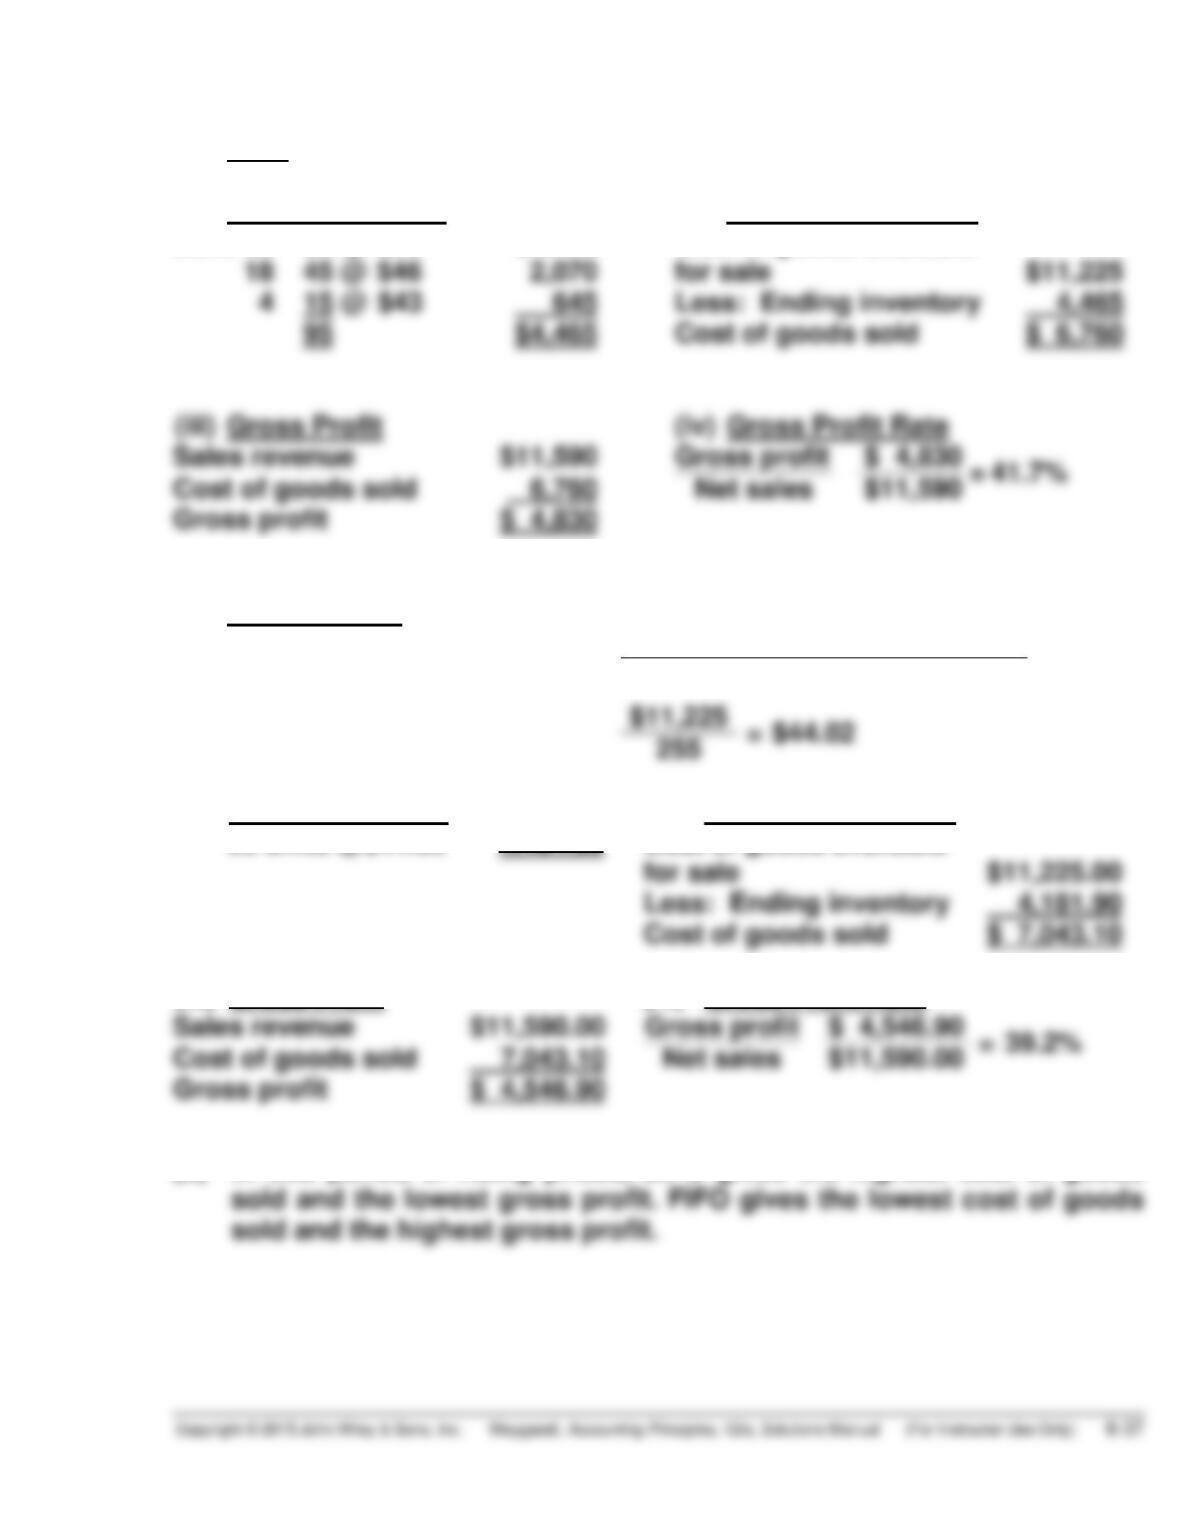
(1)
LIFO
(i)
Ending Inventory
(ii)
Cost of Goods Sold
June 1
4
40 @ $40
55 @ 43
$1,600
2,365
Cost of goods available
for sale
$11,225
Less: Ending inventory
Cost of goods sold
(iii)
Gross Profit
(iv)
Gross Profit Rate
Sales revenue
Gross profit
Cost of goods sold
Gross profit
PROBLEM 6-5A (Continued)
(2)
FIFO
(i)
Ending Inventory
(ii)
Cost of Goods Sold
June 28
18
35 @ $50
45 @ $46
$1,750
2,070
Cost of goods available
for sale
$11,225
Less: Ending inventory
Cost of goods sold
(iii)
Gross Profit
(iv)
Gross Profit Rate
Sales revenue
Gross profit
$ 4,830
Cost of goods sold
$11,590
Gross profit
(3)
Average-Cost
Weighted-average cost per unit:
Cost of goods available for sale
Units available for sale
(i)
Ending Inventory
(ii)
Cost of Goods Sold
95 units @$44.02
4,181.90
Cost of goods available
for sale
$11,225.00
Less: Ending inventory
4,181.90
Cost of goods sold
$ 7,043.10
(iii)
Gross Profit
(iv)
Gross Profit Rate
Sales revenue
$11,590.00
Gross profit
$ 4,546.90
Cost of goods sold
Gross profit
$ 4,546.90
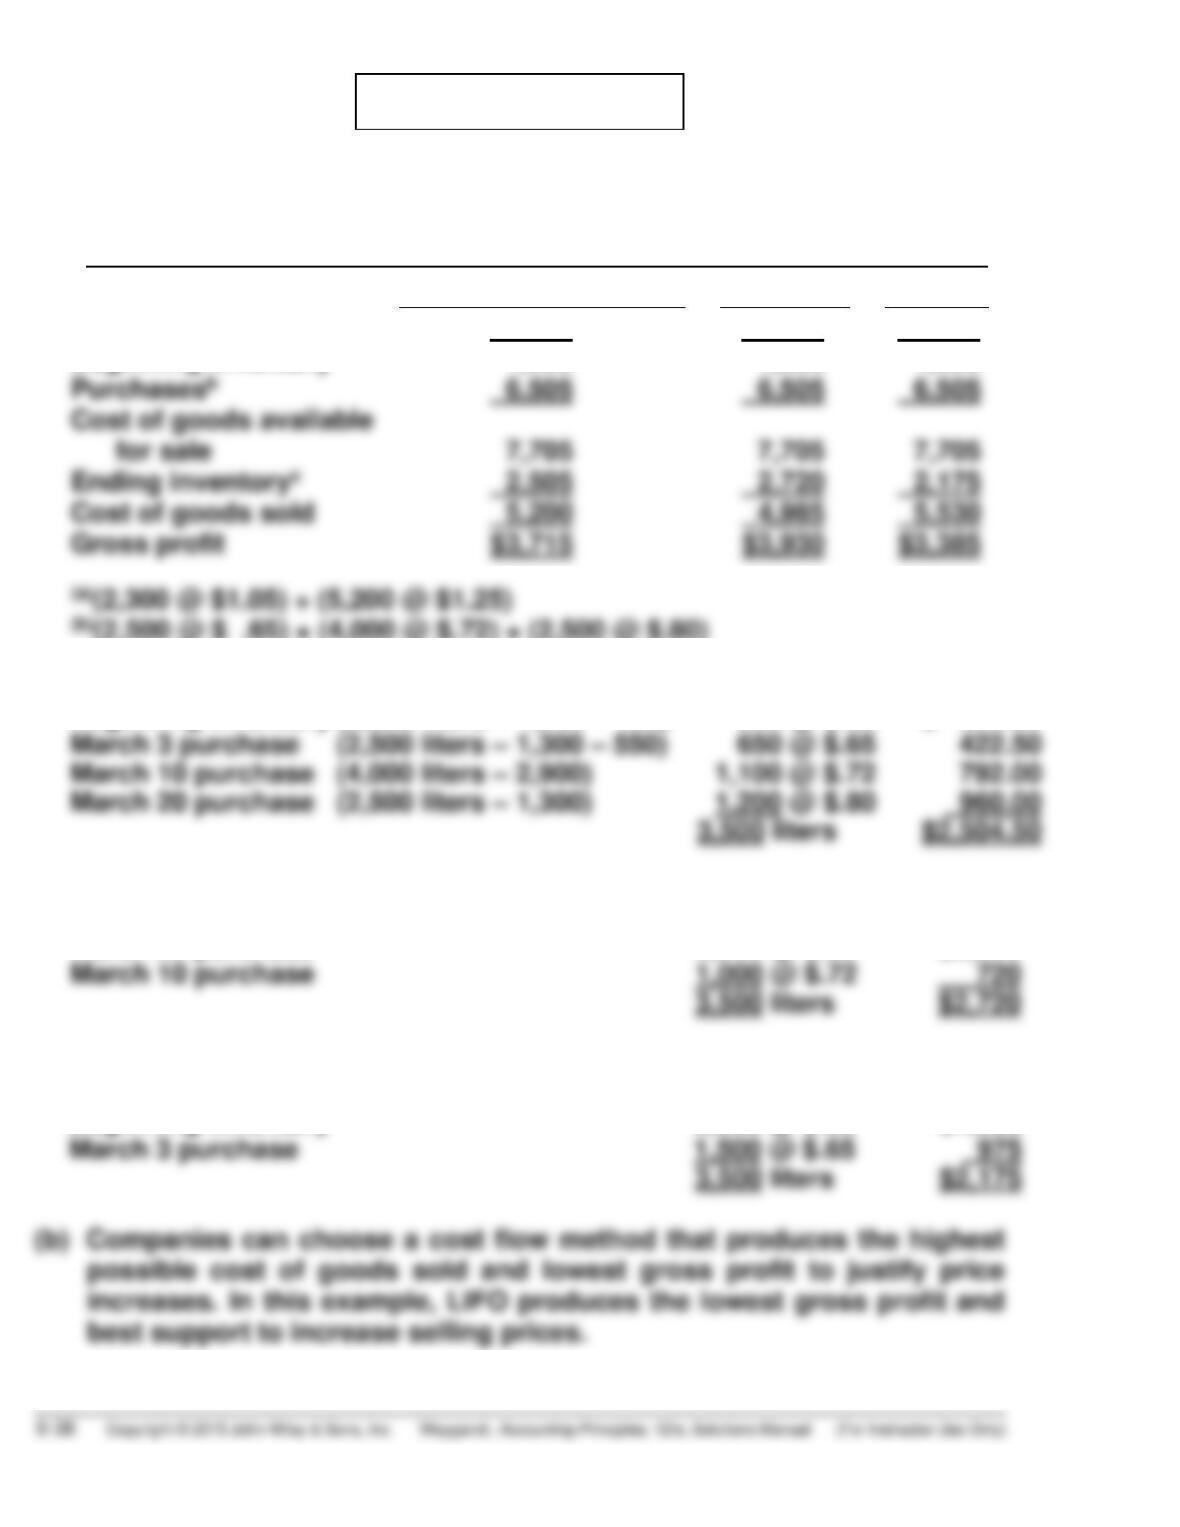
PROBLEM 6-6A
(a) GOBLER INC.
Income Statement (partial)
For the Year Ended December 31, 2017
Specific Identification
FIFO
LIFO
Sales revenuea
$8,915
$8,915
$8,915
Beginning inventory
1,200
1,200
1,200
Cost of goods sold
Gross profit
$3,715
$3,930
$3,385
(a)(2,300 @ $1.05) + (5,200 @ $1.25)
(c)Specific identification ending inventory consists of:
Beginning inventory (2,000 liters – 1,000 – 450)
550 @ $.60
$ 330.00
March 3 purchase (2,500 liters – 1,300 – 550)
650 @ $.65
March 10 purchase (4,000 liters – 2,900)
March 20 purchase (2,500 liters – 1,300)
FIFO ending inventory consists of:
March 20 purchase
2,500 @ $.80
$2,000
March 10 purchase
720
LIFO ending inventory consists of:
Beginning inventory
2,000 @ $.60
$1,200
March 3 purchase
(b) Companies can choose a cost flow method that produces the highest
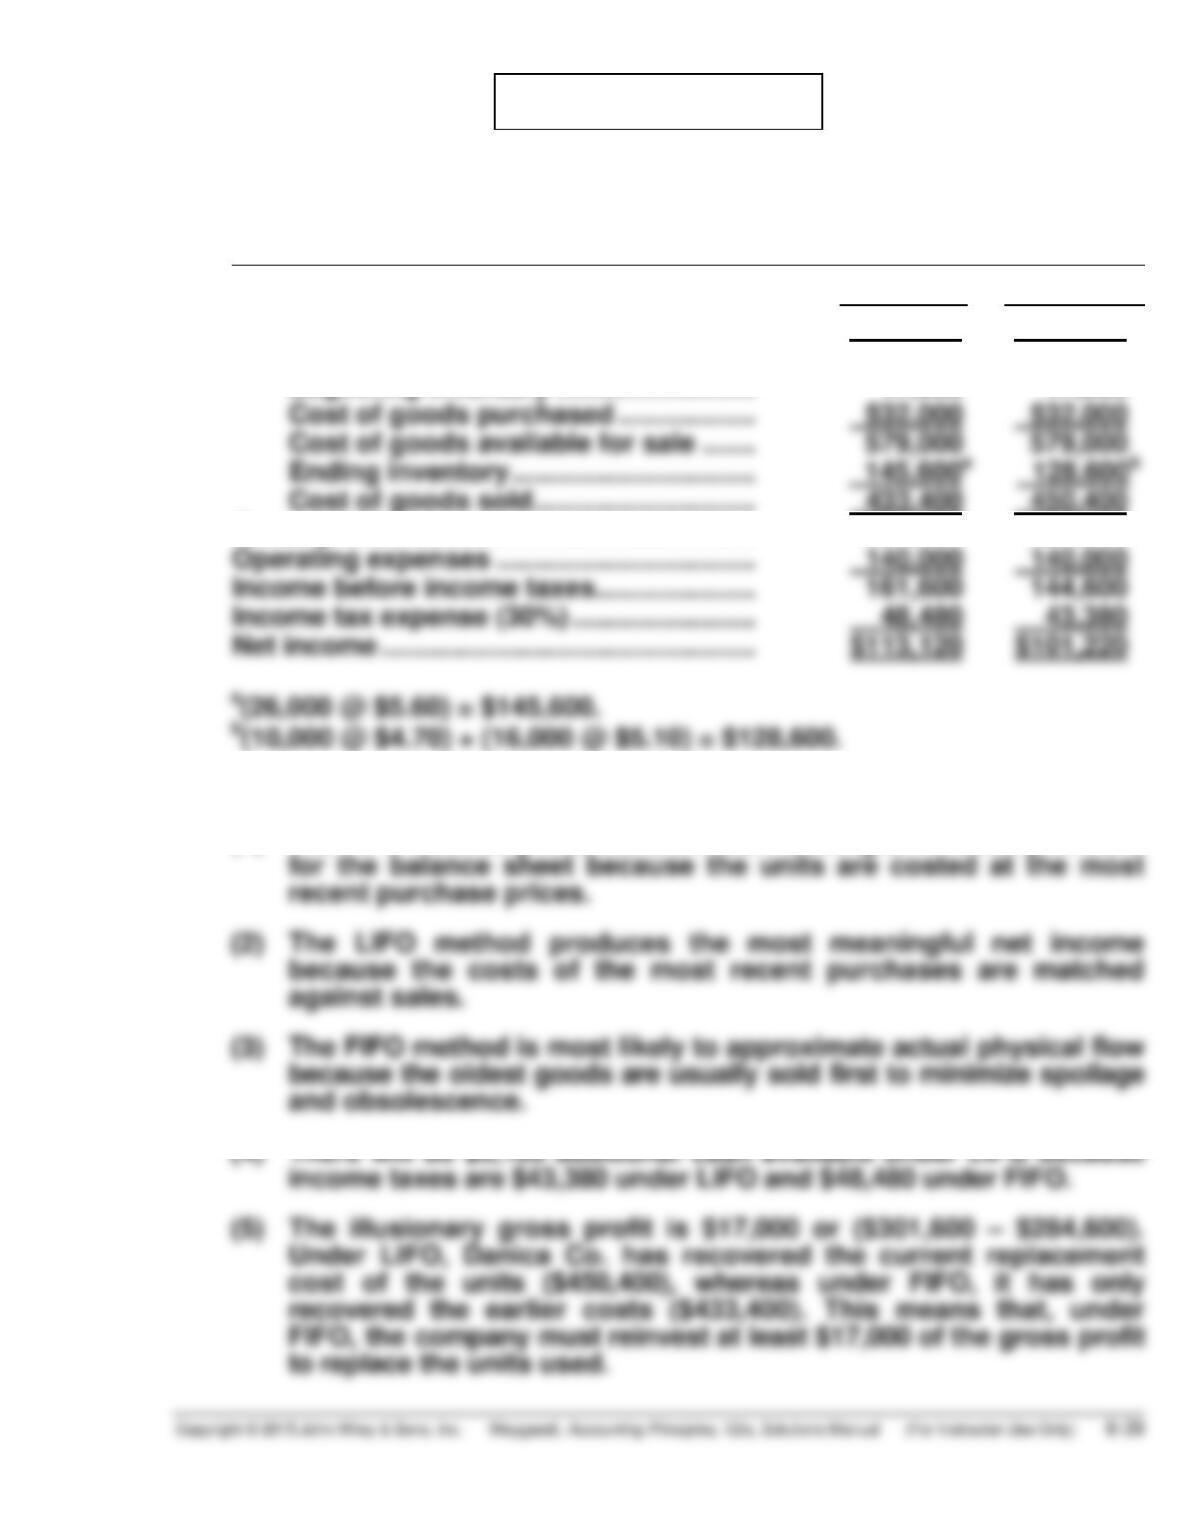
PROBLEM 6-7A
(a) DANICA CO.
Condensed Income Statement
For the Year Ended December 31, 2017
FIFO
LIFO
Sales revenue …………………………………….. $735,000 $735,000
Cost of goods sold
Beginning inventory …………………….. 47,000 47,000
Cost of goods purchased ……………… 532,000 532,000
Gross profit ………………………………………… 301,600 284,600
Operating expenses ……………………………. 140,000 140,000
a(26,000 @ $5.60) = $145,600.
(b) Answers to questions:
(1) The FIFO method produces the most meaningful inventory amount
for the balance sheet because the units are costed at the most
recent purchase prices.
(4) There will be $5,100 additional cash available under LIFO because
income taxes are $43,380 under LIFO and $48,480 under FIFO.
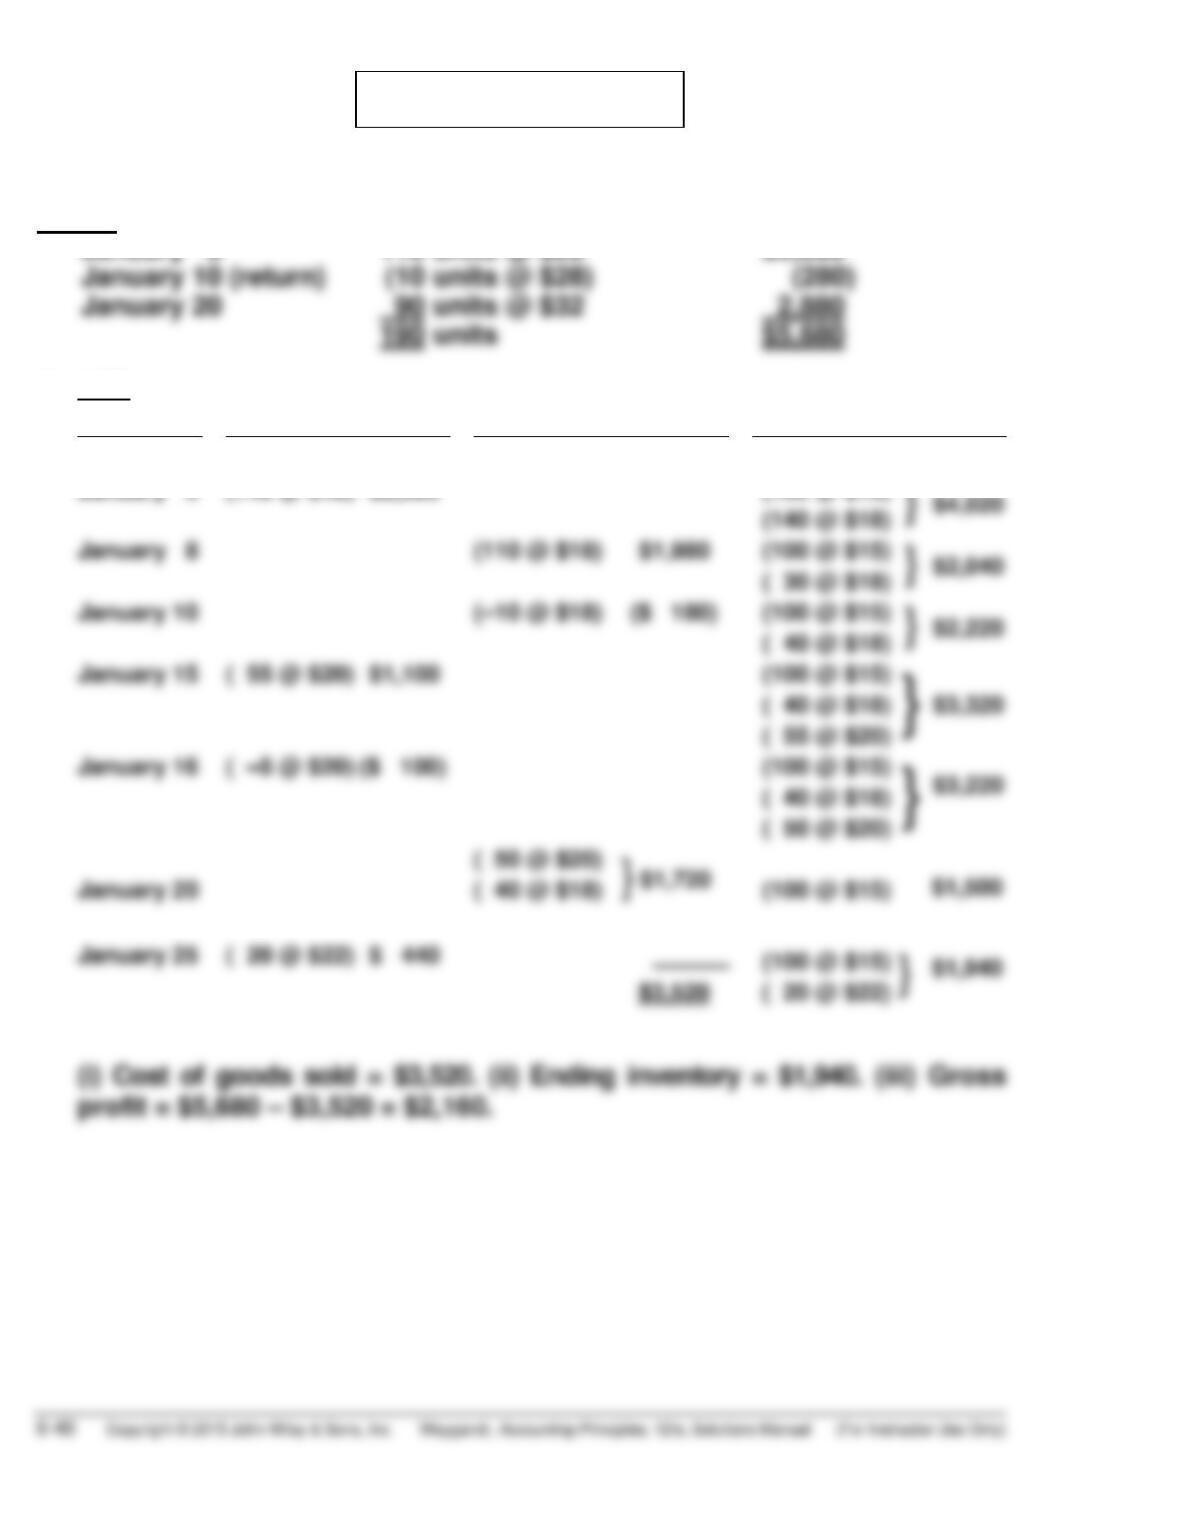
*PROBLEM 6-8A
(a)
Sales:
January 8
110 units @ $28
$3,080
January 10 (return)
(10 units @ $28)
January 20
90 units @ $32
190 units
$5,680
(1)
LIFO
Date
Purchases
Cost of Goods Sold
Balance
January 1
(100 @ $15)
$1,500
January 5
(140 @ $18) $2,520
(100 @ $15)
}
$4,020
(140 @ $18)
January 8
(110 @ $18) $1,980
(100 @ $15)
( 30 @ $18)
January 10
(100 @ $15)
( 40 @ $18)
January 15
( 55 @ $20) $1,100
(100 @ $15)
}
$3,320
( 40 @ $18)
( 55 @ $20)
January 16
( –5 @ $20) ($ 100)
(100 @ $15)
}
( 50 @ $20)
( 50 @ $20)
}
$1,720
January 20
( 40 @ $18)
(100 @ $15)
}
(100 @ $15)
$3,520
( 20 @ $22)
$1,500