CHAPTER 6
SOLUTIONS TO EXERCISES—SET B
EXERCISE 6-1B
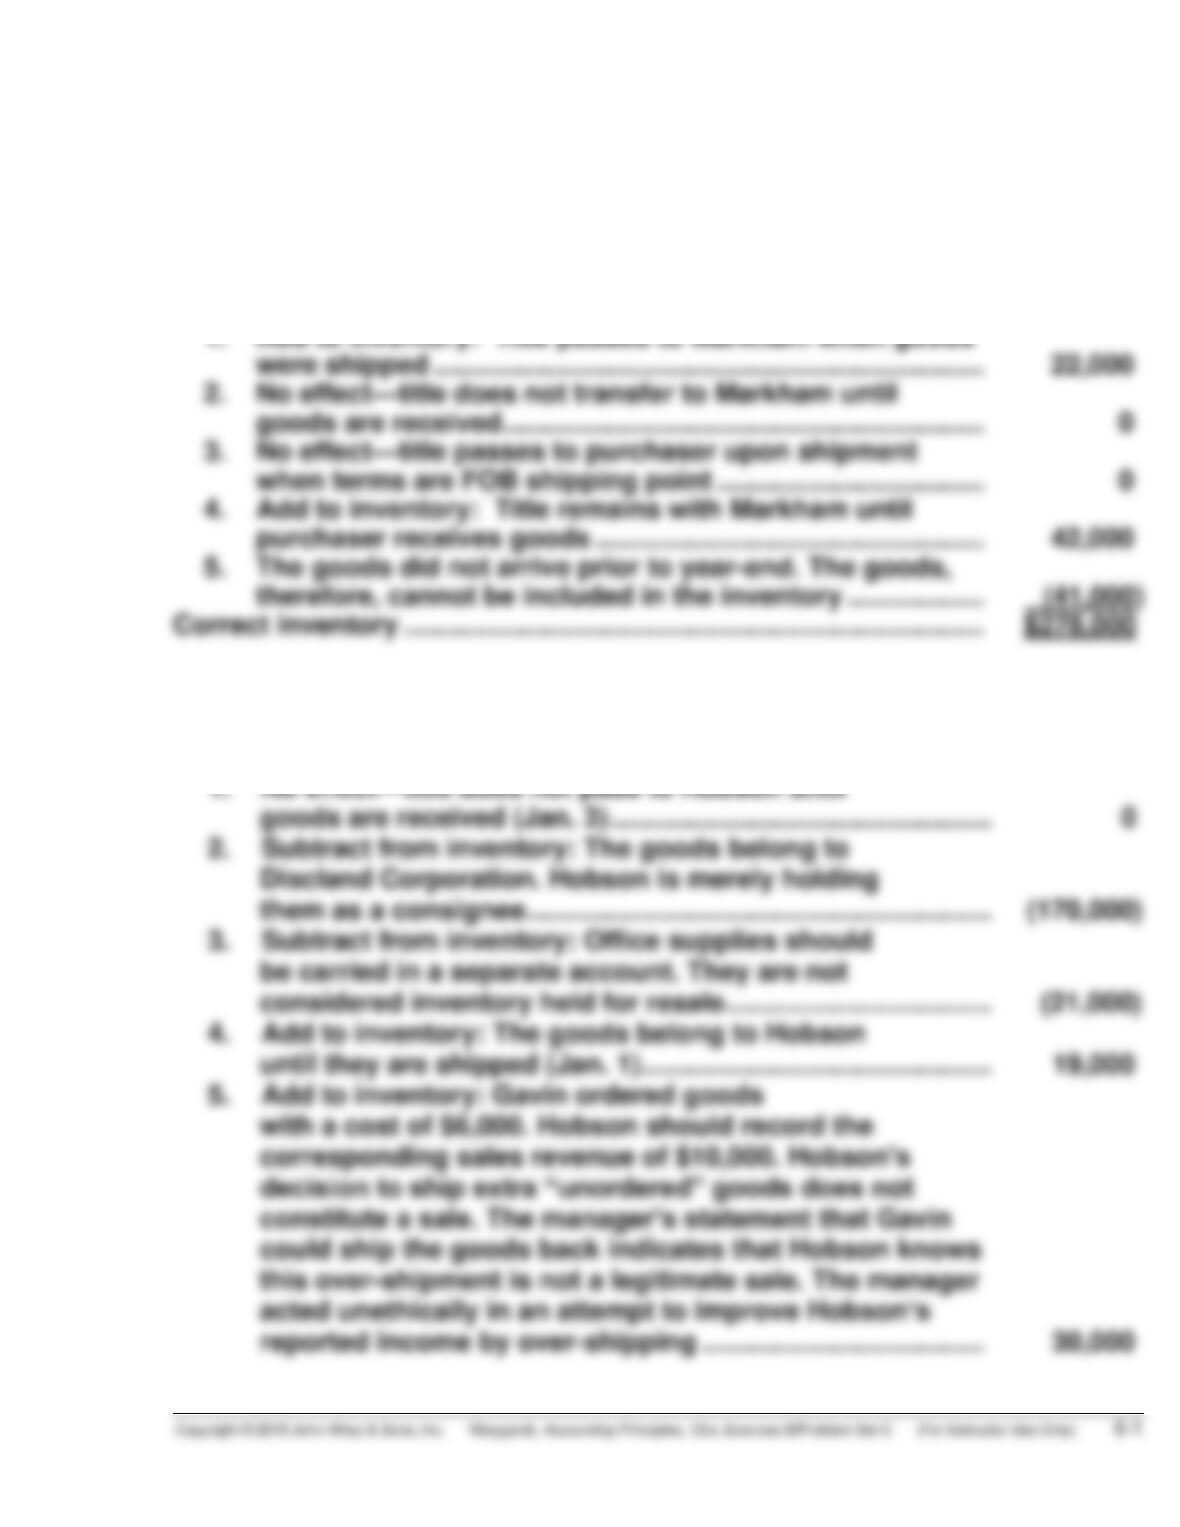
Ending inventory—physical count …………………………………………. $255,000
1. Add to inventory: Title passed to Markham when goods
were shipped ……………………………………………………………… 22,000
2. No effect—title does not transfer to Markham until
goods are received ……………………………………………………… 0
EXERCISE 6-2B
Ending inventory—as reported ………………………………………………. $550,000
1. No effect—title does not pass to Hobson until
goods are received (Jan. 3) ………………………………………….. 0
2. Subtract from inventory: The goods belong to
Discland Corporation. Hobson is merely holding
them as a consignee ……………………………………………………. (170,000)
3. Subtract from inventory: Office supplies should
5. Add to inventory: Gavin ordered goods
with a cost of $6,000. Hobson should record the
corresponding sales revenue of $10,000. Hobson’s
decision to ship extra “unordered” goods does not
constitute a sale. The manager’s statement that Gavin
EXERCISE 6-2B (Continued)
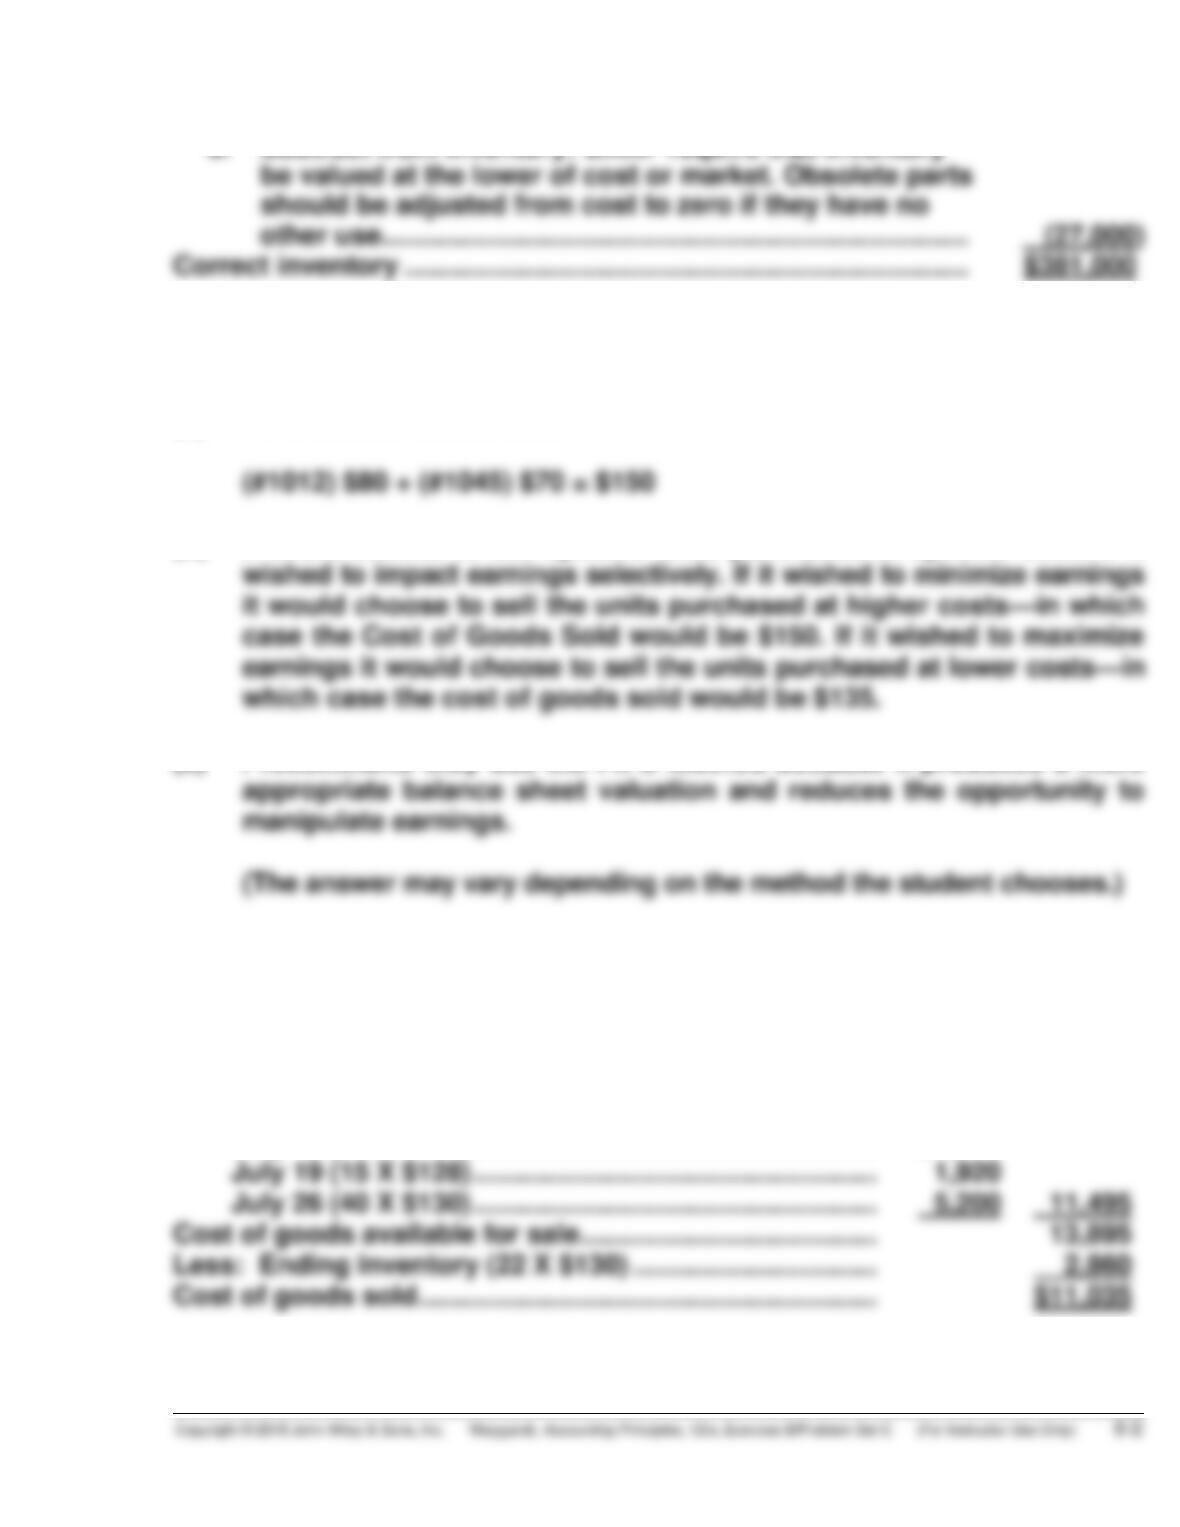
6. Subtract from inventory: GAAP require that inventory
be valued at the lower of cost or market. Obsolete parts
EXERCISE 6-3B
(a) FIFO Cost of Goods Sold
(b) It could choose to sell specific units purchased at specific costs if it
wished to impact earnings selectively. If it wished to minimize earnings
it would choose to sell the units purchased at higher costs—in which
(c) I recommend they use the FIFO method because it produces a more
appropriate balance sheet valuation and reduces the opportunity to
manipulate earnings.
EXERCISE 6-4B
FIFO
Beginning inventory (20 X $120) ……………………………….. $ 2,400
Purchases
July 12 (35 X $125) …………………………………………….. $4,375
July 19 (15 X $128) …………………………………………….. 1,920
EXERCISE 6-4B (Continued)
Proof
Date
Units
Unit Cost
Total Cost
7/1
20
$120
$ 2,400
7/12
35
7/19
15
7/26
18
88
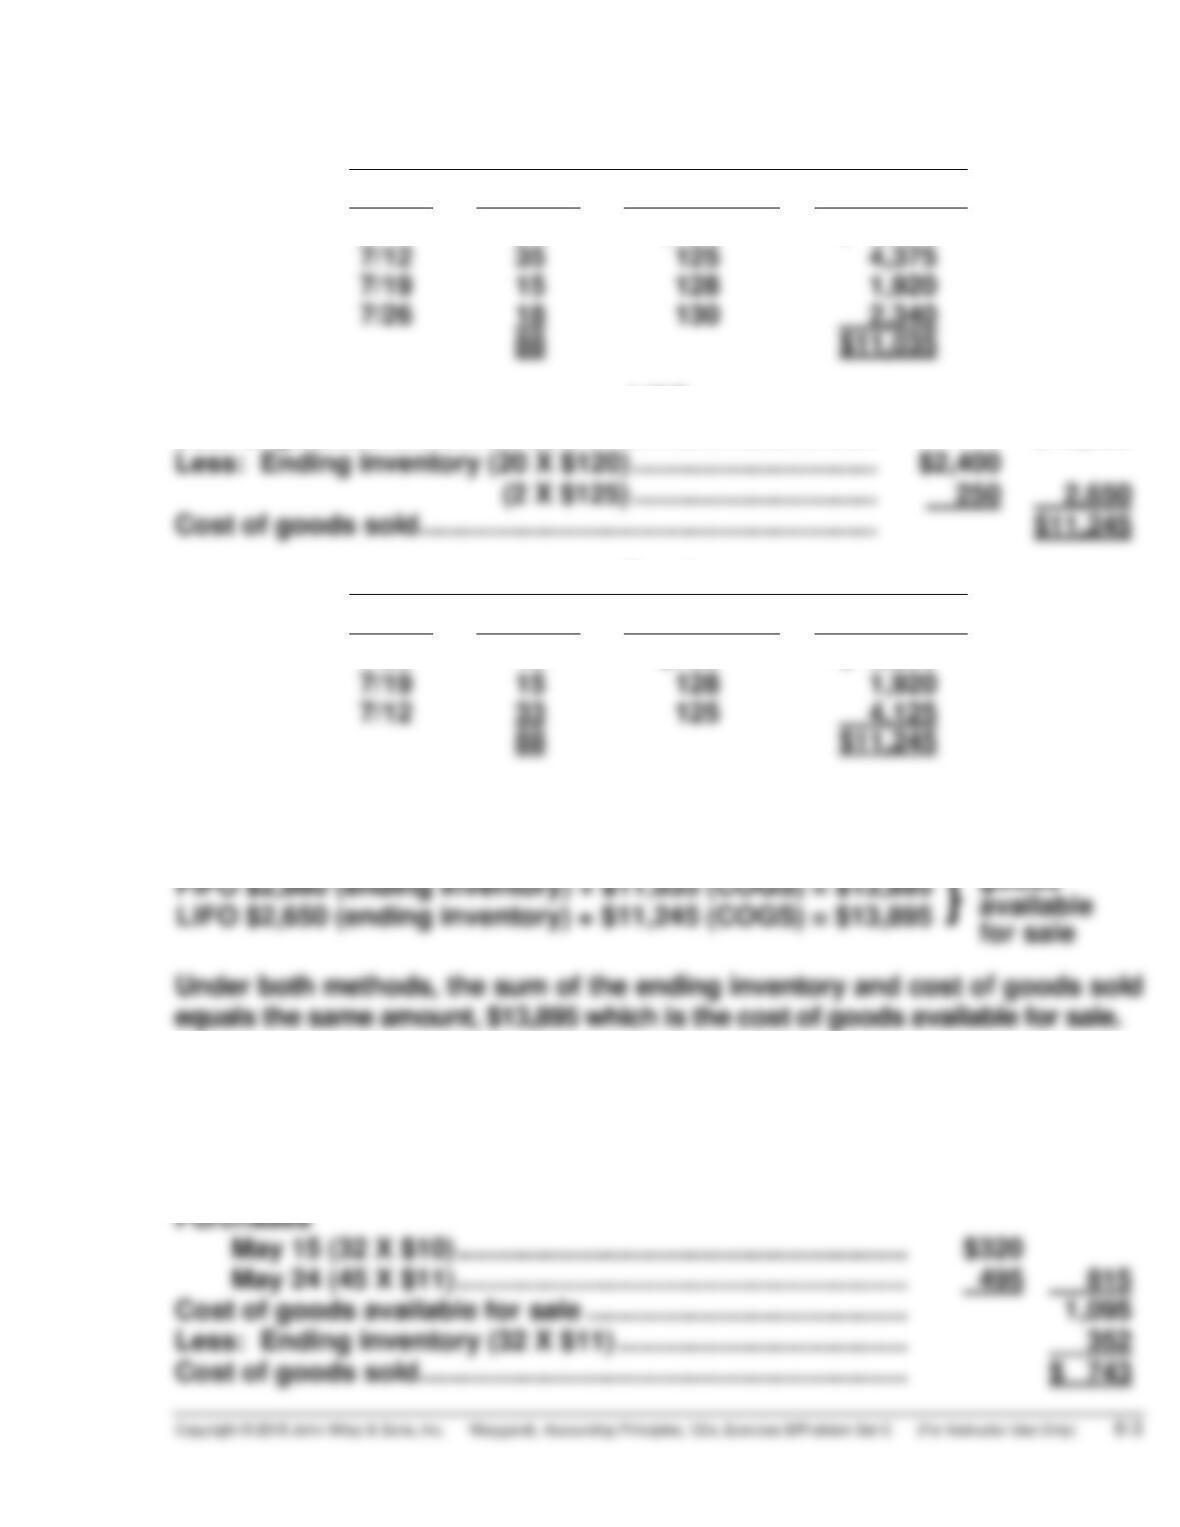
LIFO
Cost of goods available for sale ……………………………….. $13,895
Less: Ending inventory (20 X $120) ………………………….. $2,400
Proof
Date
Units
Unit Cost
Total Cost
7/26
40
$130
$ 5,200
7/19
15
7/12
33
4,125
88
$11,245
(b)
Cost of
goods
EXERCISE 6-5B
FIFO
Beginning inventory (40 X $7) ………………………………………. $ 280
Purchases
May 15 (32 X $10) ………………………………………………….. $320
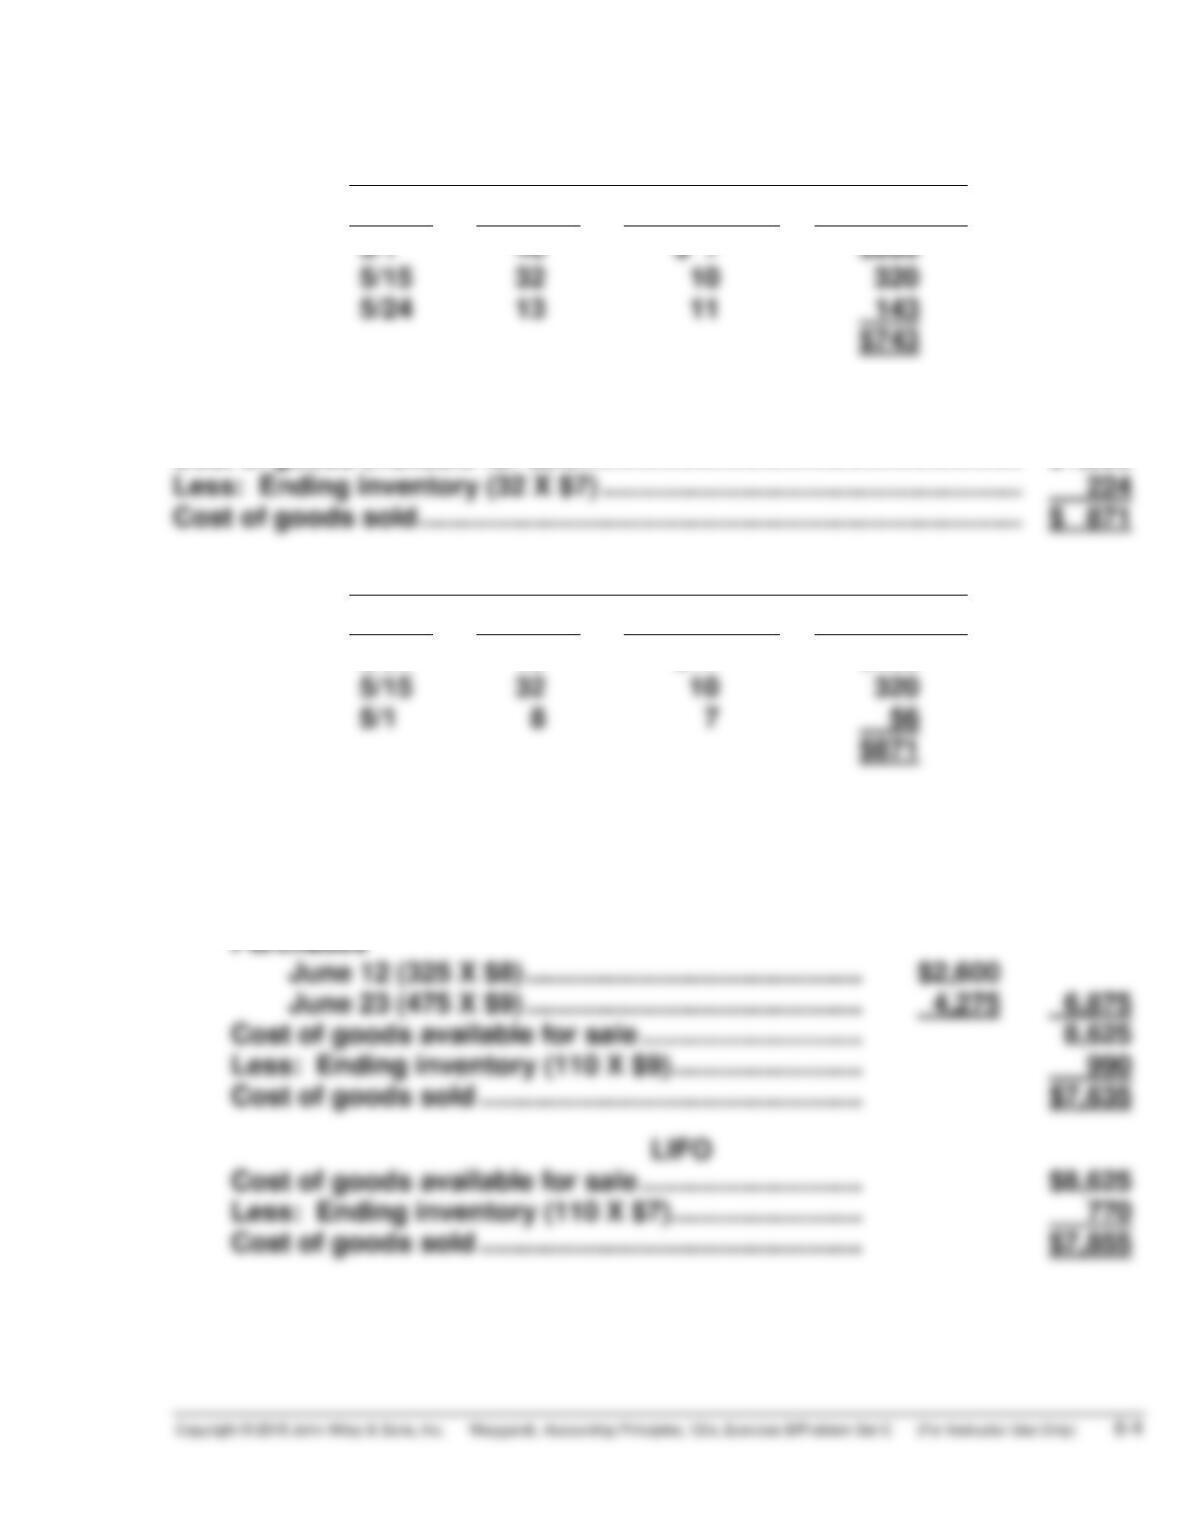
EXERCISE 6-5B (Continued)
Proof
Date
Units
Unit Cost
Total Cost
5/1
40
$ 7
$280
5/15
32
5/24
LIFO
Proof
Date
Units
Unit Cost
Total Cost
5/24
45
$495
5/15
32
5/1
EXERCISE 6-6B
(a) FIFO
Beginning inventory (250 X $7)…………………………. $1,750
Purchases
June 12 (325 X $8) …………………………………….. $2,600
EXERCISE 6-6B (Continued)
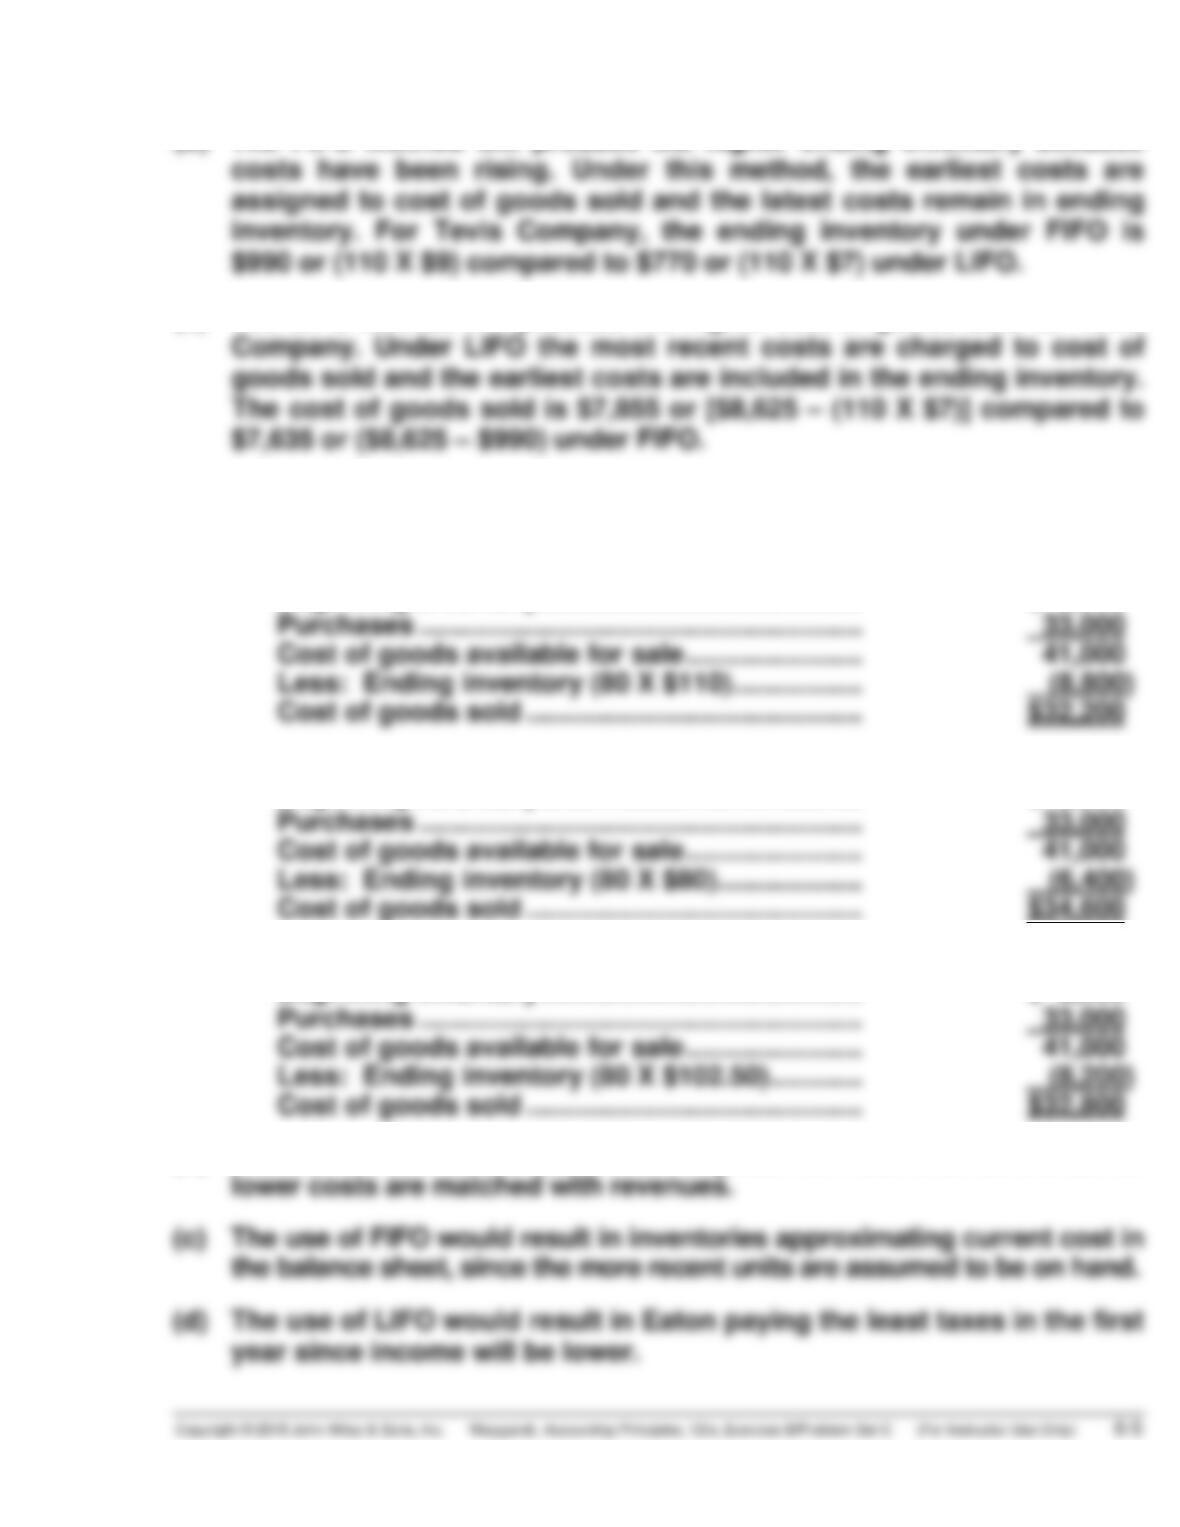
(b) The FIFO method will produce the higher ending inventory because
costs have been rising. Under this method, the earliest costs are
(c) The LIFO method will produce the higher cost of goods sold for Tevis
Company. Under LIFO the most recent costs are charged to cost of
EXERCISE 6-7B
(a) 1. FIFO
Beginning inventory …………………………………… $ 8,000
Purchases …………………………………………………. 33,000
Cost of goods available for sale ………………….. 41,000
2. LIFO
Beginning inventory …………………………………… $ 8,000
Purchases …………………………………………………. 33,000
3. AVERAGE
Beginning inventory …………………………………… $ 8,000
Purchases …………………………………………………. 33,000
(b) The use of FIFO would result in the highest net income since the earlier
lower costs are matched with revenues.
EXERCISE 6-8B
(a)
Cost of Goods
Available for Sale
$8,625
÷
Total Units
Available for Sale
1,050
=
Weighted Average
Unit Cost
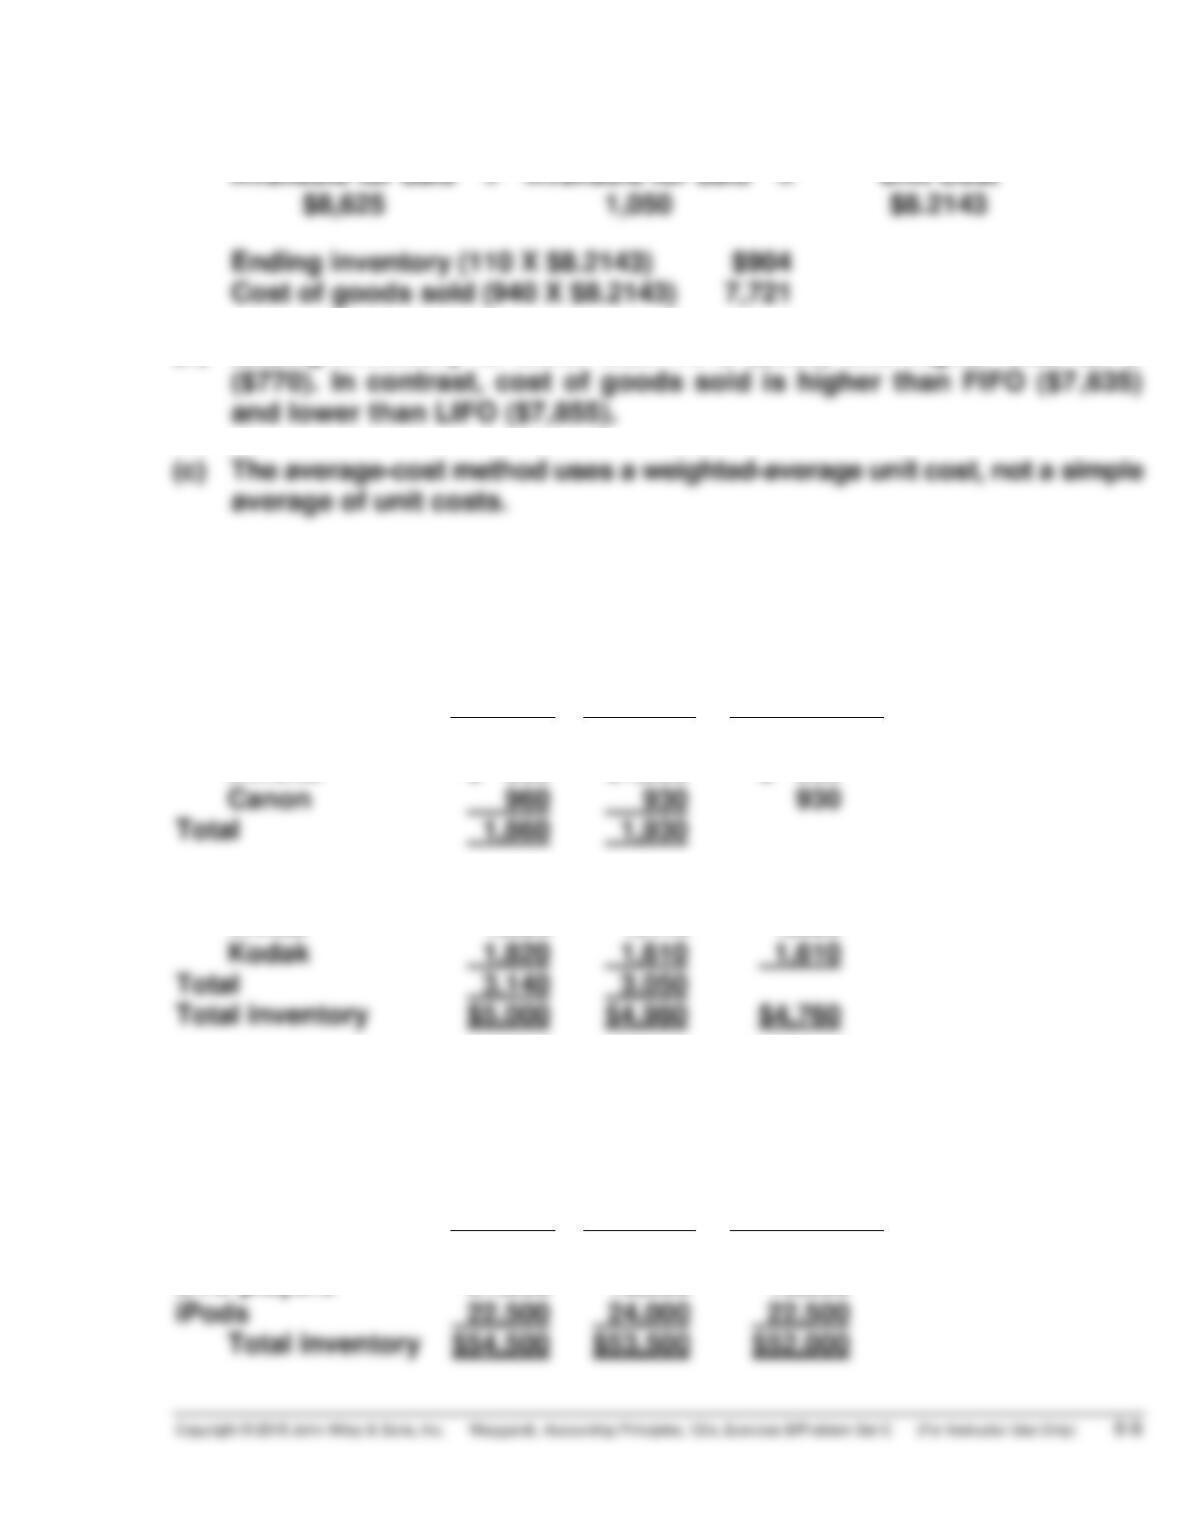
$8.2143
(b) Ending inventory is lower than FIFO ($990) and higher than LIFO
(c) The average-cost method uses a weighted-average unit cost, not a simple
average of unit costs.
EXERCISE 6-9B
Cost
Market
Lower
of Cost
or Market:
Cameras
Minolta
$ 900
$1,000
$ 900
Total
Light meters
Vivitar
1,320
1,440
1,320
Kodak
Total
Total inventory
$4,760
EXERCISE 6-10B
Cost
Market
Lower
of Cost
or Market:
Cameras
$11,000
$10,000
10,000
DVD players
21,000
19,500
19,500
iPods
EXERCISE 6-11B
2016
2017
Beginning inventory ……………………………………. $ 27,000 $ 36,000
Cost of goods purchased …………………………….. 200,000 235,000
EXERCISE 6-12B
(a)
2016
2017
Sales revenue ………………………………………….. $300,000 $350,000
Cost of goods sold
Beginning inventory ………………………….. 40,000 48,000
Cost of goods purchased …………………… 186,000 217,000
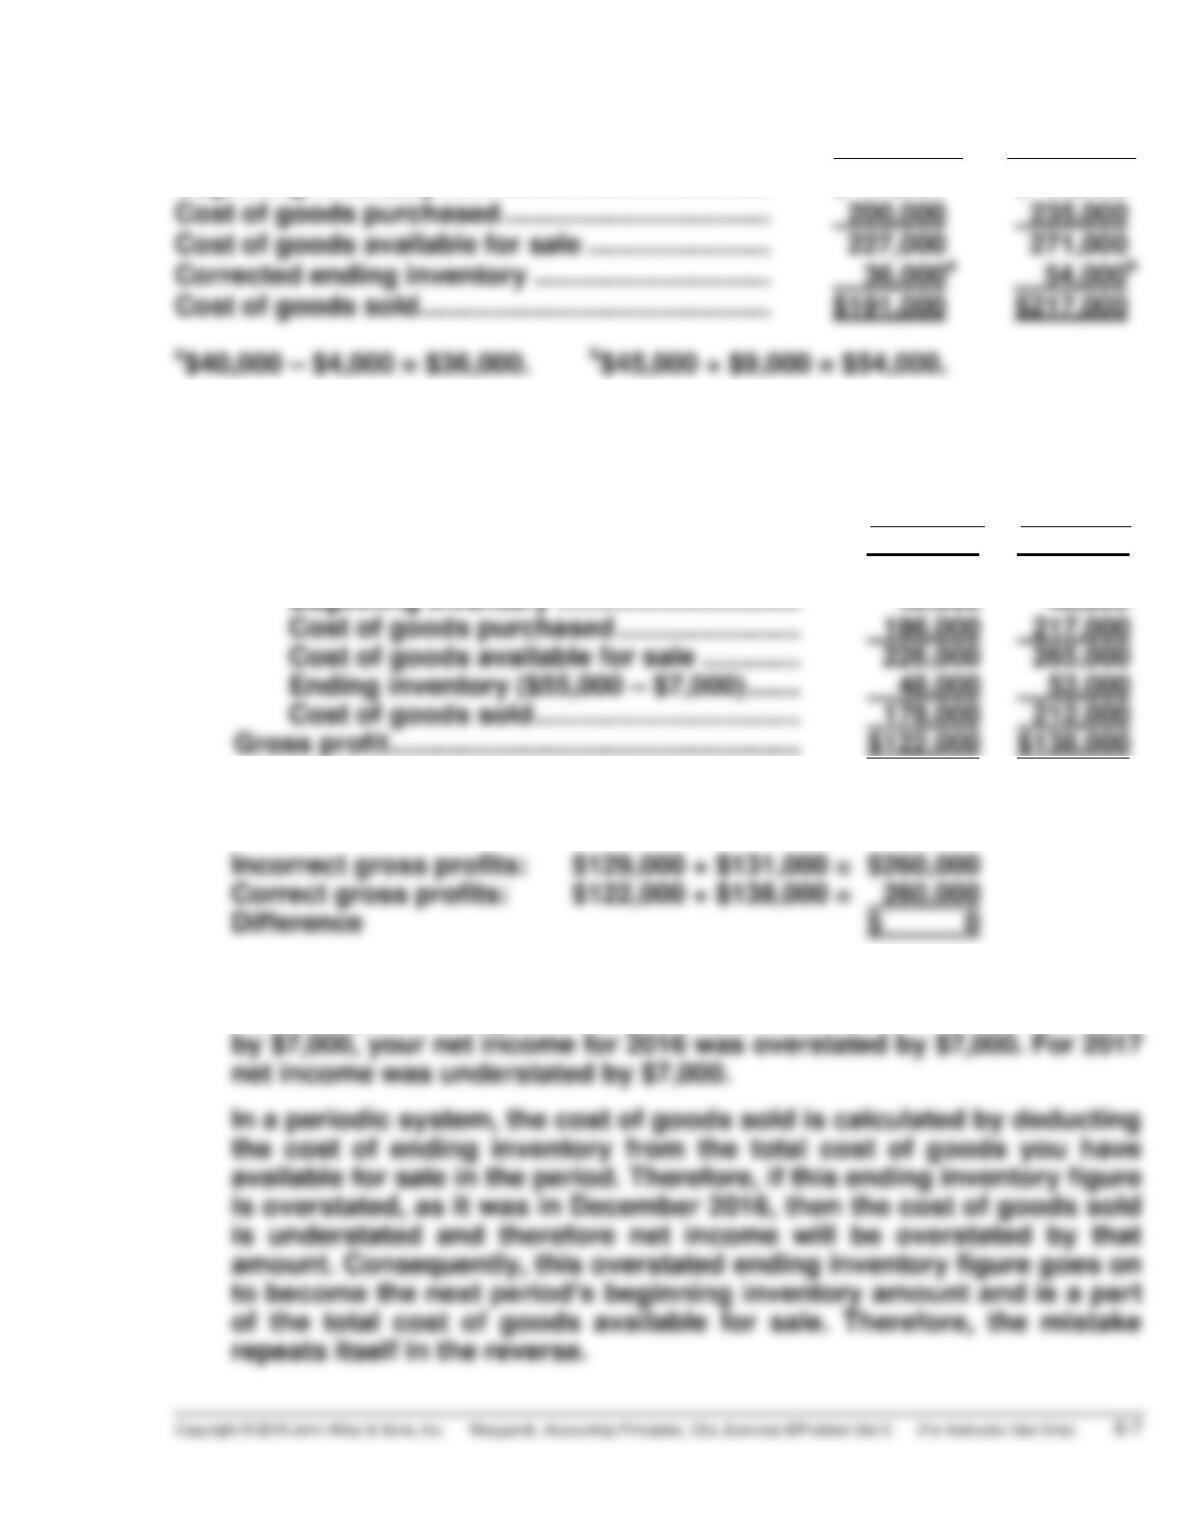
(b) The cumulative effect on total gross profit for the two years is zero as
shown below:
Incorrect gross profits: $129,000 + $131,000 = $260,000
(c) Dear Mr./Ms. President:
Because your ending inventory of December 31, 2016 was overstated
by $7,000, your net income for 2016 was overstated by $7,000. For 2017
net income was understated by $7,000.
In a periodic system, the cost of goods sold is calculated by deducting
EXERCISE 6-12B (Continued)
The error also affects the balance sheet at the end of 2016. The inven-
tory reported in the balance sheet is overstated; therefore, total assets
are overstated. The overstatement of the 2016 net income results in the
EXERCISE 6-13B
2015
2016
2017
Inventory
turnover
$1,400,000
$1,440,000
$1,740,000
($120,000 + $280,000) ÷ 2
($280,000 + $200,000) ÷ 2
($200,000 + $400,000) ÷ 2
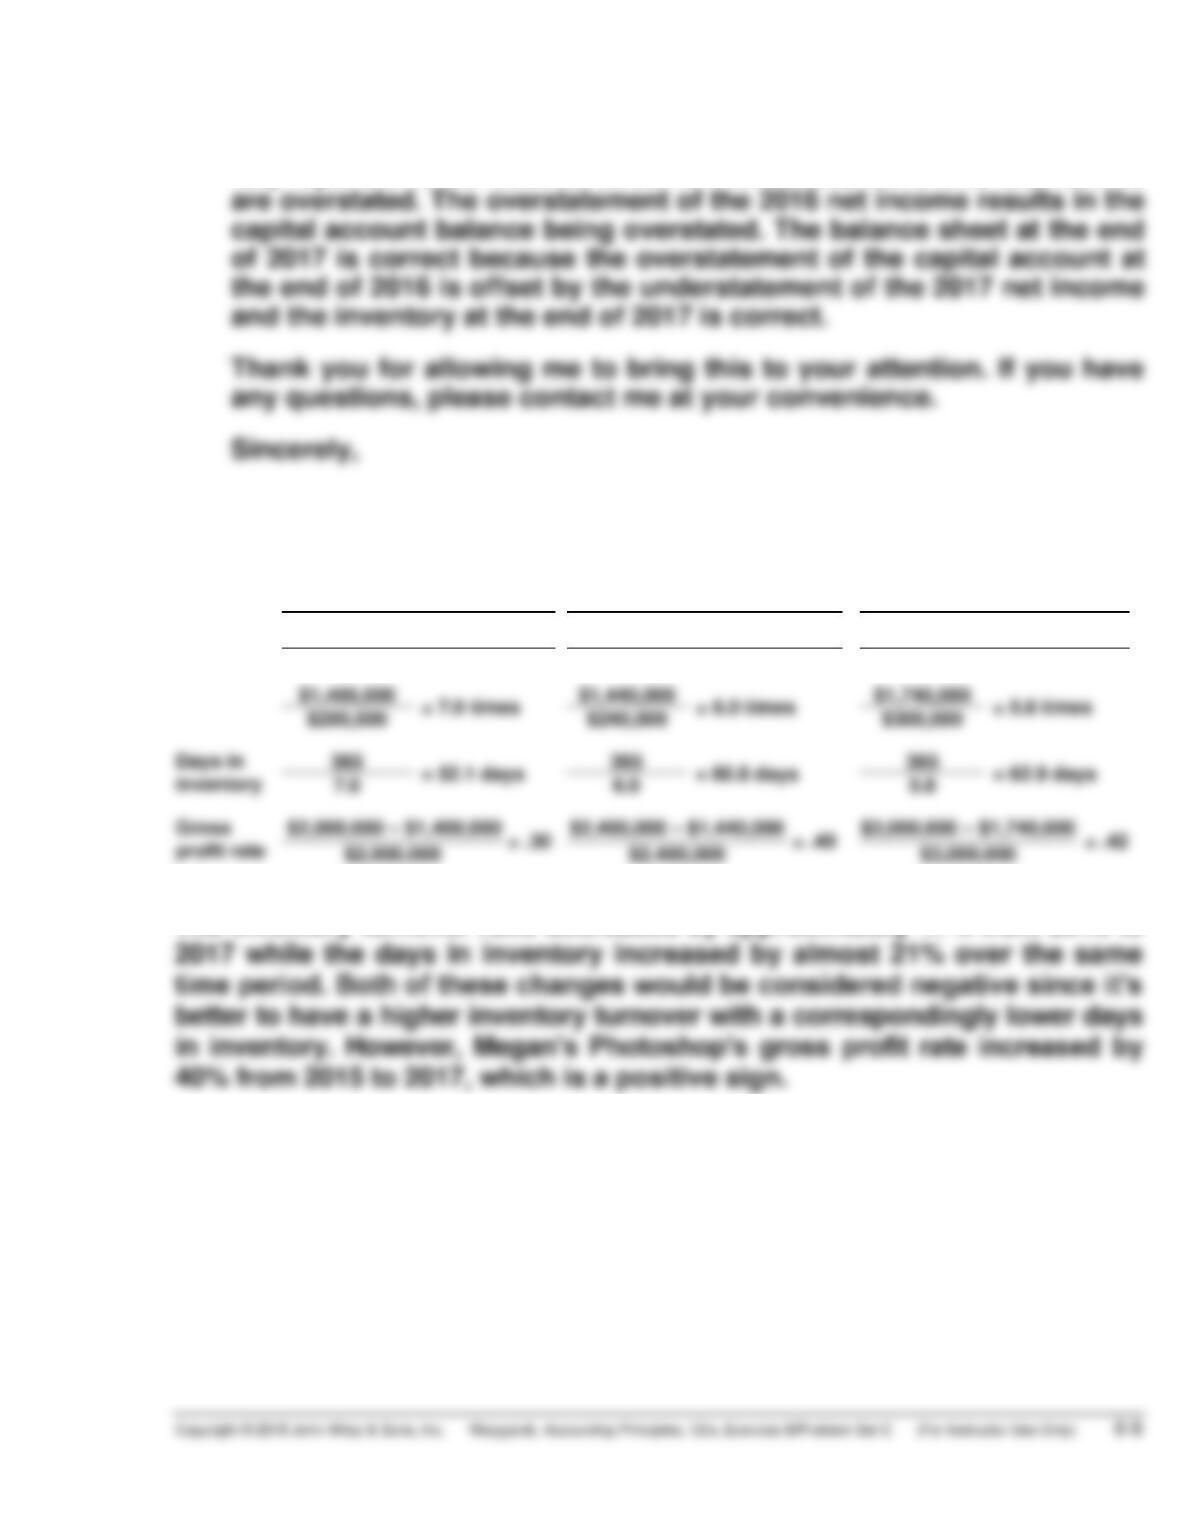
$1,400,000
= 7.0 times
$1,440,000
= 6.0 times
$1,740,000
= 5.8 times
$200,000
$240,000
$300,000
Days in
inventory
= 52.1 days
= 60.8 days
= 62.9 days
The inventory turnover ratio decreased by approximately 17% from 2015 to
2017 while the days in inventory increased by almost 21% over the same
EXERCISE 6-14B
(a)
Brady Company
Perez Company
Inventory Turnover
$280,000
$394,000
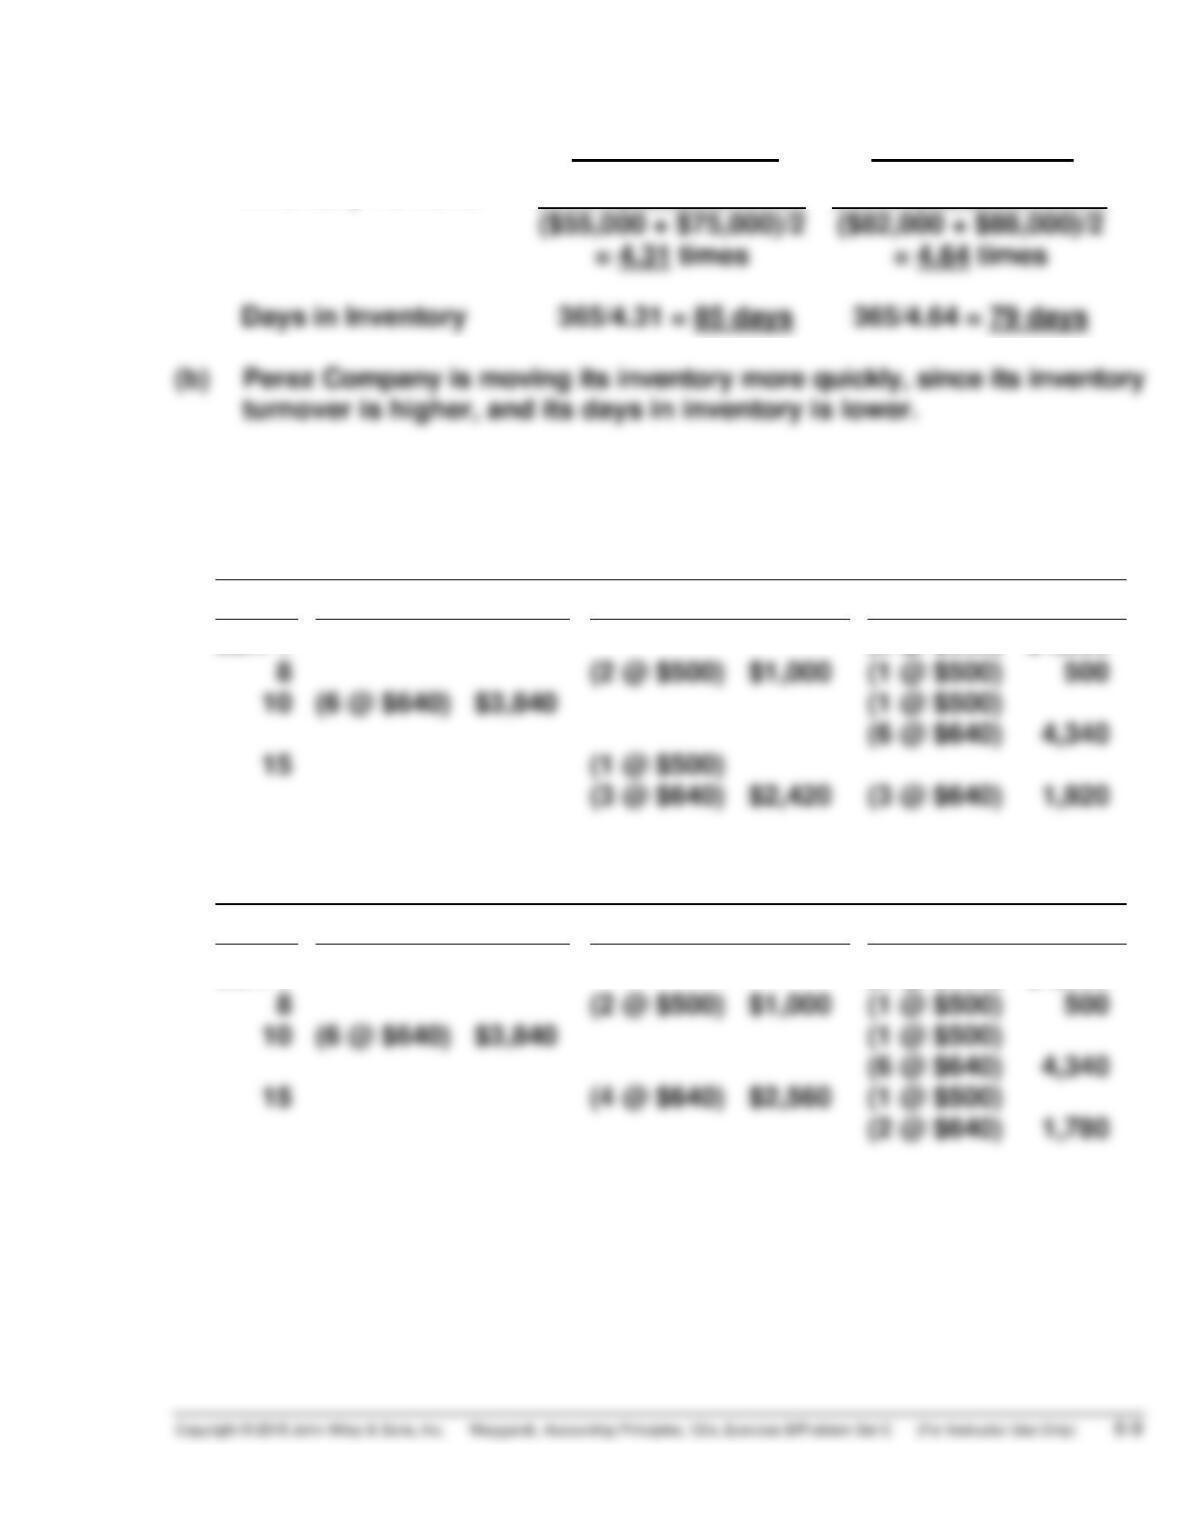
(b) Perez Company is moving its inventory more quickly, since its inventory
*EXERCISE 6-15B
(1)
FIFO
Date
Purchases
Cost of Goods Sold
Balance
Jan. 1
(3 @ $500) $1,500
8
(2 @ $500) $1,000
(1 @ $500) 500
(6 @ $640) $3,840
(1 @ $500)
(6 @ $640) 4,340
(1 @ $500)
(2)
LIFO
Date
Purchases
Cost of Goods Sold
Balance
Jan. 1
(3 @ $500) $1,500
8
(2 @ $500) $1,000
(1 @ $500) 500
(6 @ $640) $3,840
(1 @ $500)
(6 @ $640) 4,340
(4 @ $640) $2,560
(1 @ $500)
(2 @ $640) 1,780
*EXERCISE 6-15B (Continued)
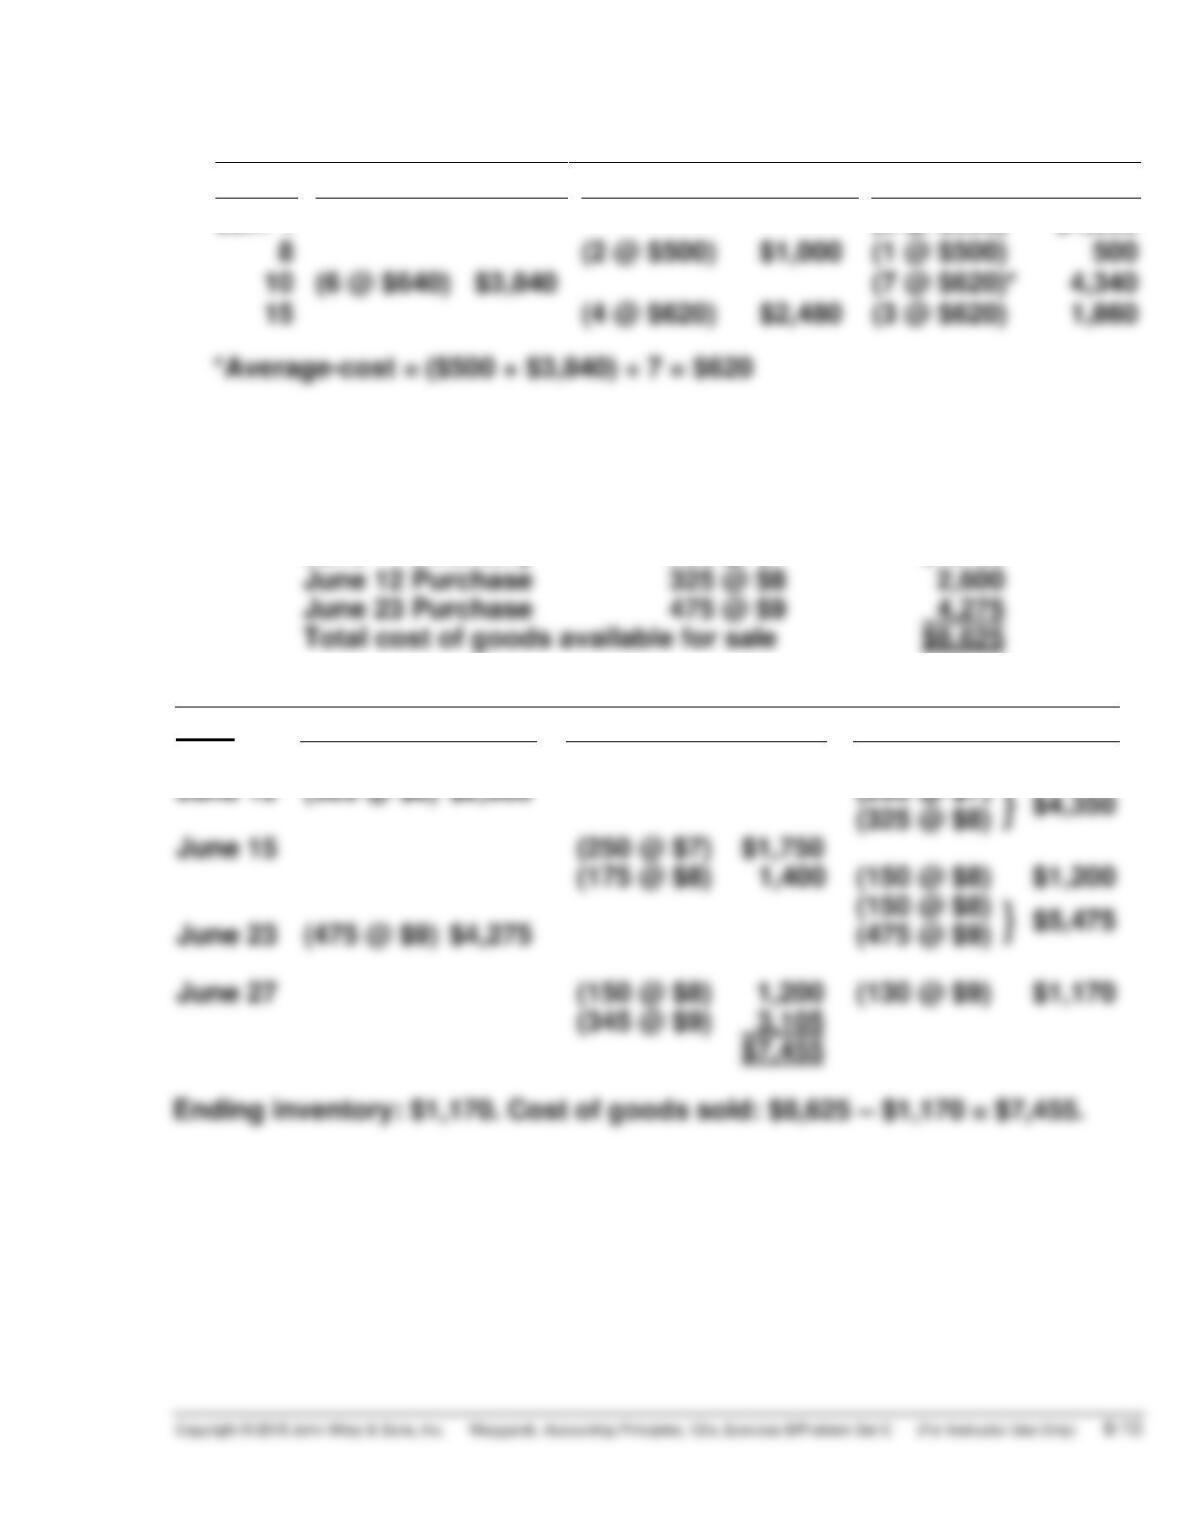
(3)
AVERAGE-COST
Date
Purchases
Cost of Goods Sold
Balance
Jan. 1
(3 @ $500) $1,500
8
(2 @ $500) $1,000
(1 @ $500) 500
(6 @ $640) $3,840
(7 @ $620)* 4,340
(4 @ $620) $2,480
(3 @ $620) 1,860
*EXERCISE 6-16B
(a) The cost of goods available for sale is:
June 1 Inventory
250 @ $7
$1,750
June 12 Purchase
325 @ $8
June 23 Purchase
475 @ $9
Total cost of goods available for sale
$8,625
FIFO
Date
Purchases
Cost of Goods Sold
Balance
June 1
(250 @ $7)
$1,750
June 12
(325 @ $8) $2,600
(250 @ $7)
(325 @ $8)
June 15
(250 @ $7)
(175 @ $8)
(150 @ $8)
$1,200
(150 @ $8)
June 23
(475 @ $9) $4,275
(475 @ $9)
June 27
(150 @ $8)
(130 @ $9)
$1,170
(345 @ $9)
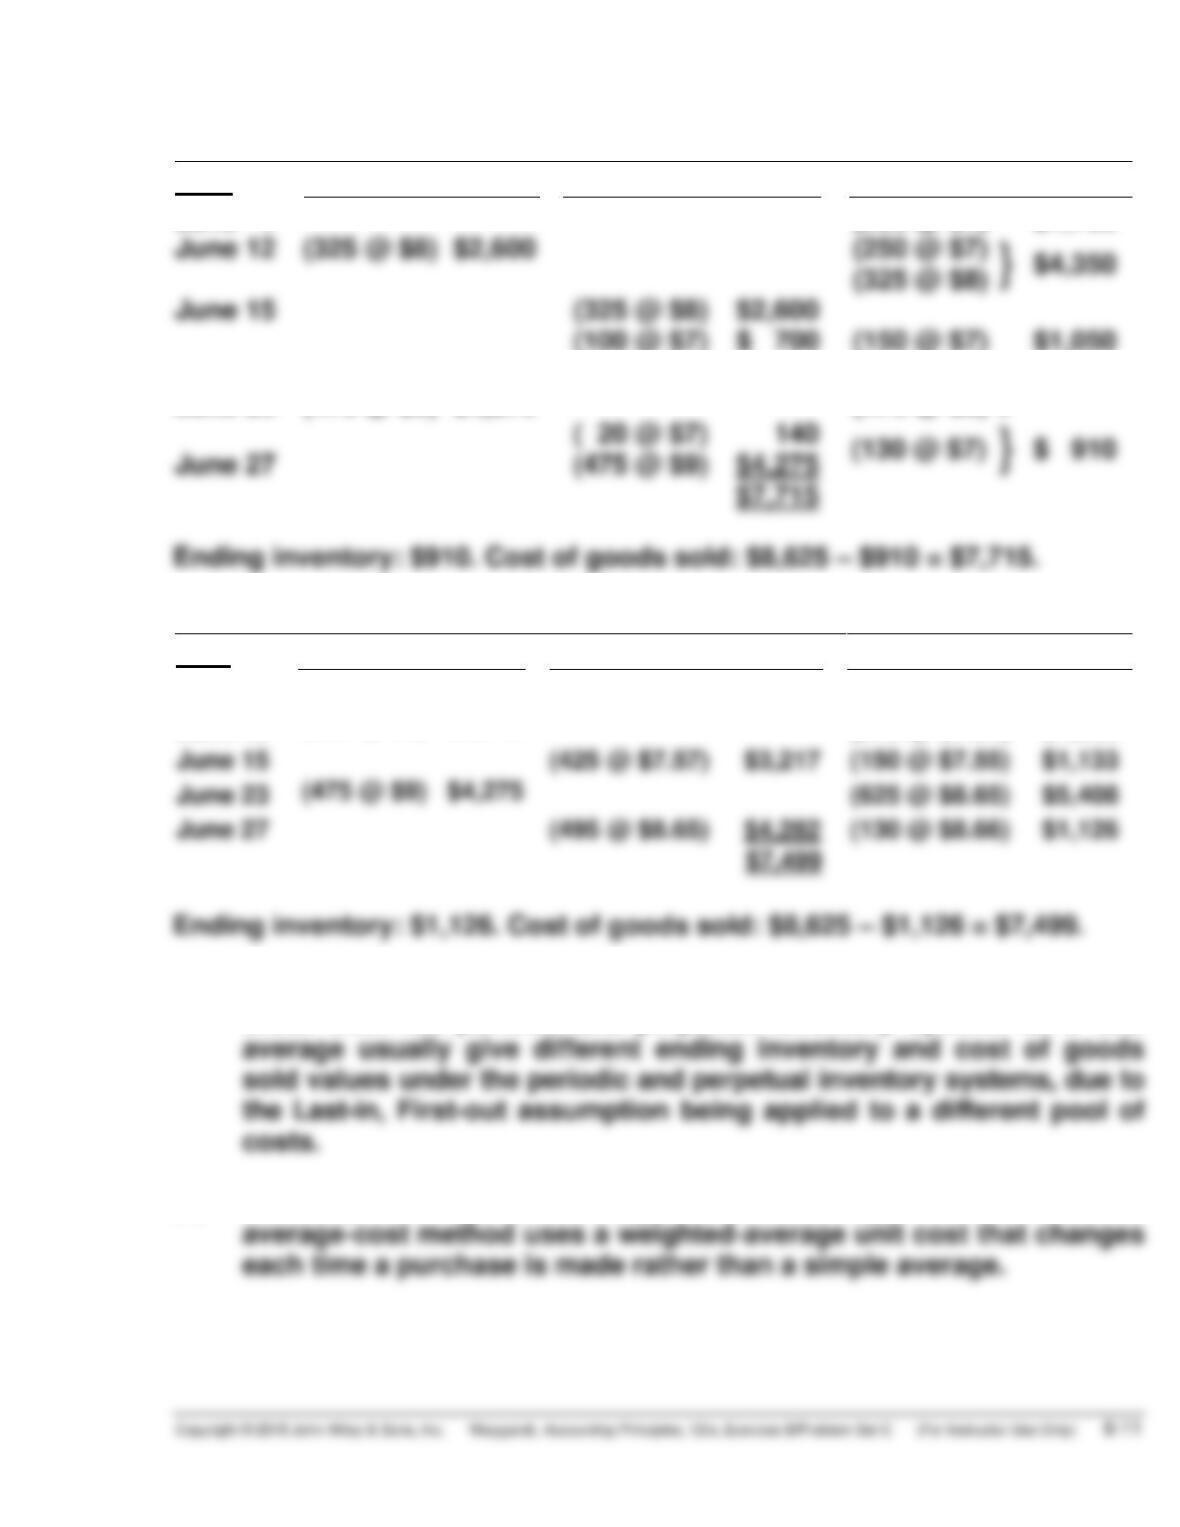
*EXERCISE 6-16B (Continued)
LIFO
Date
Purchases
Cost of Goods Sold
Balance
June 1
(250 @ $7)
$1,750
June 12
(325 @ $8) $2,600
(250 @ $7)
}
$4,350
(325 @ $8)
June 15
(150 @ $7)
$1,050
(150 @ $7)
}
$5,325
June 23
(475 @ $9) $4,275
(475 @ $9)
}
$ 910
June 27
Moving-Average
Date
Purchases
Cost of Goods Sold
Balance
June 1
(250 @ $7) $1,750
June 12
(325 @ $8) $2,600
(575 @ $7.57) $4,350
June 15
(425 @ $7.57)
$3,217
(150 @ $7.55) $1,133
June 23
(475 @ $9) $4,275
(625 @ $8.65) $5,408
June 27
(495 @ $8.65)
$4,282
(130 @ $8.66) $1,126
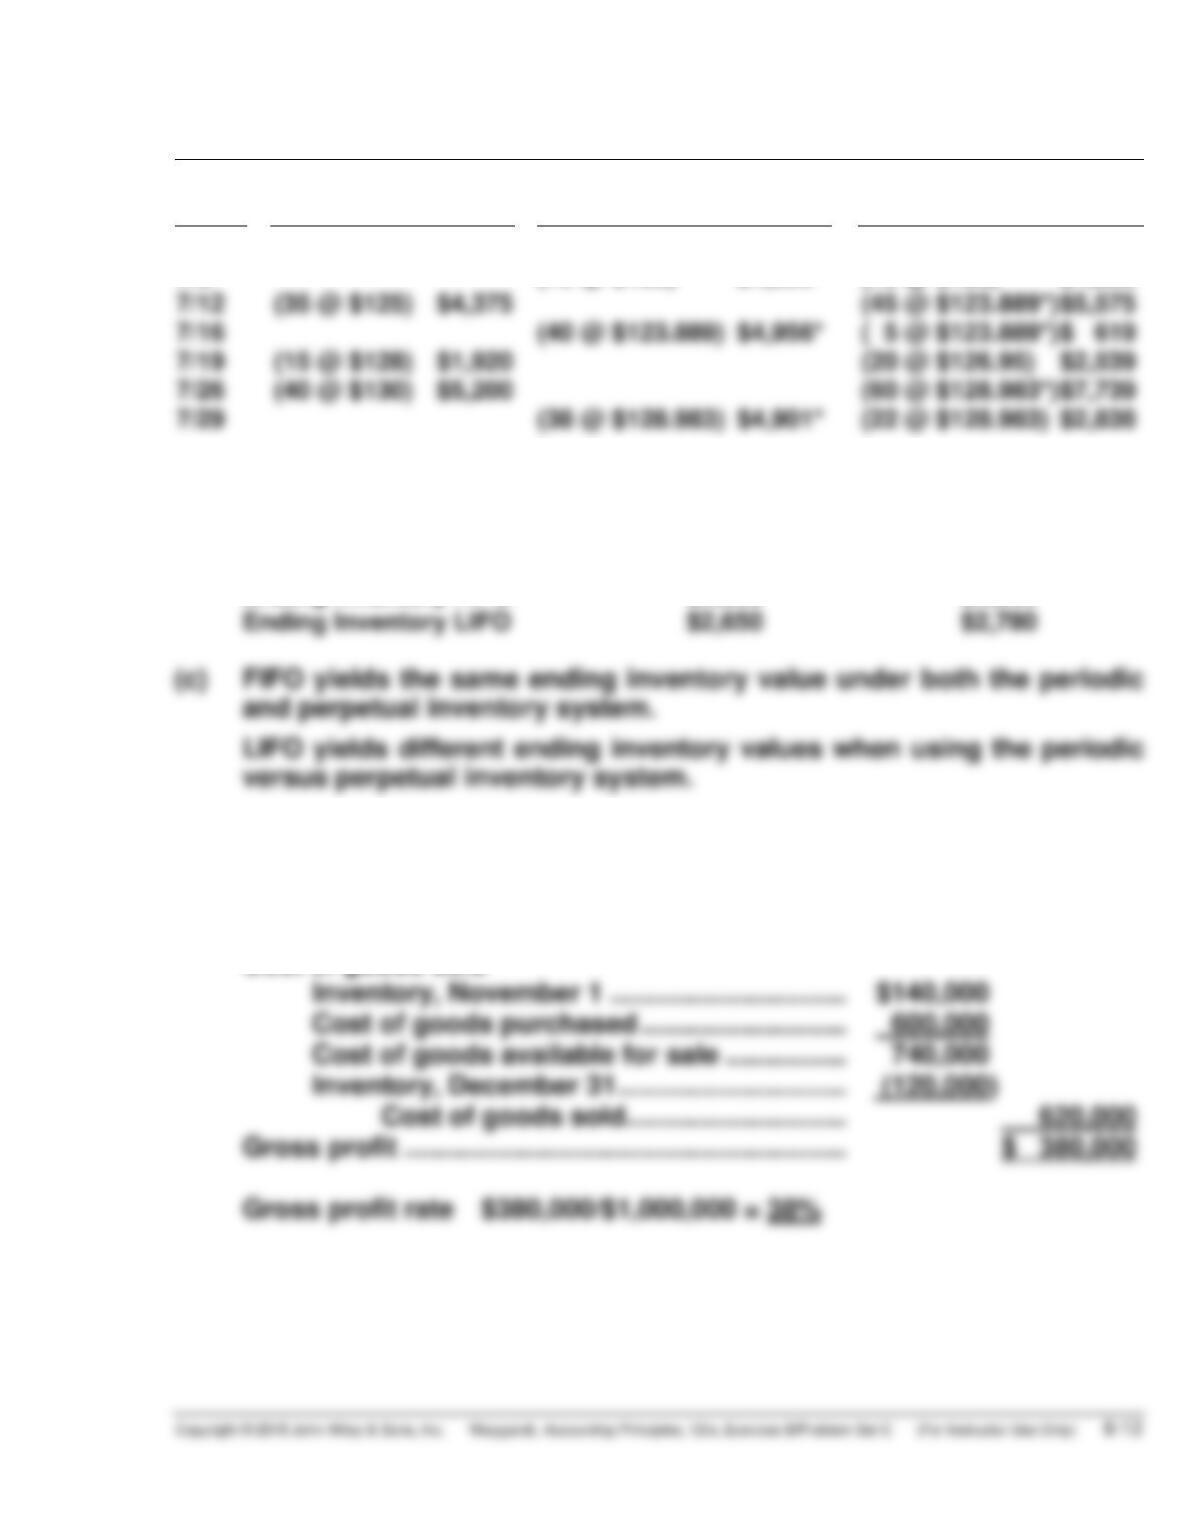
(b) FIFO gives the same ending inventory and cost of goods sold values
under both the periodic and perpetual inventory system. LIFO and
(c) The simple average would be [($7 + $8 + $9) ÷ 3)] or $8. However, the
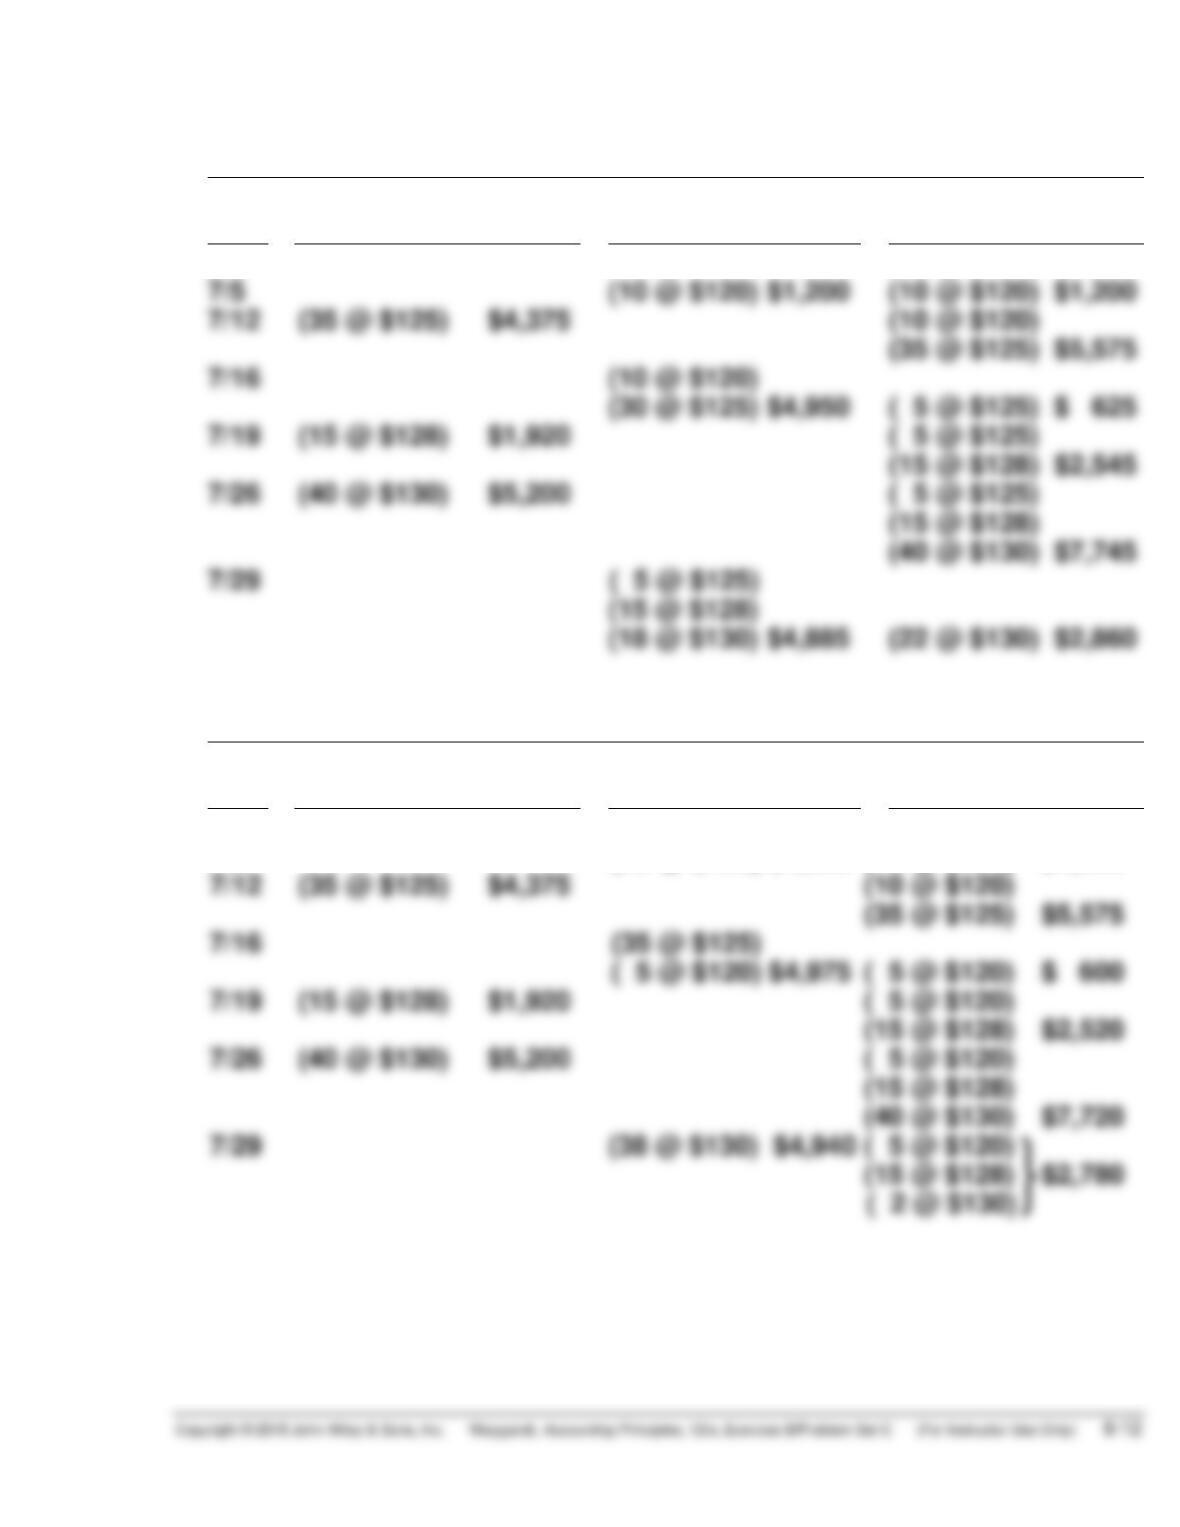
*EXERCISE 6-17B
(a)
FIFO
Date
Purchases
Cost of
Goods Sold
Balance
7/1
(20 @ $120) $2,400
7/5
(10 @ $120) $1,200
(10 @ $120) $1,200
7/12
(35 @ $125) $4,375
(10 @ $120)
(35 @ $125) $5,575
7/16
(10 @ $120)
(30 @ $125) $4,950
( 5 @ $125) $ 625
7/19
(15 @ $128) $1,920
( 5 @ $125)
(15 @ $128) $2,545
7/26
(40 @ $130) $5,200
( 5 @ $125)
(15 @ $128)
(40 @ $130) $7,745
7/29
(15 @ $128)
LIFO
Date
Purchases
Cost of
Goods Sold
Balance
7/1
(20 @ $120) $2,400
7/5
(10 @ $120) $1,200
(10 @ $120) $1,200
7/12
(35 @ $125) $4,375
(10 @ $120)
(35 @ $125) $5,575
7/16
(35 @ $125)
( 5 @ $120) $4,975
( 5 @ $120) $ 600
7/19
(15 @ $128) $1,920
( 5 @ $120)
(15 @ $128) $2,520
7/26
(40 @ $130) $5,200
( 5 @ $120)
(15 @ $128)
(40 @ $130) $7,720
7/29
(38 @ $130)
( 5 @ $120)
(15 @ $128) $2,780
*EXERCISE 6-17B (Continued)
Average-Cost
Date
Purchases
Cost of
Goods Sold
Balance
7/1
(20 @ $120) $2,400
7/5
(10 @ $120) $1,200
(10 @ $120) $1,200
7/12
(35 @ $125) $4,375
(45 @ $123.889*) $5,575
7/16
(40 @ $123.889) $4,956*
( 5 @ $123.889*) $ 619
7/19
(15 @ $128) $1,920
(20 @ $126.95) $2,539
7/26
(40 @ $130) $5,200
(60 @ $128.983*) $7,739
7/29
*Rounded
(b)
Periodic
Perpetual
Ending Inventory FIFO
$2,860
$2,860
Ending Inventory LIFO
$2,650
$2,780
*EXERCISE 6-18B
(a) Sales revenue ………………………………………………. $1,000,000
Cost of goods sold
Inventory, November 1 …………………………. $140,000

*EXERCISE 6-18B (Continued)
(b) Sales revenue ……………………………………………………………… $1,200,000
Less: Estimated gross profit (38% X $1,200,000) …………… 456,000
Estimated cost of goods sold ……………………………………….. $ 744,000
*EXERCISE 6-19B
(a) Net sales ($105,000 – $5,000) ………………………………………… $100,000
Less: Estimated gross profit (40% X $100,000) ……………… 40,000
Estimated cost of goods sold ……………………………………….. $ 60,000
(b) Net sales ……………………………………………………………………… $100,000
Less: Estimated gross profit (30% X $100,000) ……………… 30,000
Estimated cost of goods sold ……………………………………….. $ 70,000
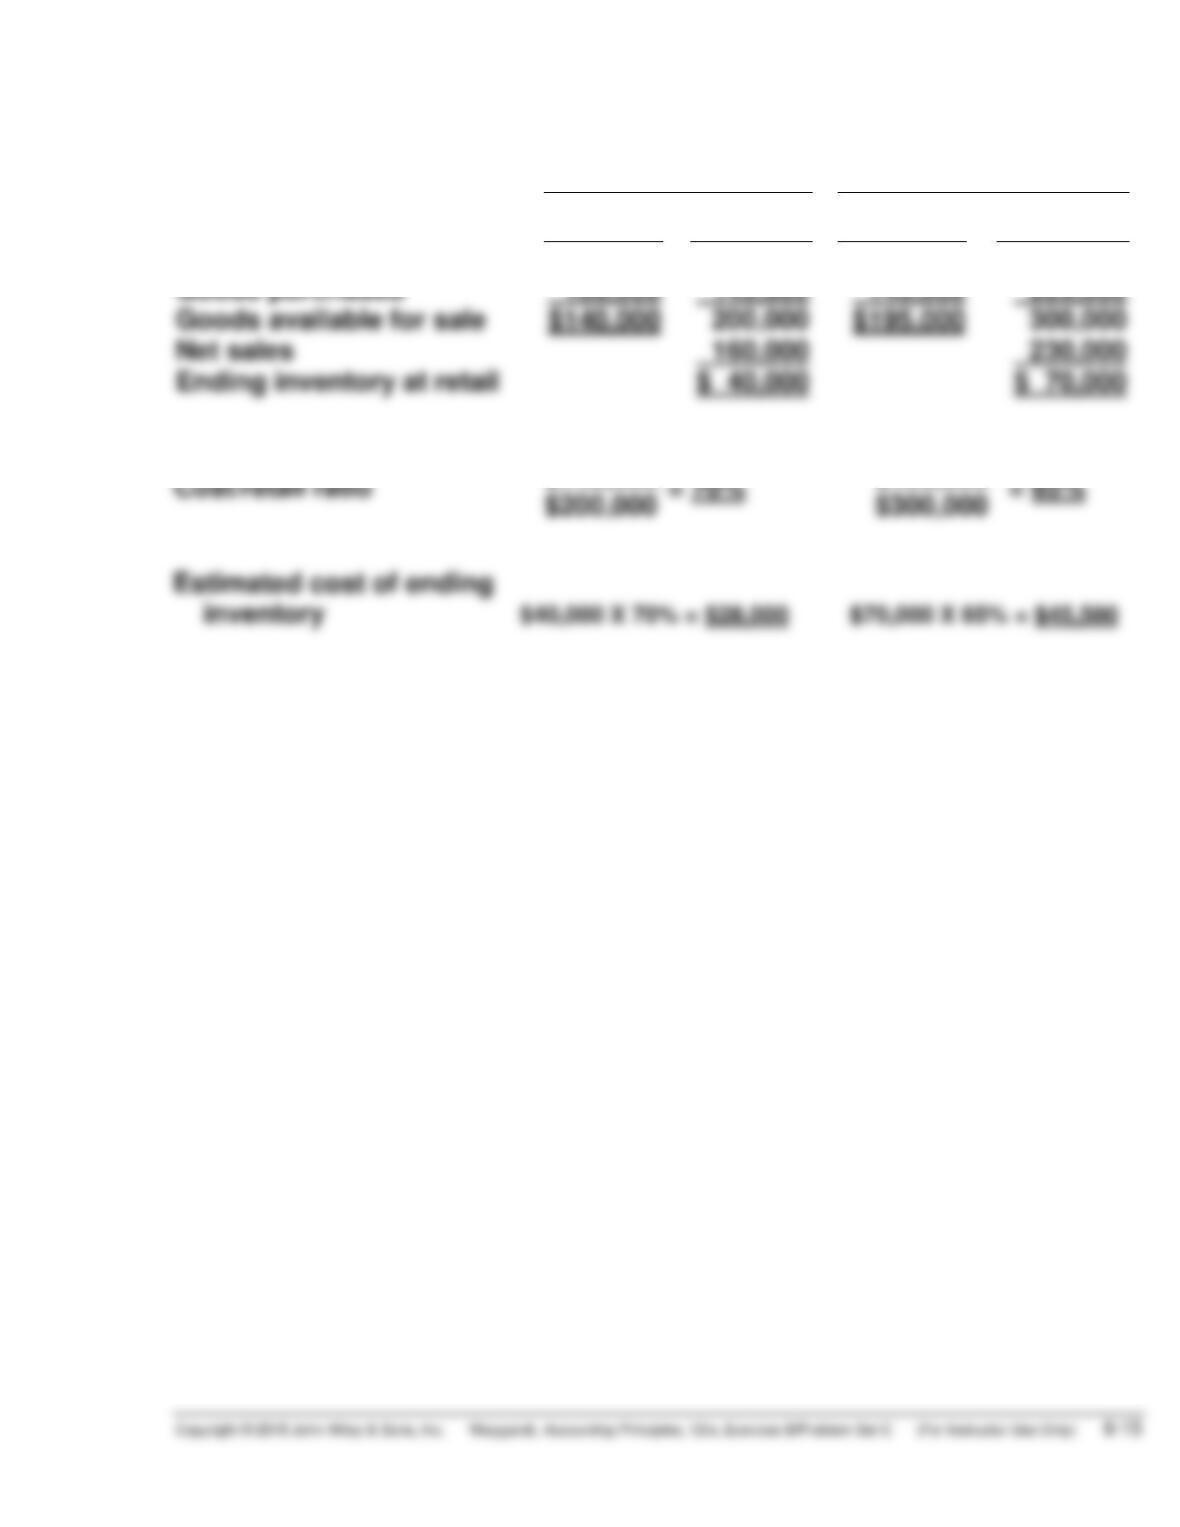
*EXERCISE 6-20B
Adult’s
Department
Kid’s
Department
Cost
Retail
Cost
Retail
Beginning inventory
$ 40,000
$ 57,000
$ 50,000
$ 77,000
Goods purchased
Net sales
Ending inventory at retail
$ 70,000
$140,000
$195,000
SOLUTIONS TO PROBLEMS—SET C
PROBLEM 6-1C
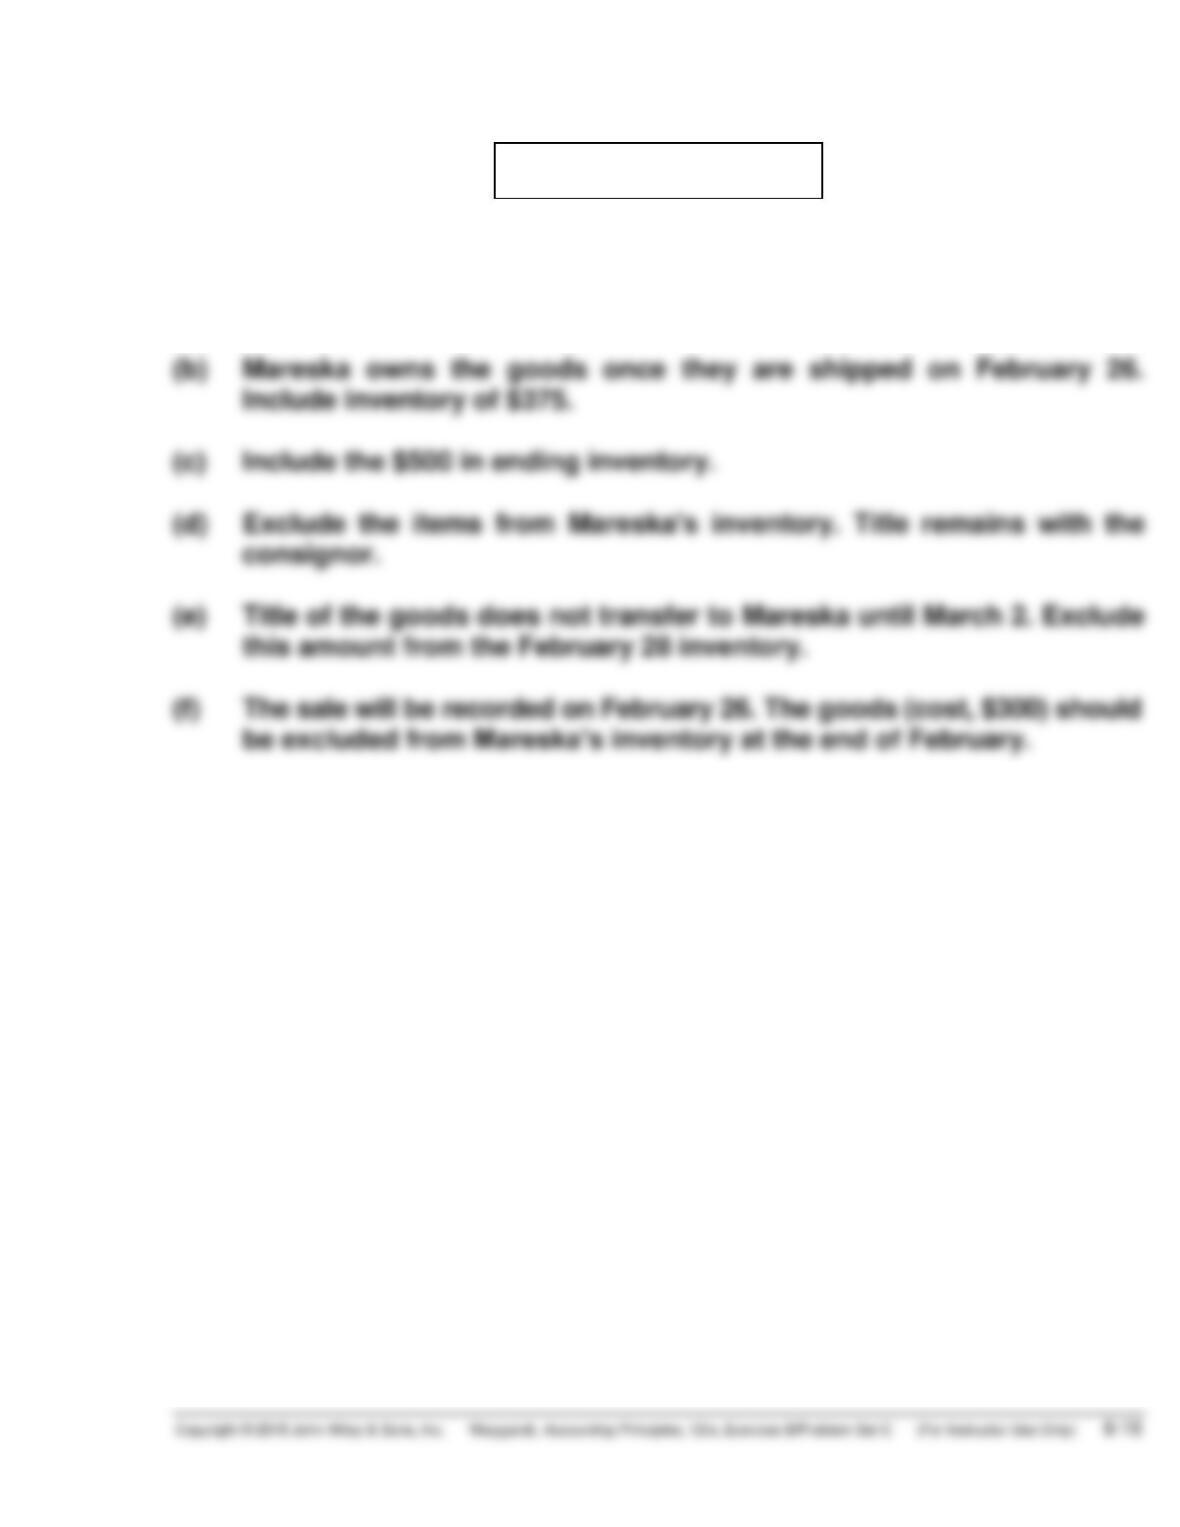
(a) Title to the goods does not transfer to the customer until March 2.
Include the $800 in ending inventory.
(b) Mareska owns the goods once they are shipped on February 26.
Include inventory of $375.