185
P6–1, Continued
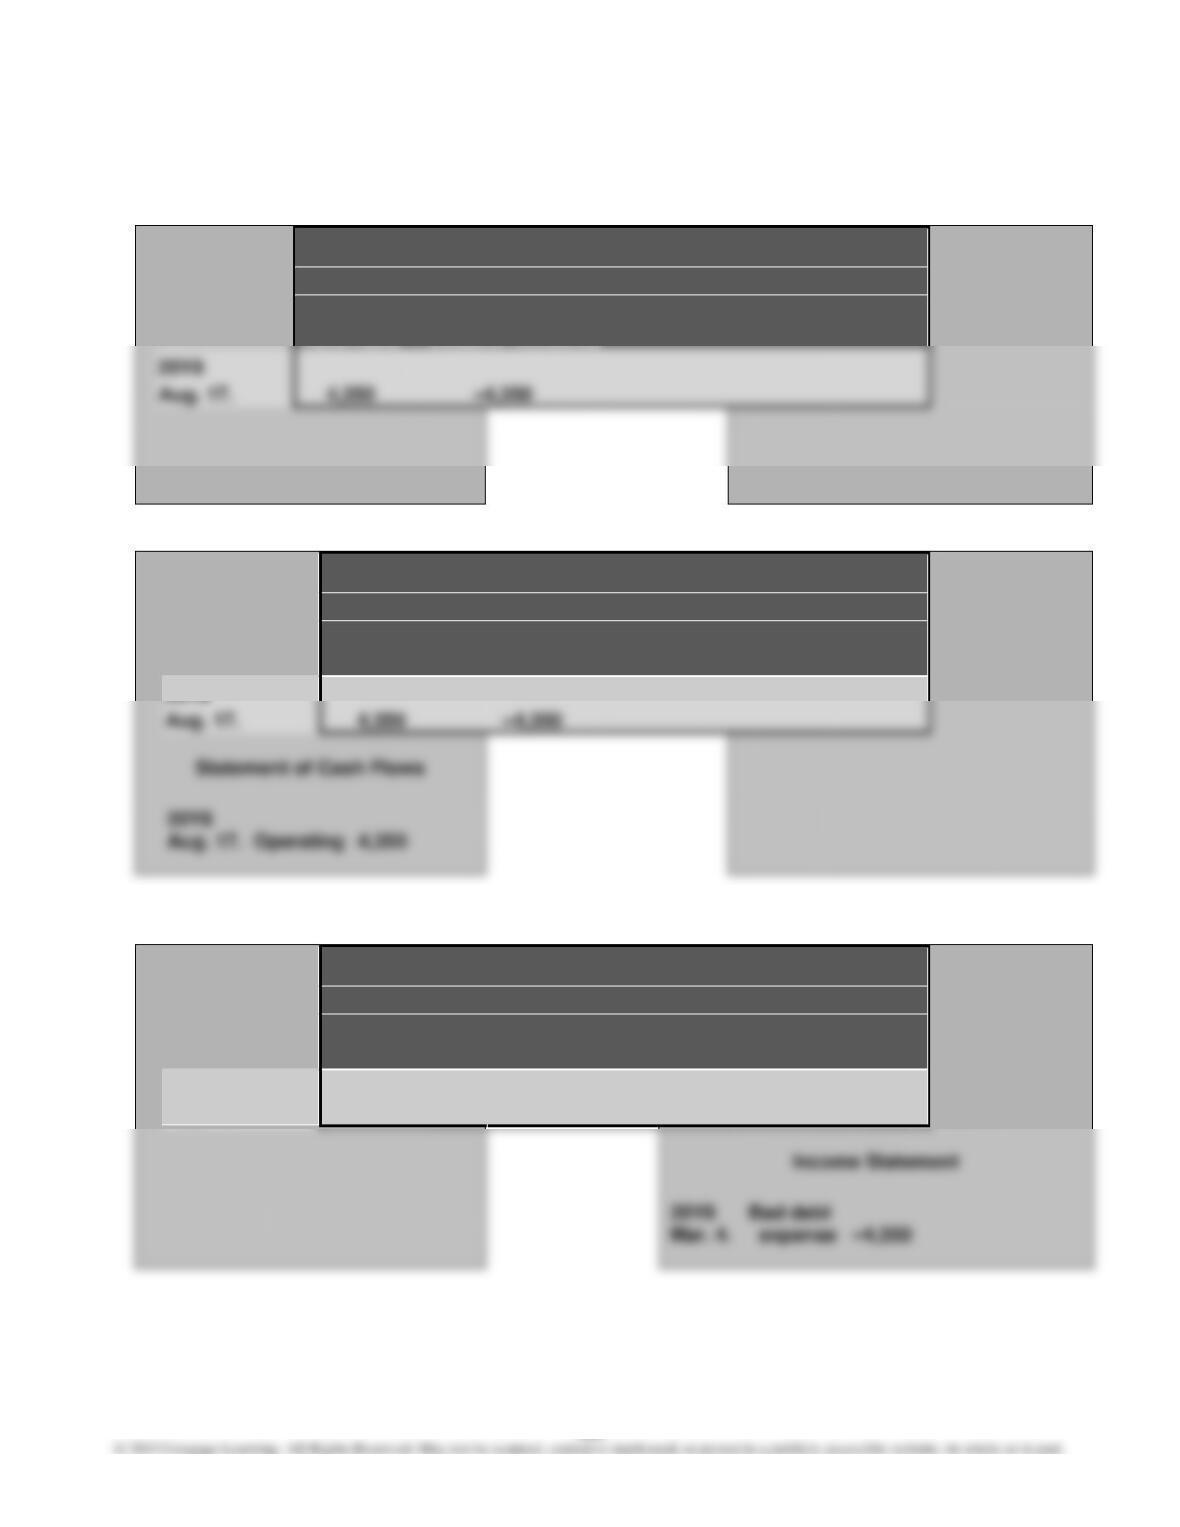
5.
Balance Sheet
Statement of
Assets
=
Liabilities
+
Stockholders’ Equity
Income
Cash Flows
Accounts
Allowance for
Statement
Receivable
–
Doubtful Accounts
20Y8
Aug. 17.
Balance Sheet
Statement of
Assets
=
Liabilities
+
Stockholders’ Equity
Income
Cash Flows
Accounts
Statement
Cash
+
Receivable
Aug. 17.
–4,350
Aug. 17.
Operating
20Y8
6. a.
Balance Sheet
Statement of
Assets
=
Liabilities
+
Stockholders’ Equity
Income
Cash Flows
Retained
Statement
Accounts Receivable
=
Earnings
20Y8
Mar. 4.
–4,350
–4,350
20Y8
Mar. 4.
Mar. 4.
expense
186
P6–1, Concluded
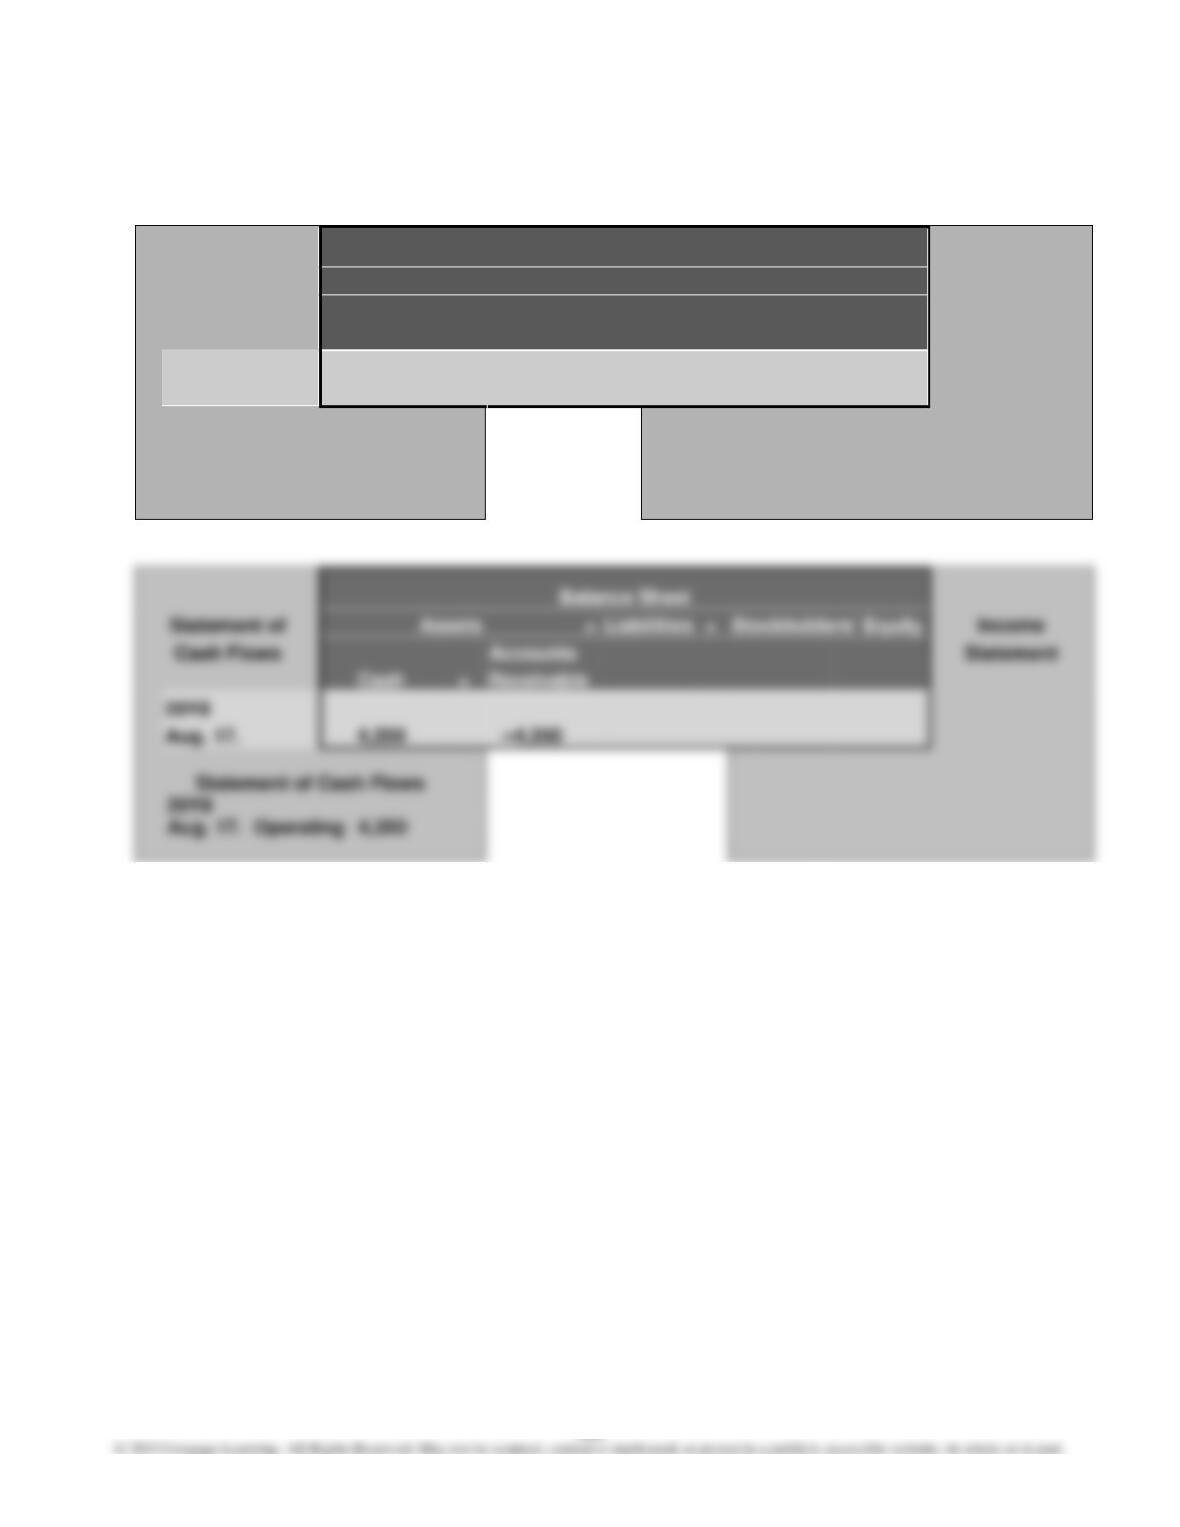
6. b.
Balance Sheet
Statement of
Assets
=
Liabilities
+
Stockholders’ Equity
Income
Cash Flows
Retained
Statement
Accounts Receivable
=
Earnings
20Y8
Aug. 17.
4,350
4,350
20Y8
Aug. 17.
Income Statement
20Y8
Aug. 17.
Bad debt
expense
4,350
Balance Sheet
Statement of
Assets
=
Liabilities
+
Stockholders’ Equity
Income
Cash Flows
Statement
20Y8
Aug. 17.
Aug. 17.
Operating
7. Amazon.com uses the allowance method of accounting for uncollectible
accounts receivable. Generally accepted accounting principles require that
companies with a large amount of receivables use the allowance method.
1.
a. b.
Addition to Allowance Accounts Written
Year for Doubtful Accounts Off During Year
20Y2 $31,250 ($12,500,000 × 0.0025) $18,450 ($31,250 – $12,800)
2. a. The estimate of ¼ of 1% of credit sales may be too large, since the allow-
ance for doubtful accounts has steadily increased each year. The increas-
ing balance of the allowance for doubtful accounts also may be due to the
failure to write off a large number of uncollectible accounts. These possi-
bilities could be evaluated by examining the accounts in the subsidiary
of uncollectible accounts could be analyzed in depth in order to develop a
reasonable percentage for future adjusting entries, based on past history.
Caution must be exercised, however, in using historical percentages.
Specifically, inquiries should be made to determine whether any signifi-
cant changes between prior years and the current year may have
P6–3
1. Bad Debt Expense
Increase Balance of
Expense Expense (Decrease) Allowance
Actually Based on in Amount Account,
Year Reported Estimate* of Expense End of Year
1 $ 5,000 $ 11,500 $ 6,500 $ 6,500
2 9,000 23,750 14,750 21,250
3 23,000 45,000 22,000 43,250
4 37,500 48,000 10,500 53,750
2. Yes. The actual write-offs of accounts originating in the first two years are
reasonably close to the expense that would have been charged to those years
P6–4
1. First-In, First-Out Method
Model Quantity Unit Cost Total Cost
101Sx 6 $225 $ 1,350
3 222 666
2. Last-In, First-Out Method
Model Quantity Unit Cost Total Cost
101Sx 9 $213 $ 1,917
256Br 8 120 960
190
P6–4, Concluded
3. Average Cost Method
Model Quantity Unit Cost* Total Cost
101Sx 9 $218 $ 1,962
256Br 8 126 1,008
4. a. During periods of rising prices, the LIFO method will result in a lesser
amount of inventory, a greater amount of the cost of merchandise sold,
and a lesser amount of net income than the other two methods. For
Icelander Appliances, the LIFO method would be preferred for the current
year, since it would result in a lesser amount of income tax.
P6–5
Inventory Sheet
December 31, 20Y9
Unit
Unit
Total
Inventory
Cost
Market
Description
Quantity
Price
Price
Cost
Market
LCM
112Aa
38
25
$ 80
$ 83
$ 2,000
$2,075
13
78
1,014
1,079
3,014
3,154
$ 3,014
33
118
115
3,795
C39f
41
20
66
64
1,320
1,280
21
70
1,344
2,790
2,624
2,624
Echo9
125
25
26
3,125
3,250
3,125
18
10
565
550
5,650
5,500
8
560
4,480
4,400
10,130
9,900
9,900
H687
60
15
15
900
900
900
J023
5
385
390
1,925
1,950
1,925
L33y
375
6
6
2,250
2,250
2,250
R66b
90
80
22
18
1,760
1,440
10
21
210
180
1,970
1,620
1,620
6
5
250
235
1,250
1,175
1
260
260
235
1,510
1,410
1,410
T882m
130
20
18
2,000
1,800
30
19
570
540
2,340
12
9
750
746
6,750
6,714
3
749
2,247
2,238
8,997
8,952
8,952
Totals
$43,075
192
FINANCIAL ANALYSIS
FA6–1
1. Year 2 Year 1
2. Number of days’ sales in receivables:
365 days ÷ 6.2 ………………………….. 58.9 days
365 days ÷ 6.6 ………………………….. 55.3 days
3. Inventory turnover:
4. Number of days’ sales in inventory:
5. Dell Inc.’s management of both receivables and inventory has declined from
Year 1 to Year 2. Dell is collecting its accounts receivable slower in Year 2. Its
accounts receivable turnover declined from 6.6 in Year 1 to 6.2 in Year 2,
while its number of days’ sales in receivables increased from 55.3 days in
Year 1 to 58.9 days in Year 2. Likewise, Dell is selling its inventory at a slower
193
FA6–2
1. Year 2 Year 1
Accounts receivable turnover:
$120,357 ÷ $20,523 …………………… 5.9
$127,245 ÷ $21,427 …………………… 5.9
2. Number of days’ sales in receivables:
3. Inventory turnover:
4. Number of days’ sales in inventory:
5. Hewlett–Packard Company’s management of receivables has remained the
same from Year 1 to Year 2. Its accounts receivable turnover is 5.9 in Years 1
FA6–3
The results of FA6–1 and FA6–2 for Dell and Hewlett-Packard are summarized be-
low.
Dell Inc. Hewlett-Packard
Year 2 Year 1 Year 2 Year 1
Accounts receivable turnover ……………. 6.2 6.6 5.9 5.9
Number of days’ sales in receivables …. 58.9 55.3 61.9 61.9
to consumers based upon their specific orders.
FA6–4
1. Year 2 Year 1
Accounts receivable turnover:
$65,030 ÷ $12,568 …………………….. 5.2
$61,587 ÷ $12,219 …………………….. 5.0
2. Number of days’ sales in receivables:
3. Inventory turnover:
4. Number of days’ sales in inventory:
FA6–4, Concluded
5. Johnson & Johnson is collecting its accounts receivable slightly faster in
Year 2. Its accounts receivable turnover increased from 5.0 in Year 1 to 5.2 in
Year 2, while its number of days’ sales in receivables decreased from 73.0
FA6–5
1. International
Paper Walmart
Accounts receivable turnover:
$26,034 ÷ [($3,378 + $3,782) ÷ 2] .. 7.3
$446,950 ÷ [($5,089 + $5,937) ÷ 2] 81.1
2. Number of days’ sales in receivables:
3. Inventory turnover:
4. Number of days’ sales in inventory:
5. International Paper’s accounts receivable turnover of 7.3 is significantly less
than Walmart’s 81.1 accounts receivable turnover. Likewise, International Pa-
per’s number of days’ sales in receivables of 50.0 is significantly more than
CASES
Case 6–1
By computing interest using a 365-day year for depository accounts (payables),
Case 6–2
Because of the size and number of customers’ accounts, it is probably unreason-
able for Northern Construction Supplies Co. not to allow credit to contractors and
to require cash or credit card payment. To do so, as Janet points out, would
Case 6–2, Concluded
The primary problem that Northern Construction Supplies Co. is facing is that
some contractors are apparently abusing Northern’s liberal credit policy. One al-
ternative would be for Northern to allow a discount for payment within 30 days.
For example, Northern might allow a 2% discount if the bill is paid within 30 days.
Credit then might be discontinued for any contractor with a bill outstanding more
than 60 days. This would provide the contractors an incentive to pay their bills
early. That is, a 2% discount for payment 30 days early (the bill must be paid with-
in 60 days) is equivalent to an annual interest rate of 24% (2% × 360 ÷ 30). This
discount rate would easily exceed most interest rates on construction loans.
Such a payment policy would give contractors a “positive” incentive to pay early.
Before initiating such a policy, Northern should consider its effect on profits.
Does the discount offered compensate for the faster collection of accounts
receivable? For example, earlier payments would allow Northern to earn interest
Case 6–3
Since the title to merchandise shipped FOB shipping point passes to the buyer
when the merchandise is shipped, the shipments made before midnight, Decem-
Case 6–4
In developing a response to Evan’s concerns, you should probably first empha-
size the practical need for an assumption concerning the flow of cost of goods
purchased and sold. That is, when identical goods are frequently purchased, it
may not be practical to specifically identify each item of inventory. If all the iden-