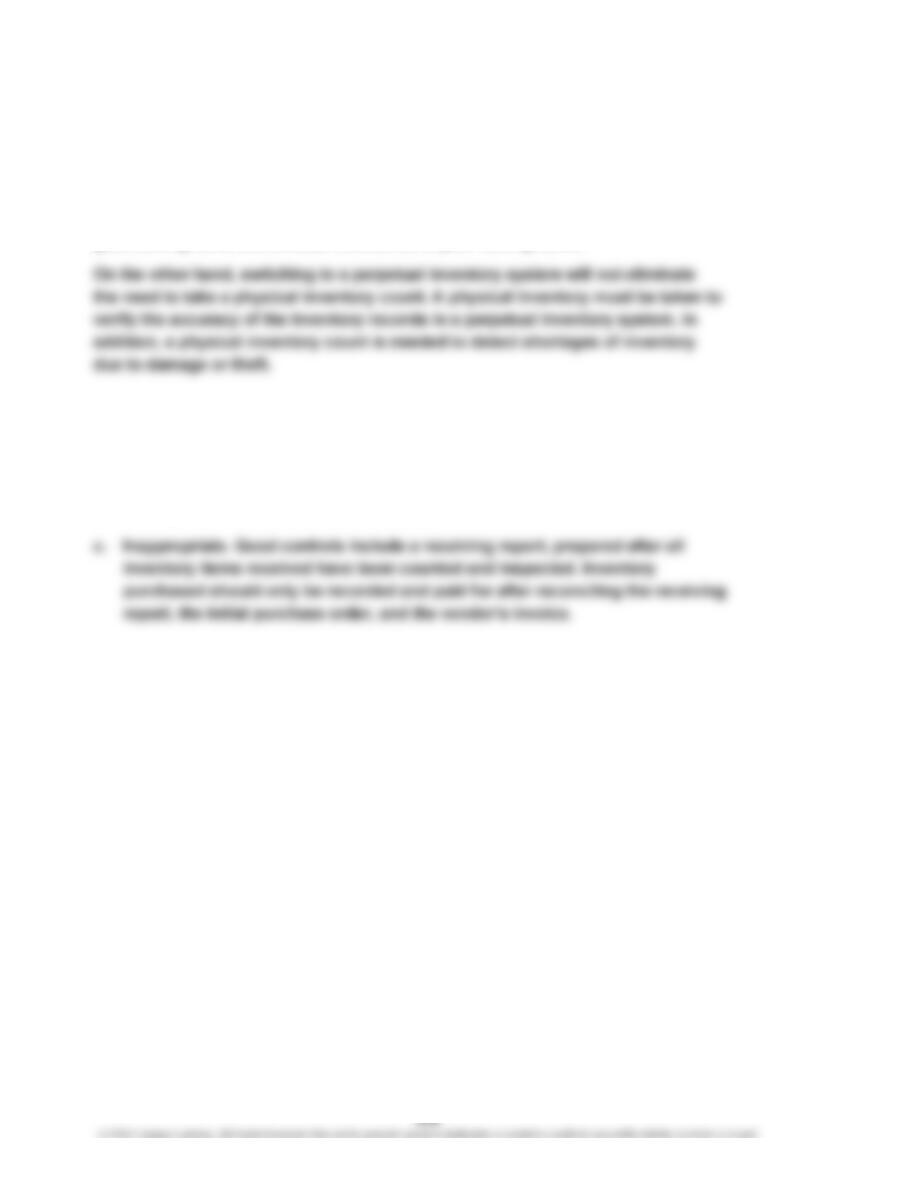
1. The receiving report should be reconciled to the initial purchase order and the vendor’s invoice
b
efore recording or paying for inventory purchases. This procedure will verify that the inventory
received matches the type and quantity of inventory ordered. It also verifies that the vendor’s invoice
is charging the company for the actual quantity of inventory received at the agreed-upon price.
3. No, they are not techniques for determining physical quantities. The terms refer to cost flow
assumptions, which affect the determination of the cost prices assigned to items in the inventory.
5. FIFO
7. The merchandise should be valued using the lower of its cost of $1,350 or its market (net realizable)
value of $1,295 ($1,475
–
$180). Thus, the merchandise should be valued at its market value of $1,29
5
9. Bibbins Company. Since the merchandise was shipped FOB shipping point, title passed to
10. Manufacturer’s. The manufacturer retains title until the goods are sold. Thus, any unsold merchandise
CHAPTER 6
INVENTORIES
DISCUSSION QUESTIONS
CHAPTER 6 Inventories
PE 6–1A
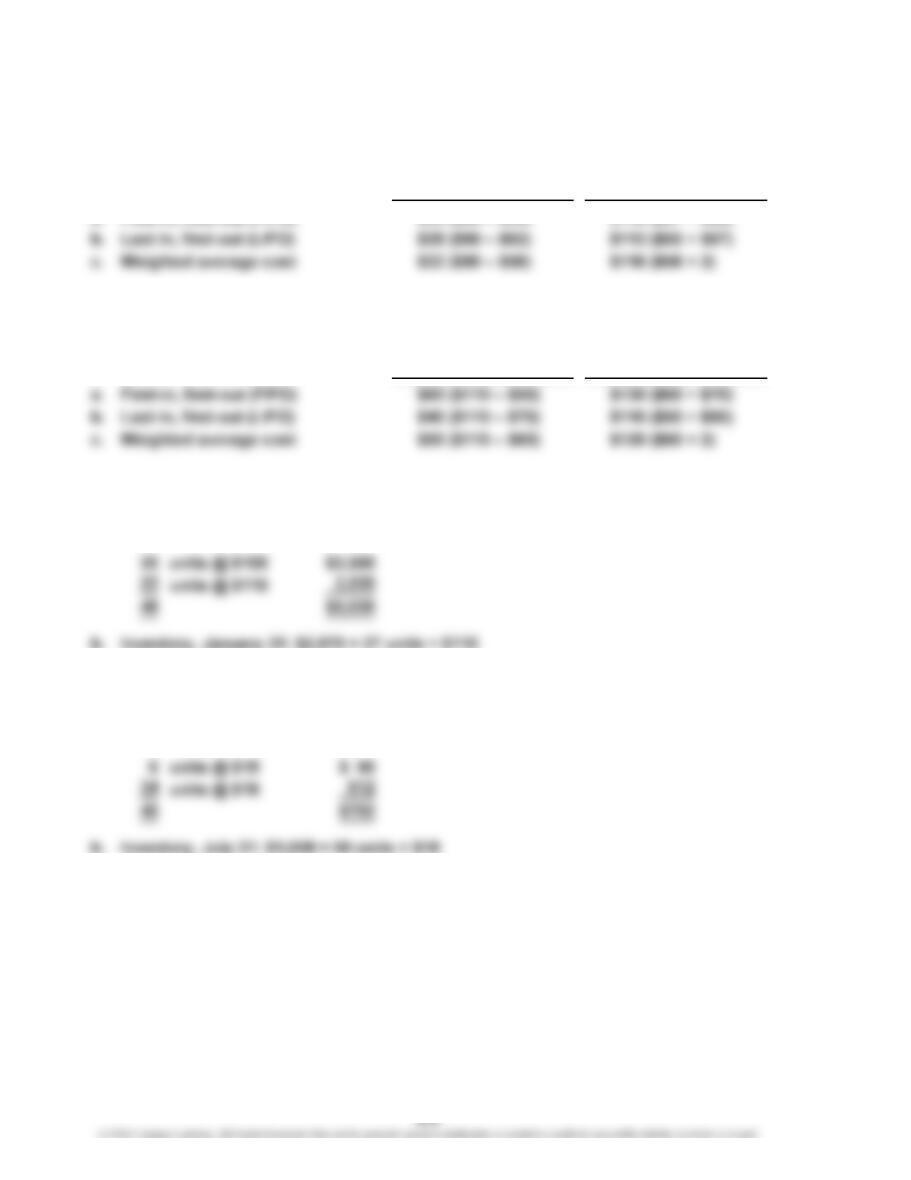
a. First-in, first-out (FIFO)
PE 6–1B
PE 6–2A
a. Cost of merchandise sold (January 25):
PE 6–2B
a. Cost of merchandise sold (July 24):
$119 ($57 + $62)$35 ($90 – $55)
PRACTICE EXERCISES
Gross Profit
November
Ending Inventory
November 30
June June 30
Gross Profit Ending Inventory
CHAPTER 6 Inventories
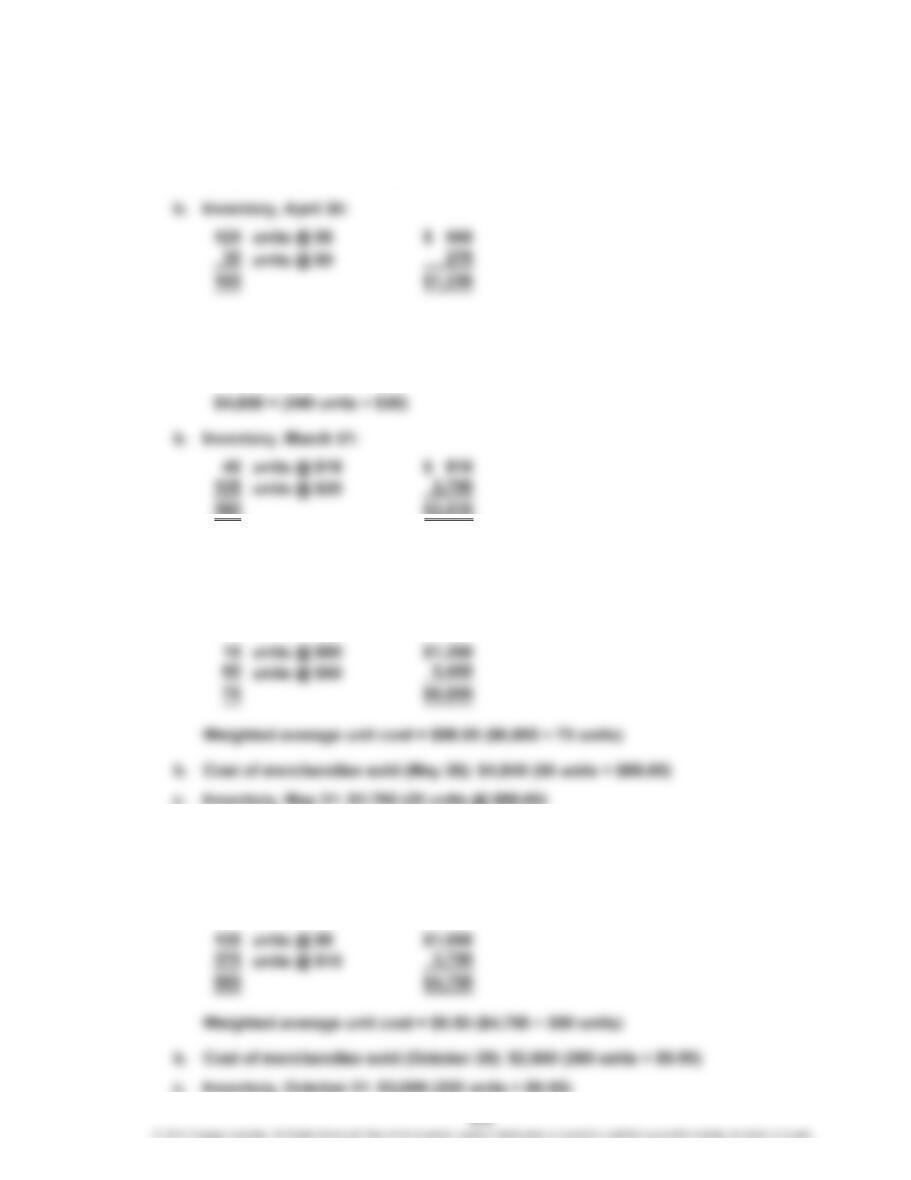
PE 6–3A
a. Cost of merchandise sold (April 27):
$2,250 = (250 units × $9)
PE 6–3B
a. Cost of merchandise sold (March 27):
PE 6–4A
a. Weighted average unit cost: $88
Inventory total cost after purchase on May 23:
PE 6–4B
a. Weighted average unit cost: $9.50
Inventory total cost after purchase on October 22:
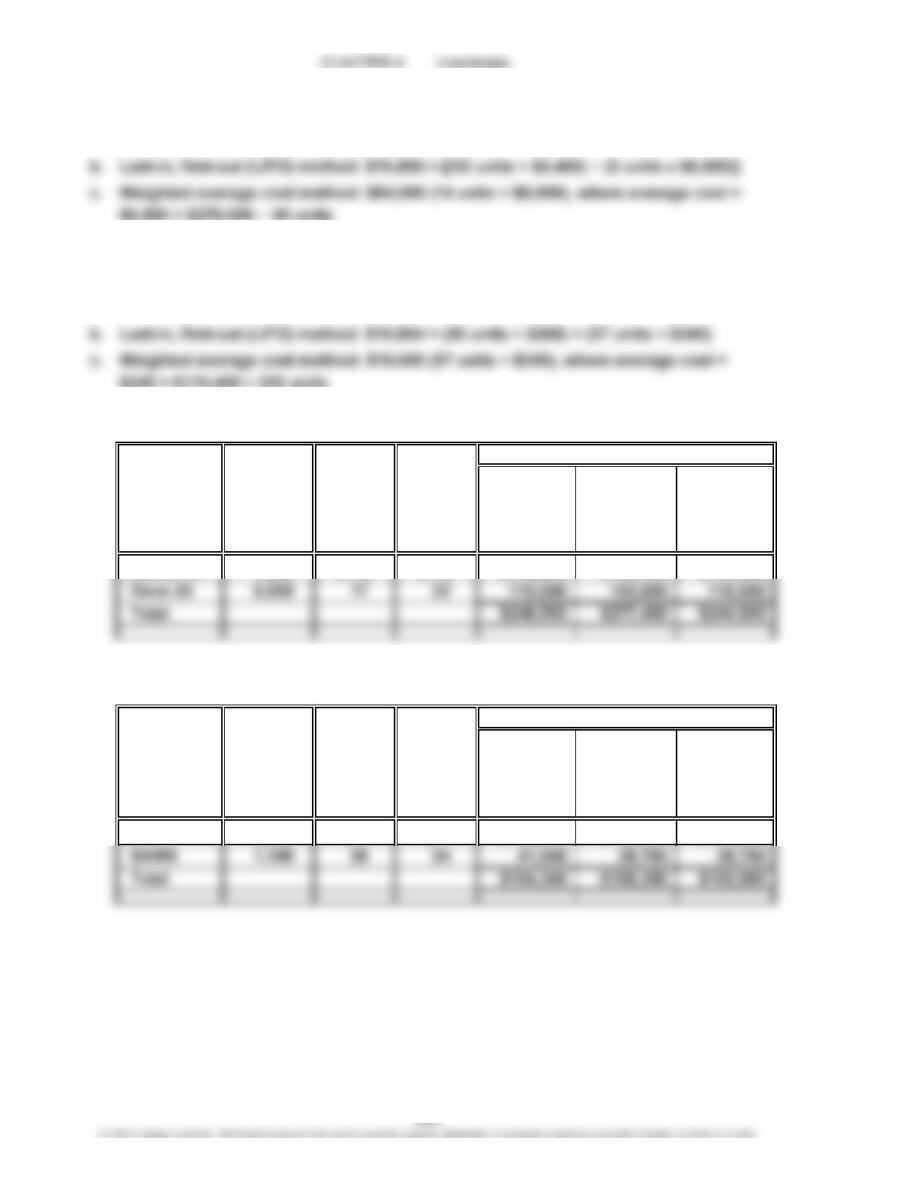
PE 6–5A
a. First-in, first-out (FIFO) method: $90,720 = 14 units × $6,480
PE 6–5B
a. First-in, first-out (FIFO) method: $20,094 = (40 units × $357) + (17 units × $342)
PE 6–6A
Market Total
Value per
Cost Unit (Net
Inventory per Realizable
Commodity Quantity Unit Value) Cost Market LCM
Raven 10 1,200 $115 $112 $138,000 $134,400 $134,400
PE 6–6B
Market
Value per
Cost Unit (Net
Inventory per Realizable
Commodity Quantity Unit Value) Cost Market LCM
JFW1 6,330 $10 $11 $ 63,300 $ 69,630 $ 63,300
Total
CHAPTER 6 Inventories
PE 6–7A
Balance Sheet:
Merchandise inventory understated*…………………
Current assets understated……………………………
…
Total assets understated………………………………
…
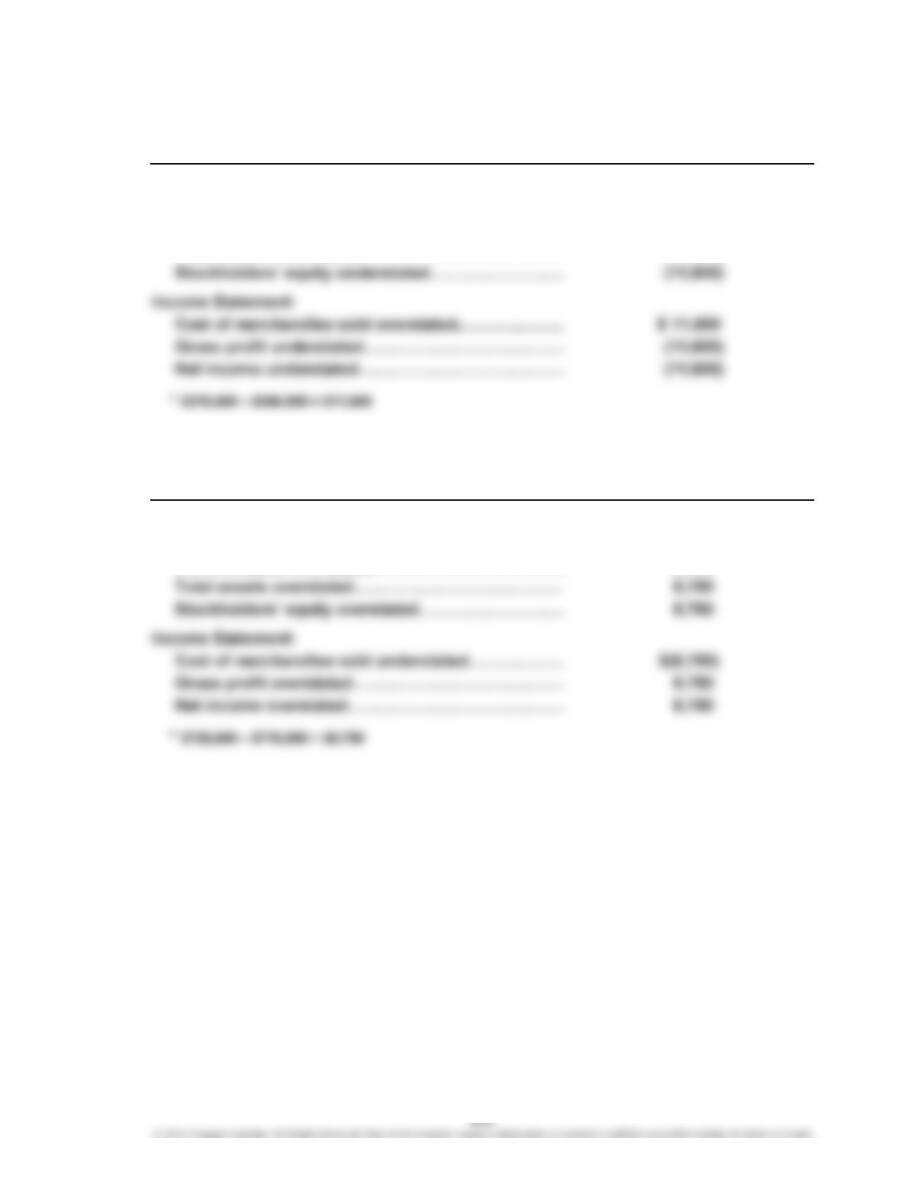
PE 6–7B
Balance Sheet:
Merchandise inventory overstated*…………………
…
Current assets overstated……………………………
…
…
…
8,780
Overstatement (Understatement)
Amount of Misstatement
Amount of Misstatement
Overstatement (Understatement)
$ 8,780
$(11,600)
(11,600)
(11,600)
…
…
…
…
CHAPTER 6 Inventories
PE 6–8A
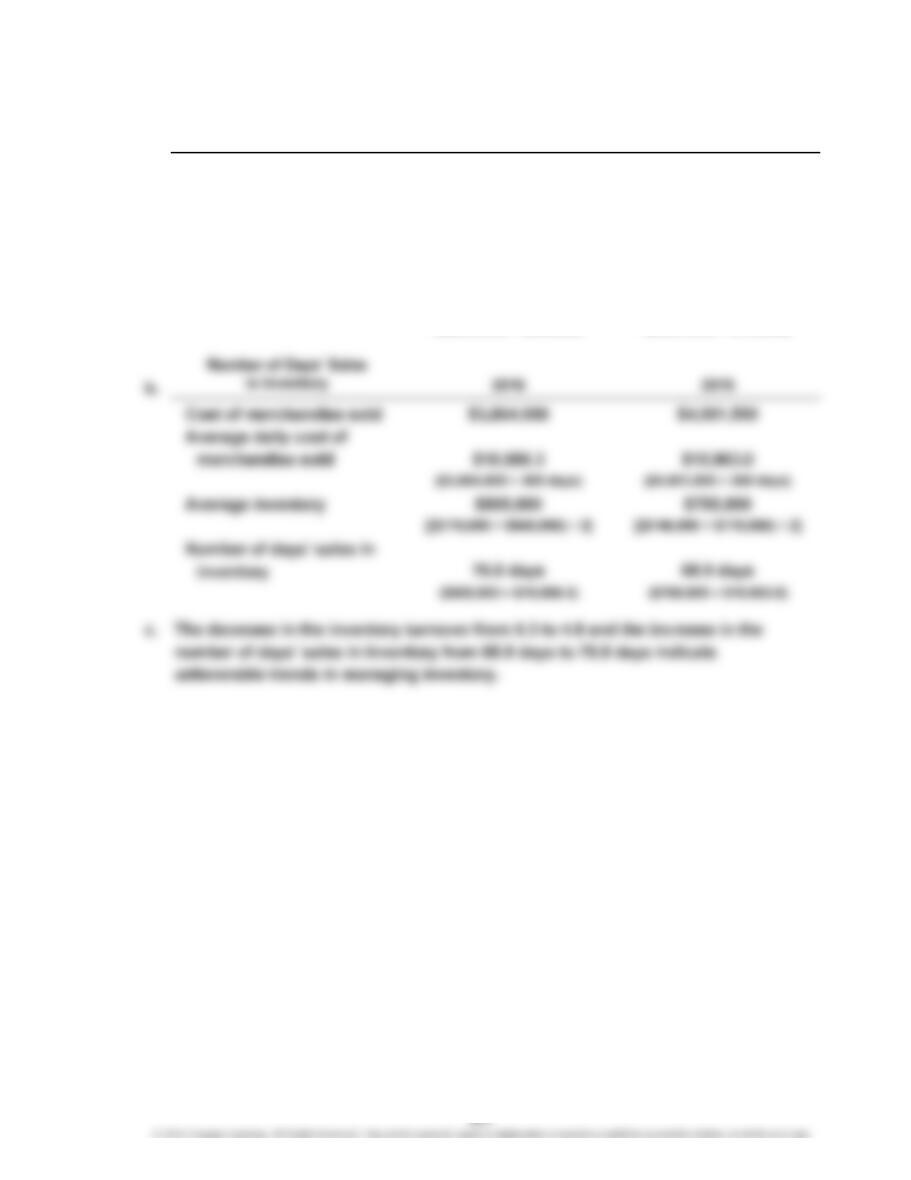
a.
Cost of merchandise sold
Inventories:
Beginning of year
End of year
Average inventory
Inventory Turnover
$788,000 $760,000
$850,000 $788,000
$819,000 $774,000
2016 2015
$4,504,500 $3,715,200
CHAPTER 6 Inventories
PE 6–8B
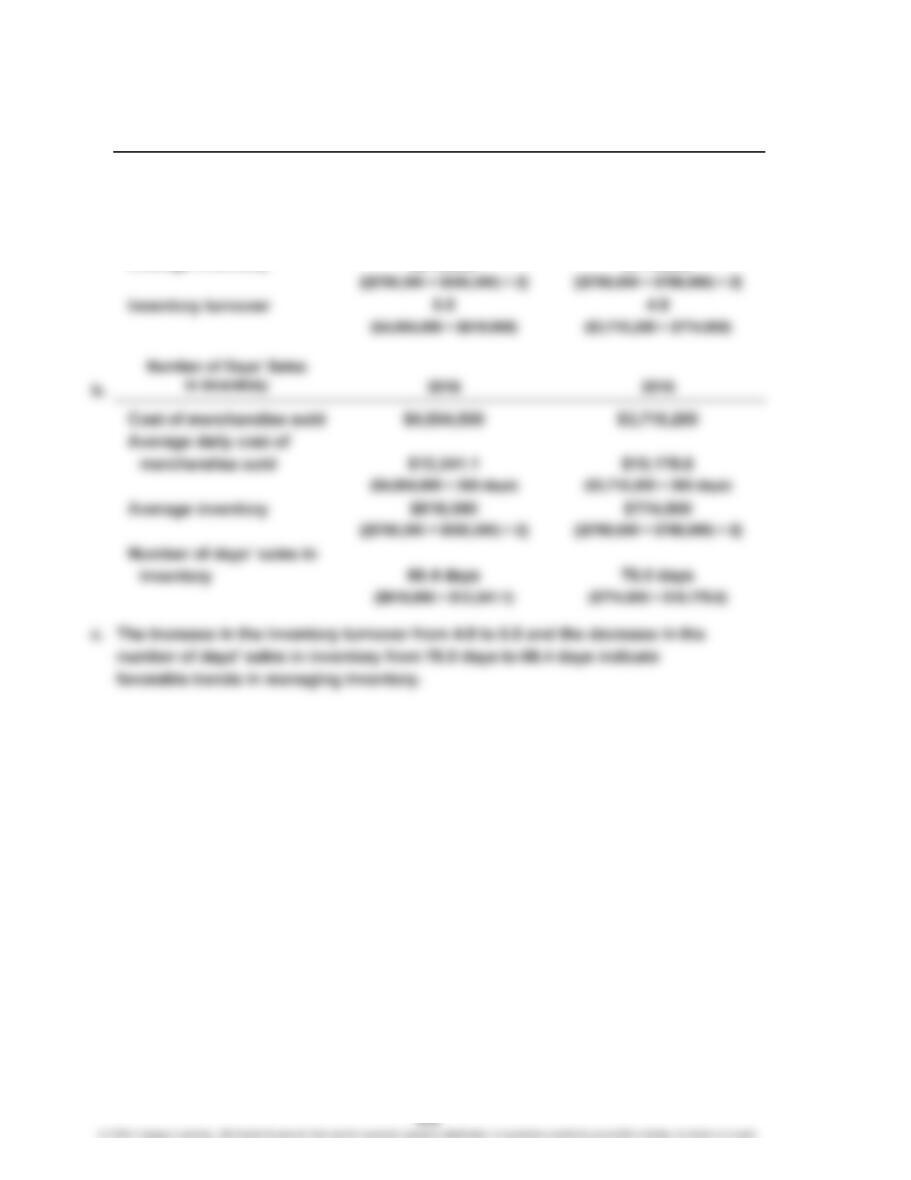
a.
Cost of merchandise sold
Inventories:
Beginning of year
End of year
Average inventory
Inventory turnover
Inventory Turnover
4.8 5.3
($3,864,000 ÷ $805,000) ($4,001,500 ÷ $755,000)
2016 2015
$770,000 $740,000
$3,864,000 $4,001,500
[($770,000 + $840,000) ÷ 2] [($740,000 + $770,000) ÷ 2]
$840,000 $770,000
$805,000 $755,000
CHAPTER 6 Inventories
Ex. 6–1
Switching to a perpetual inventory system will strengthen Triple Creek Hardware’s
internal controls over inventory because the store managers will be able to keep
track of how much of each item is on hand. This should minimize shortages of
good-selling items and excess inventories of poor-selling items.
Ex. 6–2
a. Appropriate. The inventory tags will protect the inventory from customer theft.
b. Inappropriate. The control of using security measures to protect the inventory
is violated if the stockroom is not locked.
EXERCISES
CHAPTER 6 Inventories
Ex. 6–3
a.
Unit Total Unit Total Unit Total
Quantity Cost Cost Quantity Cost Cost Quantity Cost Cost
June 1 240 78 18,720
10 180 78 14,040 60 78 4,680
15 280 80 22,400 60 78 4,680
Date
Portable DVD Players
Purchases Cost of Merchandise Sold Inventory
CHAPTER 6 Inventories
Ex. 6–4
Unit Total Unit Total Unit Total
Quantity Cost Cost Quantity Cost Cost Quantity Cost Cost
Jun. 1 240 78 18,720
10 180 78 14,040 60 78 4,680
15 280 80 22,400 60 78 4,680
280 80 22,400
Date
Portable DVD Players
Purchases Cost of Merchandise Sold Inventory
CHAPTER 6 Inventories
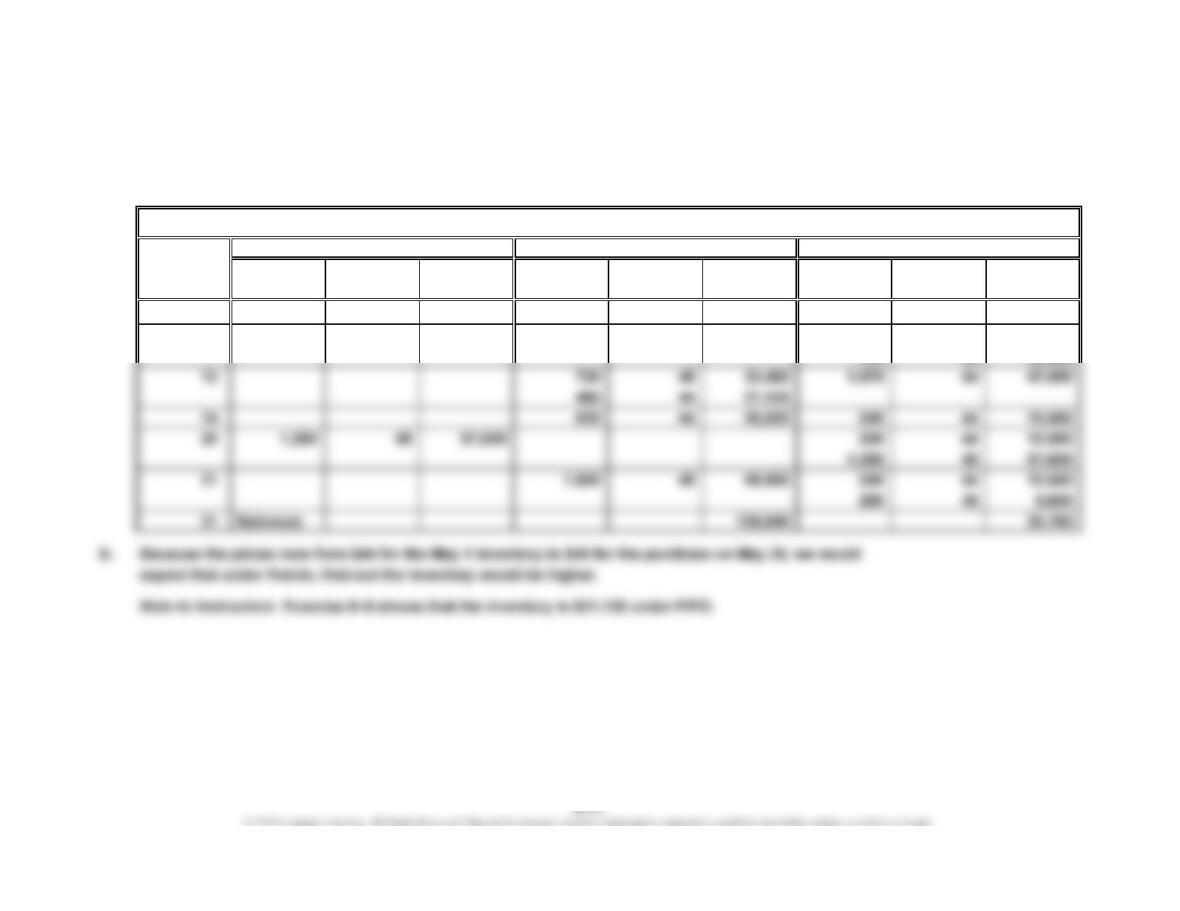
Ex. 6–5
a.
Unit Total Unit Total Unit Total
Quantity Cost Cost Quantity Cost Cost Quantity Cost Cost
May 1 1,550 44 68,200
10 720 45 32,400 1,550 44 68,200
720 45 32,400
Date
Prepaid Cell Phones
Purchases Cost of Merchandise Sold Inventory
CHAPTER 6 Inventories
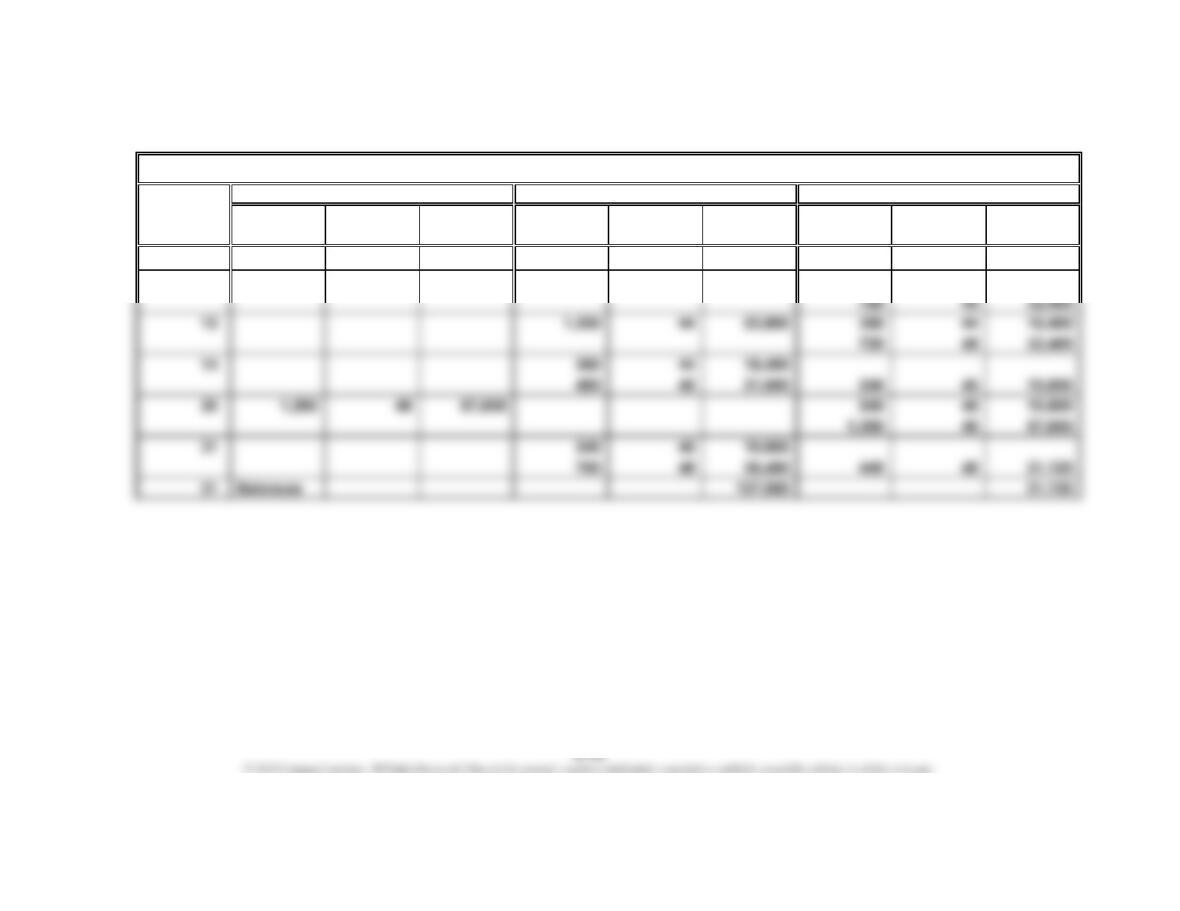
Ex. 6–6
Unit Total Unit Total Unit Total
Quantity Cost Cost Quantity Cost Cost Quantity Cost Cost
May 1 1,550 44 68,200
10 720 45 32,400 1,550 44 68,200
Date
Prepaid Cell Phones
Purchases Cost of Merchandise Sold Inventory
CHAPTER 6 Inventories
Ex. 6–7
a. $22,880 ($4.40 × 5,200 units)
b. $22,000 [($4.00 × 1,200 units) + ($4.20 × 2,000 units) + ($4.40 × 2,000 units)] = $4,800 + $8,400 + $8,800
Ex. 6–8
Cost of Merchandise Sold
Unit Total Unit Total Total
Quantity Cost Cost Quantity Cost Cost Quantity Unit Cost Cost
Jan. 1 10,000 75.00 750,000
Mar. 18 8,000 75.00 600,000 2,000 75.00 150,000
Inventory
Date
Purchases
CHAPTER 6 Inventories
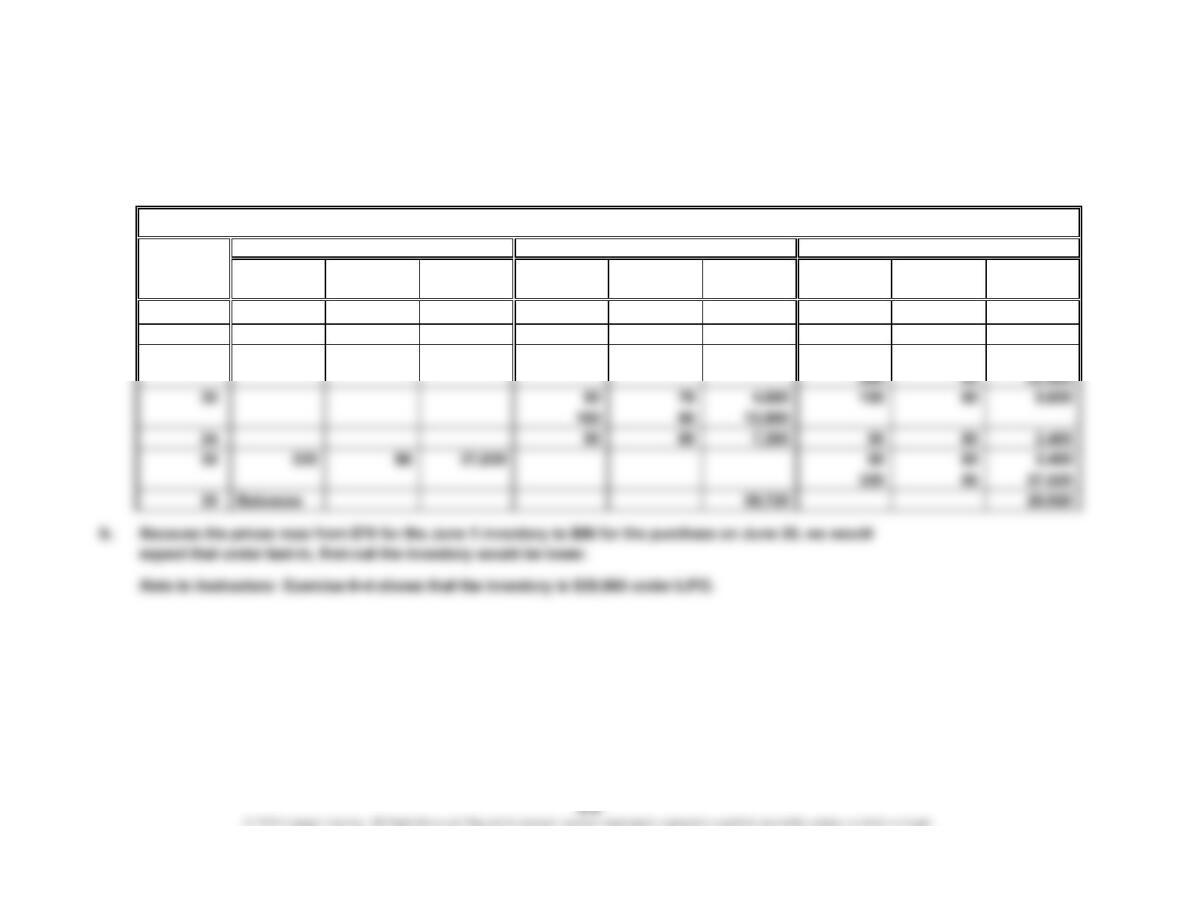
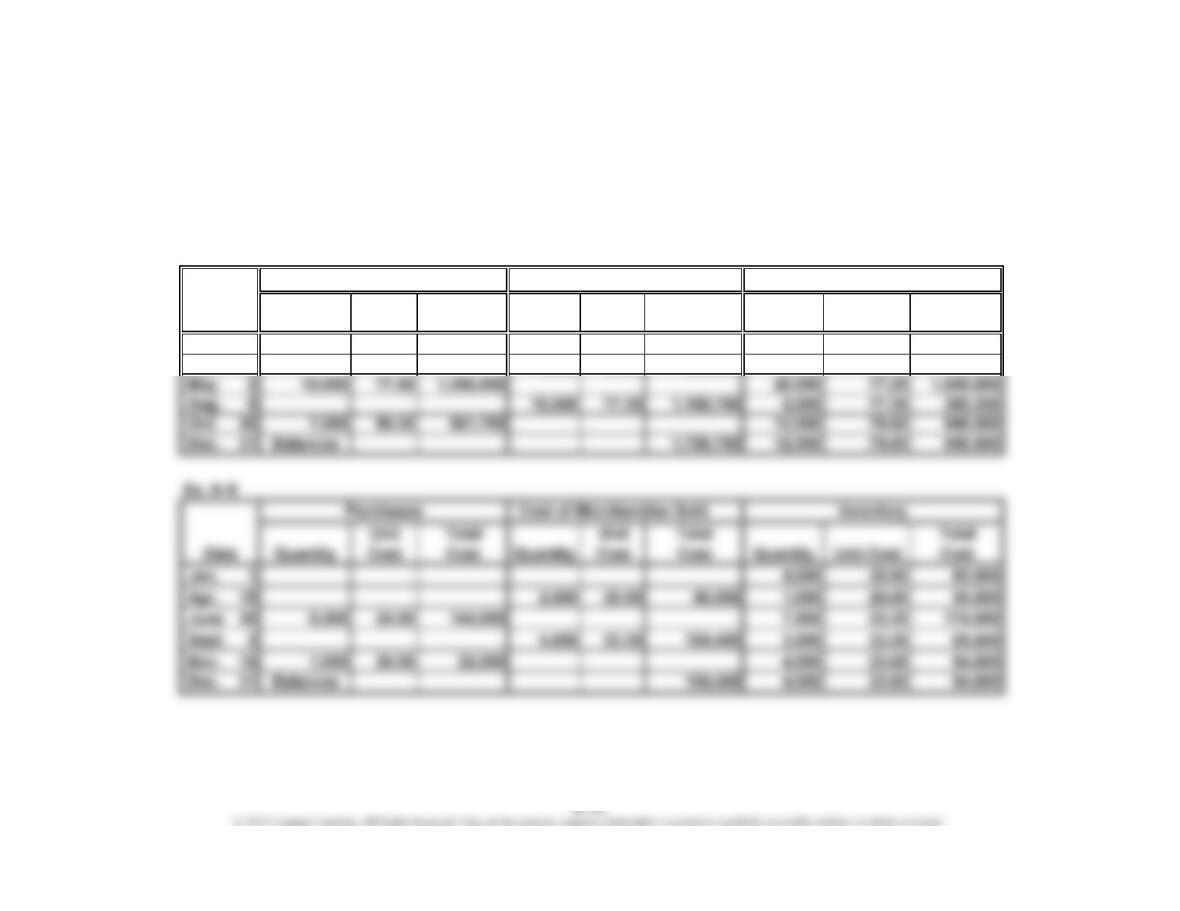
Ex. 6–10
Cost of Merchandise Sold
Unit Total Unit Total Total
Quantity Cost Cost Quantity Cost Cost Quantity Unit Cost Cost
Jan. 1 4,000 20.00 80,000
Apr. 19 2,500 20.00 50,000 1,500 20.00 30,000
Date
InventoryPurchases
CHAPTER 6 Inventories
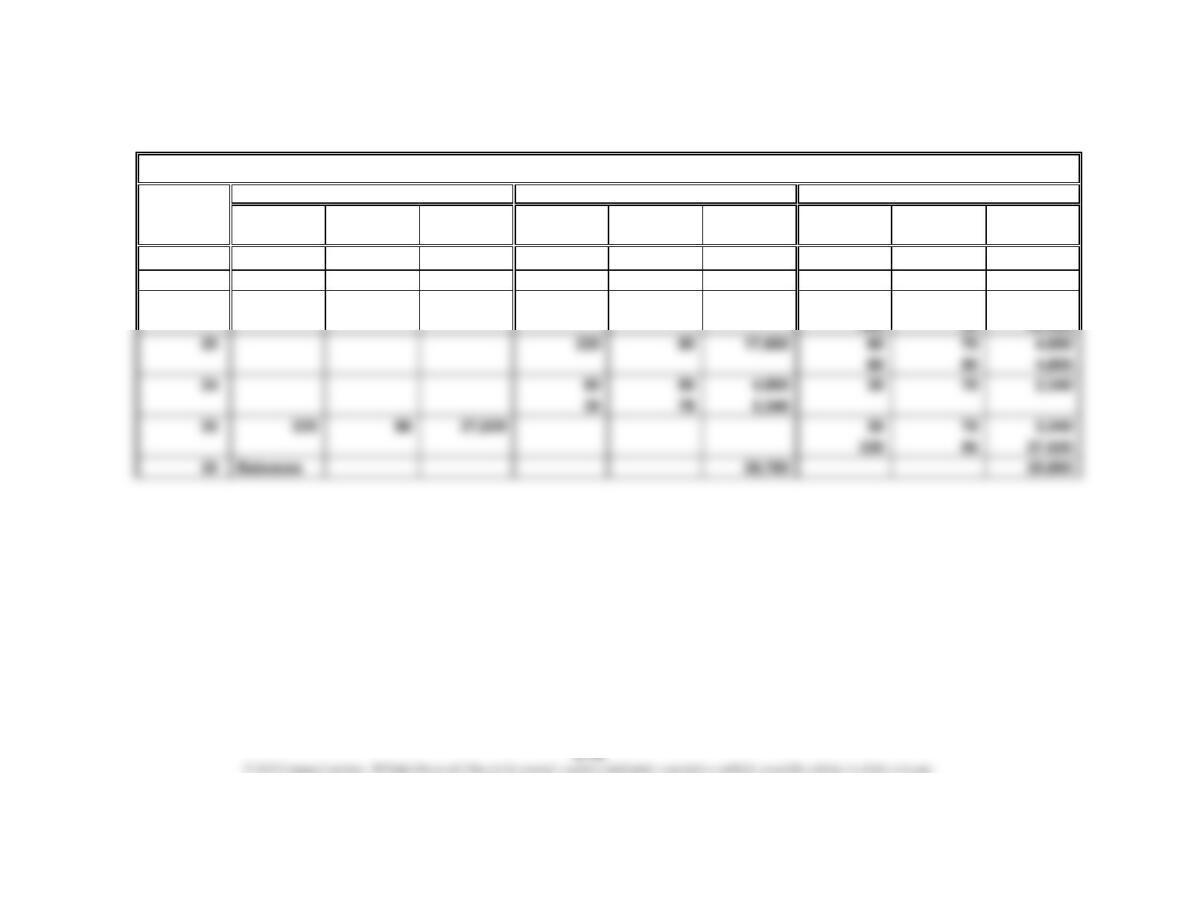
Ex. 6–11
Inventory
Unit Total Unit Total Total
Quantity Cost Cost Quantity Cost Cost Quantity Unit Cost Cost
Jan. 1 4,000 20.00 80,000
Apr. 19 2,500 20.00 50,000 1,500 20.00 30,000
June 30 6,000 24.00 144,000 1,500 20.00 30,000
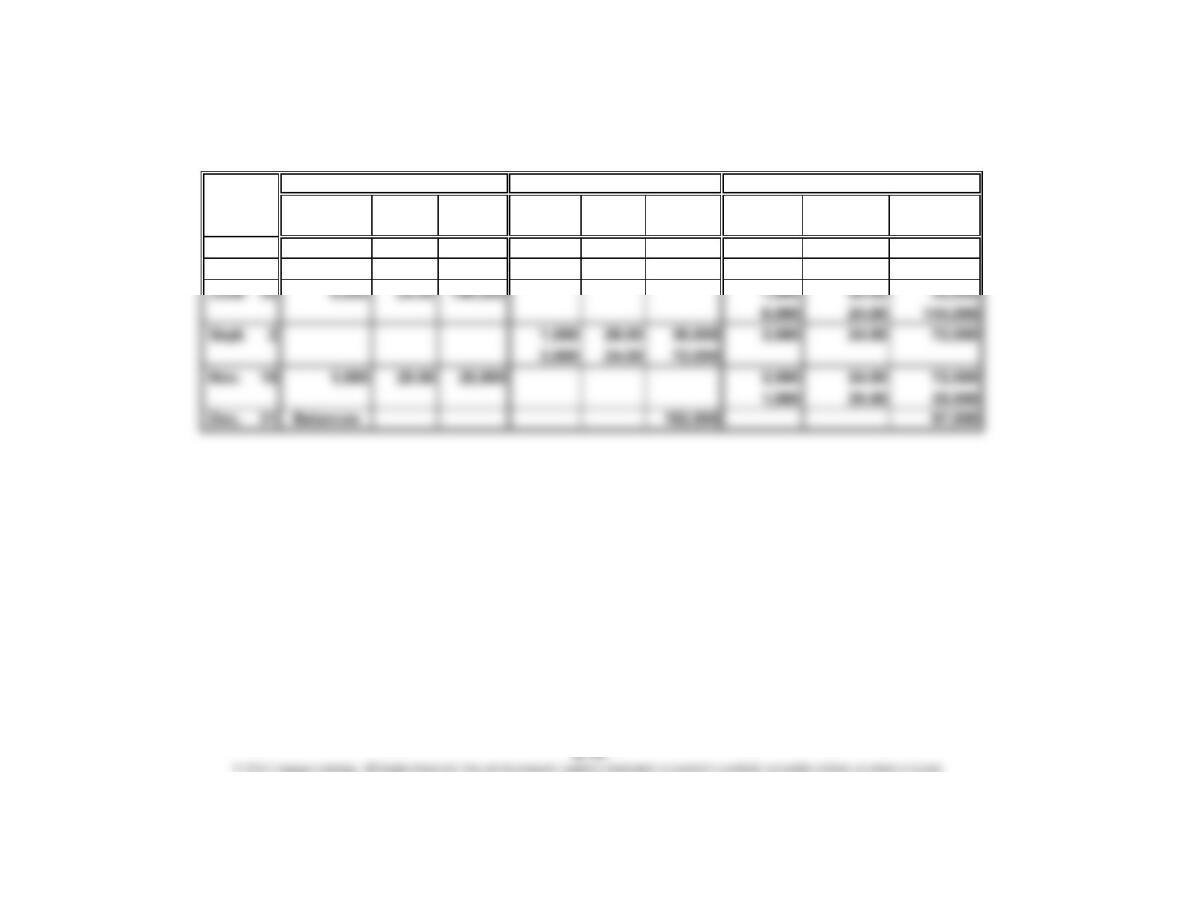
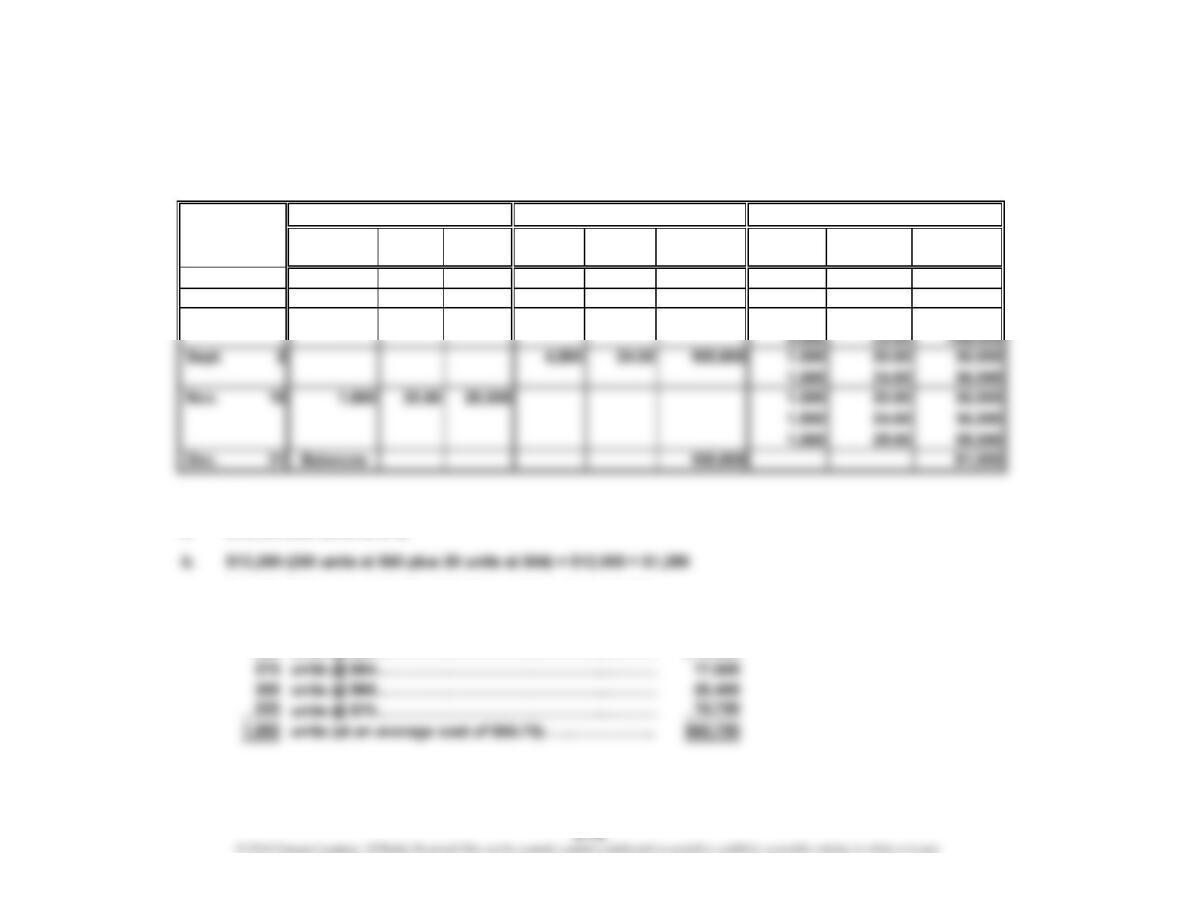
Ex. 6–12
a. $15,400 (220 units at $70)
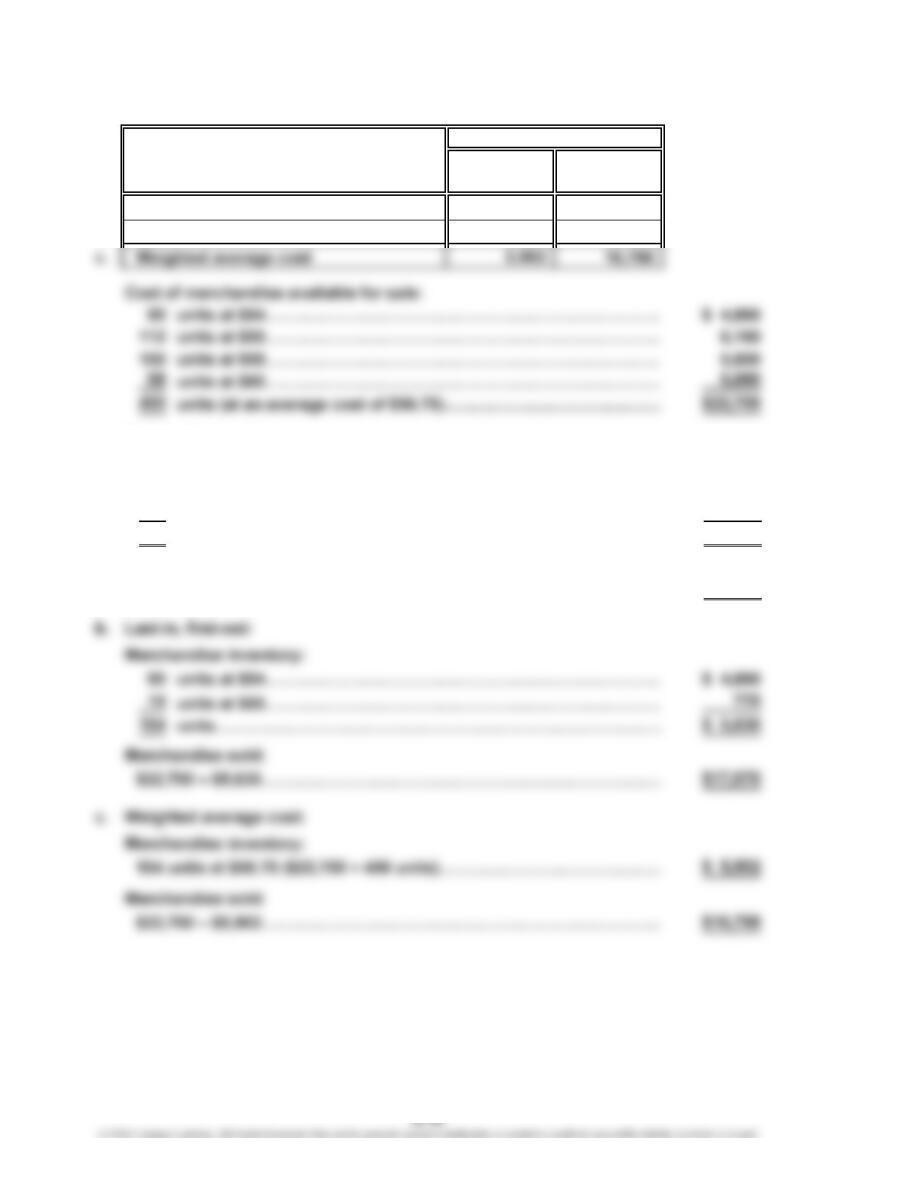
c. $14,465 (220 units at $1,764; $65,750 ÷ 1,000 units = $65.75)
Cost of merchandise available for sale:
200 units @ $60………………………………………………
…
$12,000
…
…
…
…
Date
Cost of Merchandise SoldPurchases
CHAPTER 6 Inventories
Ex. 6–13
Merchandise Merchandise
Inventory Method Inventory Sold
a. FIFO $6,228 $16,472
b. LIFO 5,630 17,070
a. First-in, first-out:
Merchandise inventory:
98 units at $60…………………………………………………..…………… $ 5,880
6units at $58………………………………………………………………
…
348
104 units……………………………………………………..…………………
…
$ 6,228
Merchandise sold:
$22,700 – $6,228…………………………………….…………………………
…
$16,472
…
Cost
…
…
CHAPTER 6 Inventories
Ex. 6–14
2. FIFO cost of goods sold < (less than) LIFO cost of goods sold
4. FIFO income taxes > (greater than) LIFO income taxes
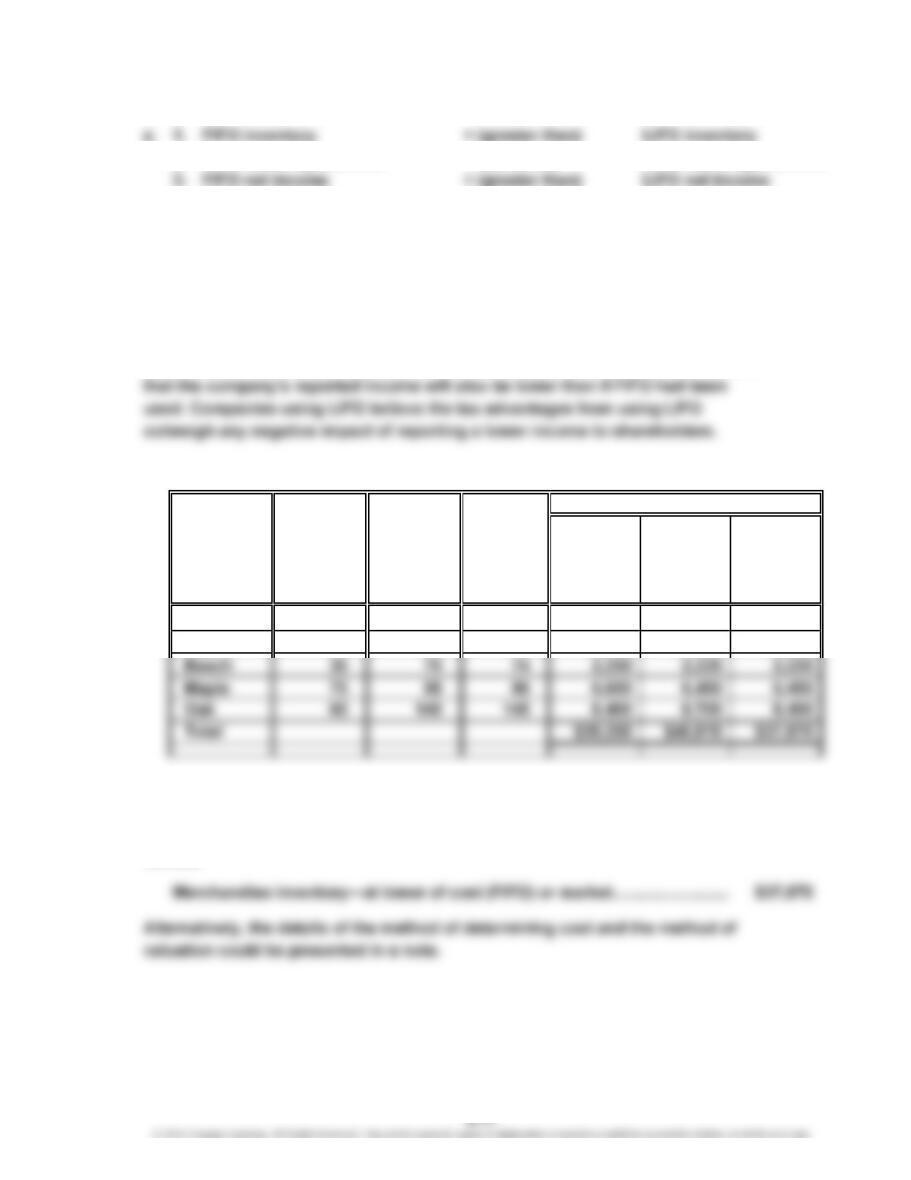
b. In periods of rising prices, the income shown on the company’s tax return
would be lower if LIFO rather than FIFO were used; thus, there is a tax advantage
of using LIFO.
Note to Instructors: The federal tax laws require that if LIFO is used for tax
purposes, LIFO must also be used for financial reporting purposes. This is
known as the LIFO conformity rule. Thus, selecting LIFO for tax purposes means
Ex. 6–15
Market
Value per
Cost Unit (Net
Inventory per Realizable
Quantity Unit Value) Cost Market LCM
80 $140 $125 $11,200 $10,000 $10,000
120 90 112 10,800 13,440 10,800
Ex. 6–16
The merchandise inventory would appear in the Current Assets section, as
follows:
Ash
Total
Commodity
Aspen
CHAPTER 6 Inventories
Ex. 6–17
a.
Merchandise inventory*………………………………………
…
$5,200 understated
Current assets…………………………………………………
…
$5,200 understated
Total assets……………………………………………………
…
$5,200 understated
d. The December 31, 2017, balance sheet would be correct, since the 2016
inventory error reverses itself in 2017.
Ex. 6–18
a.
Merchandise inventory*………………………………………
…
$8,650 overstated
Current assets…………………………………………………
…
$8,650 overstated
…
…
…
…
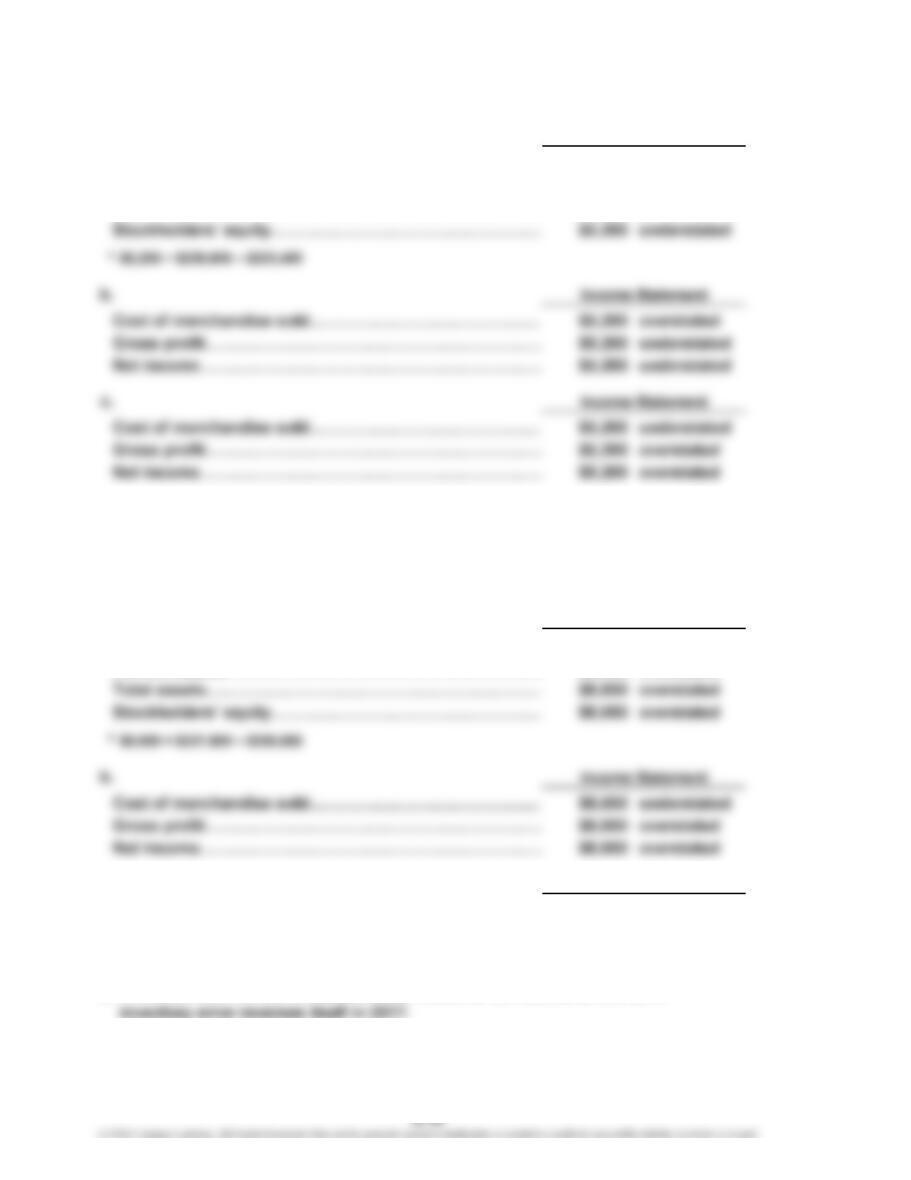
c.
Cost of merchandise sold……………………………………
…
$8,650 overstated
Gross profit……………………………………………………… $8,650 understated
Net income………………………………………………………
…
$8,650 understated
d. The December 31, 2017, balance sheet would be correct, since the 2016
Balance Sheet
Income Statement
Balance Sheet
…
…
…
…
…
CHAPTER 6 Inventories
Ex. 6–19
When an error is discovered affecting the prior period, it should be corrected. In
this case, the merchandise inventory account should be debited and the retained
earnings account credited for $42,750.
Ex. 6–20
a. Apple: 112.1 {$87,846,000 ÷ [($776,000 + $791,000) ÷ 2]}
American Greetings: 3.8 {$741,645 ÷ [($179,730 + $208,945) ÷ 2]}
CHAPTER 6 Inventories
Ex. 6–21
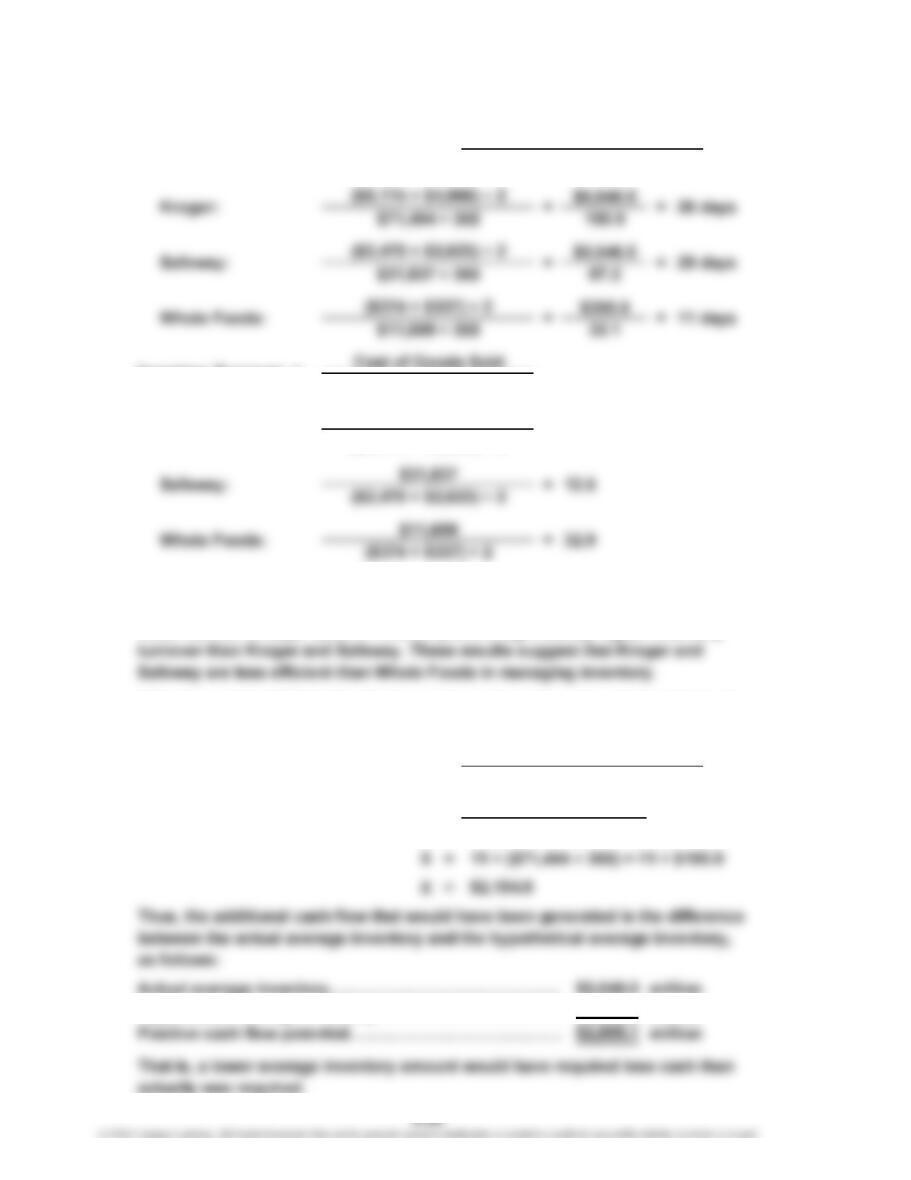
b. The number of days’ sales in inventory and the inventory turnover ratios are
relatively the same for Kroger and Safeway. Whole Foods has a significantly
lower number of days’ sales in inventory and a significantly higher inventory
c. If Kroger matched Whole Foods days’ sales in inventory, then its hypothetical
ending inventory would be determined as follows,
Hypothetical average inventory……………………………
…
2,154.9 million
($5,114 + $4,966) ÷ 2
Inventory Turnover =
11 days
Kroger: $71,494
=X
($71,494 ÷ 365)
=
Average Inventory
a.
Cost of Goods Sold ÷ 365
Average Inventory
Number of Days’ Sales in Inventory = Average Inventory
Cost of Goods Sold ÷ 365
Number of Days’ Sales in Inventory
=
14.2