
Chapter 6
Inventory & Cost of Goods Sold
Ethics Check
(5-10 min.) EC 6-1
a. Due care
b. Integrity
c. Objectivity and independence
d. Integrity
Short Exercises
(10-15 min.) S 6-1
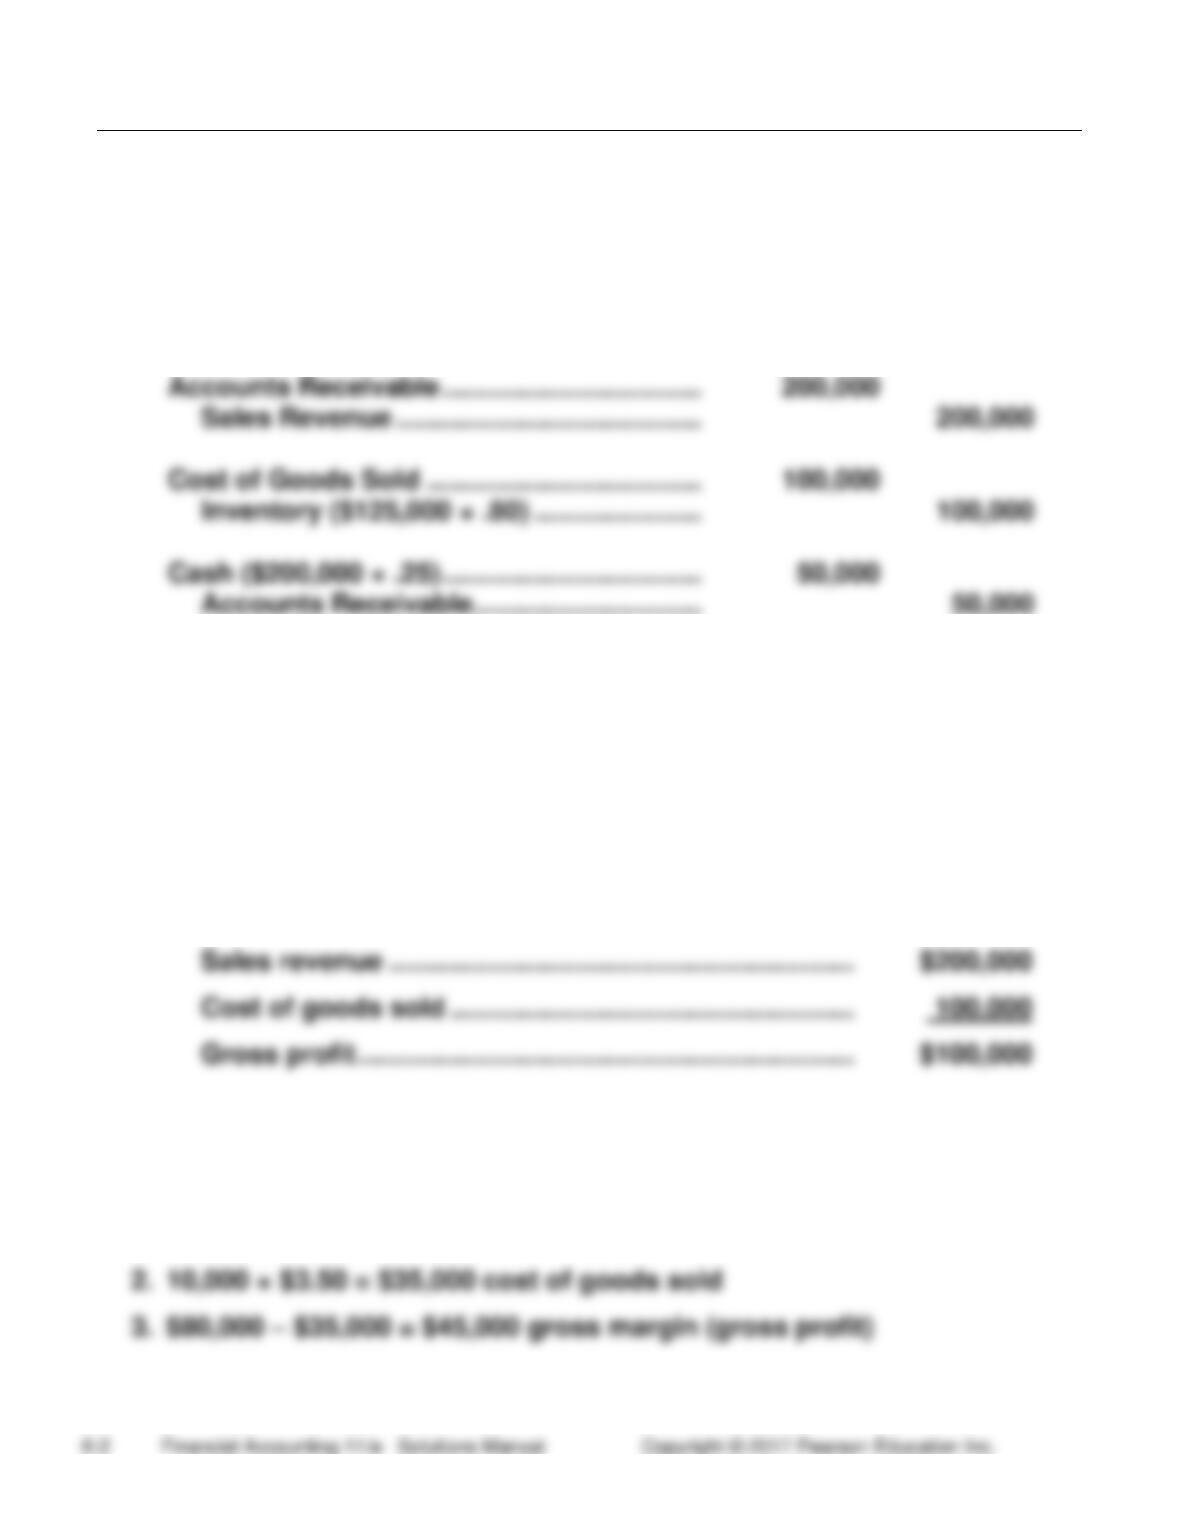
1. (Journal entries)
Inventory ………………………………………………
125,000
Accounts Payable ……………………………..
125,000
200,000
Sales Revenue ………………………………….
200,000
Cost of Goods Sold ………………………………
100,000
Inventory ($125,000 × .80) ………………….
100,000
Cash ($200,000 × .25) …………………………….
Accounts Receivable …………………………
2. (Financial statements)
BALANCE SHEET
Current assets:
Inventory ($125,000 − $100,000) ………………………
$ 25,000
INCOME STATEMENT
Sales revenue …………………………………………………….
Cost of goods sold ……………………………………………..
Gross profit ………………………………………………………..
(5 min.) S 6-2
1. 10,000 × $8.00 = $80,000 sales revenue
(5 min.) S 6-3
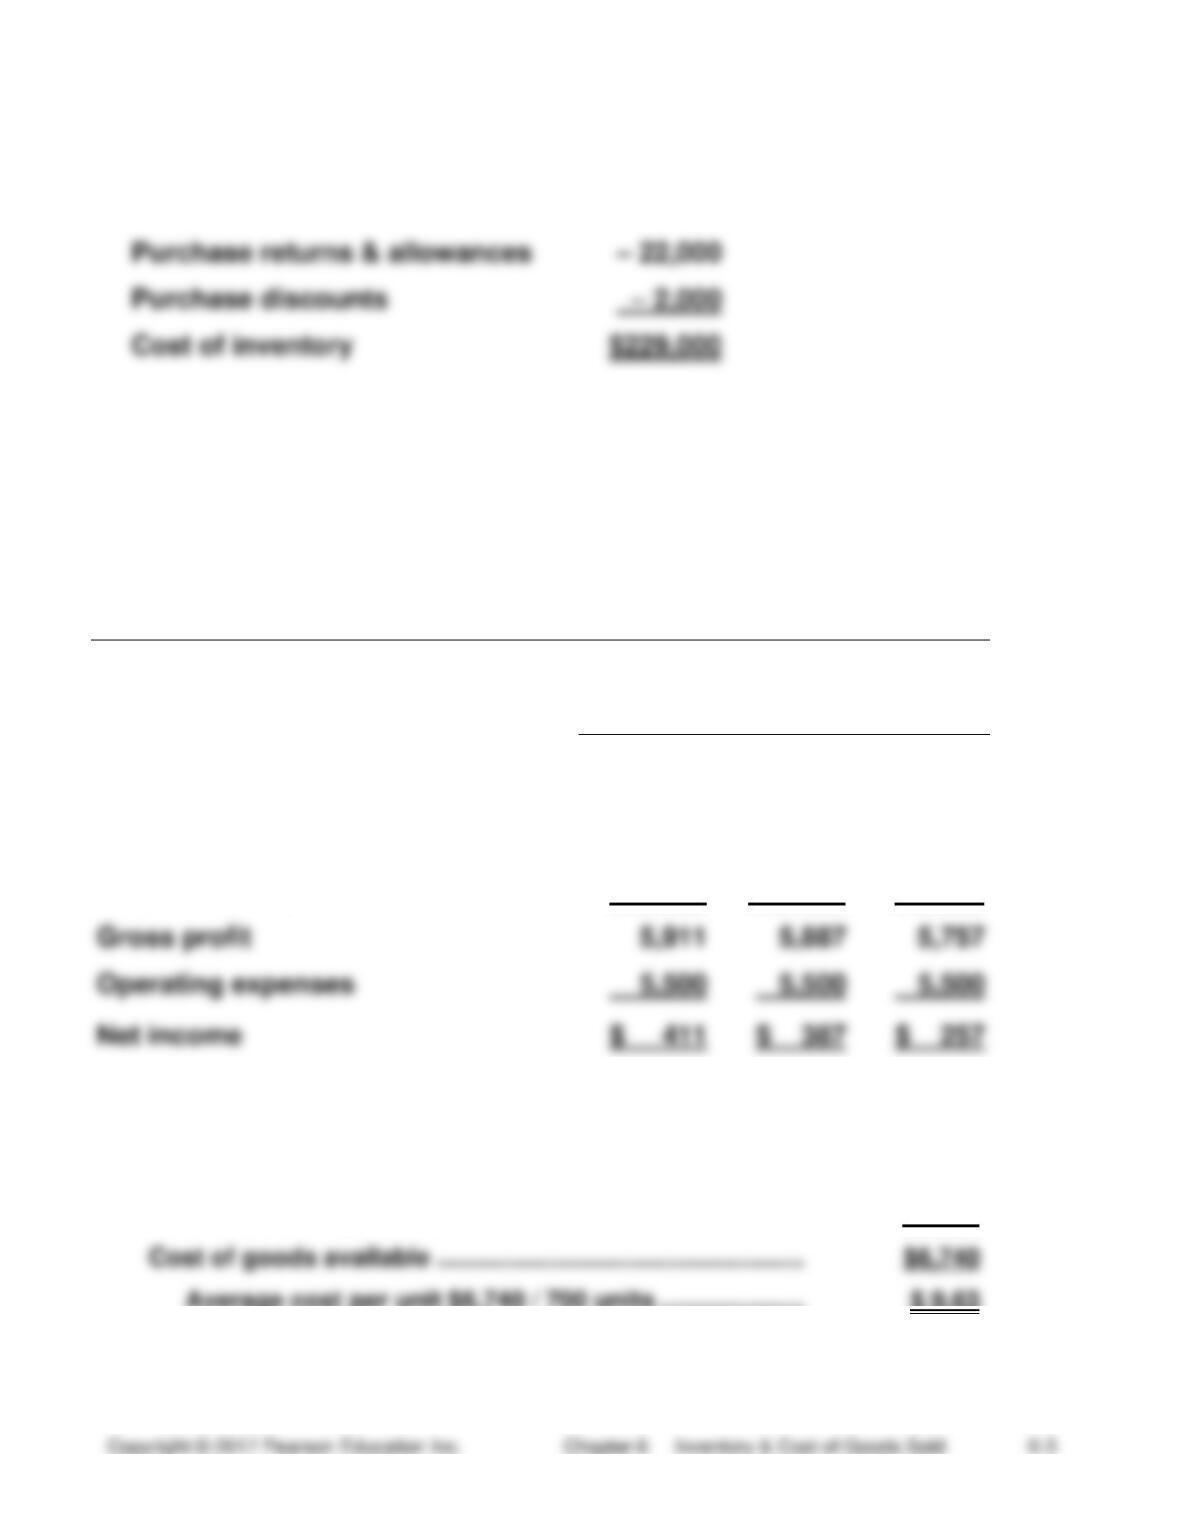
Purchases $250,000
Freight-in + 3,000
(10-15 min.) S 6-4
McDonough Copy Center
Income Statement
Year Ended December 31, Current Year
Average
FIFO
LIFO
Sales revenue (570 × $20.00)
$11,400
$11,400
$11,400
Cost of goods sold (570 × $9.63*)
5,489
(100 × $8.60) + (470 × $9.90)
5,513
(570 × $9.90)
5,643
Net income
$ 411
_____
*Average cost per unit:
Beginning inventory (100 @ $8.00) ……………………………..
$ 800
Purchases (600 @ $9.90) …………………………………………….
5,940
Average cost per unit $6,740 / 700 units …………………
$ 9.63
(10-15 min.) S 6-5
McDonough Copy Center
Income Statement
Year Ended December 31, Current Year
Average
FIFO
LIFO
Sales revenue (570 × $20.00)
$11,400
$11,400
$11,400
Cost of goods sold (570 × $9.63*)
5,489
(100 × $8.60) + (470 × $9.90)
5,513
(570 × $9.90)
______
______
5,643
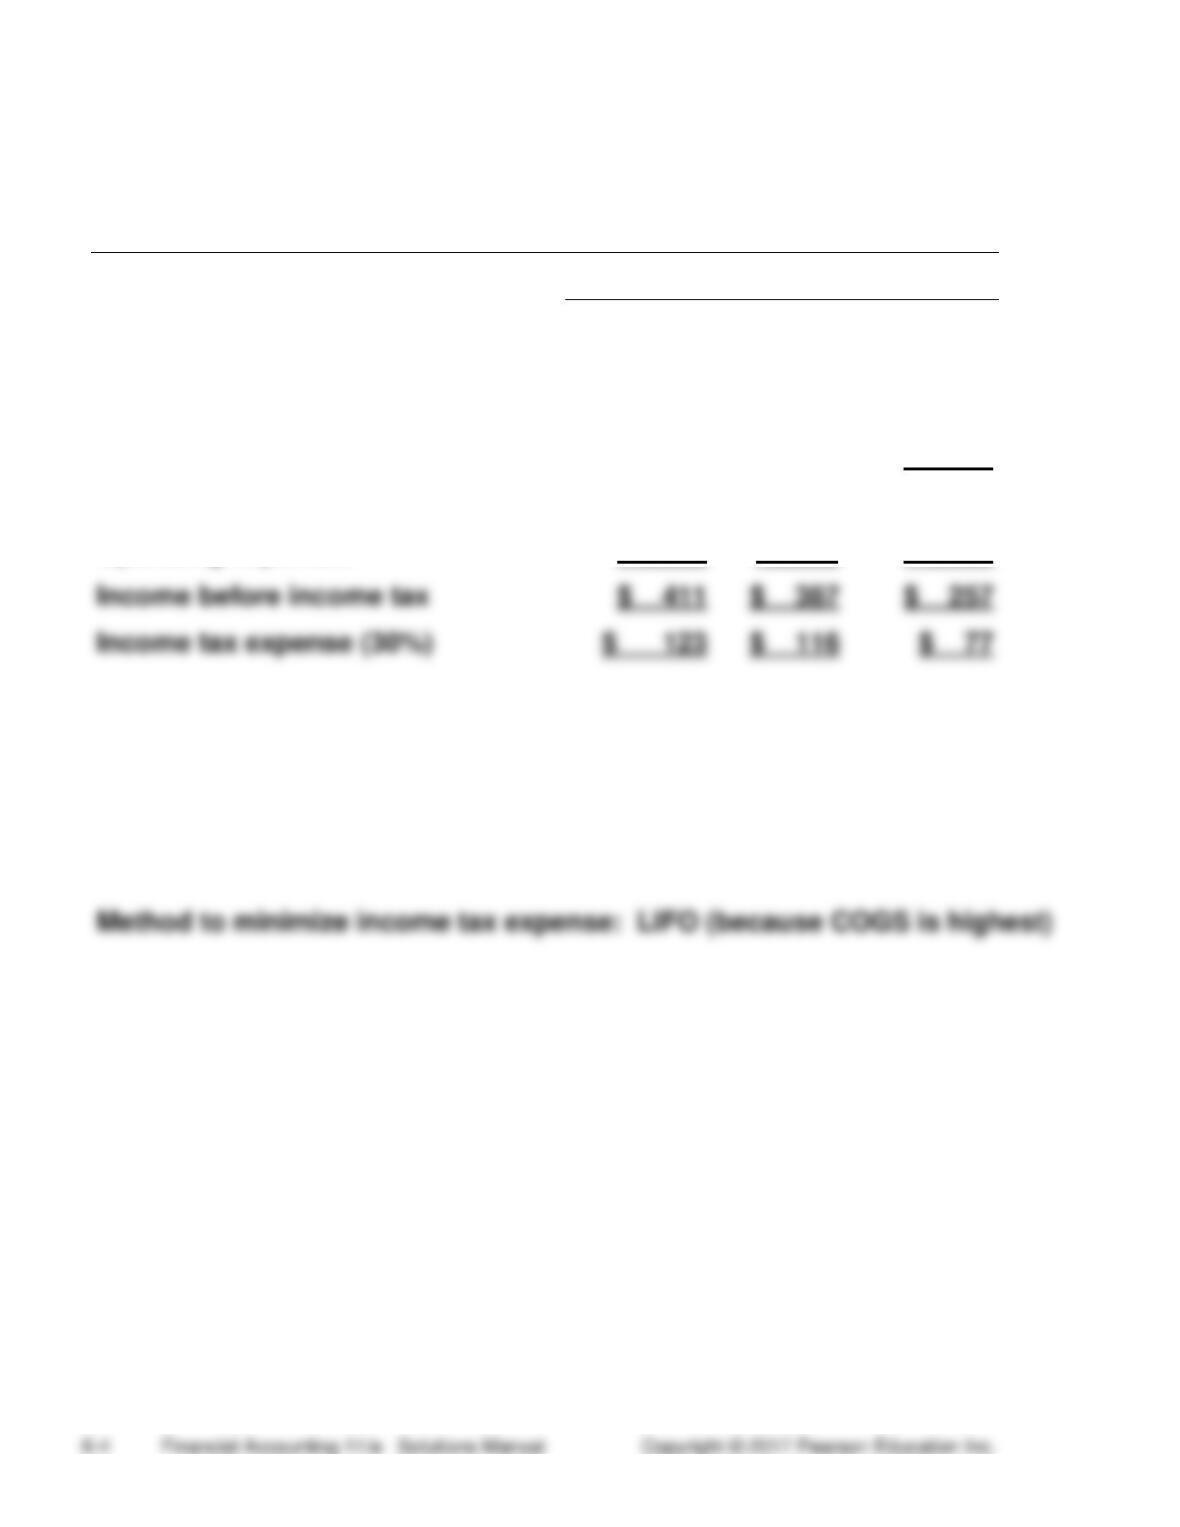
Gross profit
5,911
5,887
5,757
Operating expenses
5,500
5,500
5,500
Income before income tax
$ 257
Income tax expense (30%)
$ 116
Method to maximize reported income (before tax): Average cost (because
COGS is lowest)
*From calculations in S 6-4
(5 min.) S 6-6
Marley Corporation managers can purchase a large amount of inventory
before year end. Under LIFO, these high inventory costs go directly to cost
of goods sold in the current year. Higher cost of goods sold creates lower
net income, and lower net income results in lower income taxes. Saving on
taxes is one reason companies want to decrease their income.
Student responses may vary.
(5-10 min.) S 6-7
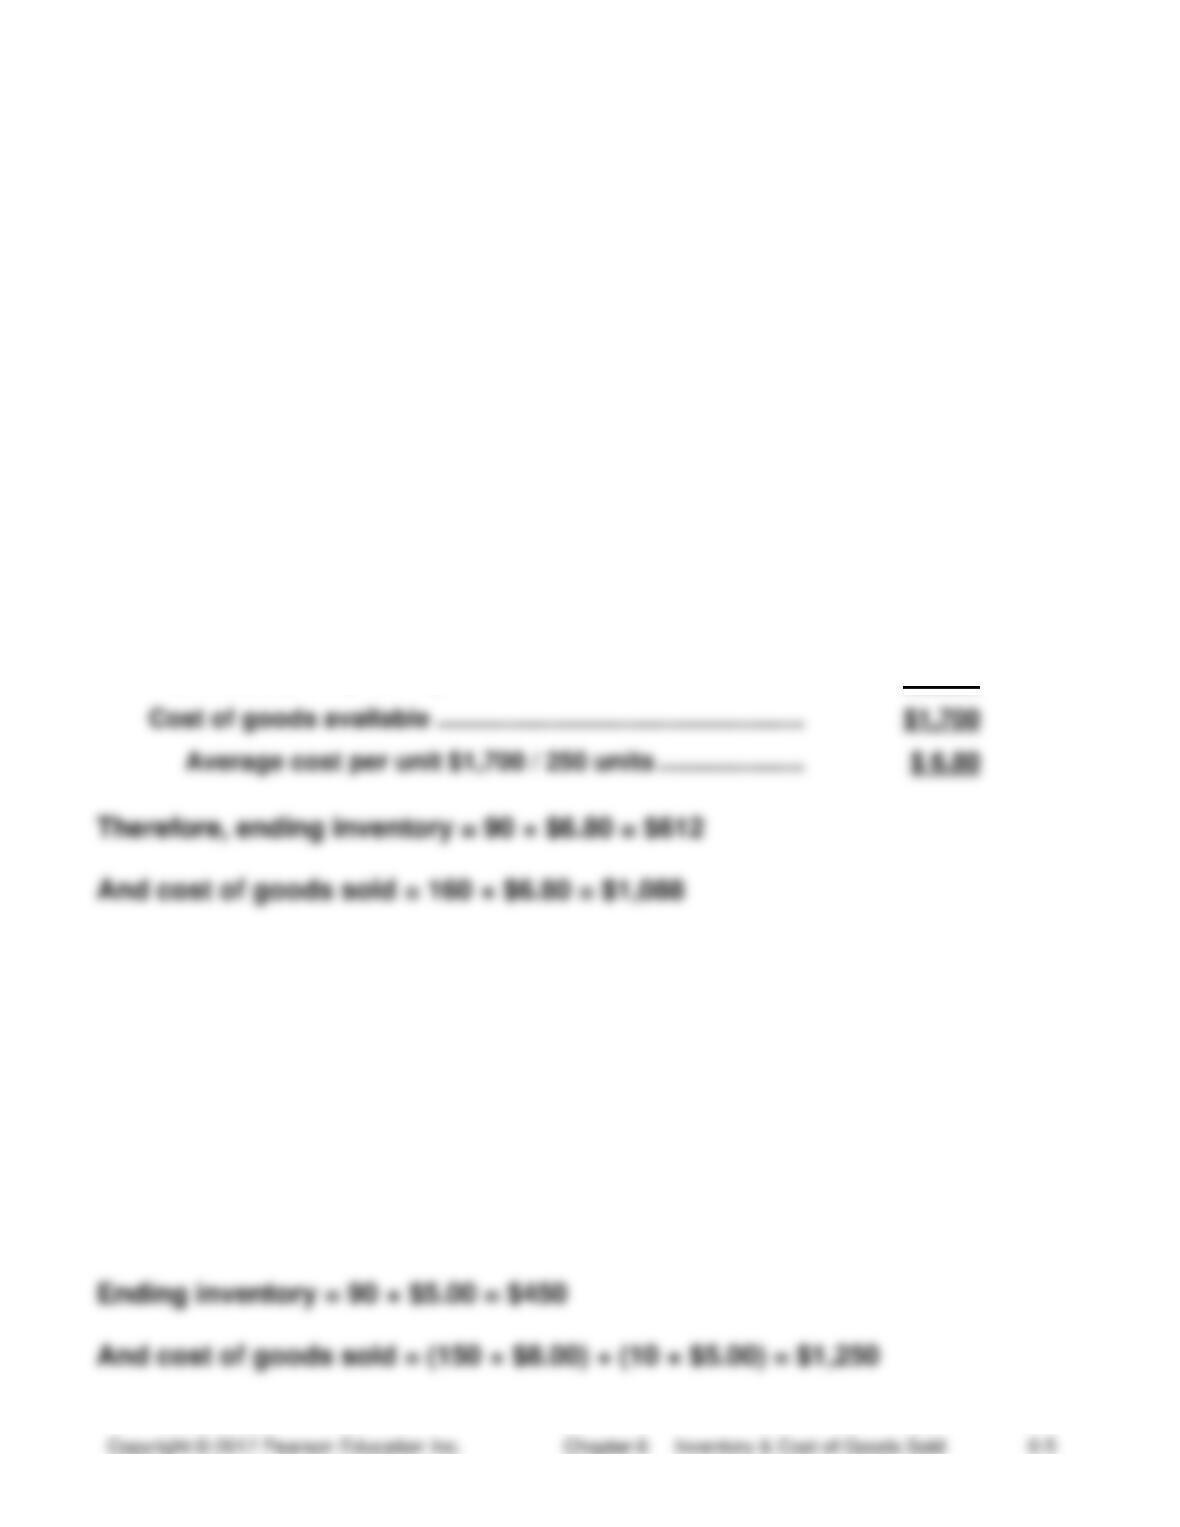
Average cost per unit:
Beginning inventory (100 @ $5.00) ……………………………..
$ 500
Purchases (150 @ $8.00) …………………………………………….
1,200
Cost of goods available ……………………………………………..
Average cost per unit $1,700 / 250 units …………………
(5 min.) S 6-8
Ending inventory = 90 × $8.00 = $720
And cost of goods sold = (100 × $5.00) + (60 × $8.00) = $980
(5 min.) S 6-9
(10-15 min.) S 6-10
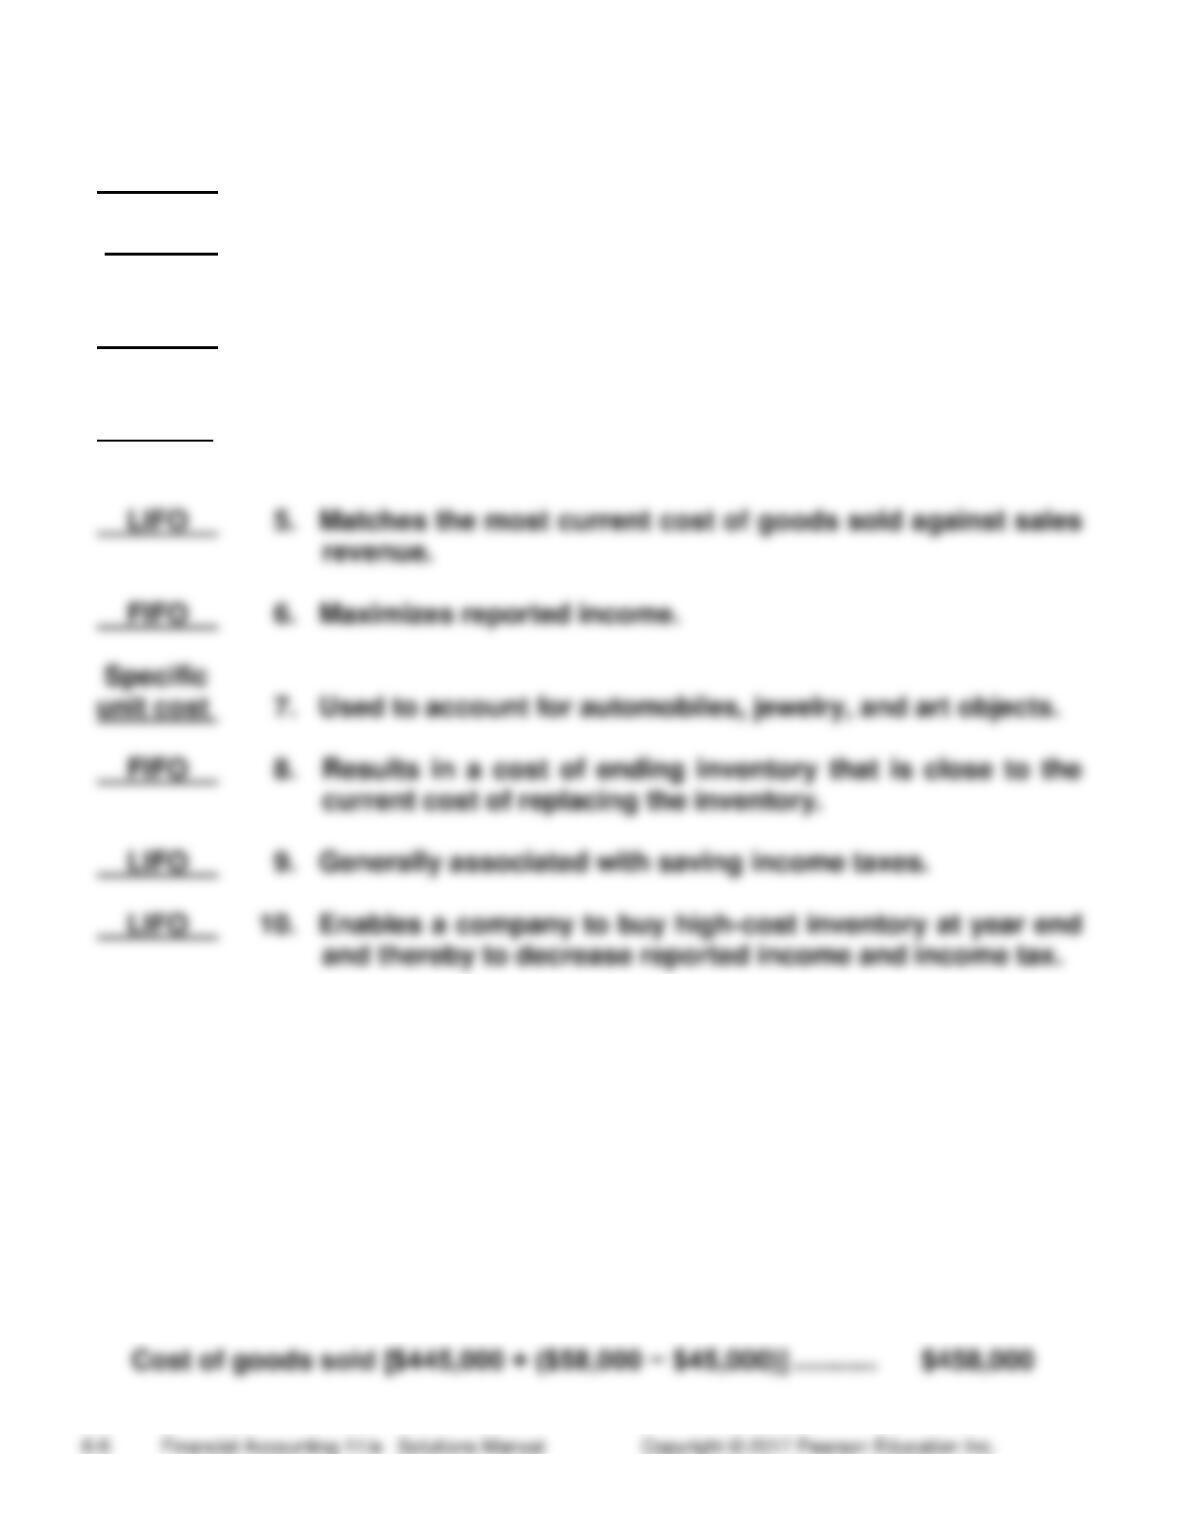
LIFO 1. Results in an old measure of the cost of ending inventory.
Average 2. Provides a middle-ground measure of ending inventory
and cost of goods sold.
LIFO 3. Enables a company to keep reported income from
dropping lower by liquidating older layers of inventory.**
All 4. Writes inventory down when replacement cost drops below
historical cost.
**Wording changed in reprint: “The method of inventory valuation that is disallowed by
IFRS”
(5-10 min.) S 6-11
BALANCE SHEET
Current assets:
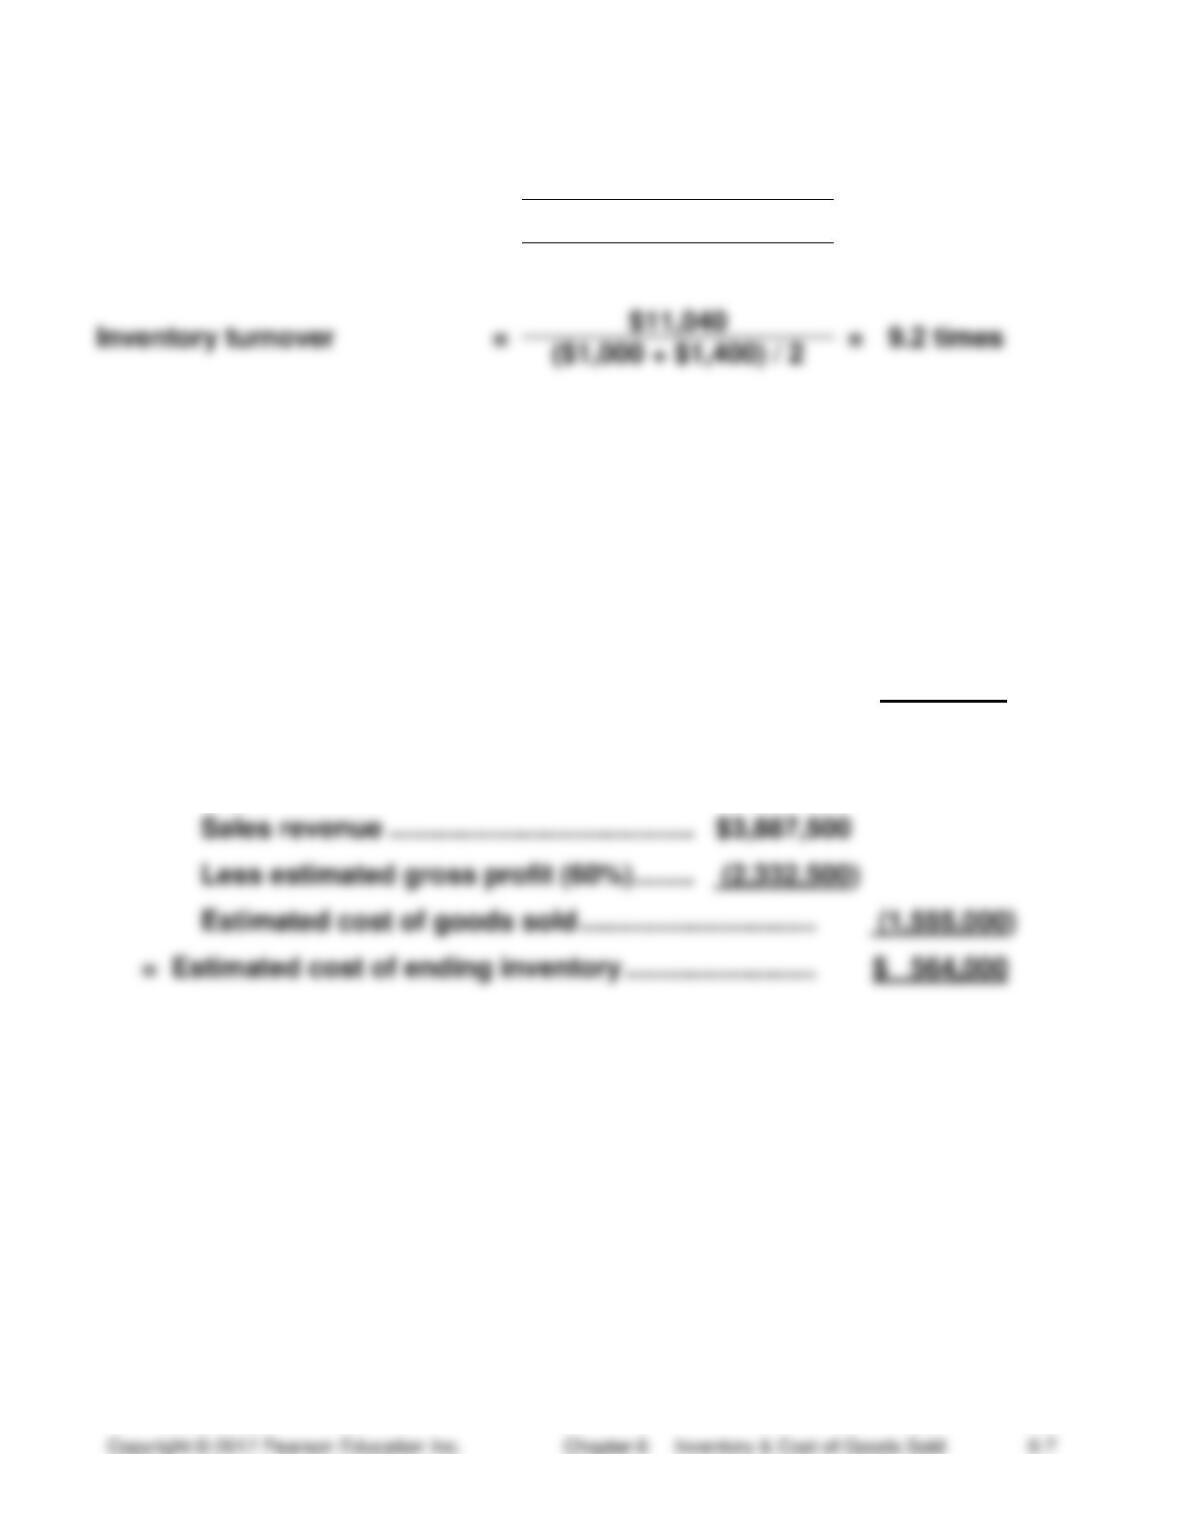
Inventories, at market (which is lower than cost) …………
$ 45,000
INCOME STATEMENT
(5-10 min.) S 6-12
Dollars in Millions
Gross profit percentage
=
$24,000 − $11,040
=
54.0%
$24,000
Inventory turnover
=
=
9.2 times
(5-10 min.) S 6-13
Beginning inventory …………………………………………..
$ 299,000
+
Purchases …………………………………………………………
1,820,000
=
Cost of goods available ……………………………………..
2,119,000
−
Cost of goods sold:
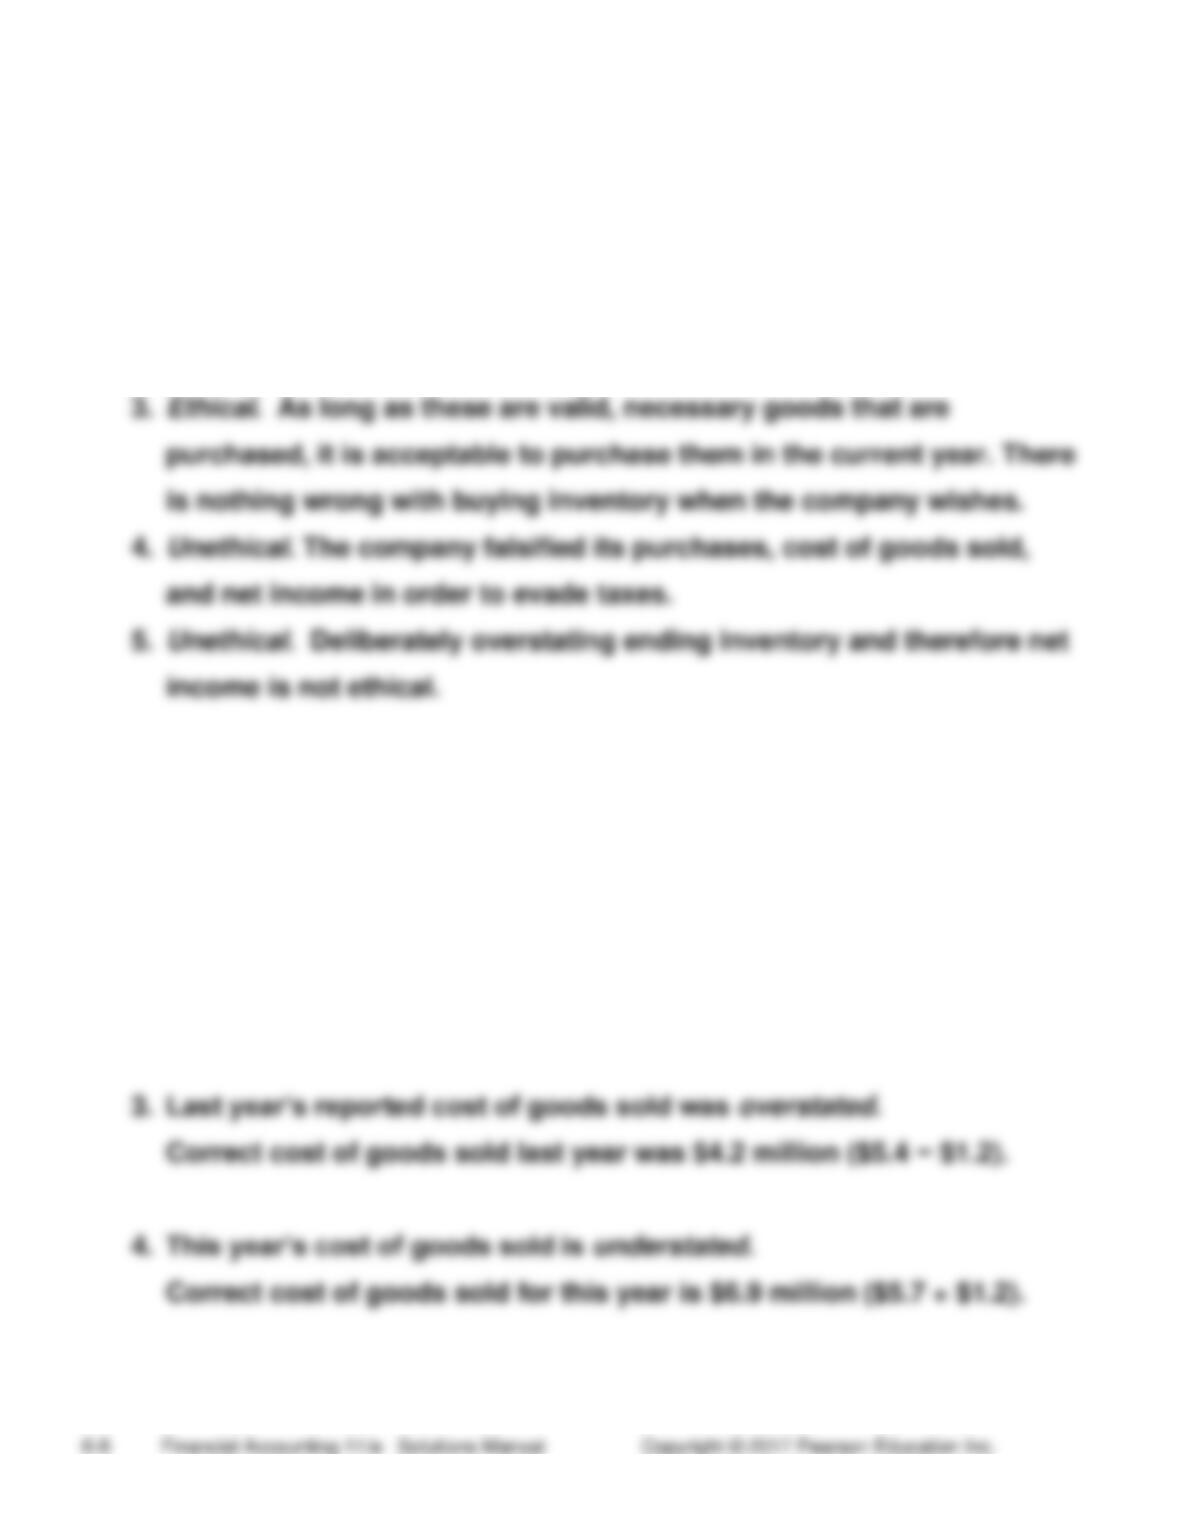
Sales revenue ………………………………….
Less estimated gross profit (60%) ……..
Estimated cost of goods sold ………………………….
(10-15 min.) S6-14
1. Unethical. The company falsified its ending inventory in order to cheat
the government (and the people) out of taxes.
2. Ethical. As long as an appropriate amount of inventory is available,
delaying the purchase until early the next year is acceptable. There is
nothing wrong with buying inventory when the company wishes.
(5 min.) S 6-15
1. Last year’s reported gross profit was understated.
Correct gross profit last year was $4.1 million ($2.9 + $1.2).
2. This year’s gross profit is overstated.
Correct gross profit for this year is $2.4 million ($3.6 − $1.2).
(10-15 min.) S 6-16
Truman Company
Schedule of Cost of Goods Sold (Corrected)
Years 2015 and 2016
2016
2015
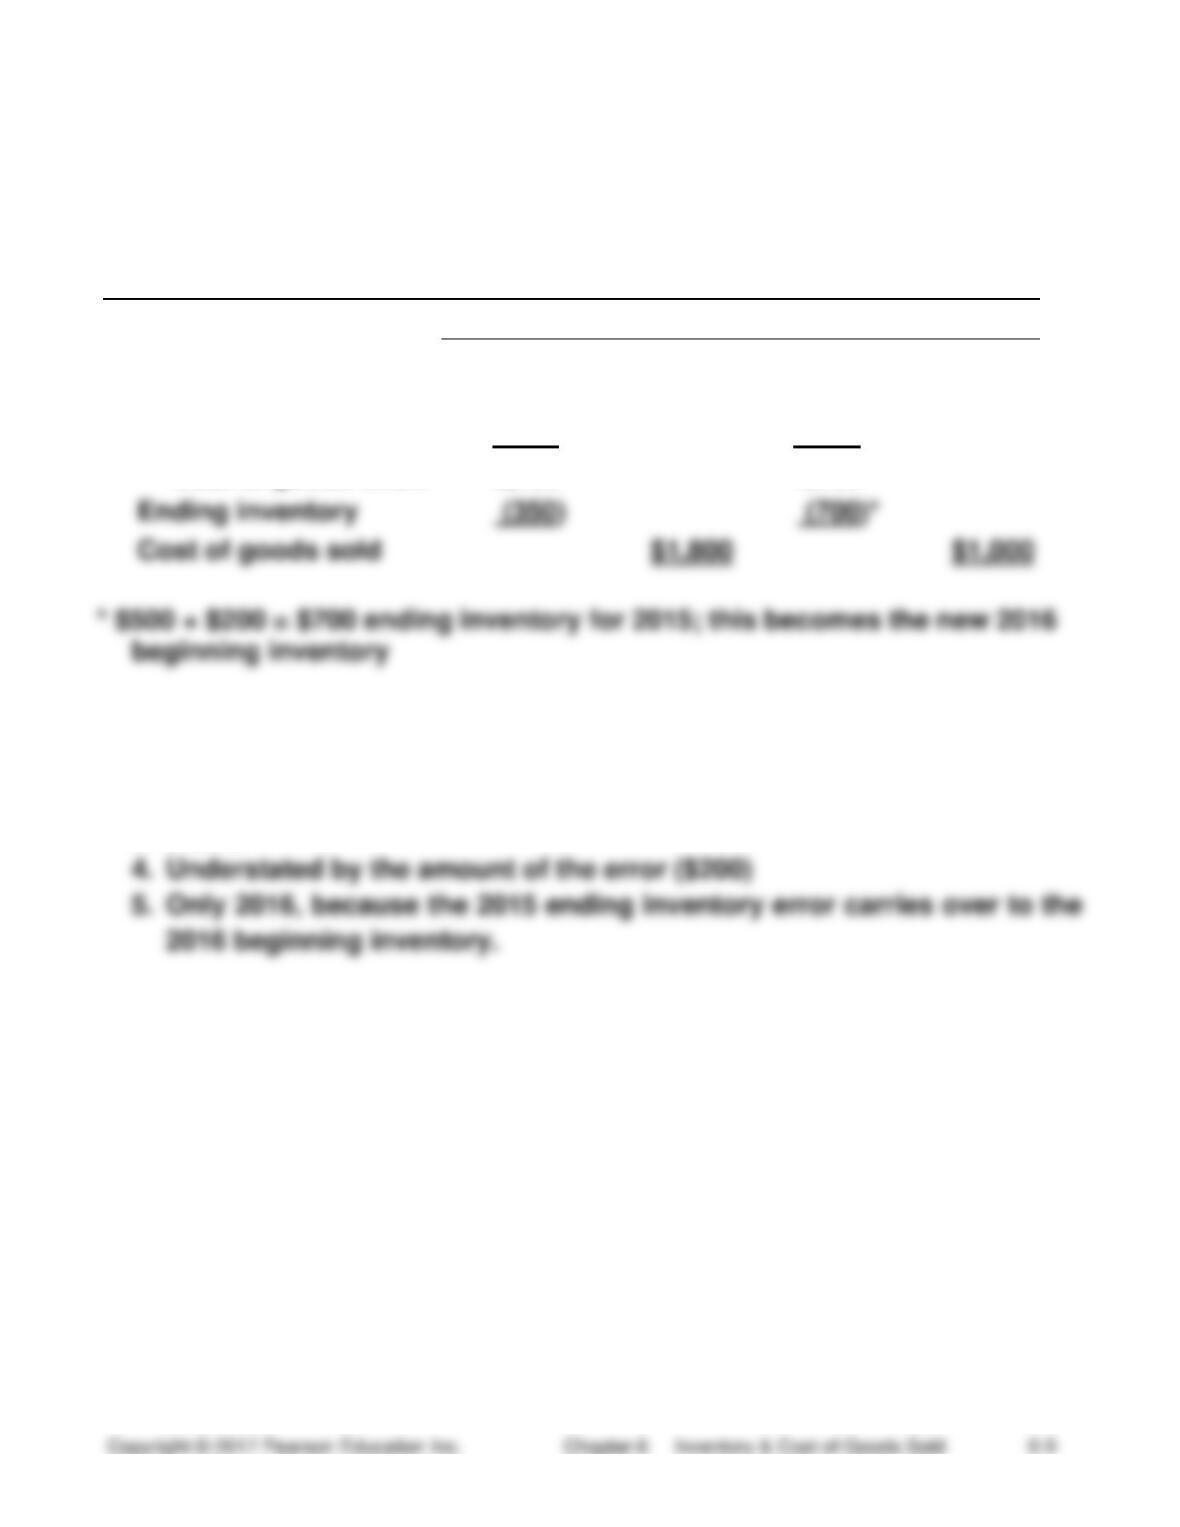
Beginning inventory
$ 700*
$ 600
Net purchases
1,450
1,100
Cost of goods avail.
2,150
1,700
Ending inventory
Cost of goods sold
1. $1,000
2. Overstated by the amount of the error ($200)
3. $1,800
Exercises
(15-20 min.) E 6-17A
Req. 1
Perpetual System
1.
Purchases:
Inventory ………………………………………………..
66,000
Accounts Payable ……………………………….
66,000
2.
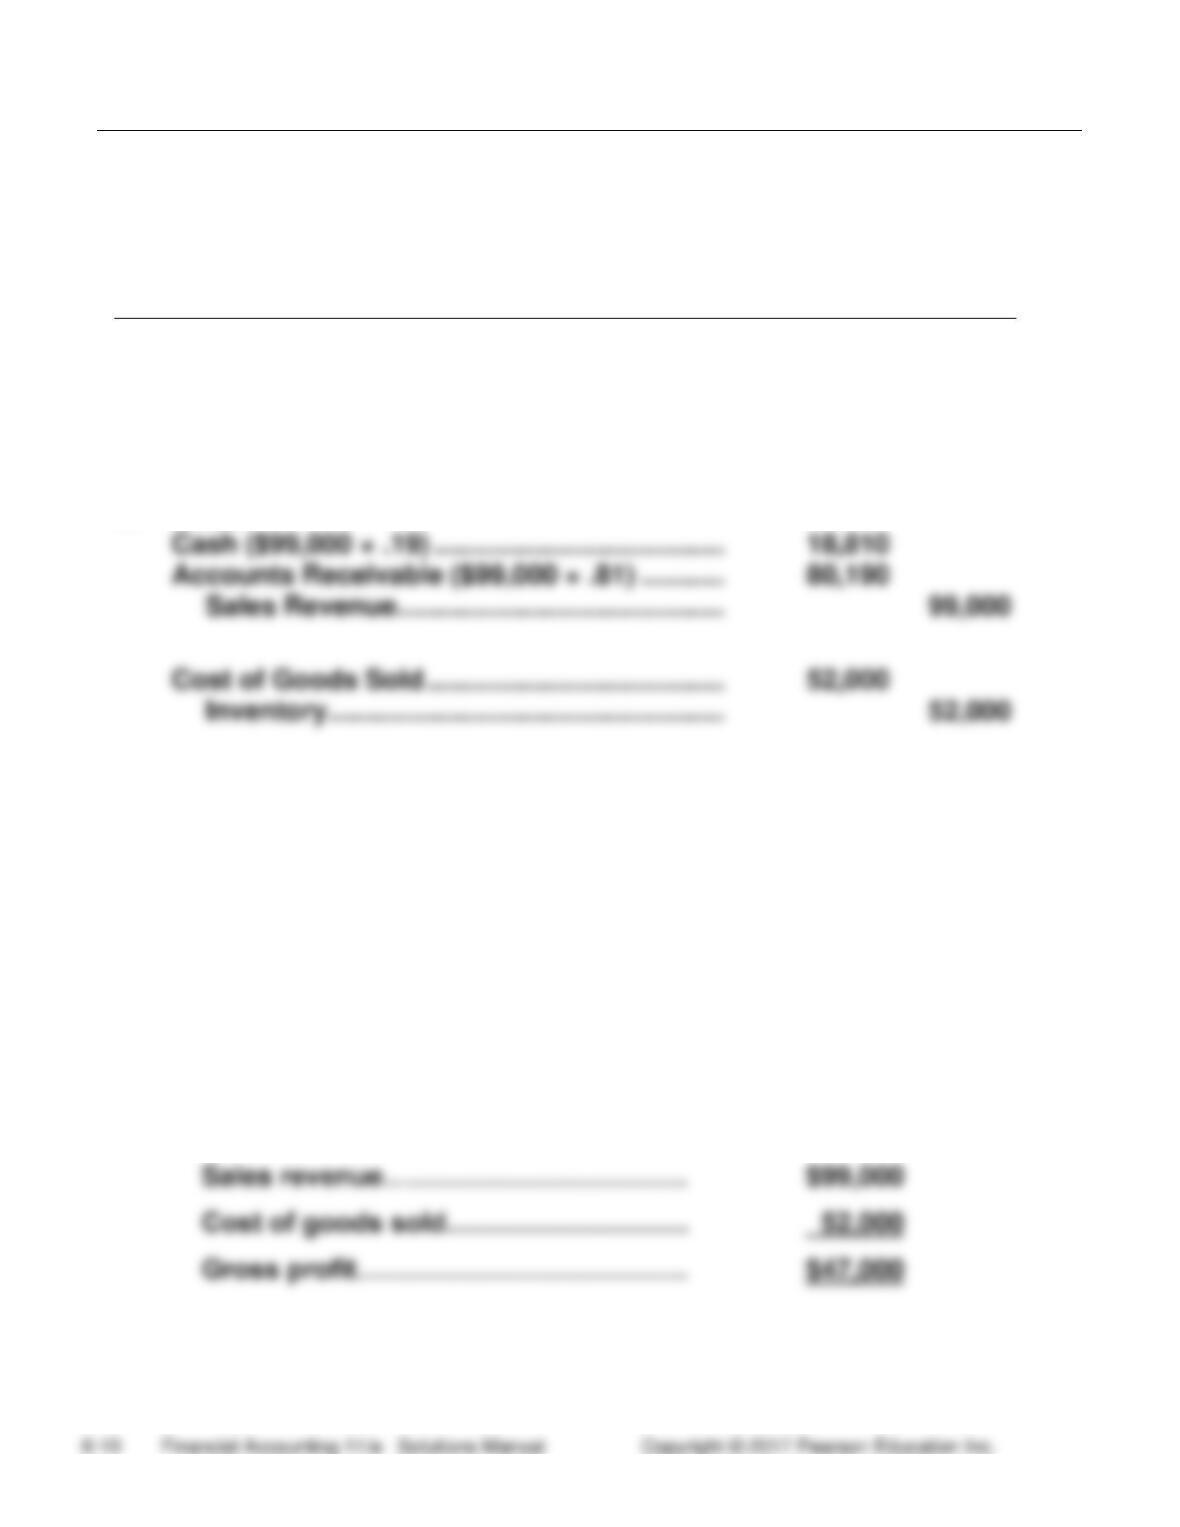
Sales:
Cash ($99,000 × .19) ………………………………..
Accounts Receivable ($99,000 × .81) ………..
Sales Revenue …………………………………….
Inventory …………………………………………….
Req. 2
BALANCE SHEET
Current assets:
Inventory……………………………….
$22,000
INCOME STATEMENT
Sales revenue…………………………….
(15-25 min.) E 6-18A
Journal
DATE
ACCOUNT TITLES AND EXPLANATION
DEBIT
CREDIT
Req. 1
Inventory ($604 + $2,240) ………………………..
2,844
Accounts Payable ………………………………
2,844
Req. 2
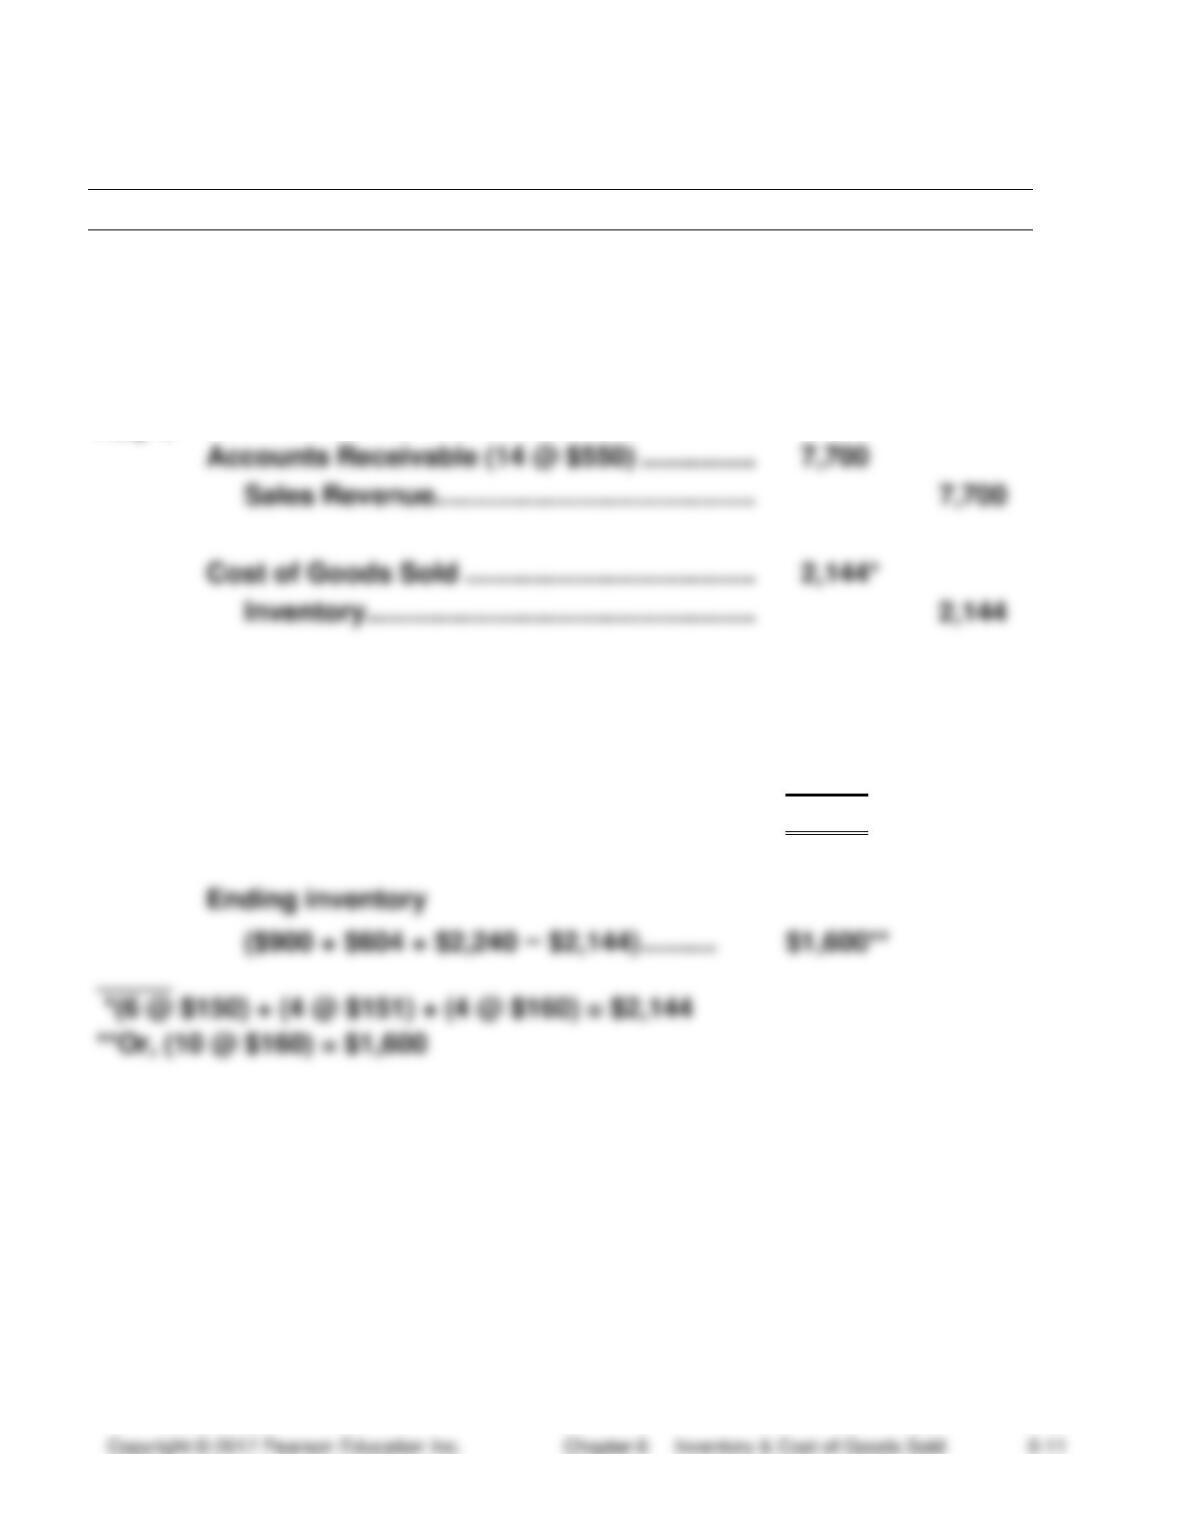
Accounts Receivable (14 @ $550) ……………
7,700
Sales Revenue……………………………………
Cost of Goods Sold ………………………………..
Inventory ……………………………………………
Req. 3
Sales revenue …………………………..………..
$7,700
Cost of goods sold …………………………....
2,144
Gross profit …………………………..…………..
$5,556
Ending inventory
(10-15 min.) E 6-19A
Req. 1
Inventory
Beg. bal.
(6 units @ $150) 900
Purchases
May 15
(4 units @ $151) 604
Cost of goods sold
26
(14 units @ $160) 2,240
(24 units @ $?)
?
End. bal.
(10 units @ $?) ?
Cost of Goods Sold
Ending Inventory
_____
*Average cost per
unit
=
($900 + $604 + $2,240)
=
$156
(6 + 4 + 14)
Req. 2
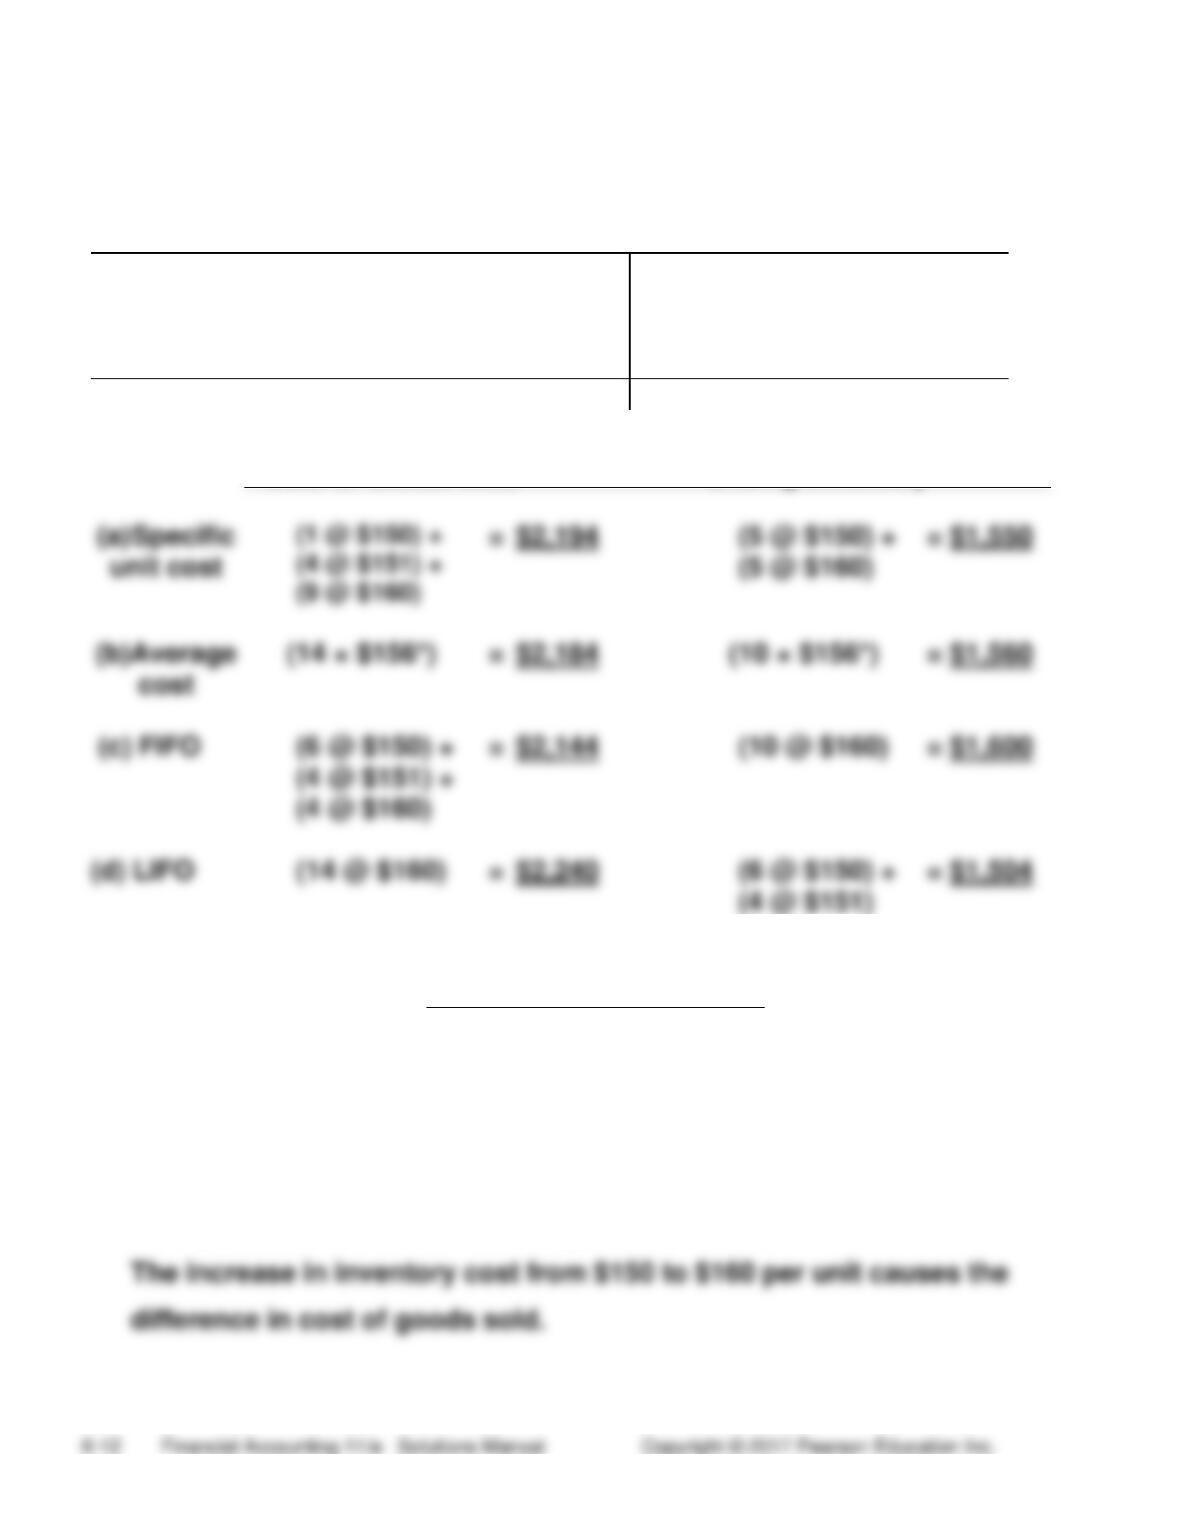
LIFO produces the highest cost of goods sold, $2,240.
FIFO produces the lowest cost of goods sold, $2,144.
(5-10 min.) E 6-20A
Cost of goods sold:
LIFO ($2,240) − FIFO ($2,144) ………………………………….
$ 96
× Income tax rate …………………………..……………………….
× .25
Tax savings advantage of LIFO …………………………………..
$ 24
(10-15 min.) E 6-21A
Reqs. 1, 2, and 3
Cost of Goods Sold
Ending Inventory
(1)Average
cost
(19,100 × $11.50*)
=
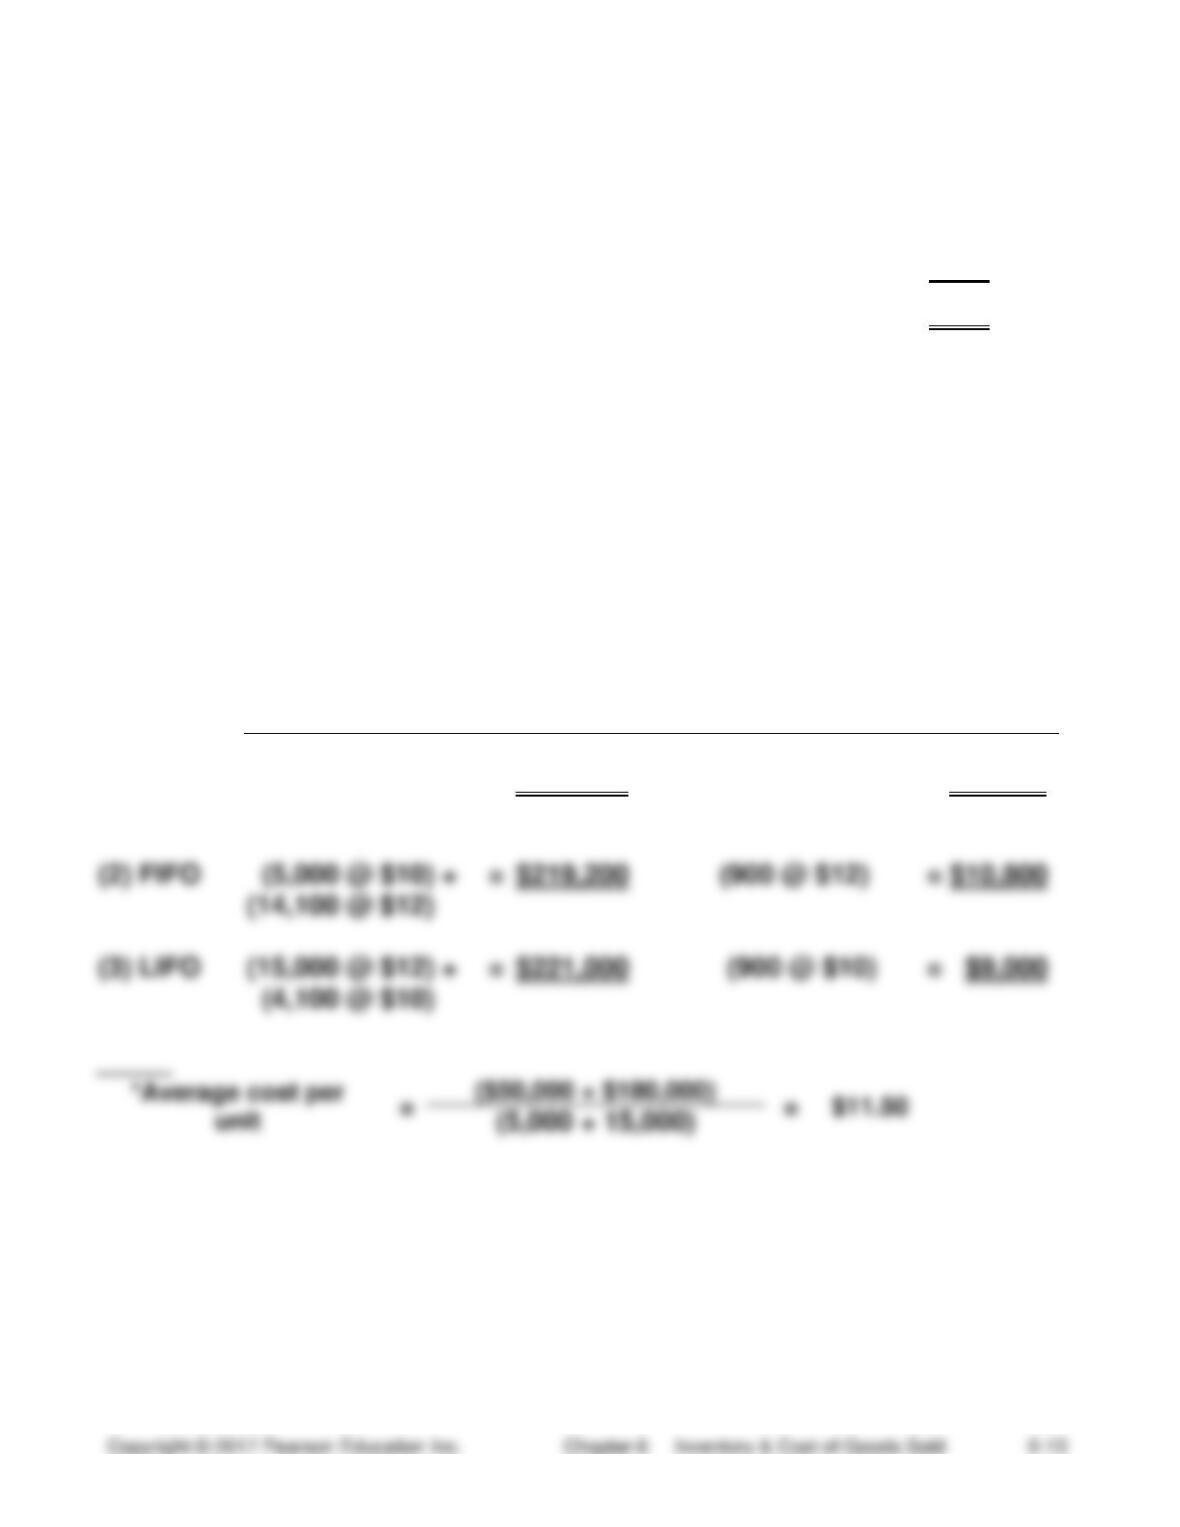
$219,650
(900 × $11.50*)
=
$10,350
(15 min.) E 6-22A
Req. 1
a.
FIFO
Cost of goods sold:
(10 @ $42)…………………………………….
$420
Ending inventory:
(7 @ $73) + (5 @ $42) …………………….
$721
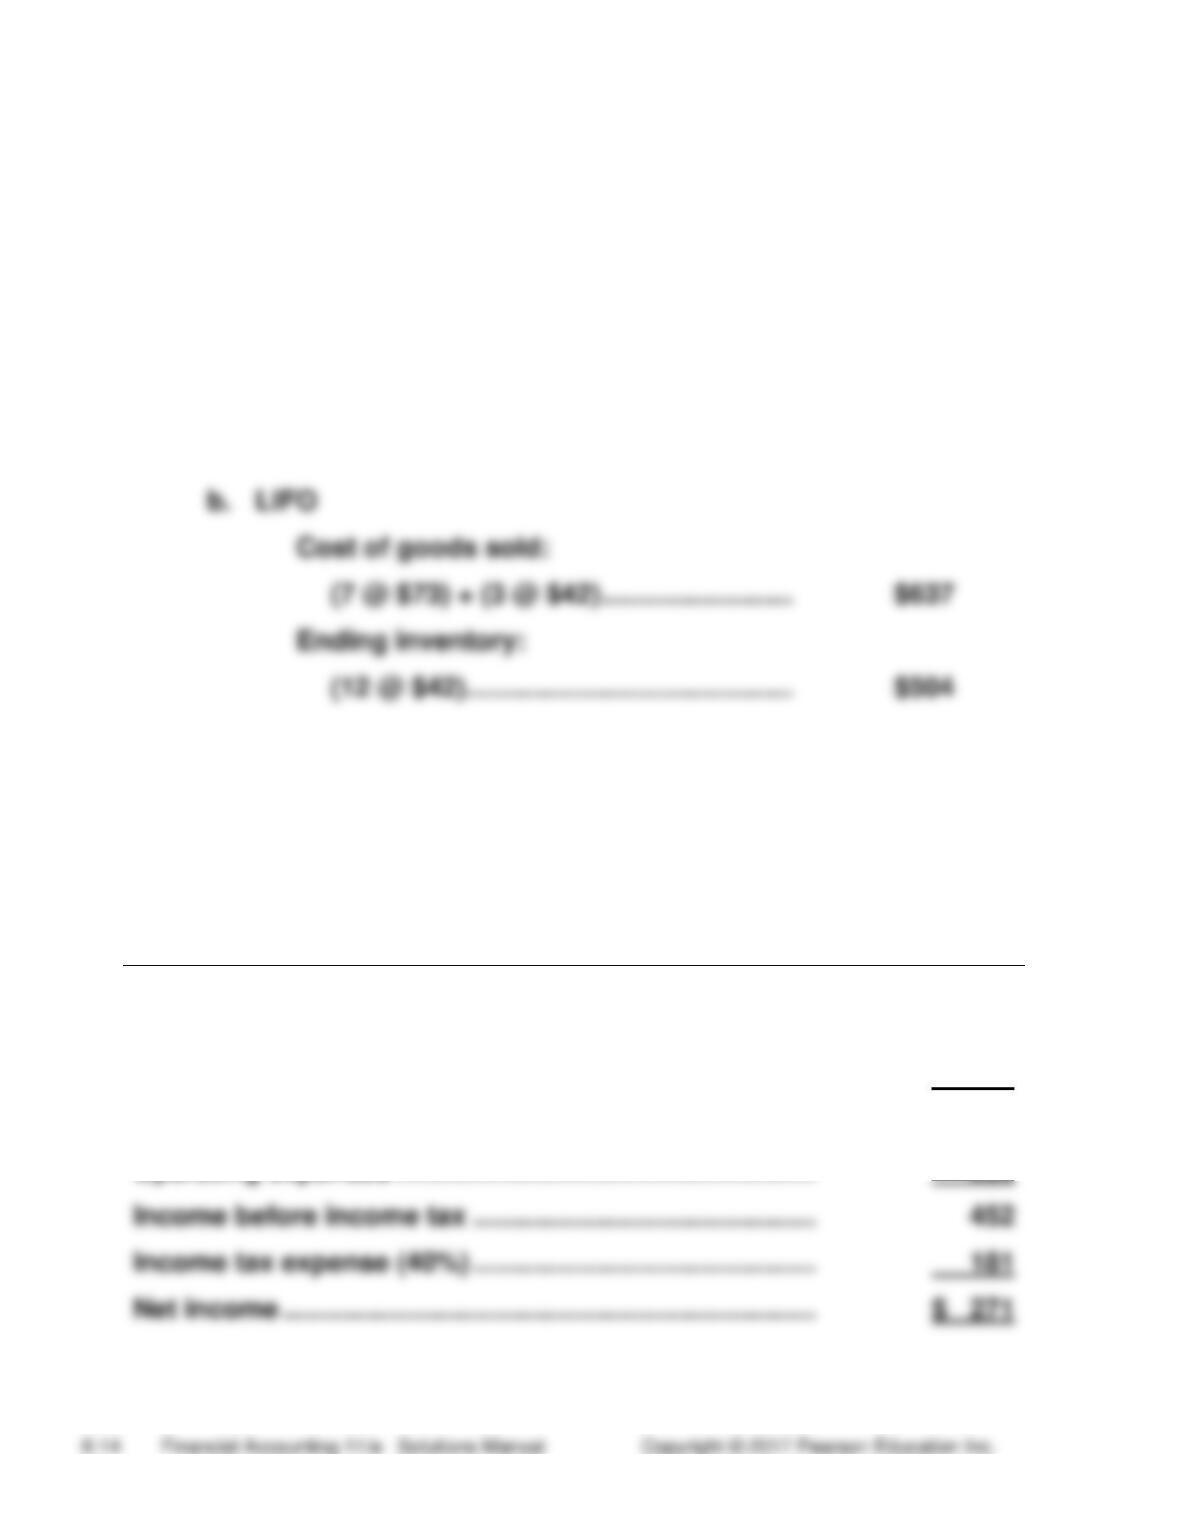
LIFO
Cost of goods sold:
(7 @ $73) + (3 @ $42) …………………….
Ending inventory:
(12 @ $42)…………………………………….
$504
Req. 2
MusicPlace
Income Statement
Month Ended June 30, 2016
Sales revenue (6 @ $118 and 4 @ $111)) ………………….
$1,152
Cost of goods sold …………………………………………………
420
Gross profit ……………………………………………………………
732
Operating expenses ……………………………………………….
Income before income tax ………………………………………
452
Income tax expense (40%) ………………………………………
181
(15 min.) E 6-23A
Req. 1
Gross profit:
FIFO
LIFO
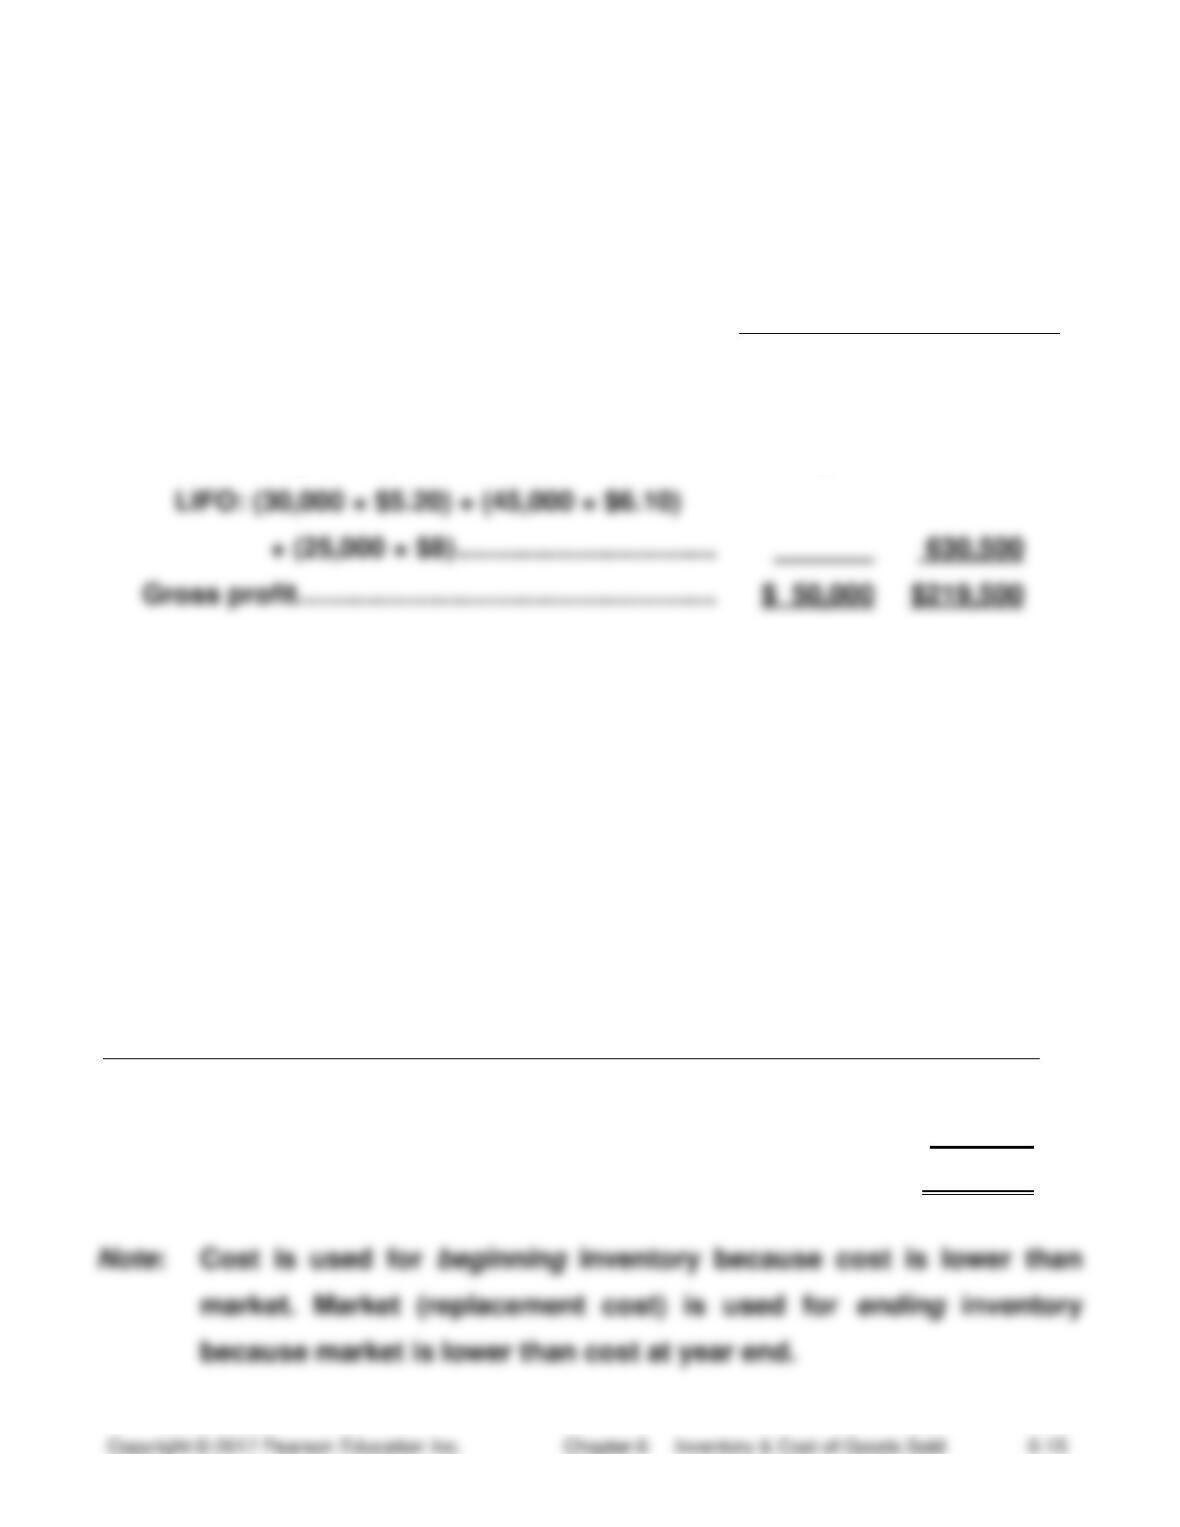
Sales revenue ……………………………………………
$850,000
$850,000
Cost of goods sold
FIFO: 100,000 × $8 ………………………………….
800,000
Gross profit ……………………………………………….
Req. 2
Gross profit under FIFO and LIFO differ because inventory costs decreased
during the period.
(5-10 min.) E 6-24A
Gordon Garden Supplies
Income Statement (partial)
Year Ended January 31, 2016
Sales revenue ……………………………………………………………….
$118,000
Cost of goods sold [$69,000 + ($13,500 − $13,000)] ………….
69,500
Gross profit …………………………………………………………………..
$ 48,500
(15-20 min.) E 6-25A
a.
$62,000
$19,000 + $60,000 − $17,000 = $62,000
b.
$44,000
$106,000 − $62,000 = $44,000
c.
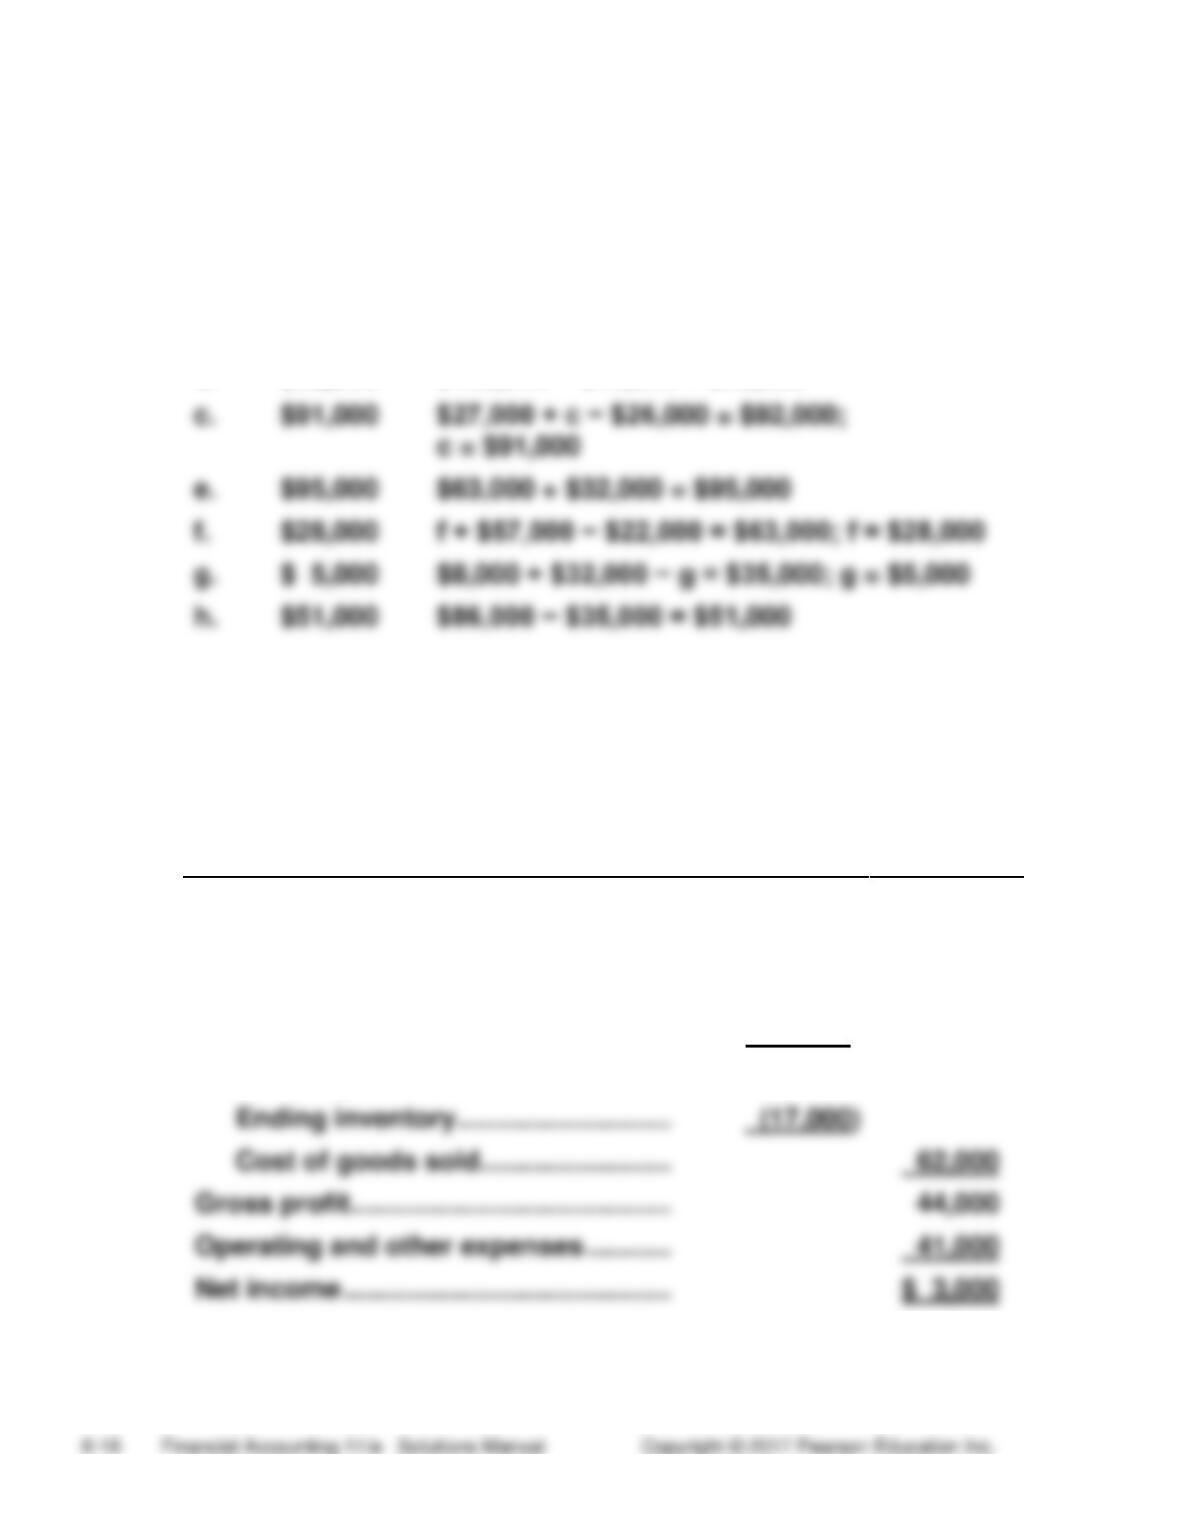
Must first solve for d
d.
$92,000
$132,000 − $40,000 = $92,000
f + $57,000 − $22,000 = $63,000; f = $28,000
g.
$ 5,000
h.
$51,000
$86,000 − $35,000 = $51,000
Req. 1
Arnold Company
Income Statement
Year Ended December 31, 2016
Net sales ……………………………………….
$106,000
Cost of goods sold
Beginning inventory ………………….
$ 19,000
Net purchases …………………………..
60,000
Cost of goods available ……………..
79,000
Cost of goods sold …………………….
Gross profit ……………………………………
Operating and other expenses ………..
Net income …………………………………….
(20-30 min.) E 6-26A
Company
Gross Profit
Percentage
Inventory Turnover
Arnold
$44
=
41.5%
$62
=
3.4 times
$106
($19 + $17) / 2
Donahue
$40
=
30.3%
$92
=
3.5 times
$132
($27 + $26) / 2
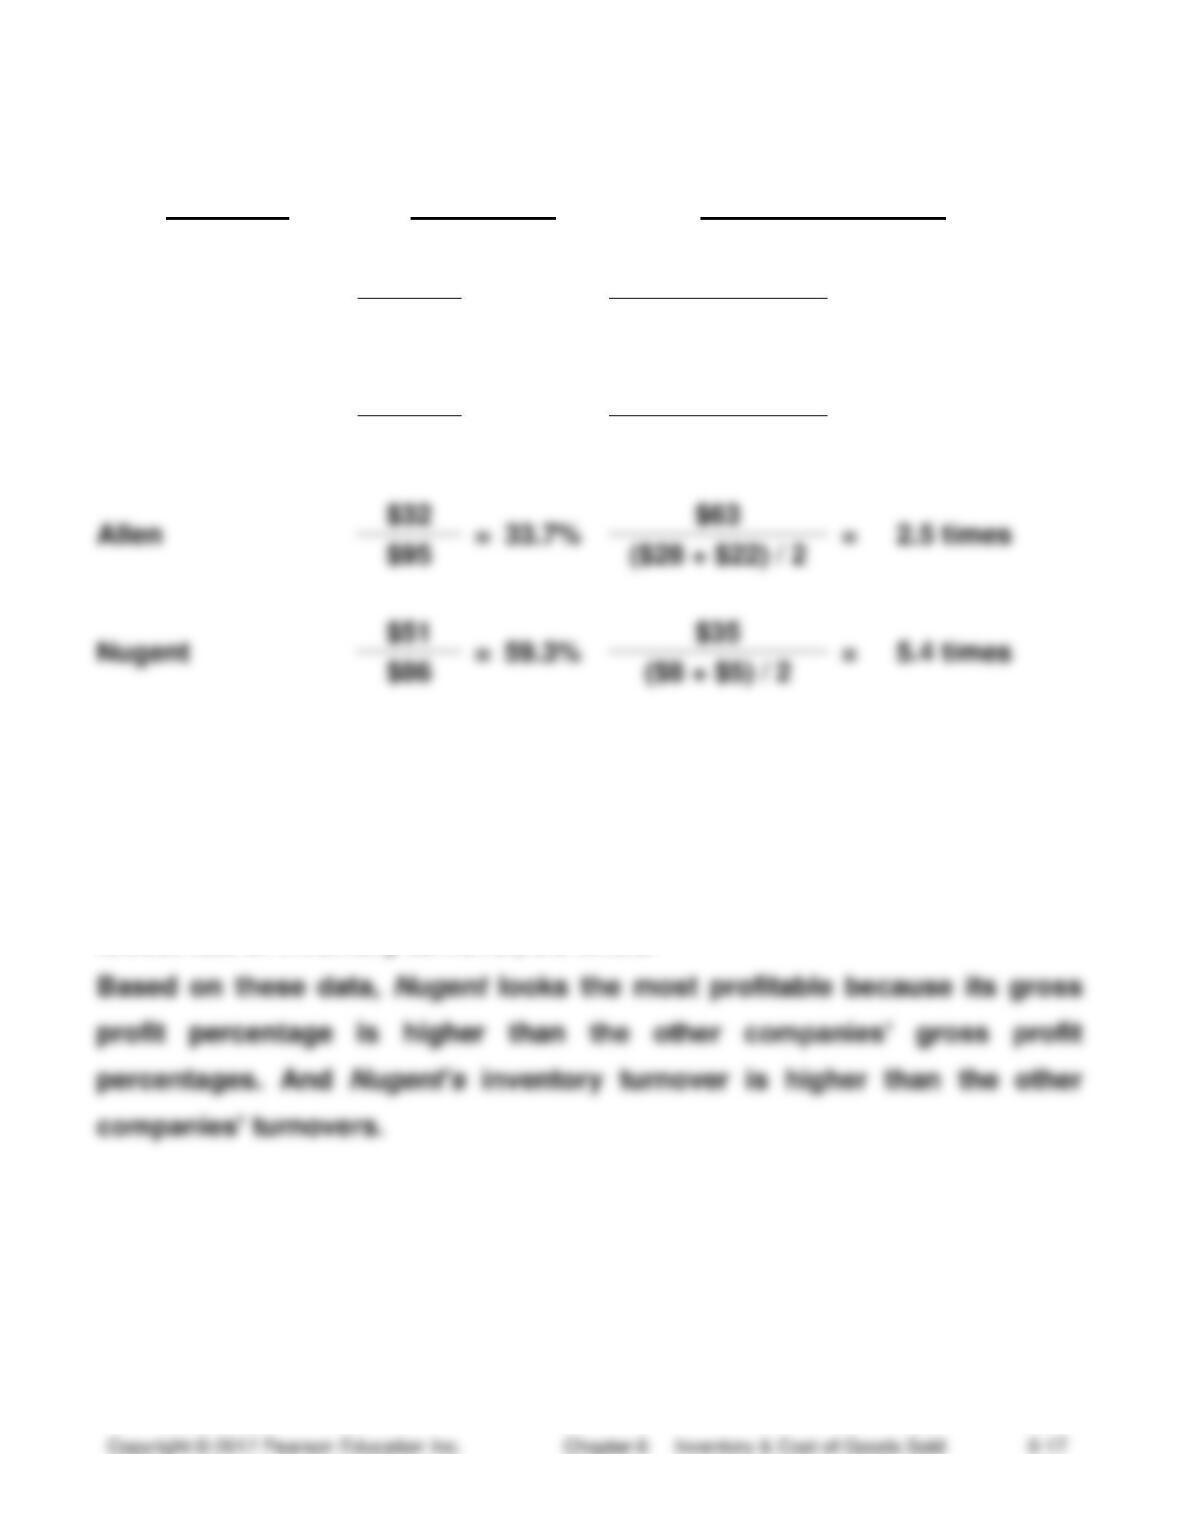
Allen
=
33.7%
$63
=
$95
Nugent
$51
=
59.3%
$35
=
5.4 times
$86
Nugent has the highest gross profit percentage, 59.3%. Donahue has the
lowest gross profit percentage, 30.3%.
Nugent has the highest rate of inventory turnover, 5.4 times. Allen has the
lowest rate of inventory turnover, 2.5 times.
(15 min.) E 6-27A
1
2
FIFO
LIFO
Gross profit percentage
=
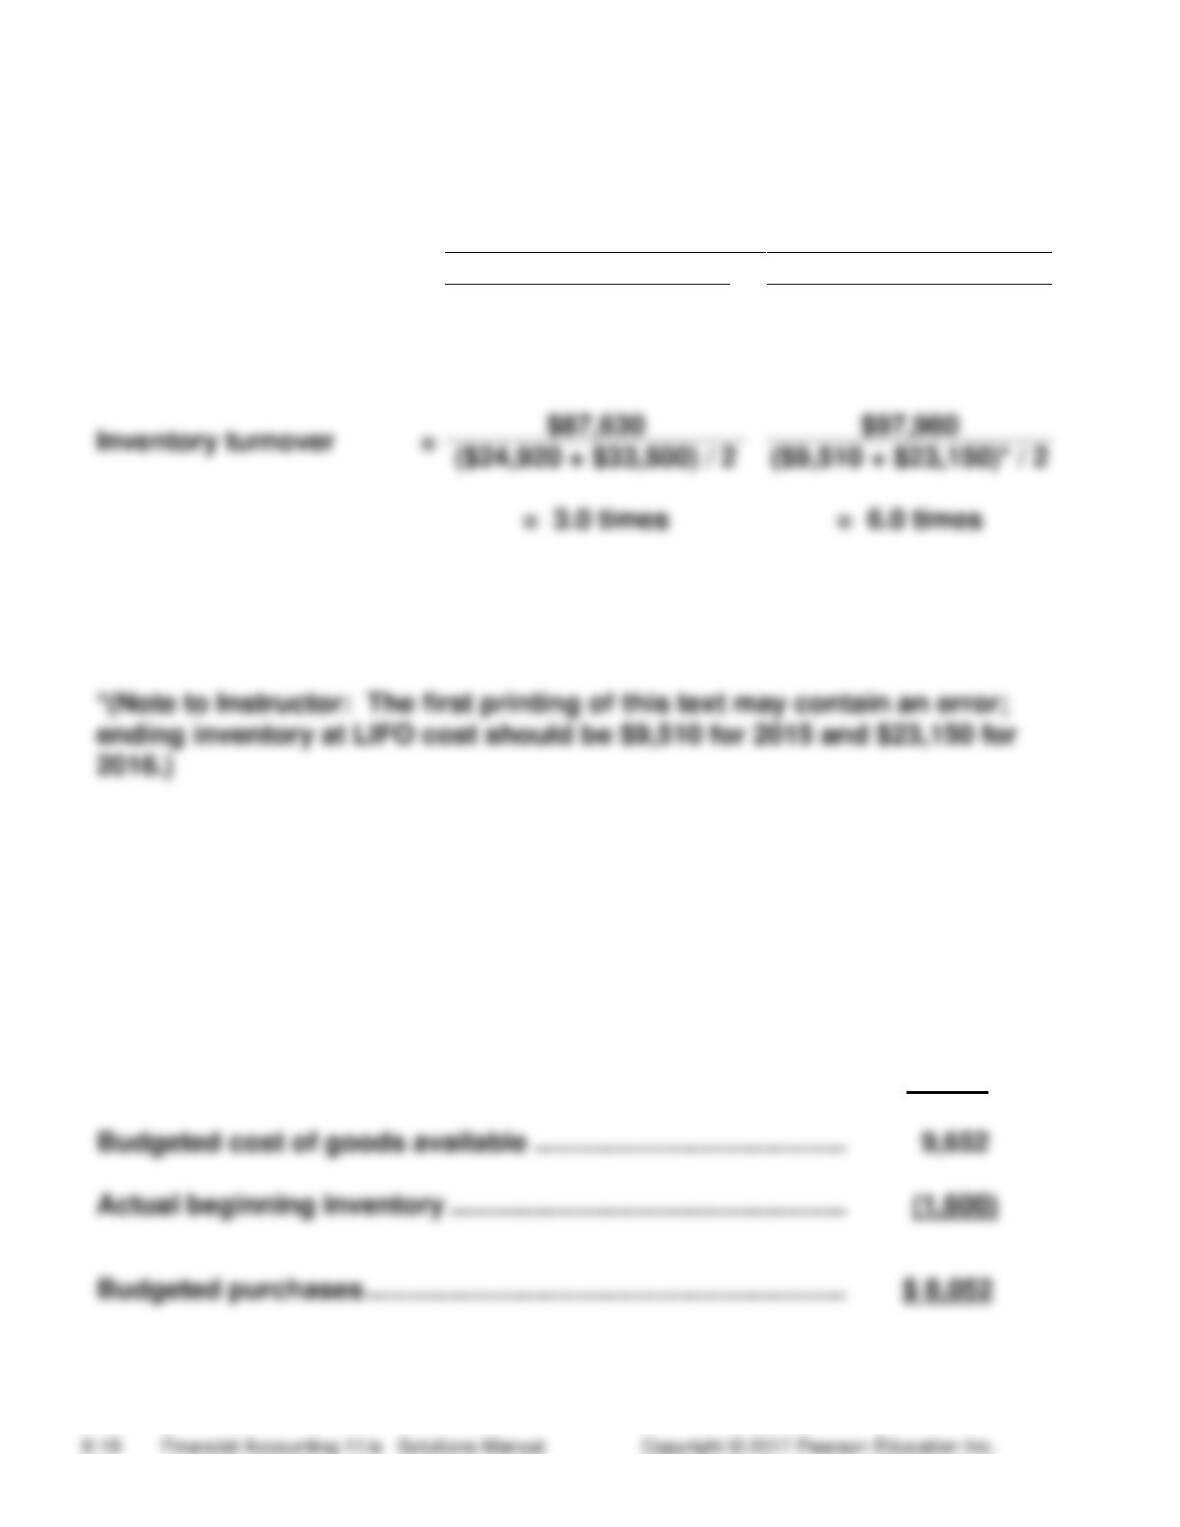
$138,000 − $87,630
$138,000 − $97,980
$138,000
$138,000
= 36.5%
= 29.0%
Inventory turnover
=
1. FIFO produces a higher gross profit percentage.
2. LIFO produces a higher rate of inventory turnover.
(10-15 min.) E 6-28A
Year ended January 31, 2016
Millions
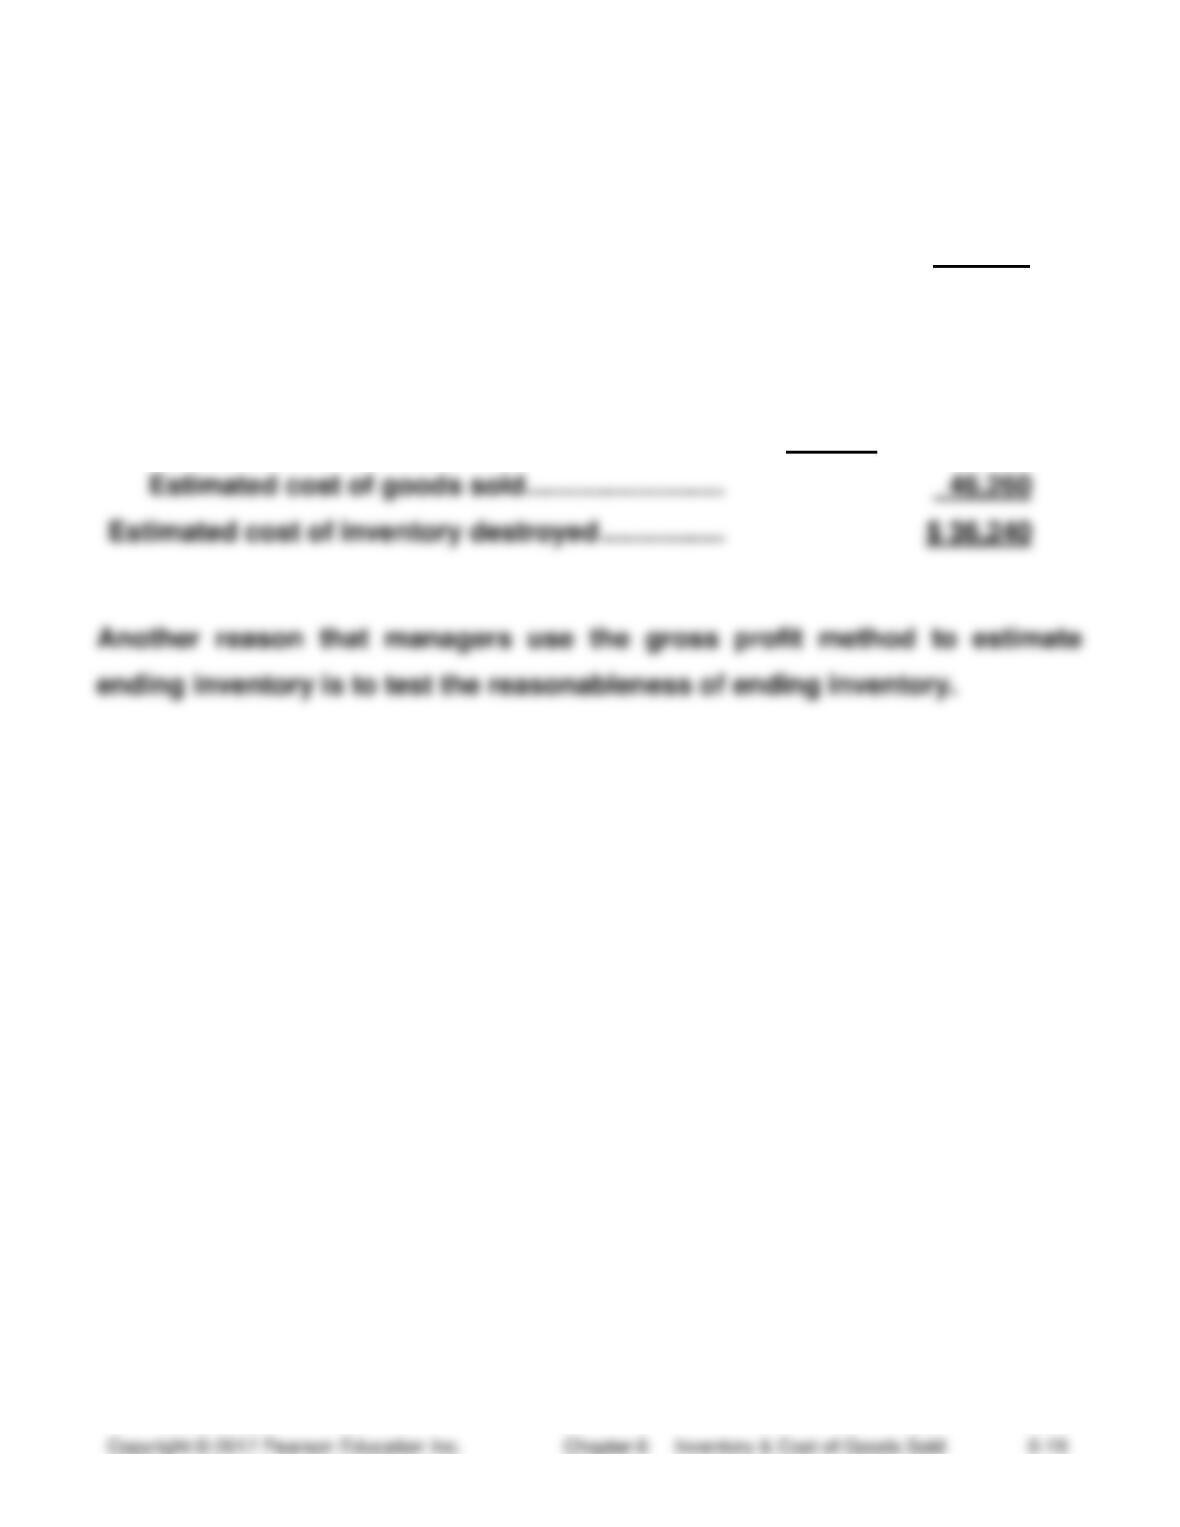
Budgeted cost of goods sold ($6,800 × 1.14) ……………………
$ 7,752
Budgeted ending inventory …………………………………………….
1,900
Budgeted cost of goods available …………………………………..
9,652
Budgeted purchases ………………………………………………………
(10-15 min.) E 6-29A
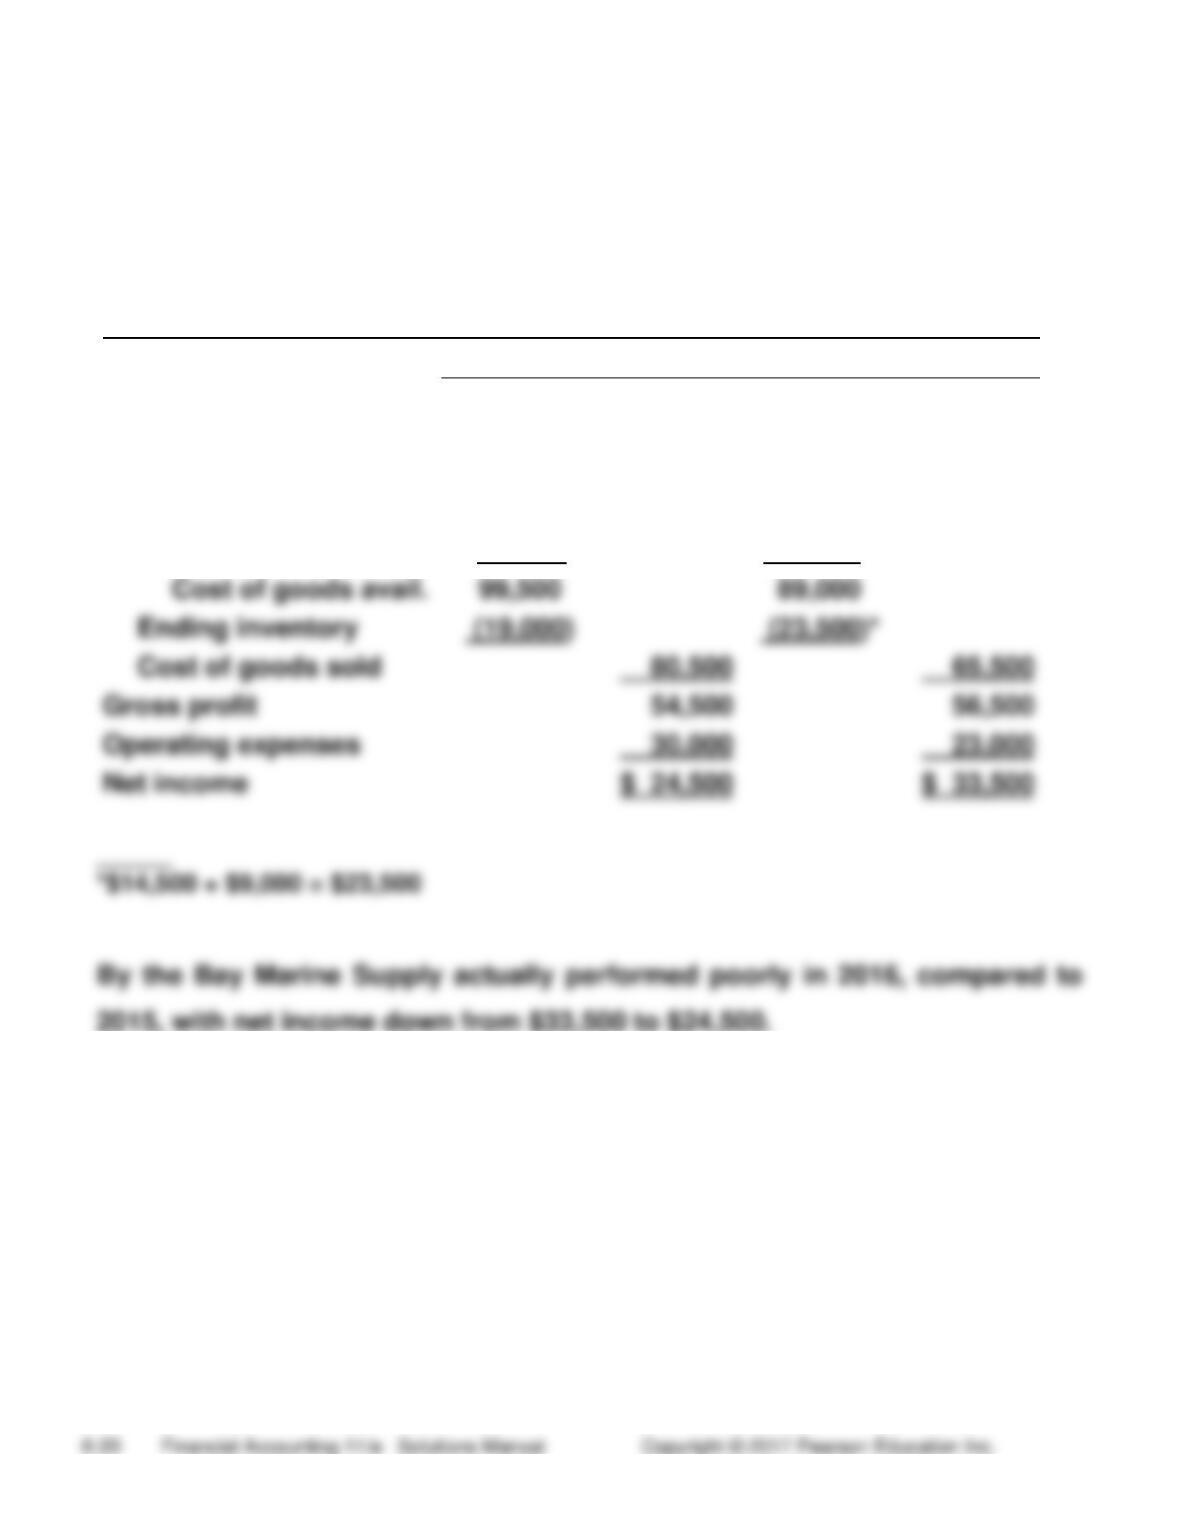
Beginning inventory ……………………………………….
$ 45,300
Net purchases ………………………………………………..
37,200
Cost of goods available …………………………………..
82,500
Estimated cost of goods sold:
Net sales revenue ………………………………………
$77,100
Less: estimated gross profit of 40% ……………
(30,840)
46,260
Estimated cost of inventory destroyed …………….
(10-15 min.) E 6-30A
By the Bay Marine Supply
Income Statement (Corrected)
Years Ended November 30, 2016 and 2015
2016
2015
Sales revenue
$135,000
$122,000
Cost of goods sold:
Beginning inventory
$23,500
$ 14,000
Net purchases
76,000
75,000
Cost of goods avail.
Ending inventory
Cost of goods sold
Gross profit
Operating expenses
Net income