Problem 6-26 (continued)
3.
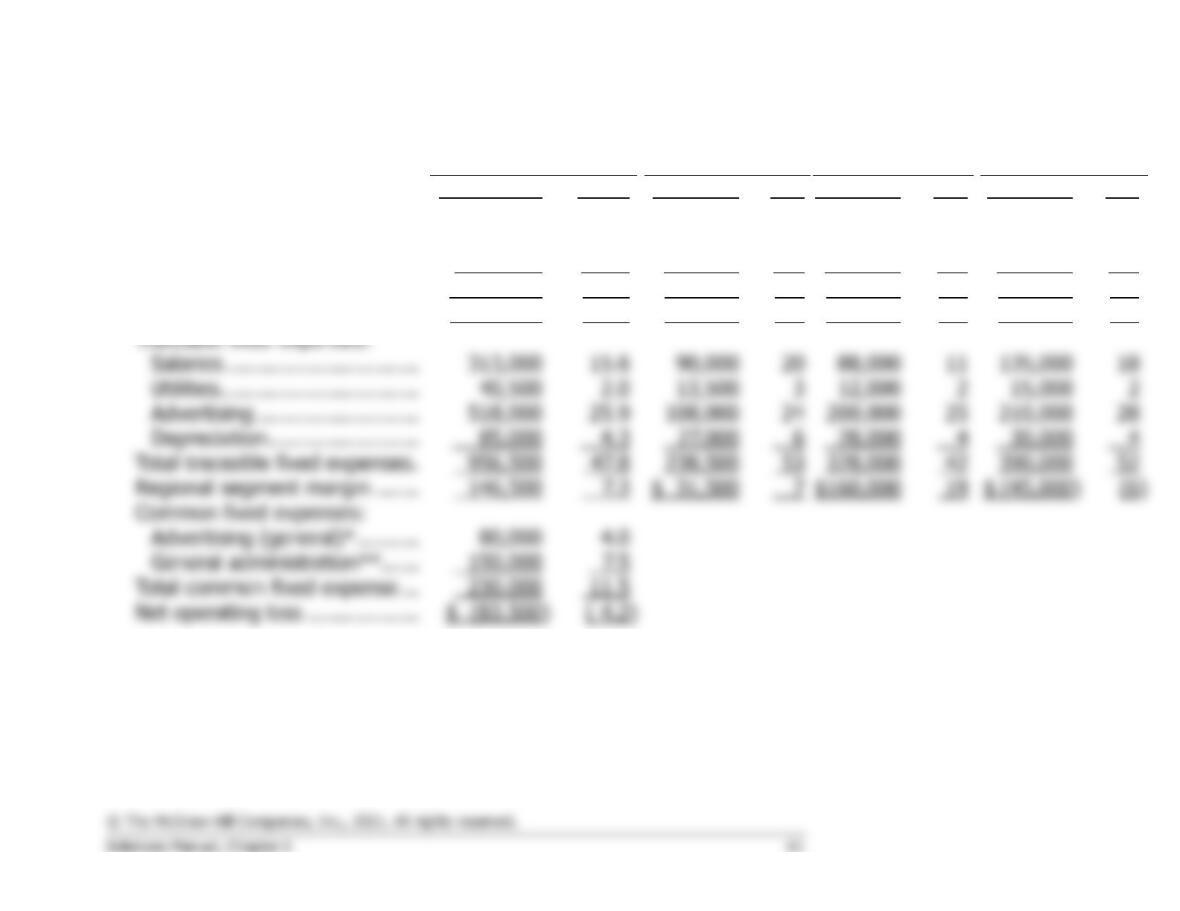
Total Company
West
Central
East
Sales ……………………………….
$2,000,000
100.0
$450,000
100
$800,000
100
$750,000
100
Variable expenses:
Cost of goods sold ……………
819,400
41.0
162,900
36
280,000
35
376,500
50
Shipping expense …………….
77,600
3.9
17,100
4
32,000
4
28,500
4
Total variable expenses ………..
897,000
44.9
180,000
40
312,000
39
405,000
54
Contribution margin …………….
1,103,000
55.1
270,000
60
488,000
61
345,000
46
Traceable fixed expenses:
Salaries ………………………….
313,000
15.6
90,000
11
135,000
18
Utilities …………………………..
12,000
15,000
Advertising ……………………..
518,000
25.9
108,000
200,000
25
210,000
Depreciation ……………………
4.3
27,000
6
4
30,000
4
Total traceable fixed expenses .
53
42
390,000
52
Regional segment margin …….
7.3
7
Common fixed expenses:
Advertising (general)* ……….
General administration**……
Total common fixed expense …
Net operating loss ………………
Note: Percentage figures may not total due to rounding.
* $18,000 + $32,000 + $30,000 = $80,000
** $50,000 + $50,000 +$50,000 = $150,000
4. The following points should be brought to management’s attention:
a. Sales in the West are much lower than in the other two regions. This
is not due to lack of salespeople—salaries in the West are about the
same as in the Central Region, which has the highest sales of the
three regions.
60% or more for the other two regions.
d. The East appears to be overstaffed. Its salaries are about 50%
greater than in either of the other two regions.
e. The East is not covering its own traceable costs. Attention should be
given to improving the sales mix and reducing expenses in this
region.
Problem 6-27 (30 minutes)
1. Because of soft demand for the Brazilian Division’s product, the
inventory should be drawn down to the minimum level of 50 units.
Drawing inventory down to the minimum level would require production
as follows during the last quarter:
Desired inventory, December 31 ……….
50 units
Expected sales, last quarter …………….
600 units
Total needs ………………………………….
650 units
Less inventory, September 30 ………….
400 units
Required production ………………………
250 units
This plan would save inventory carrying costs such as storage (rent,
insurance), interest, and obsolescence.
2. To maximize the Brazilian Division’s operating income, Mr. Cavalas could
produce as many units as storage facilities will allow. By building
inventory to the maximum level, Mr. Cavalas would be able to defer a
portion of the year’s fixed manufacturing overhead costs to future years
through the inventory account, rather than having all of these costs
appear as charges on the current year’s income statement. Building
inventory to the maximum level of 1,000 units would require production
as follows during the last quarter:
Desired inventory, December 31 ….
Expected sales, last quarter ……….
600 units
Total needs …………………………….
Less inventory, September 30 …….
400 units
Required production …………………
Problem 6-27 (continued)
Thus, by producing enough units to build inventory to the maximum
level that storage facilities would allow, Mr. Cavalas could relieve the
current year of fixed manufacturing overhead cost and thereby
maximize the current year’s operating income.
3. By setting a production schedule that will maximize his division’s net
operating income—and maximize his own bonus—Mr. Cavalas would be
acting against the best interests of the company as a whole. The extra
units aren’t needed and would be expensive to carry in inventory.
Moreover, there is no indication that demand would be any better next
year than it has been in the current year, so the company may be
required to carry the extra units in inventory a long time before they are
ultimately sold.
Problem 6-28 (60 minutes)
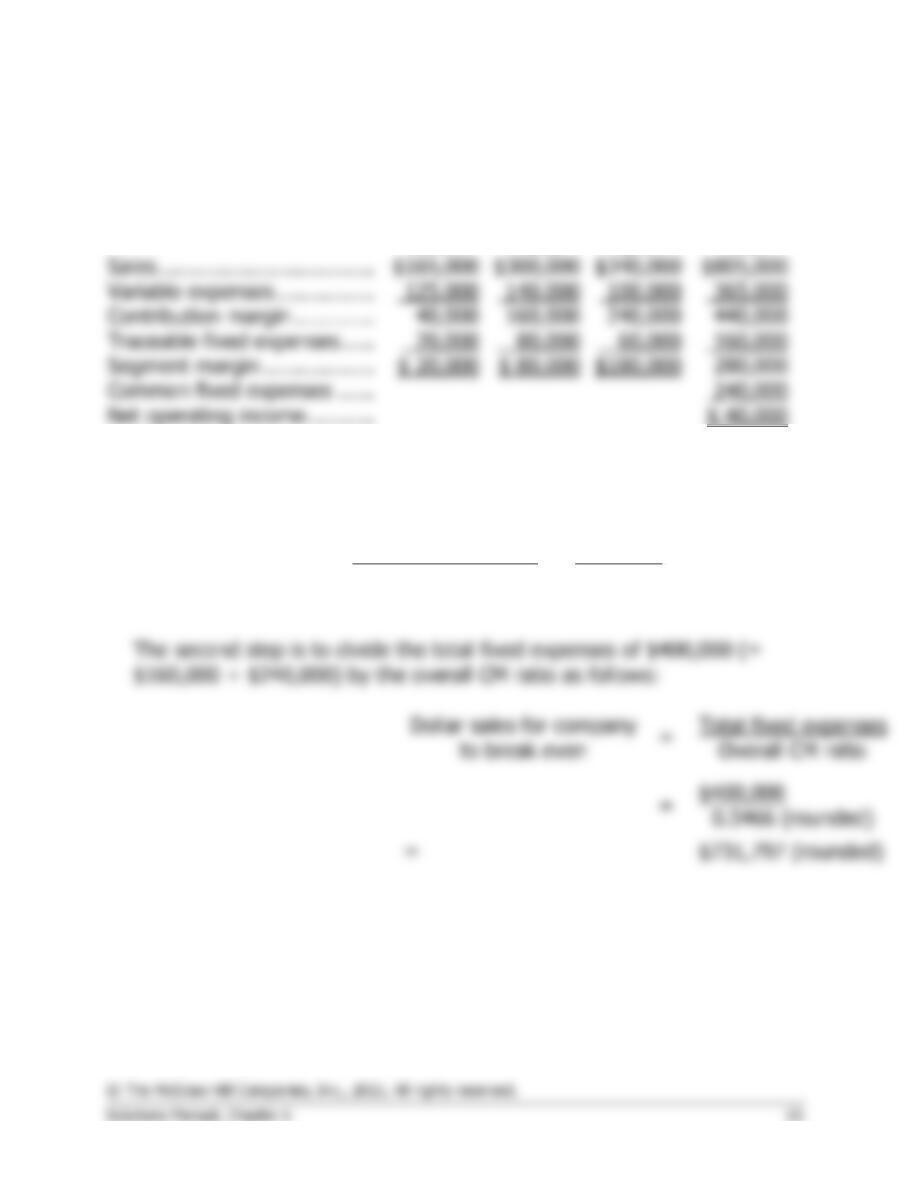
1. The net operating income of $40,000 is shown in the following
contribution format income statement:
Velcro
Metal
Nylon
Total
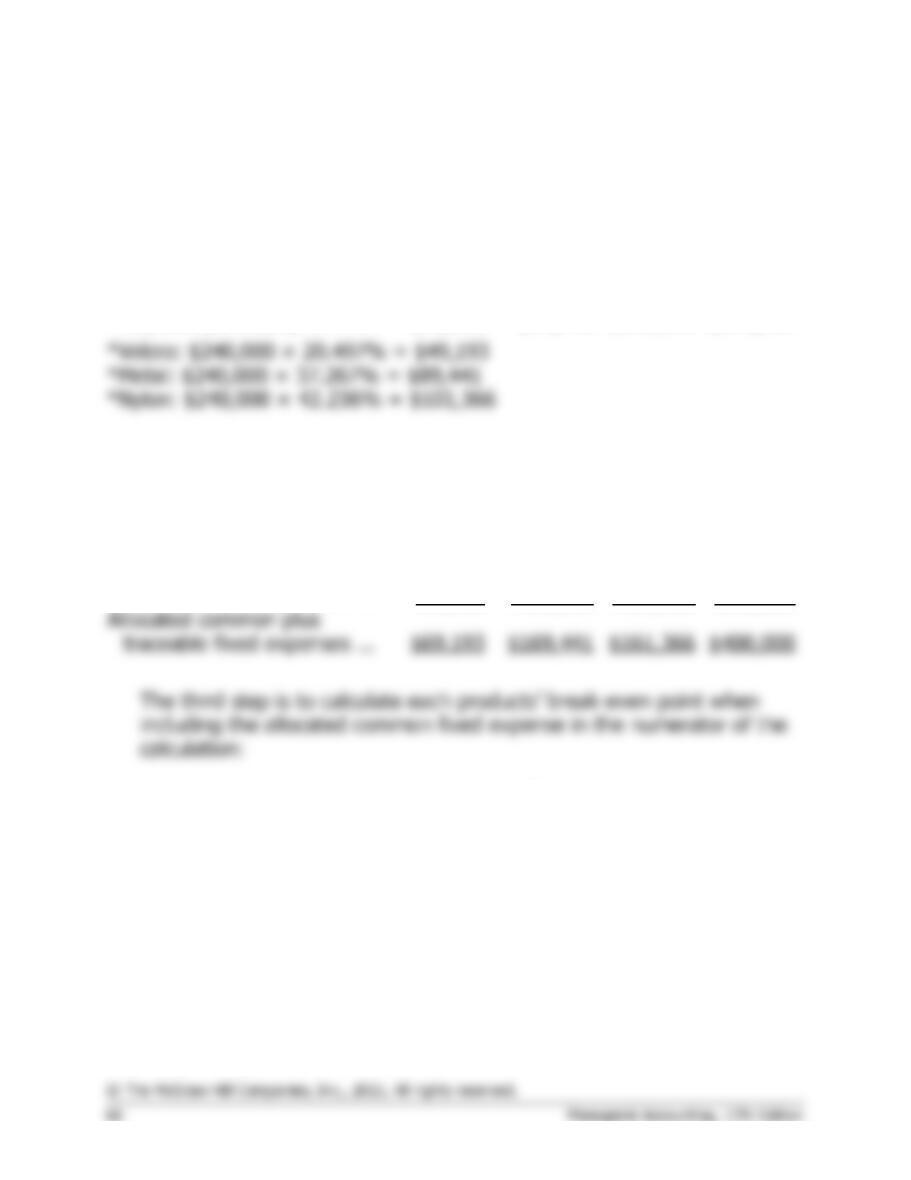
2. The overall break-even sales can be computed in two steps. The first
step is to calculate the overall CM ratio as follows:
Contribution margin $440,000
Overal CM ratio = = = 0.5466
Sales $805,000
Problem 6-28 (continued)
3a. The first step is to allocate the common fixed expenses of $240,000 to
the three products based on their total sales from requirement 1:
Velcro
Metal
Nylon
Total
Sales ……………………………..
$165,000
$300,000
$340,000
$805,000
Percentage of total sales ……
20.497%
37.267%
42.236%
100.0%
Allocated common fixed
expense (rounded)* ……….
$49,193
$89,441
$101,366
$240,000
The second step is to combine each product’s allocated common fixed
expenses with its traceable fixed expenses as follows:
Velcro
Metal
Nylon
Total
Allocated common fixed
expense……………………….
$49,193
$ 89,441
$101,366
$240,000
Traceable fixed expenses …..
20,000
80,000
60,000
160,000
Allocated common plus
traceable fixed expenses …
$69,193
$169,441
$161,366
$400,000
Velcro
Metal
Nylon
Allocated common plus
traceable fixed expenses
(a) …………………………..…
$69,193
$169,441
$161,366
Unit contribution margin (b) .
$0.40
$0.80
$0.60
“Break–even” point in units
sold (a) ÷ (b) ……………….
172,983
211,801
268,943
Problem 6-28 (continued)
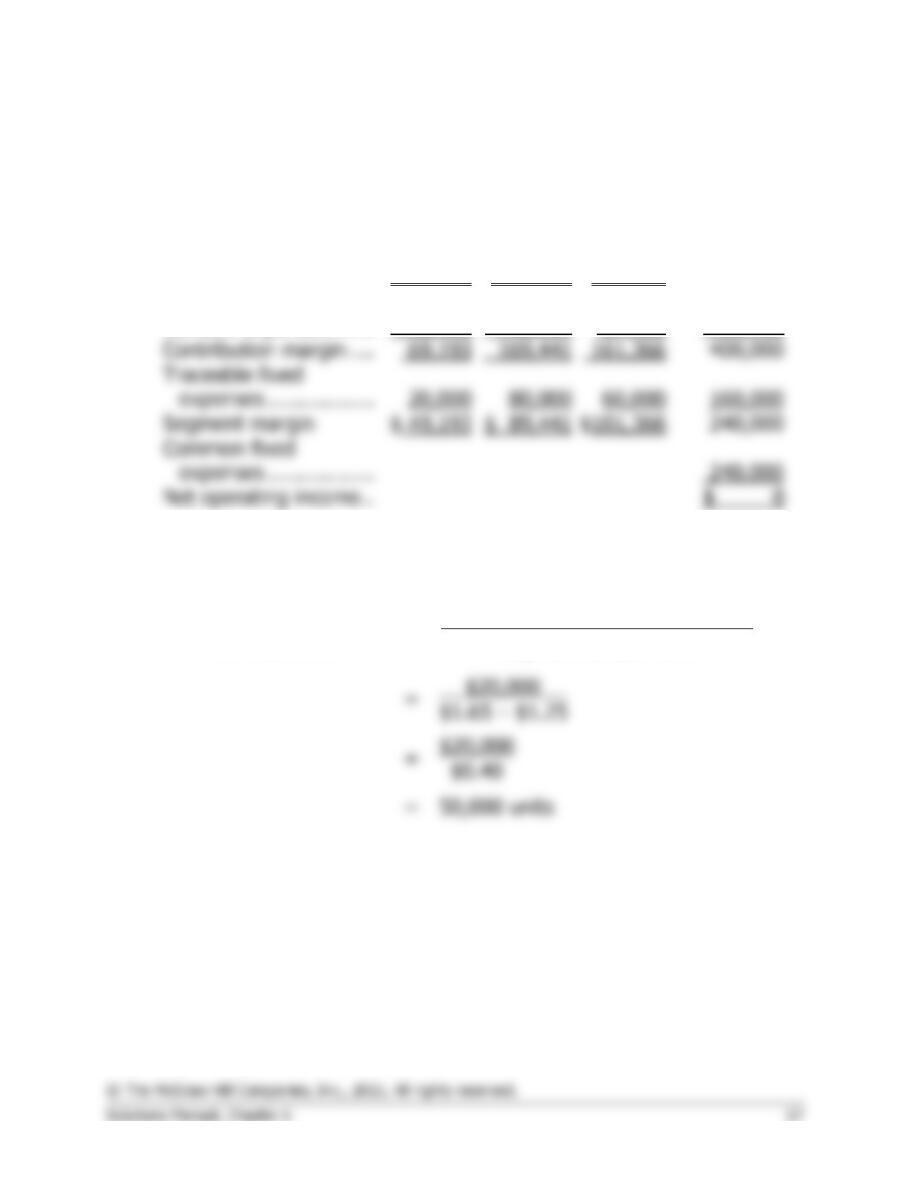
3b. If the company were to sell exactly the break-even quantities from
requirement 3a, the company would earn $0 profit. This can be
verified as follows:
Velcro
Metal
Nylon
Total
Unit sales ……………….
172,983
211,801
268,943
Sales ……………………..
$285,421
$317,702
$228,602
$831,725
Variable expenses …….
Contribution margin ….
Segment margin
$ 49,193
$101,366
Net operating income ..
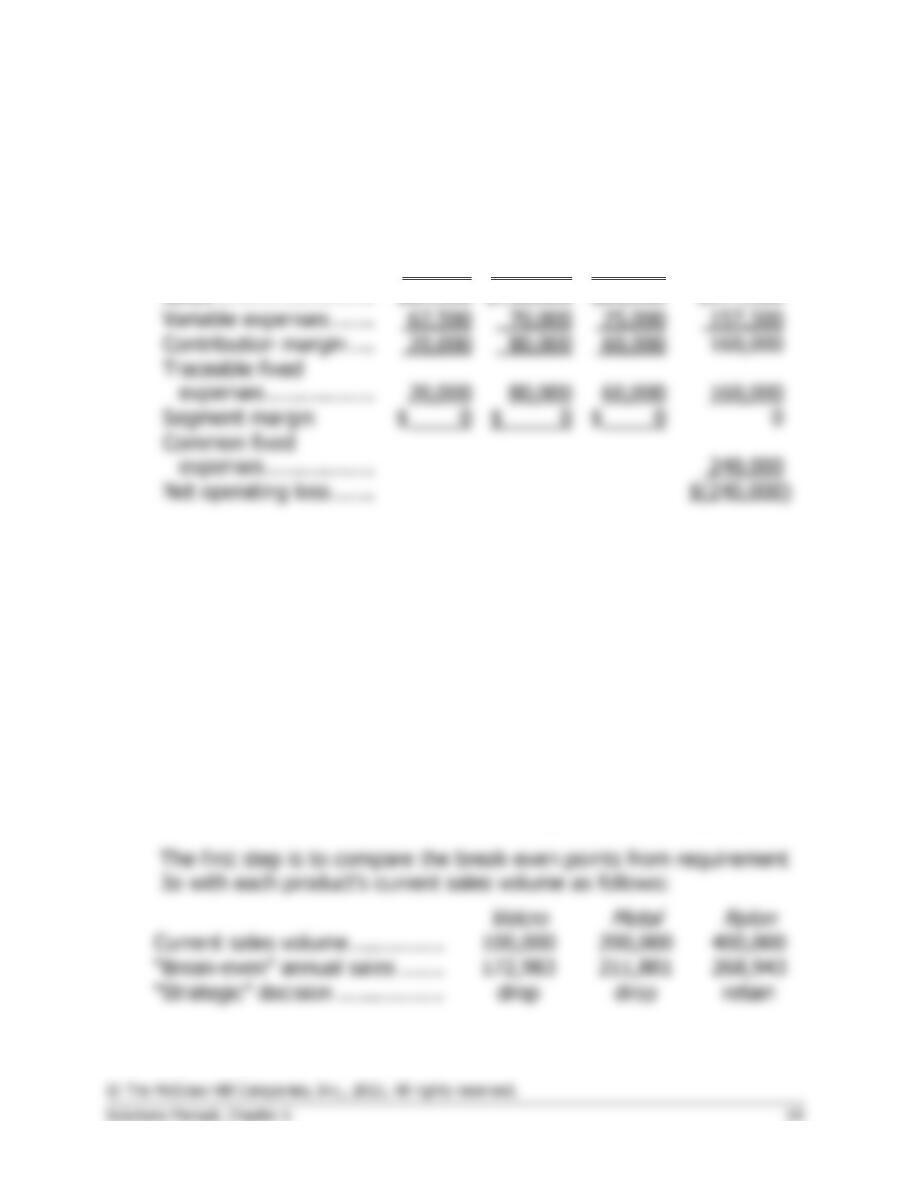
4a. The break-even point in unit sales for the Velcro product is computed
as follows:
Unit sales for a segment
to break even
=
Segment traceable fixed expenses
Segment CM per unit
$20,000
=
Problem 6-28 (continued)
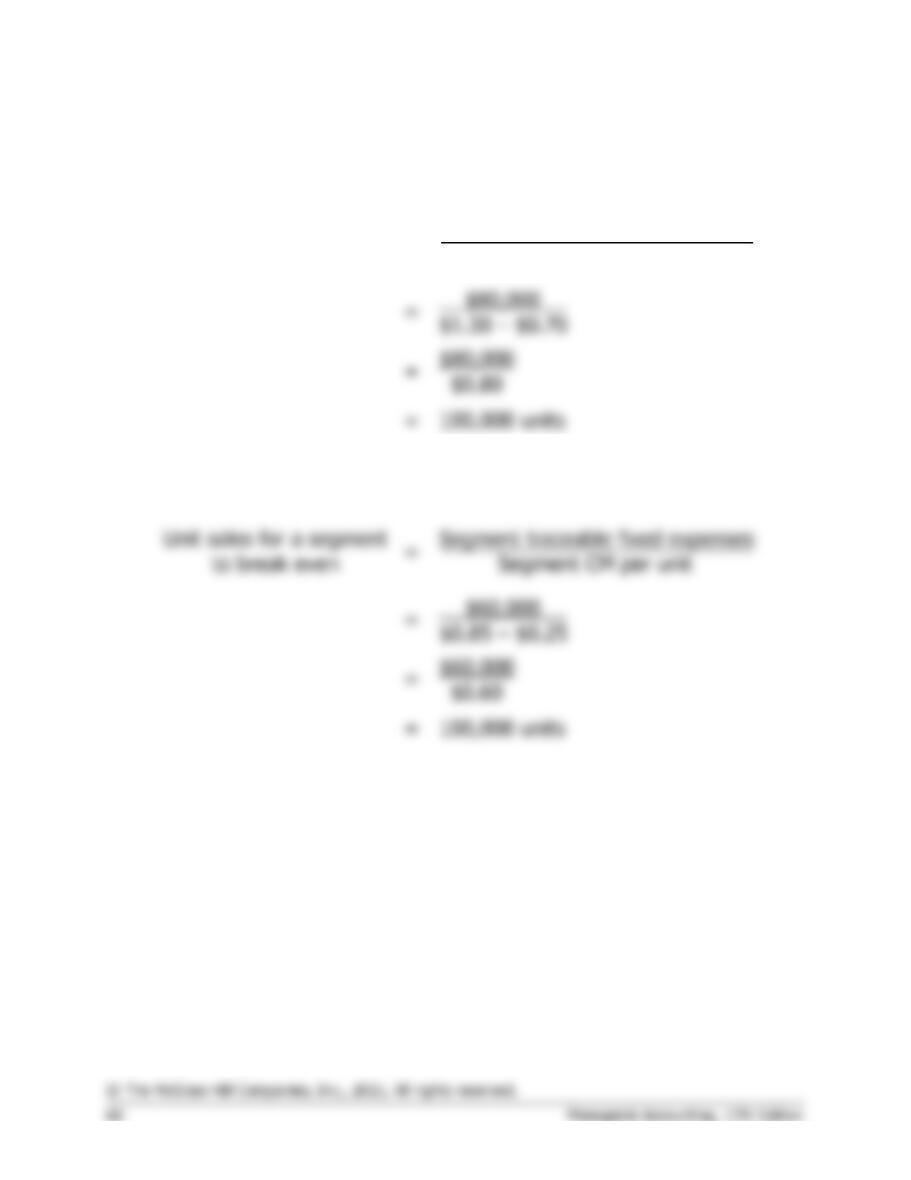
The break-even point in unit sales for the Metal product is computed
as follows:
Unit sales for a segment
to break even
=
Segment traceable fixed expenses
Segment CM per unit
$80,000
=
The break-even point in unit sales for the Nylon product is computed
as follows:
Unit sales for a segment
=
Segment traceable fixed expenses
=
Problem 6-28 (continued)
4b. If the company were to sell exactly the break-even quantities from
requirement 4a, the company would lose $240,000—the amount of
the common fixed expense. This can be verified as follows:
Velcro
Metal
Nylon
Total
Unit sales ……………….
50,000
100,000
100,000
Sales ……………………..
$82,500
$85,000
Variable expenses …….
Contribution margin ….
Segment margin
$ 0
$ 0
$ 0
Net operating loss …….
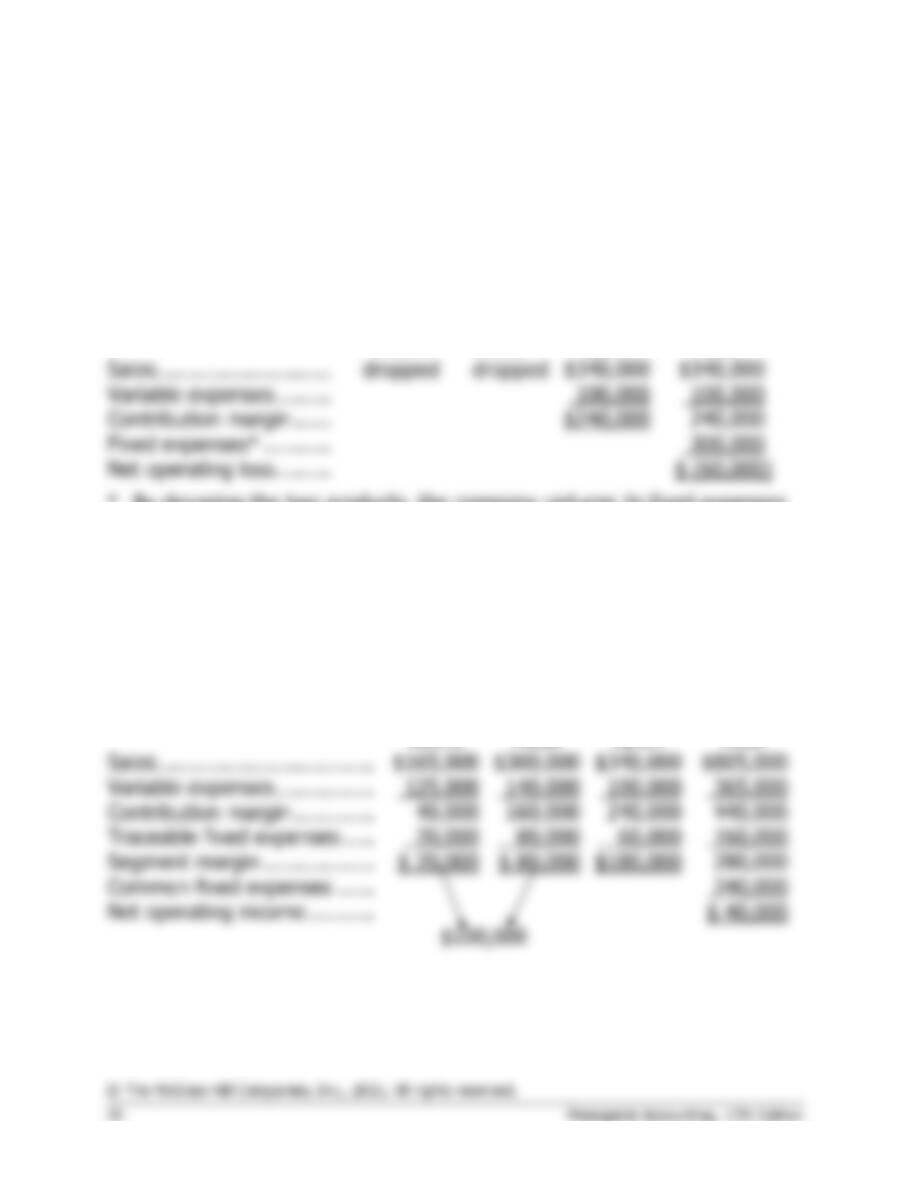
5. At this point, many students may conclude that method 1 is
preferable to method 2 in terms of calculating each product’s break–
even point. This misleading conclusion arises because requirement 3b
produces an overall net operating income of zero whereas
requirement 4b shows a net operating loss of $240,000. In other
words, it appears that relying on method 1 will “cover” the common
fixed costs, whereas method 2 will not.
Method 2 is the correct way to compute each product’s break-even
point in unit sales. The best way to highlight this answer is to use a
three-step process that explains how the approach espoused in
method 1 is likely to affect decision-making within the company.
Current sales volume ……………
Problem 6-28 (continued)
As shown above, two of the three products are failing to generate enough
sales to exceed their break-even point. This suggests that management
would be inclined to make a “strategic” decision to drop these two
products.
The second step is to summarize the profit implications of dropping the
Velcro and Metal products as shown below:
Velcro
Metal
Nylon
Total
Sales ……………………….
* By dropping the two products, the company reduces its fixed expenses
by only $100,000 ($20,000 + $80,000). Therefore, the total fixed
expenses are $300,000 rather than $400,000.
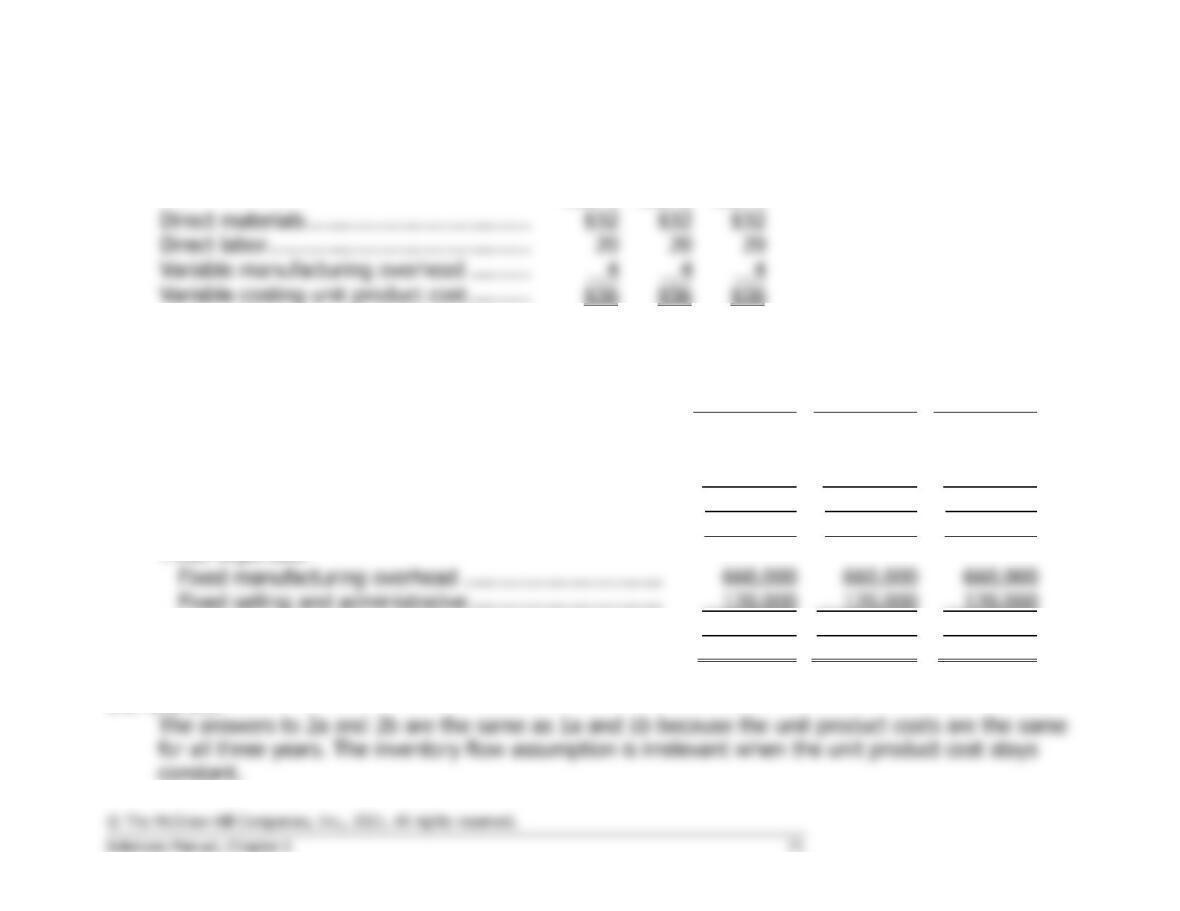
The third step is to emphasize the fact that dropping the two products
would cause the company to go from making a profit of $40,000 to
suffering a loss of $60,000. The reason is that the two dropped products
were contributing $100,000 toward covering common fixed expenses and
toward profits. This can be verified by looking at a segmented income
statement from requirement 1:
Nylon
Total
Traceable fixed expenses …..
Case 6-29 (45 minutes)
1. a. Under variable costing, only the variable manufacturing costs are included in product costs.
Year 1
Year 2
Year 3
Direct materials ………………………………
Direct labor ……………………………………
Variable manufacturing overhead ……….
Variable costing unit product cost ……….
1. b. The variable costing income statements appear below:
Year 1
Year 2
Year 3
Sales (@ $75 per unit) ……………………………………….
$6,000,000
$6,750,000
$5,625,000
Variable expenses:
Variable cost of goods sold @ $56 per unit …………..
4,480,000
5,040,000
4,200,000
Variable selling and administrative @ $3 per unit ……
240,000
270,000
225,000
Total variable expenses ………………………………………
4,720,000
5,310,000
4,425,000
Contribution margin …………………………………………..
1,280,000
1,440,000
1,200,000
Fixed expenses:
Fixed manufacturing overhead …………………………..
Fixed selling and administrative ………………………….
120,000
120,000
120,000
Total fixed expenses …………………………………………..
780,000
780,000
780,000
Net operating income …………………………..…………….
$ 500,000
$ 660,000
$ 420,000
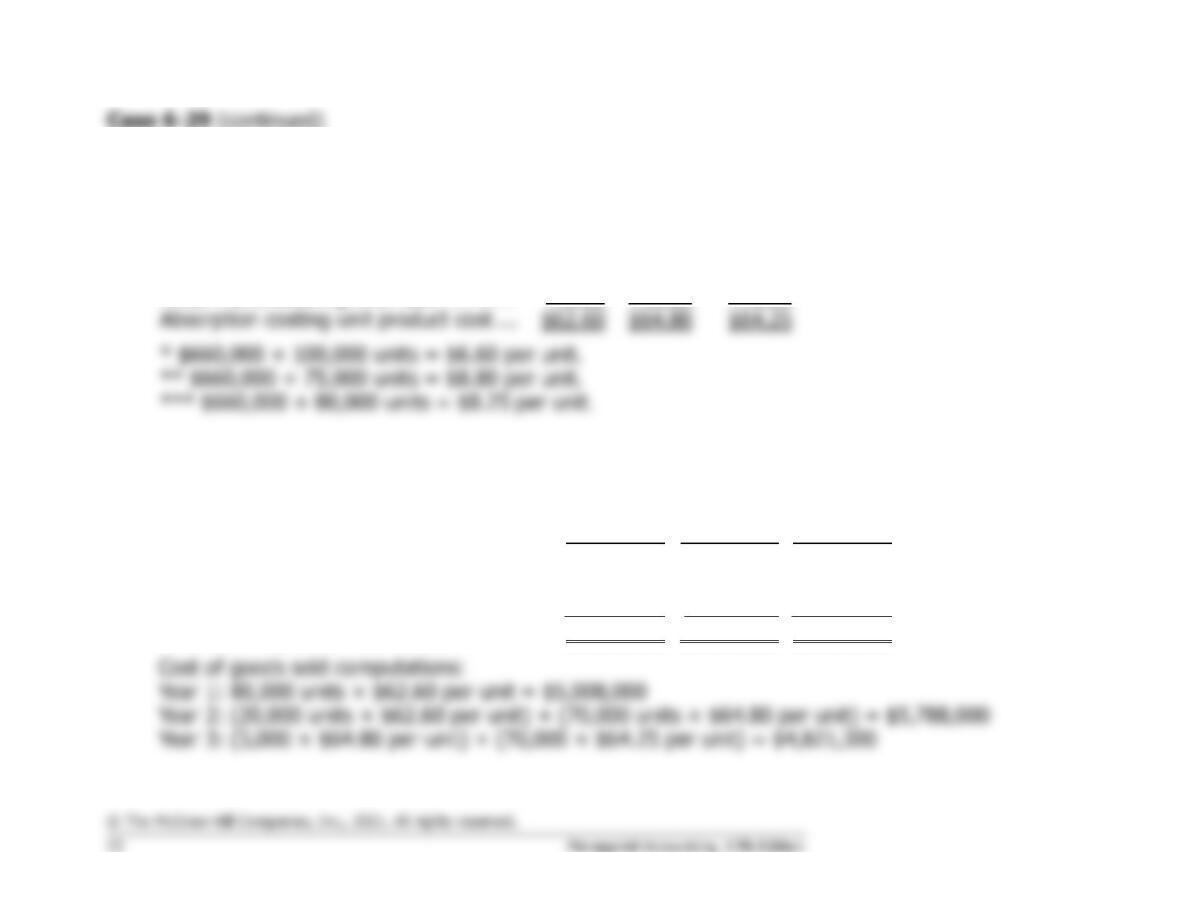
3. a. The unit product costs under absorption costing:
Year 1
Year 2
Year 3
Direct materials …………………………….
$32.00
$32.00
$32.00
Direct labor ………………………………….
20.00
20.00
20.00
Variable manufacturing overhead ……..
4.00
4.00
4.00
Fixed manufacturing overhead …………
*6.60
**8.80
***8.25
Absorption costing unit product cost ….
$62.60
$64.80
$64.25
*** $660,000 ÷ 80,000 units = $8.25 per unit.
3. b. The absorption costing income statements appear below (FIFO):
Year 1
Year 2
Year 3
Sales (@ $75 per unit) ……………………….
$6,000,000
$6,750,000
$5,625,000
Cost of goods sold …………………………….
5,008,000
5,788,000
4,821,500
Gross margin ……………………………………
992,000
962,000
803,500
Selling and administrative expenses
($3 per unit + $120,000) ………………….
360,000
390,000
345,000
Net operating income …………………………
$ 632,000
$ 572,000
$ 458,500
Case 6-29 (continued)
4. a. The unit product costs under absorption costing:
Year 1
Year 2
Year 3
Direct materials …………………………….
$32.00
$32.00
$32.00
Direct labor ………………………………….
20.00
20.00
20.00
Variable manufacturing overhead ……..
4.00
4.00
4.00
Fixed manufacturing overhead …………
*6.60
**8.80
***8.25
Absorption costing unit product cost ….
$62.60
$64.80
$64.25
*** $660,000 ÷ 80,000 units = $8.25 per unit.
4. b. The absorption costing income statements appears below (LIFO):
Year 1
Year 2
Year 3
Sales ………………………………………………
Cost of goods sold …………………………….
Gross margin ……………………………………
Selling and administrative expenses ………
Net operating income …………………………
Cost of goods sold computations:
Year 1: 80,000 units × $62.60 per unit = $5,008,000
Year 2: (75,000 units × $64.80 per unit) + (15,000 units × $62.60 per unit) = $5,799,000
Year 3: 75,000 × $64.25 per unit = $4,818,750
Case 6-30 (75 minutes)
1. See the segmented statement on the second following page.
Supporting computations for the statement are given below:
Sales:
Membership dues (20,000 × $100) ………………………
$2,000,000
Assigned to Magazine Subscriptions Division
(20,000 × $20) ……………………………………………..
400,000
Assigned to Membership Division …………………………
$1,600,000
Non-member magazine subscriptions (2,500 × $30) ..
$ 75,000
Reports and texts (28,000 × $25) ………………………..
$ 700,000
Continuing education courses:
One-day (2,400 × $75) …………………………………..
$ 180,000
Total revenue ………………………………………………….
$ 400,000
Salary and personnel costs:
Salaries
Personnel Costs
(25% of Salaries)
Membership Division ………………….
$210,000
$ 52,500
Magazine Subscriptions Division ……
150,000
37,500
Books and Reports Division …………
300,000
75,000
Continuing Education Division ………
Total assigned to divisions …………..
840,000
Corporate staff …………………………
Total ………………………………………
$920,000
Case 6-30 (continued)
Some may argue that, except for the $50,000 in rental cost directly
attributed to the Books and Reports Division, occupancy costs are
common costs that should not be allocated. The correct treatment of
the occupancy costs depends on whether they could be avoided in part
by eliminating a division. In the solution below, we have assumed they
could be avoided.
Occupancy costs ($230,000 allocated + $50,000 direct to the Books
and Reports Division = $280,000):
Allocated to:
Membership Division
($230,000 × 0.2) …………………………………….
Magazine Subscriptions Division
Books and Reports Division
Continuing Education Division
Corporate staff
($230,000 × 0.1) …………………………………….
23,000
Total occupancy costs …………………………………
$280,000
Printing and paper costs ………………………………..
$320,000
Assigned to:
Magazine Subscriptions Division
(22,500 × $7) ………………………………………
$157,500
Books and Reports Division
(28,000 × $4) ………………………………………
112,000
269,500
Remainder—Continuing Education Division ……
$ 50,500
Assigned to:
Books and Reports Division
(28,000 × $2) ………………………………………