Unlock document.
This document is partially blurred.
Unlock all pages and 1 million more documents.
Get Access
CHAPTER 6
SOLUTIONS TO PROBLEMS—SET C
PROBLEM 6-1C
(a) Title to the goods does not transfer to the customer until March 2.
Include the $800 in ending inventory.
(b) Equitz owns the goods once they are shipped on February 26. Include
inventory of $325.
PROBLEM 6-2C
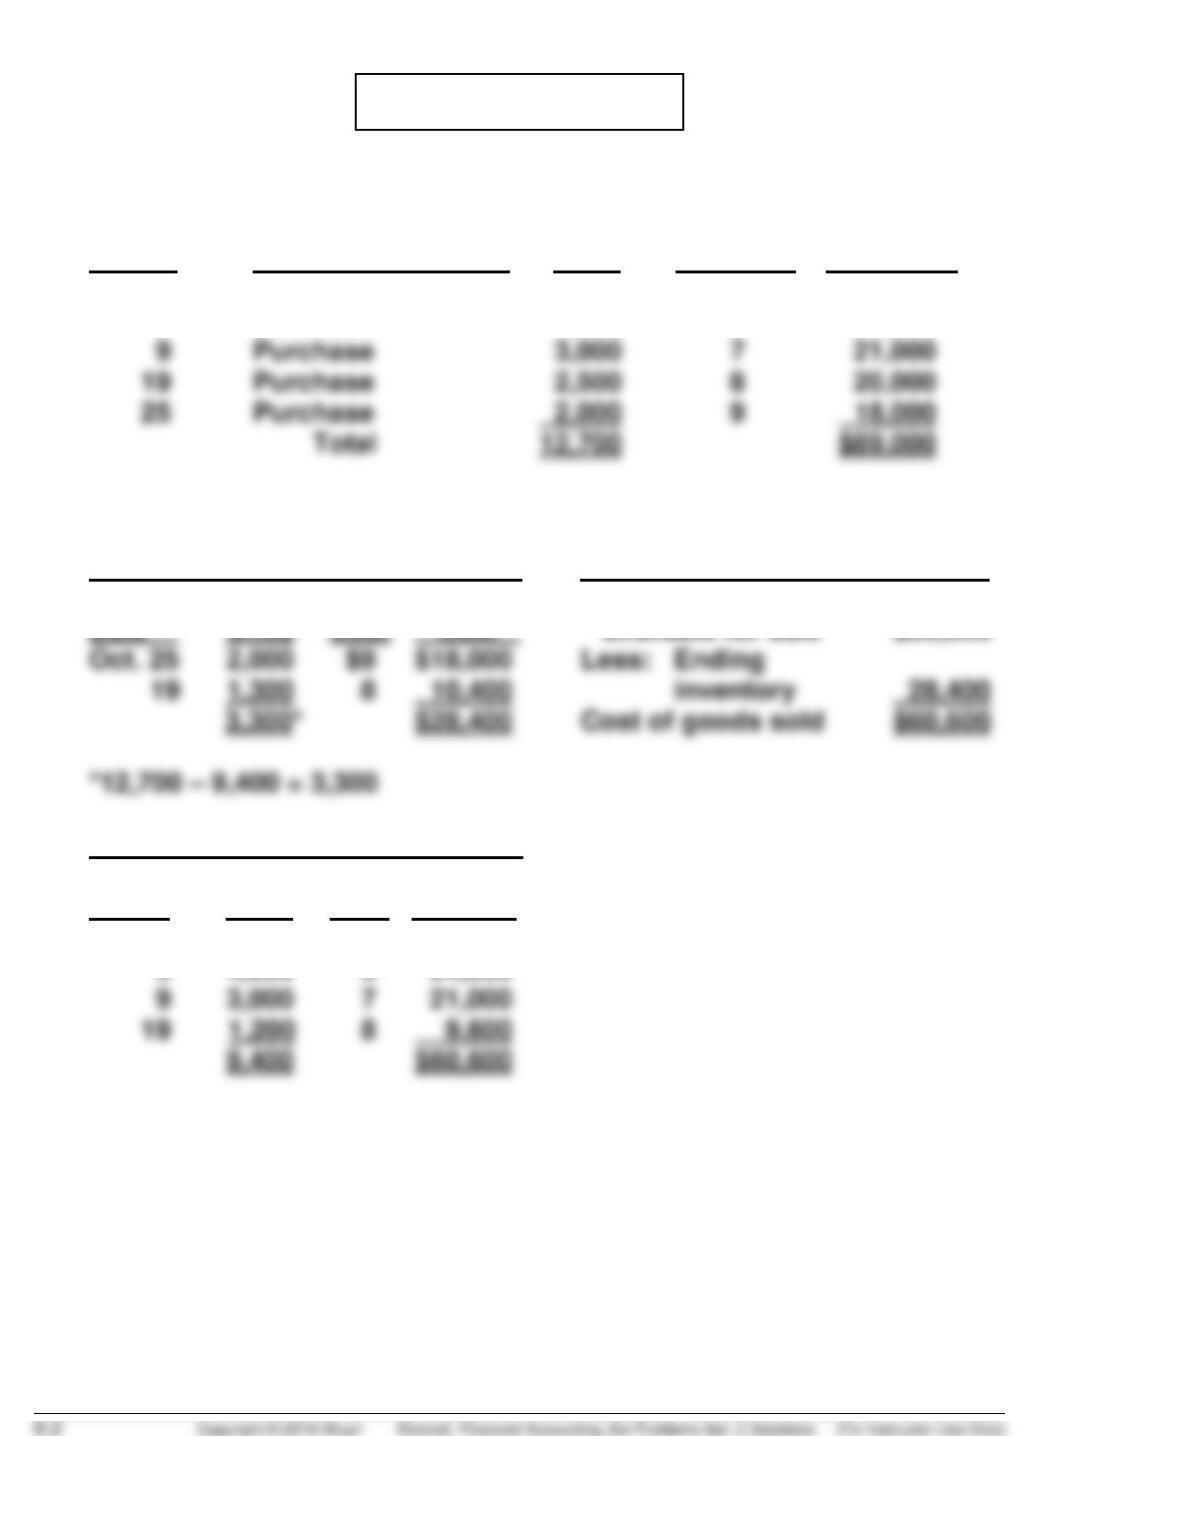
(a) COST OF GOODS AVAILABLE FOR SALE
Date Explanation Units Unit Cost Total Cost
Oct. 1 Beginning inventory 1,200 $5 $ 6,000
3 Purchase 4,000 6 24,000
(b) FIFO
(1) Ending Inventory (2) Cost of Goods Sold
Unit Total Cost of goods
Proof of Cost of Goods Sold
Unit Total
Date Units Cost Cost
Oct. 1 1,200 $5 $ 6,000
3 4,000 6 24,000
Copyright © 2013 John Wiley & Sons, Inc. Kimmel, Financial Accounting, 7/e, Problems: Set C Solutions (For Instructor Use Only)
PROBLEM 6-2C (Continued)
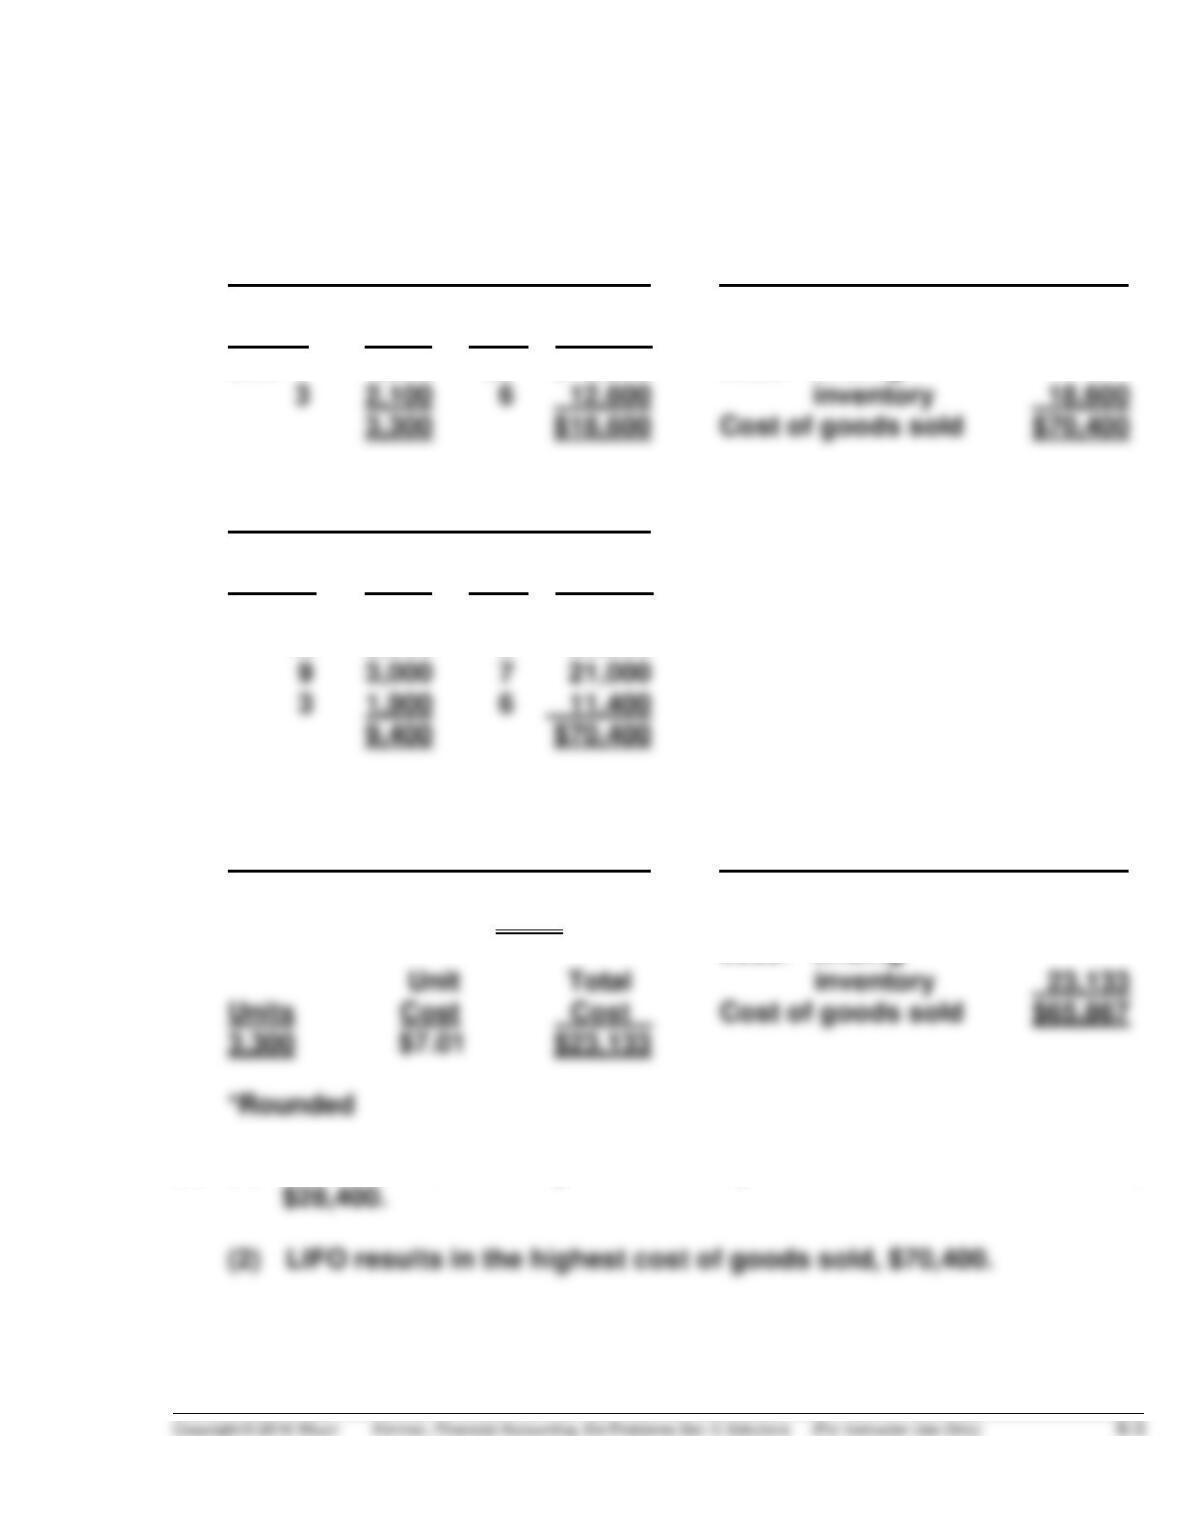
LIFO
(1) Ending Inventory (2) Cost of Goods Sold
Unit Total Cost of goods
Date Units Cost Cost available for sale $89,000
Oct. 1 1,200 $5 $ 6,000 Less: Ending
Proof of Cost of Goods Sold
Unit Total
Date Units Cost Cost
Oct. 25 2,000 $9 $18,000
19 2,500 8 20,000
AVERAGE-COST
(1) Ending Inventory (2) Cost of Goods Sold
Cost of goods
$89,000 ÷ 12,700 = $7.01* available for sale $89,000
Less: Ending
(c) (1) FIFO results in the highest inventory amount for the balance sheet,
PROBLEM 6-3C
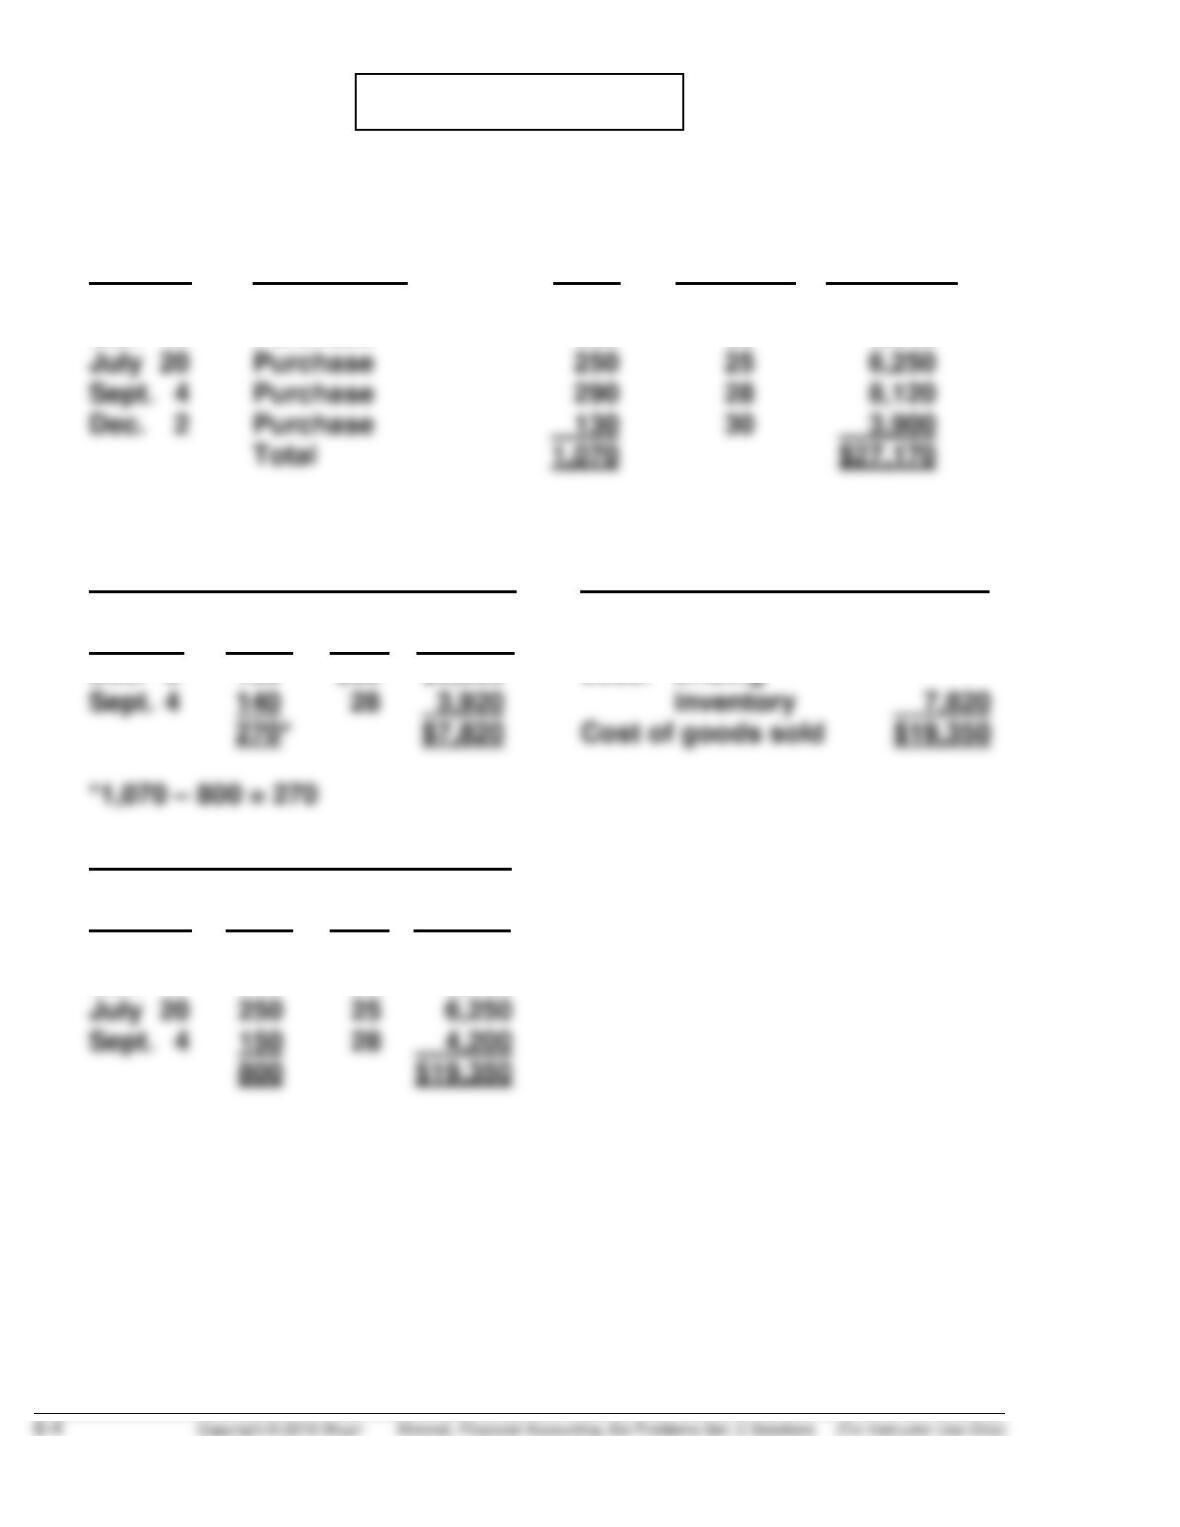
(a) COST OF GOODS AVAILABLE FOR SALE
Date Explanation Units Unit Cost Total Cost
Jan. 1 Beginning inventory 100 $20 $ 2,000
Mar. 15 Purchase 300 23 6,900
(b) FIFO
Ending Inventory Cost of Goods Sold
Unit Total Cost of goods
Date Units Cost Cost available for sale $27,170
Dec. 2 130 $30 $3,900 Less: Ending
Proof of Cost of Goods Sold
Unit Total
Date Units Cost Cost
Jan. 1 100 $20 $ 2,000
Mar. 15 300 23 6,900
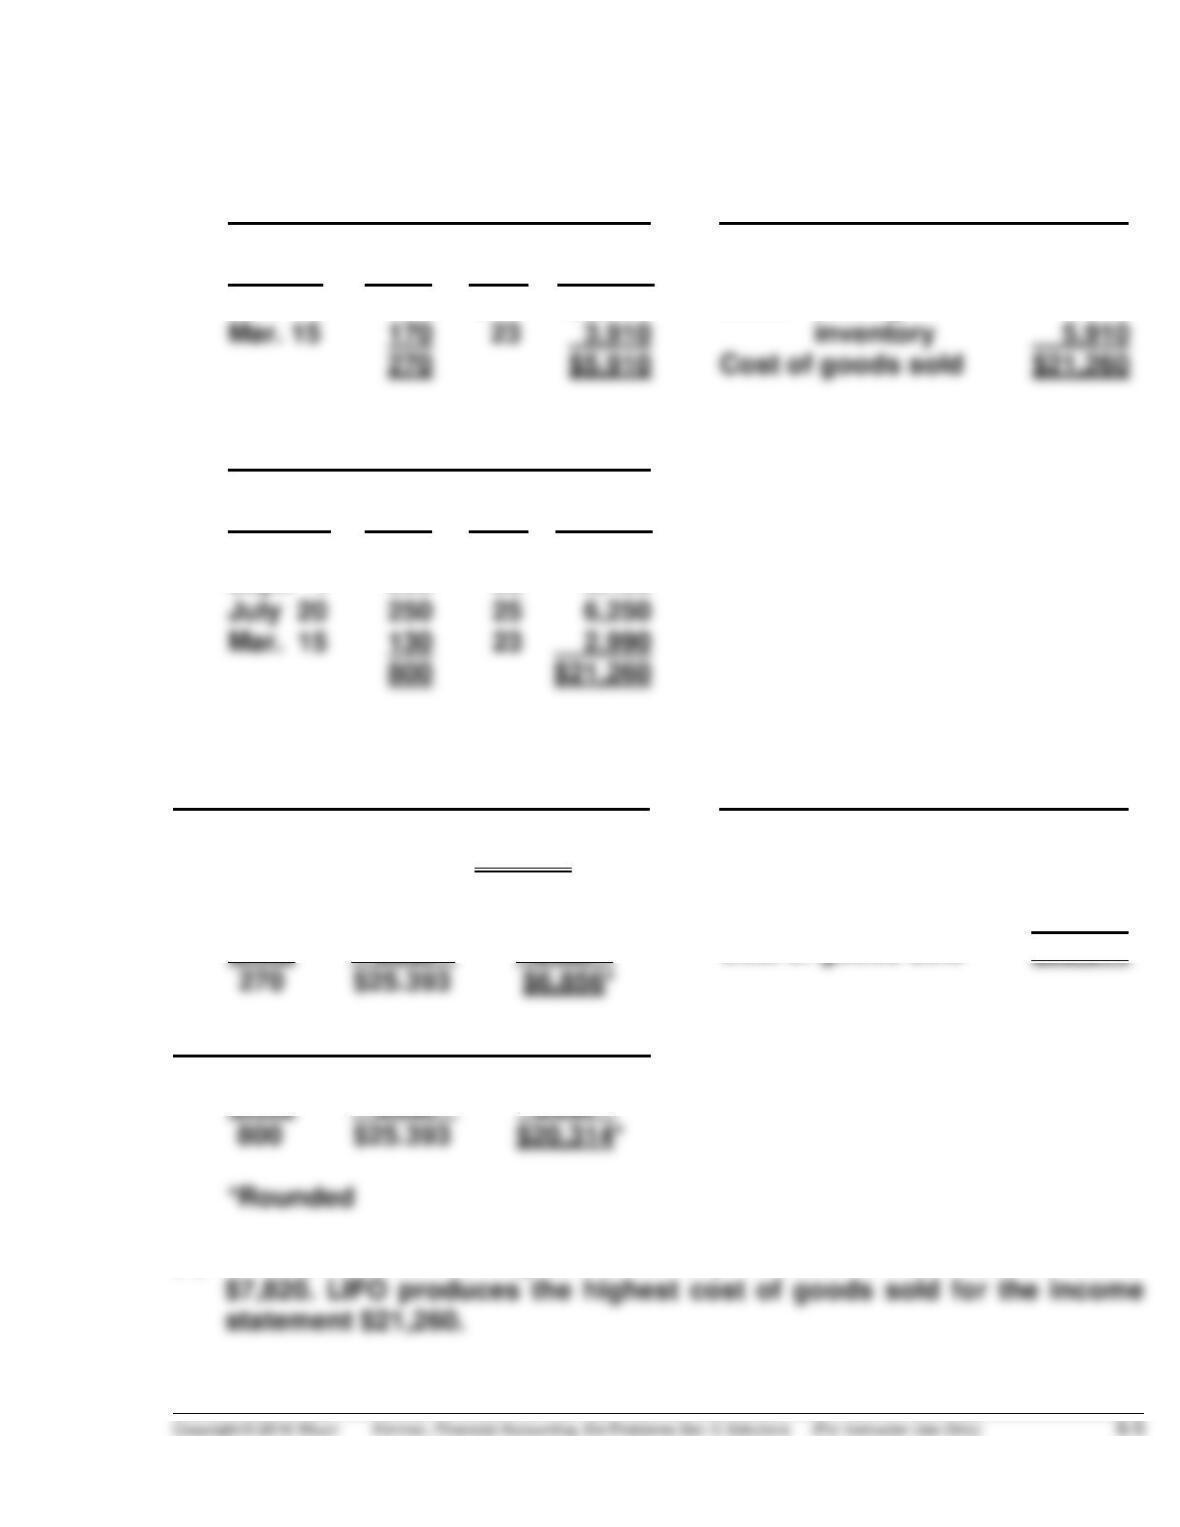
PROBLEM 6-3C (Continued)
LIFO
Ending Inventory Cost of Goods Sold
Unit Total Cost of goods
Date Units Cost Cost available for sale $27,170
Jan. 1 100 $20 $2,000 Less: Ending
Proof of Cost of Goods Sold
Unit Total
Date Units Cost Cost
Dec. 2 130 $30 $ 3,900
Sept. 4 290 28 8,120
AVERAGE-COST
Ending Inventory Cost of Goods Sold
Cost of goods
$27,170 ÷ 1,070 = $25.393 available for sale $27,170
Less: Ending
Unit Total inventory 6,856
Units Cost Cost Cost of goods sold $20,314
Proof of Cost of Goods Sold
Unit Total
Units Cost Cost
(c) FIFO produces the highest inventory amount for the balance sheet
PROBLEM 6-4C
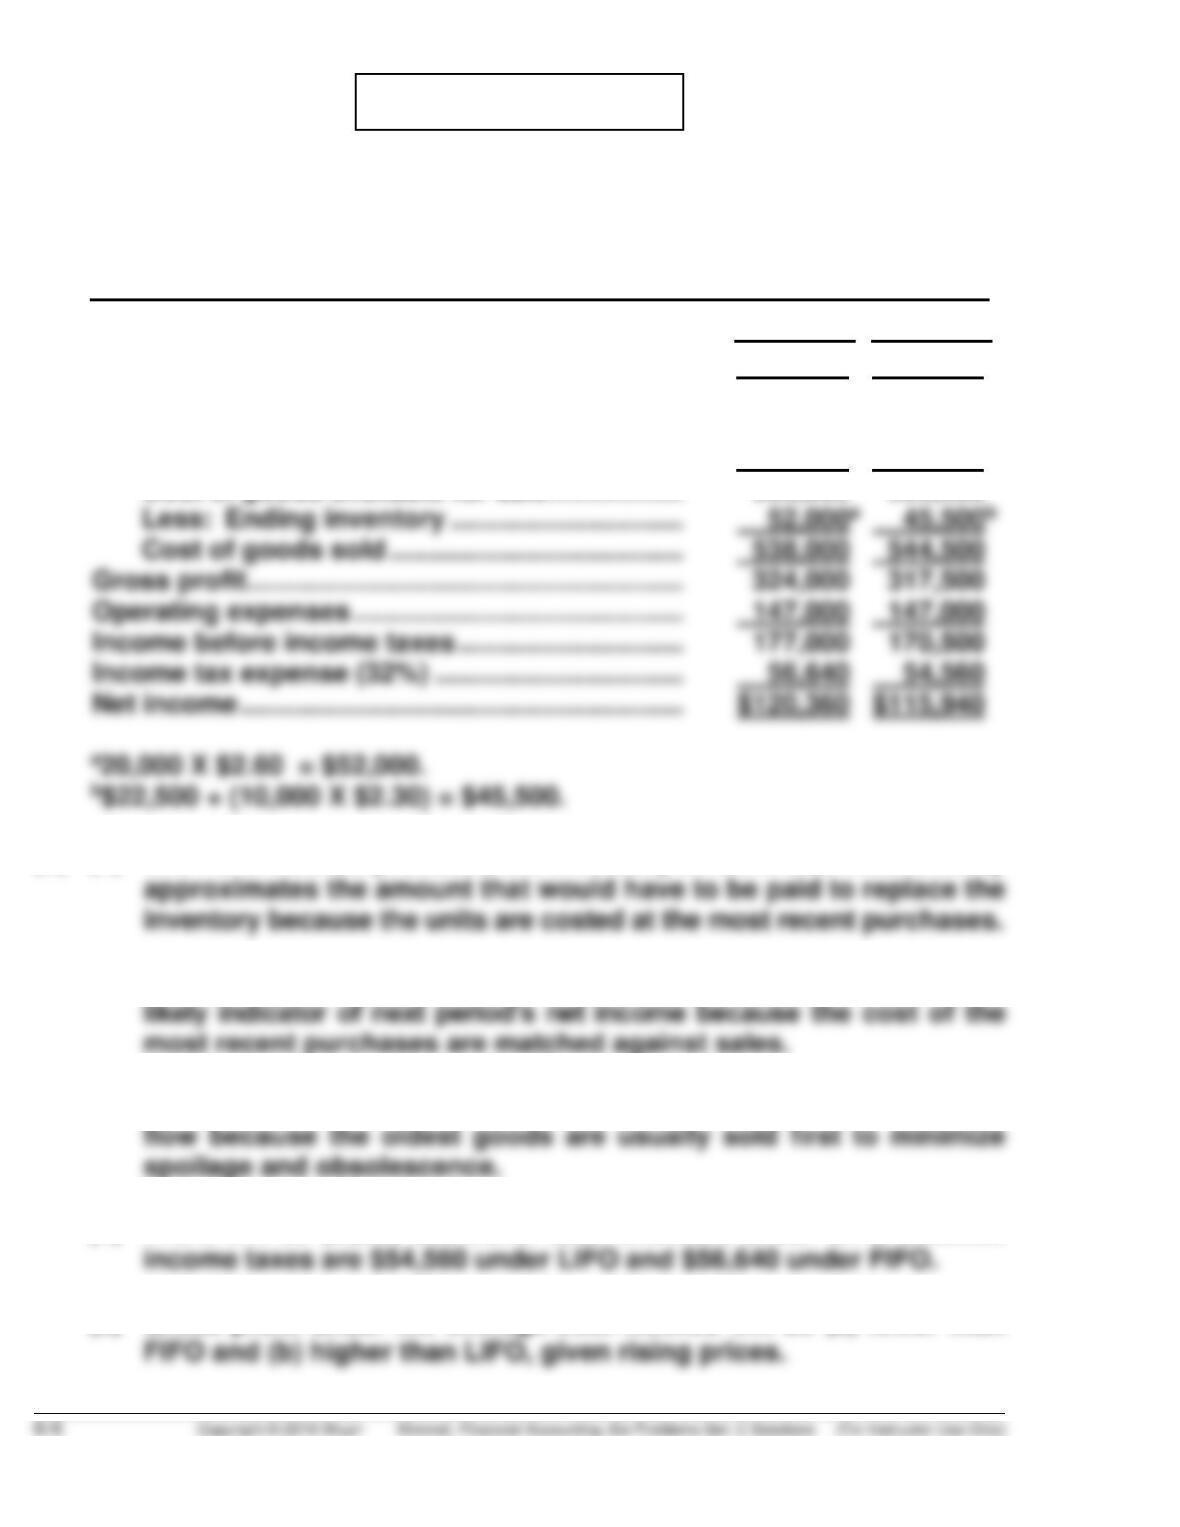
(a) HOWLAND INC.
Condensed Income Statements
For the Year Ended December 31, 2014
FIFO LIFO
Sales ..................................................................... $862,000 $862,000
Cost of goods sold
Beginning inventory ..................................... 22,500 22,500
Cost of goods purchased ............................ 567,500 567,500
Cost of goods available for sale .................. 590,000 590,000
(b) (1) The FIFO method produces the inventory amount that most closely
(2) The LIFO method produces the net income amount that is a more
(3) The FIFO method is most likely to approximate actual physical
(4) There will be $2,080 additional cash available under LIFO because
(5) Gross profit under the average-cost method will be (a) lower than
PROBLEM 6-4C (Continued)
Answer in business-letter form:
Dear Howland Inc.
After preparing the comparative condensed income statements for
2014 under the FIFO and LIFO methods, we have found the following:
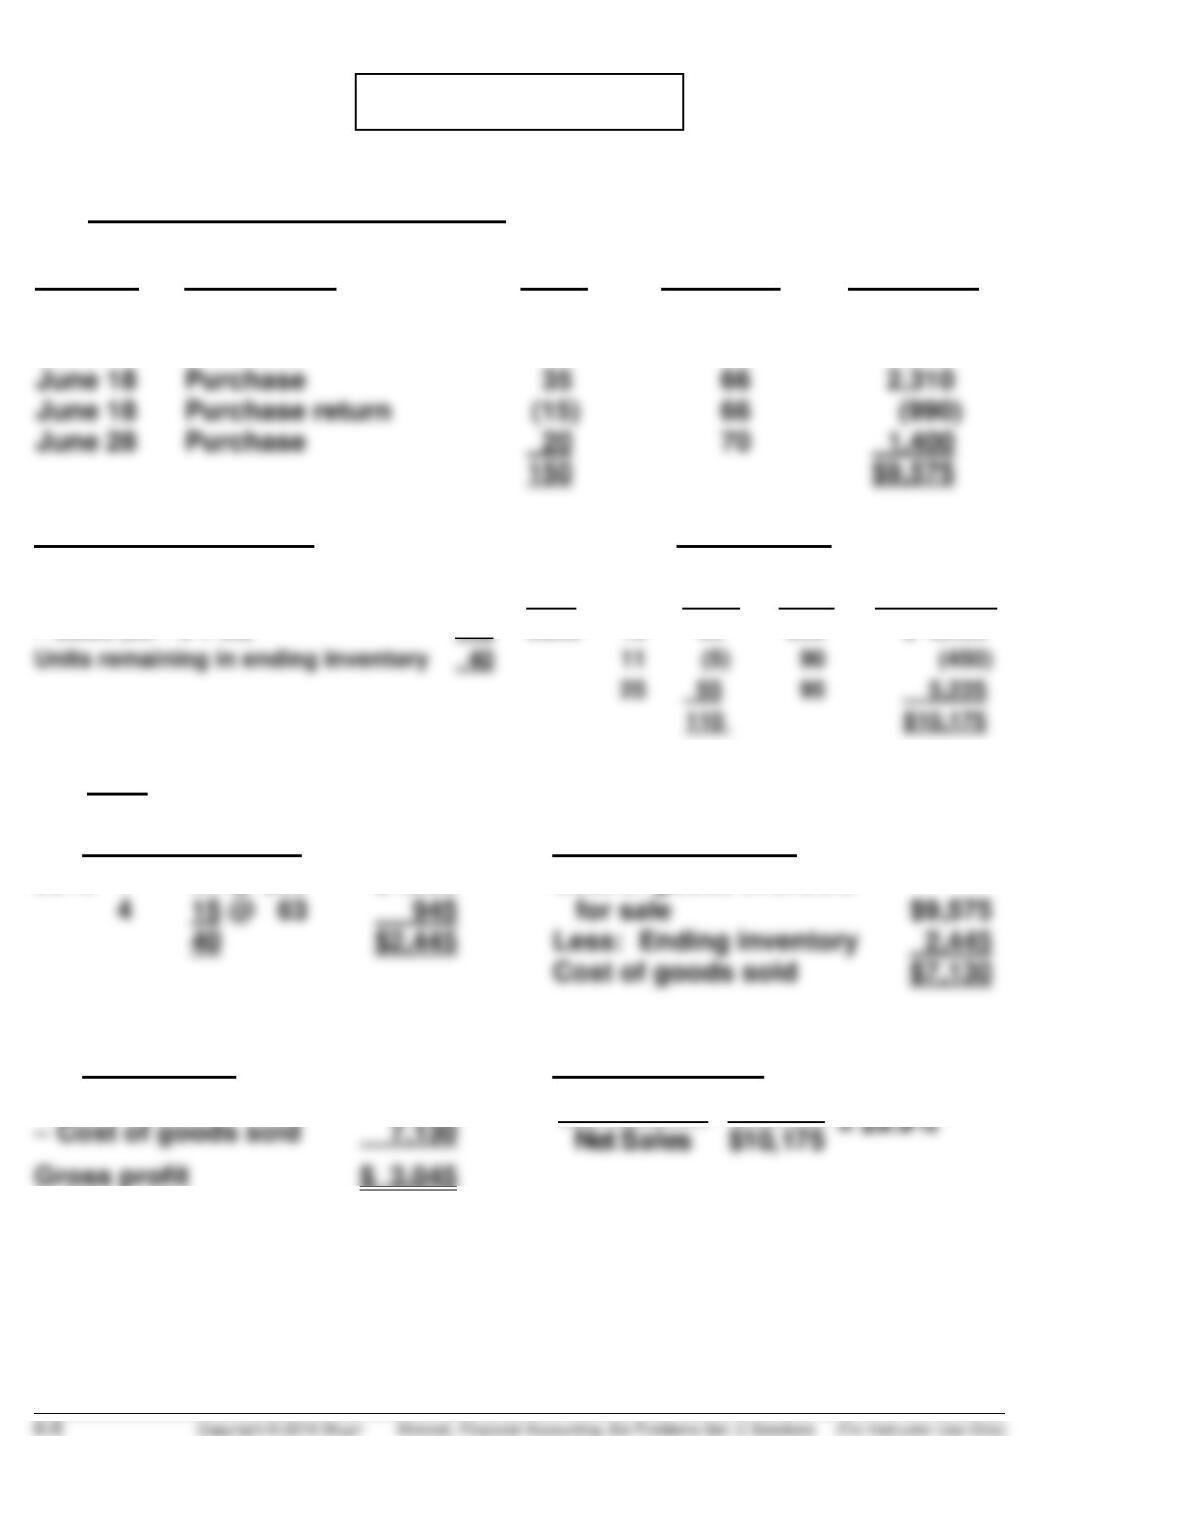
PROBLEM 6-5C
(a) Cost of Goods Available for Sale
Date
Explanation
Units
Unit Cost
Total Cost
June 1
Beginning inventory
25
$60
$1,500
June 4
Purchase
85
63
5,355
Ending Inventory in Units:
Sales revenue
Units available for sale
150
Date
Units
Unit
Price
Total Sales
– Sales (60 – 5 + 55)
110
June 10
60
$90
$ 5,400
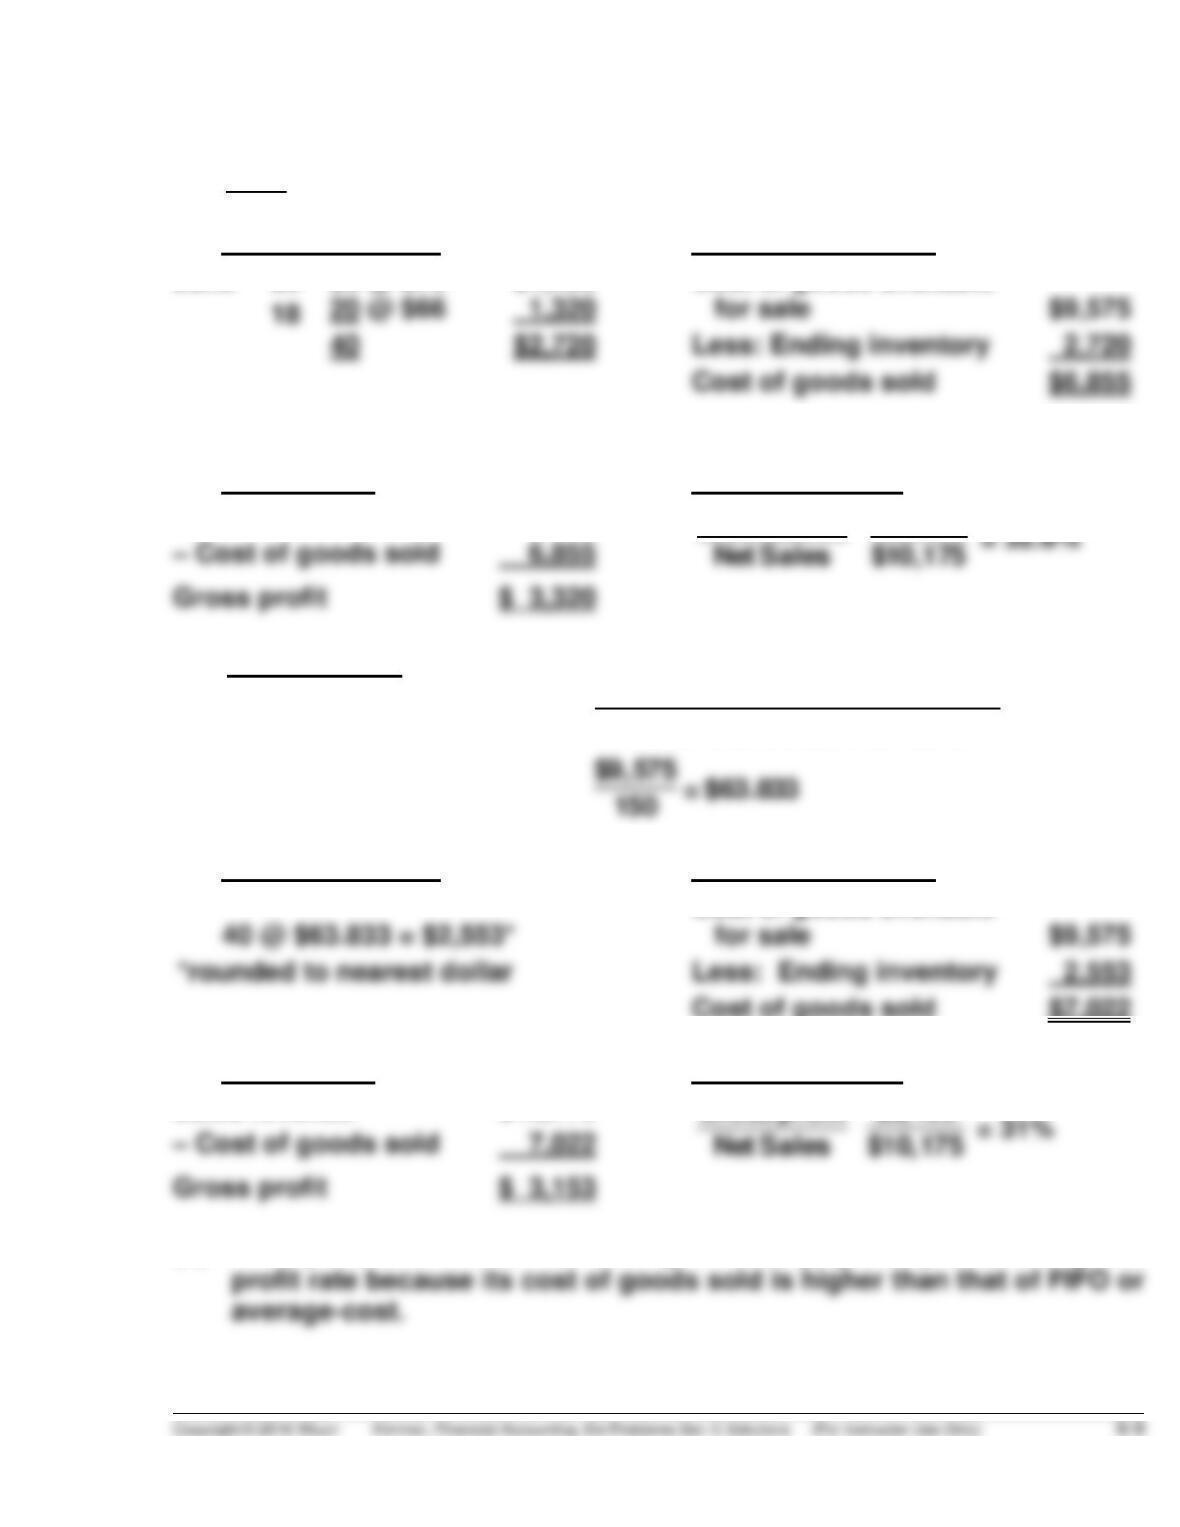
(1) LIFO
(i) Ending inventory
(ii) Cost of goods sold
June 1
25 @ $60
$1,500
Cost of goods available
(iii) Gross profit
(iv) Gross profit rate
Sales revenue
$10,175
Gross profit
$3,045
PROBLEM 6-5C (Continued)
(2) FIFO
(i) Ending inventory
(ii) Cost of goods sold
June 28
20 @ $70
$1,400
Cost of goods available
(iii) Gross profit
(iv) Gross profit rate
Sales revenue
$10,175
Gross profit
$3,320
(3) Average-Cost
Weighted-average cost per unit:
Cost of goods available for sale
Units available for sale
(i) Ending inventory
(ii) Cost of goods sold
Cost of goods available
Cost of goods sold
$7,022
(iii) Gross profit
(iv) Gross profit rate
Sales revenue
$10,175
Gross profit
$3,153
(b) LIFO produces the lowest ending inventory, gross profit, and gross
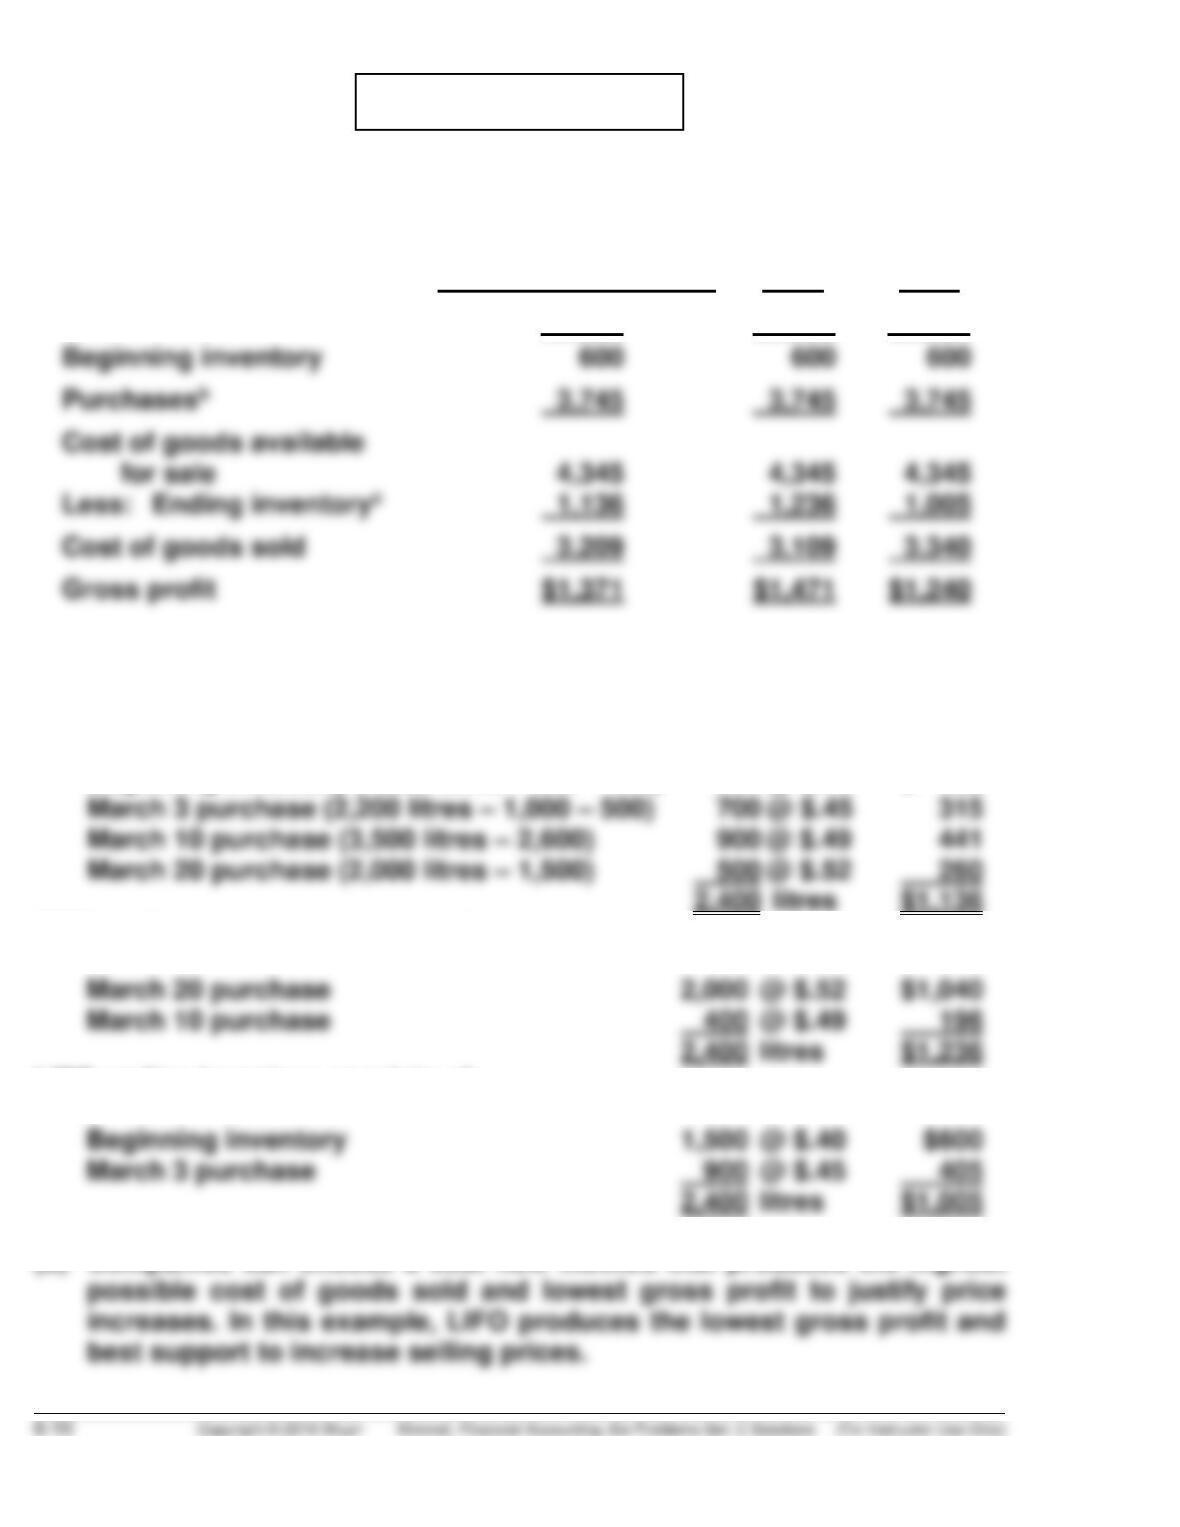
PROBLEM 6-6C
(a) GAS SAVER PLUS
Income Statement (partial)
Specific Identification
FIFO
LIFO
Sales revenuea
$4,580
$4,580
$4,580
(a) (1,800 @ $.60) + (5,000 @ $.70)
(b) (2,200 @ $.45) + (3,500 @ $.49) + (2,000 @ $.52)
(c) Specific identification ending inventory consists of:
Beginning inventory (1,500 litres – 800 – 400) 300 @ $.40 $ 120
FIFO ending inventory consists of:
March 20 purchase 2,000 @ $.52 $1,040
LIFO ending inventory consists of:
Beginning inventory 1,500 @ $.40 $600
(b) Companies can choose a cost flow method that produces the highest
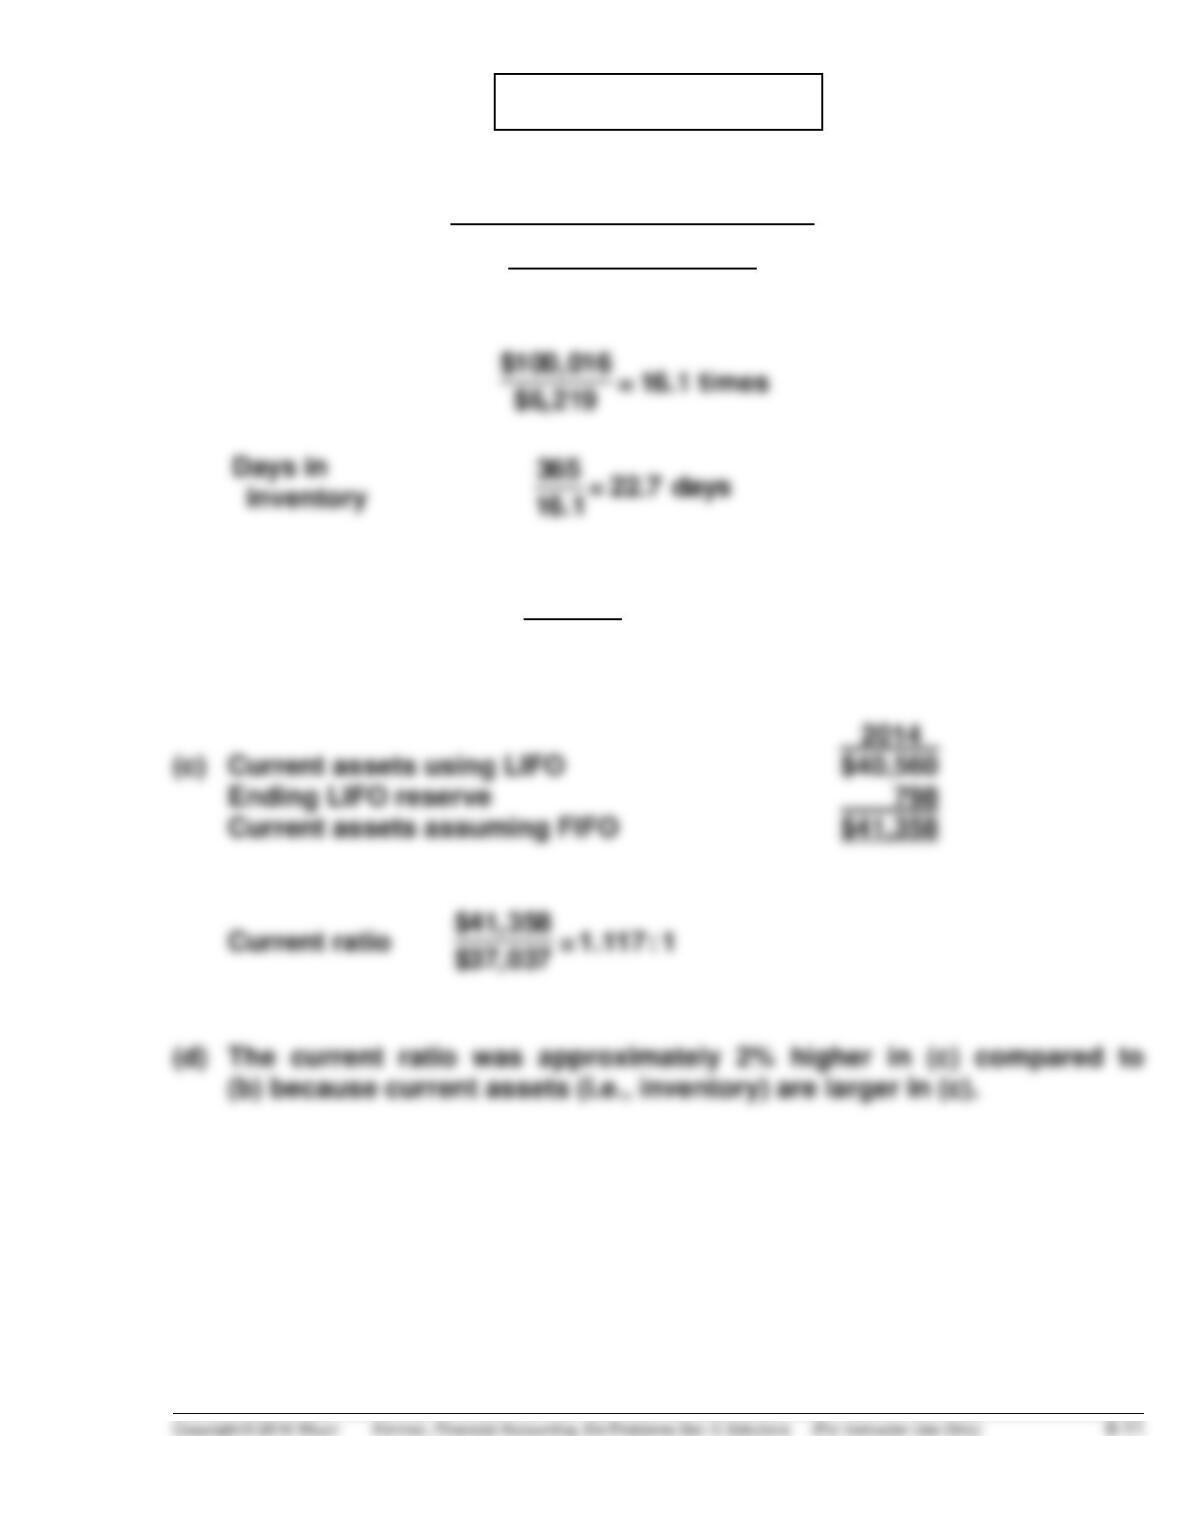
PROBLEM 6-7C
(a)
2014
Inventory
turnover
$100,016
($6,988+ $5,450) ÷ 2
(b) Current
ratio
$40,560
$37,037 =1.095: 1
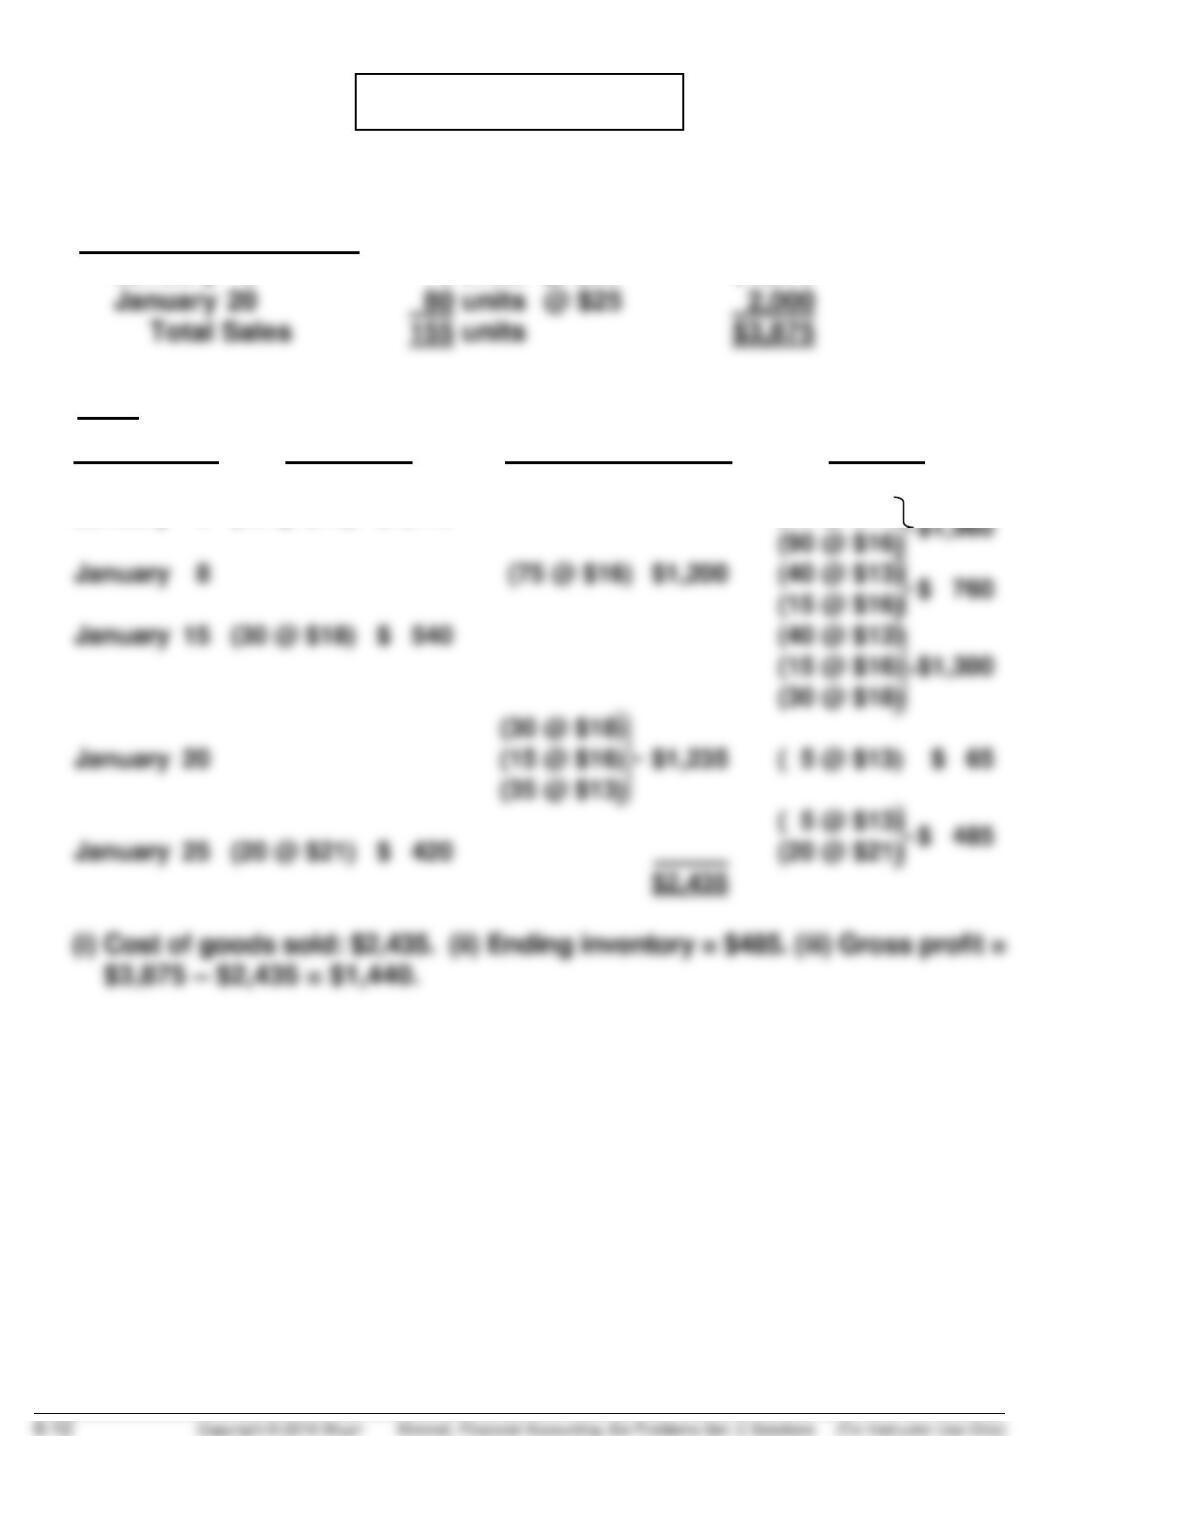
*PROBLEM 6-8C
(a)
Sales
January 8
75 units @ $25
$1,875
(1) LIFO
Date
Purchases
Cost of goods sold
Balance
January 1
(40 @ $13)
$ 520
January 5
(90 @ $16) $1,440
(40 @ $13)
*PROBLEM 6-8C (Continued)
(2) FIFO
Date
Purchases
Cost of goods sold
Balance
January 1
(40 @ $13)
$ 520
(40 @ $13)
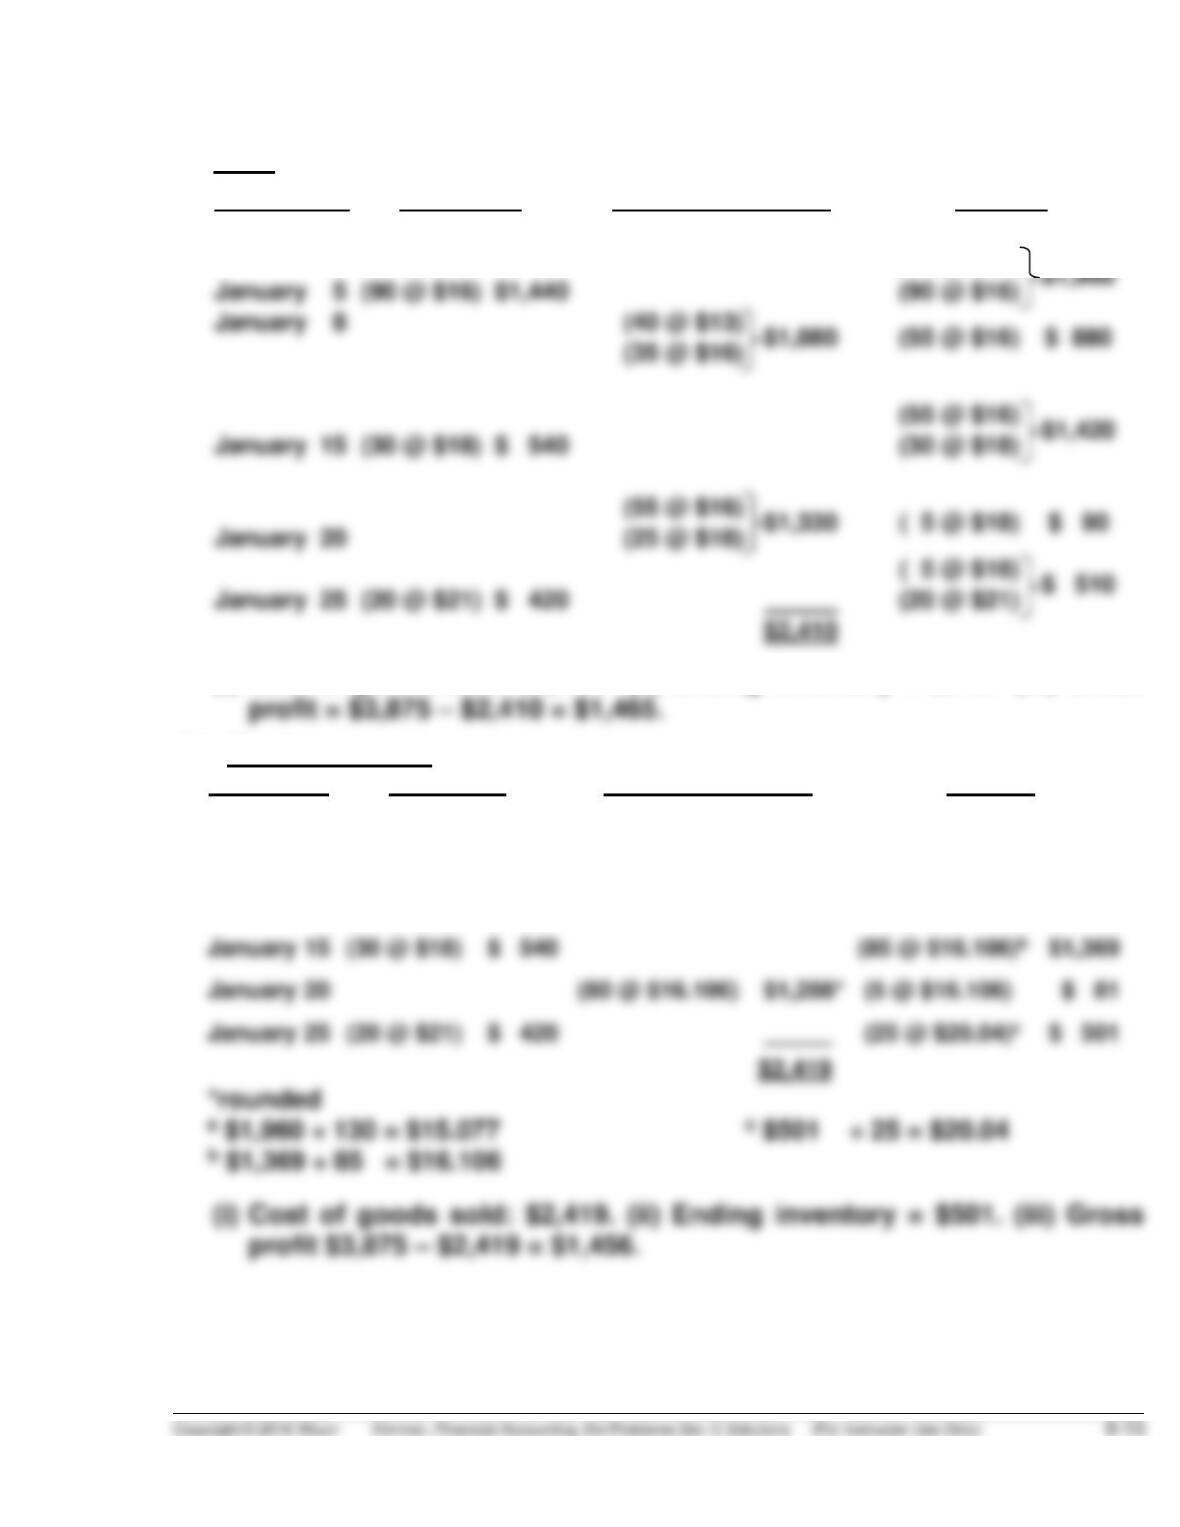
(i) Cost of goods sold: $2,410. (ii) Ending inventory = $510. (iii) Gross
(3) Moving-average
Date
Purchases
Cost of goods sold
Balance
January 1
(40 @ $13)
$ 520
January 5
(90 @ $16) $1,440
(130 @ $15.077)a
$1,960
January 8
(75 @ $15.077) $1,131*
(55 @ $15.077)
$ 829
*PROBLEM 6-8C (Continued)
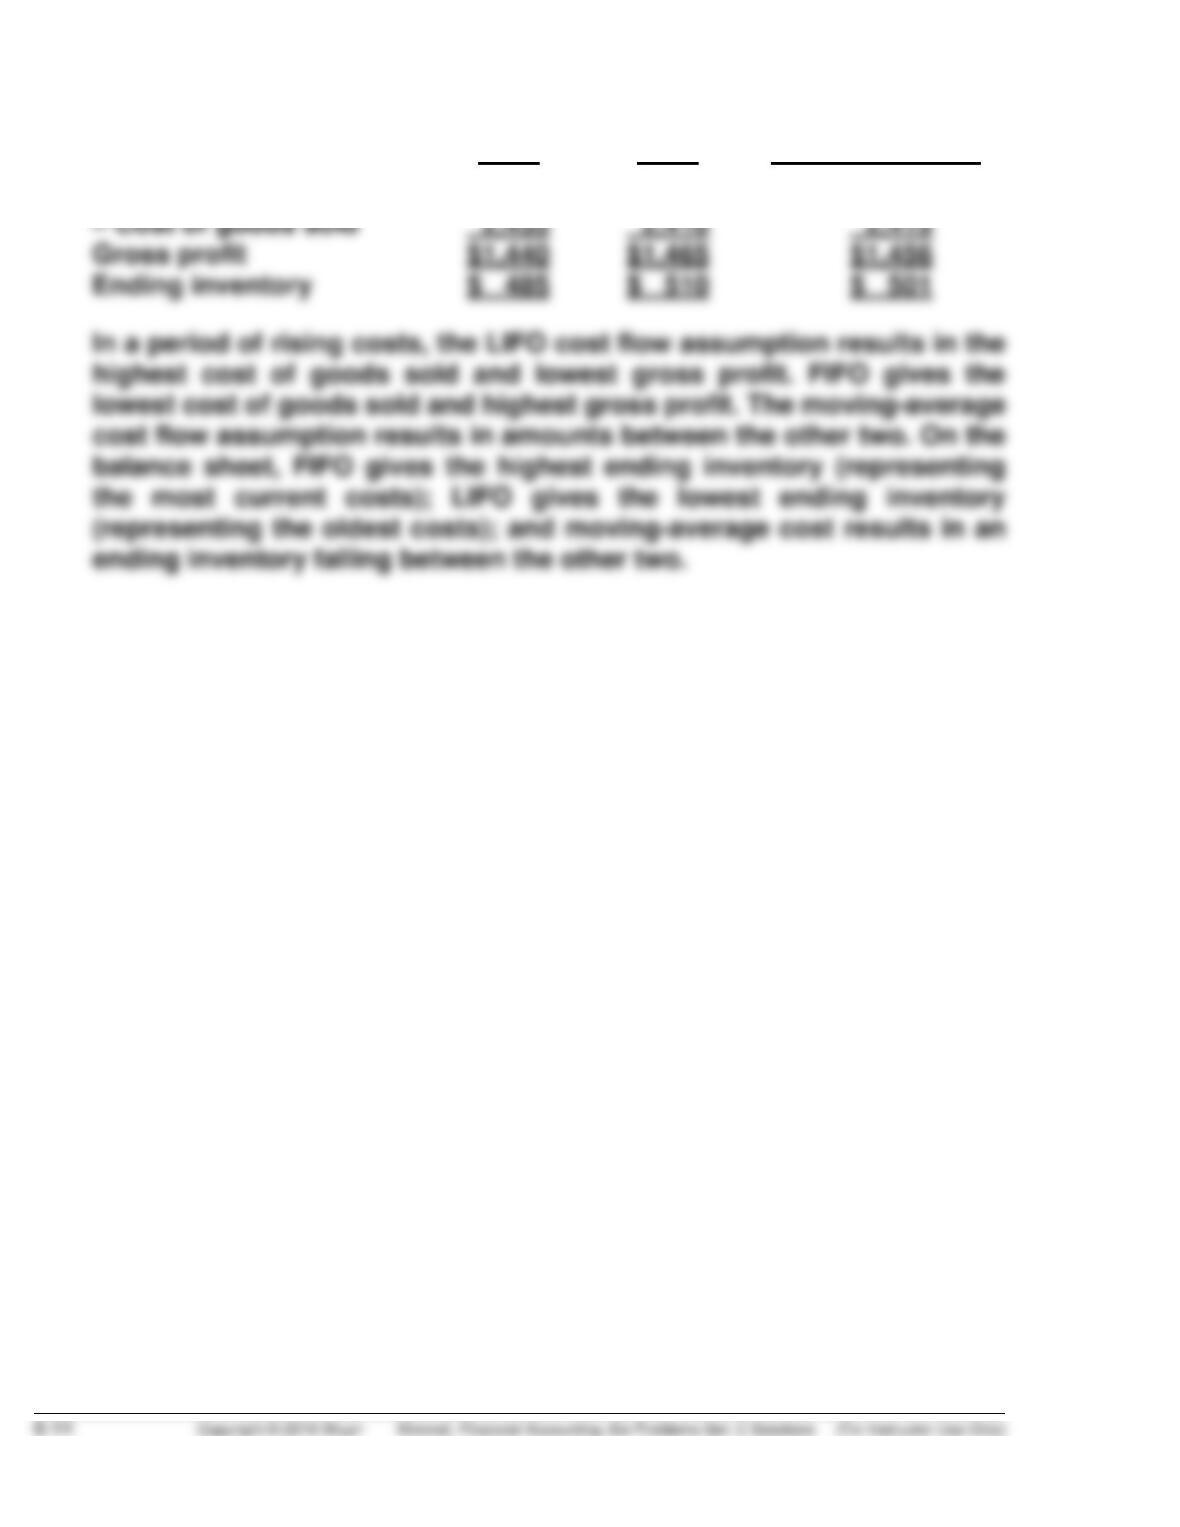
(b)
Gross profit:
LIFO
FIFO
Moving-Average
Sales
$3,875
$3,875
$3,875
*PROBLEM 6-9C
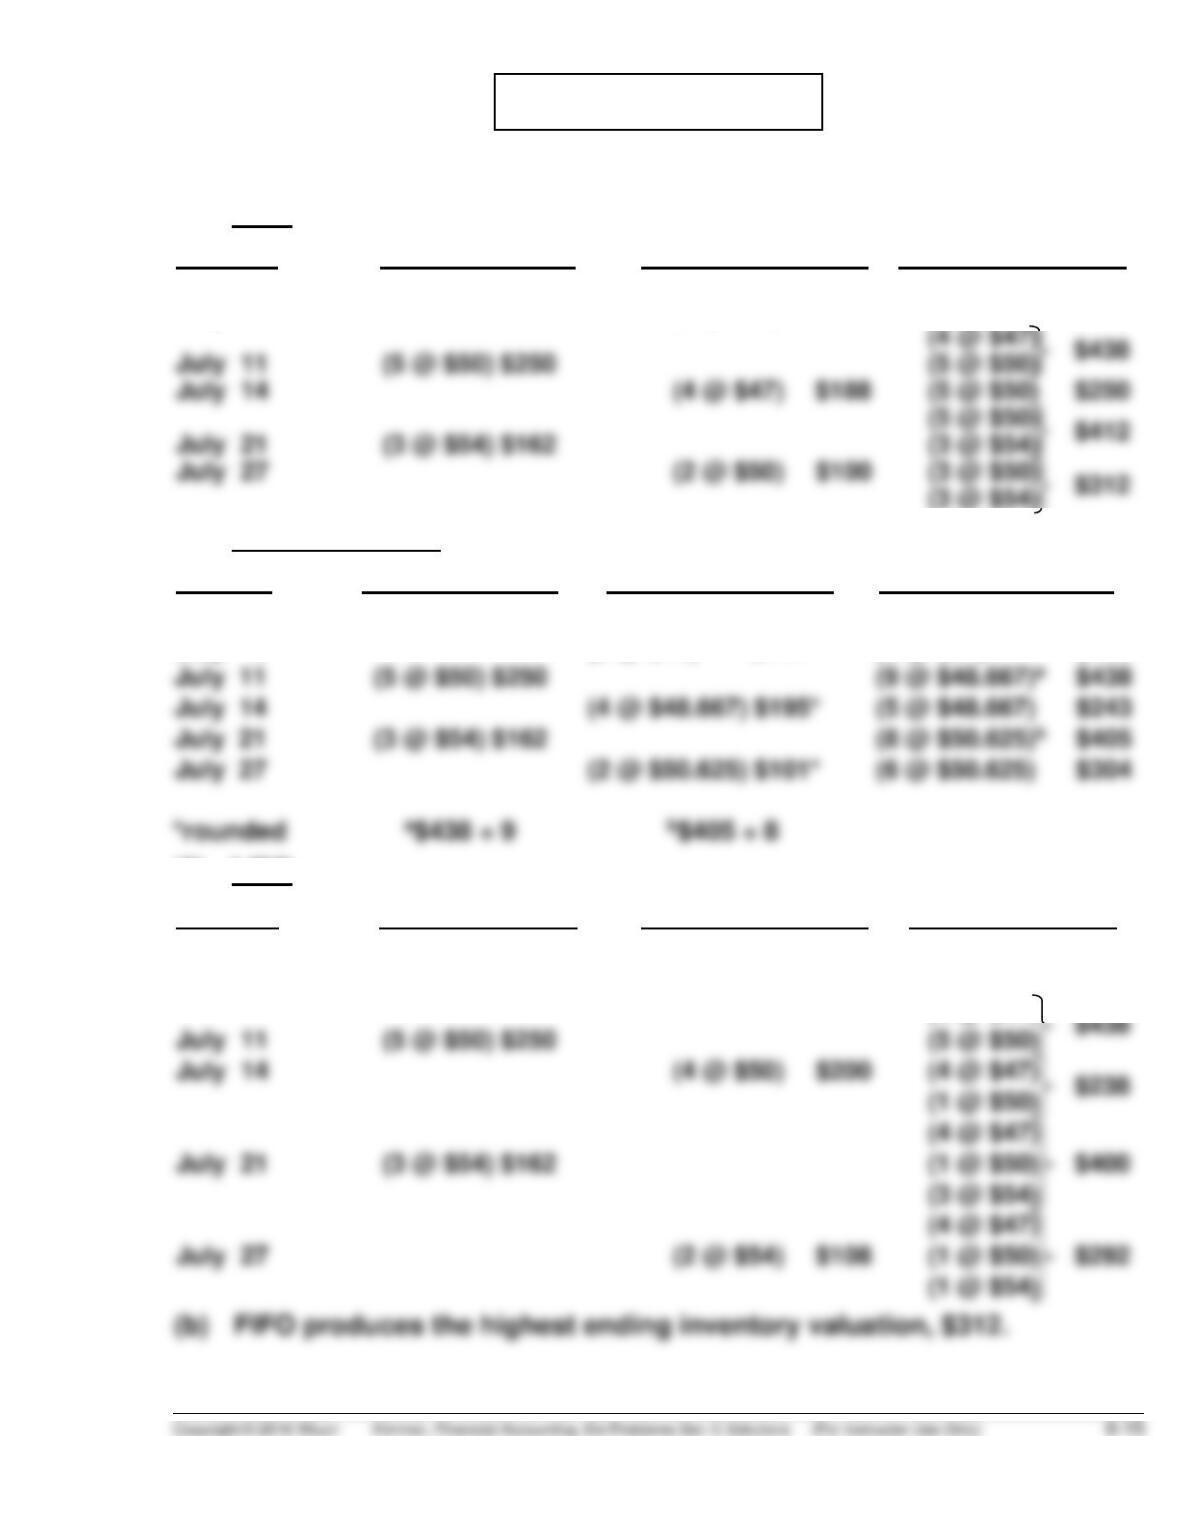
(a)
(1) FIFO
Date
Purchases
Cost of goods sold
Balance
July 1
(7 @ $47) $329
(7 @ $47)
$329
July 6
(3 @ $47)
$141
(4 @ $47)
$188
(2) Moving-Average
Date
Purchases
Cost of goods sold
Balance
July 1
(7 @ $47) $329
(7 @ $47)
$329
July 6
(3 @ $47) $141
(4 @ $47)
$188
(3) LIFO
Date
Purchases
Cost of goods sold
Balance
July 1
(7 @ $47) $329
(7 @ $47)
$329
July 6
(3 @ $47)
$141
(4 @ $47)
$188
(4 @ $47)


