
6e Specific Accounts Page 179 Chapter 6
ACTIVITY 55 CHAPTER 6 CROSSWORD PUZZLE
Across
3. Cost-flow assumption reporting recently purchased
6. Marketable Securities are _____ investments (2 words)
8. Valuing investments at the closing stock price (3 words)
11. Subtotal that is the first indication of profitability
(2 words)
17. Salvage value or scrap value or _____ value
22. AR _____ measures how quickly a company collects
amounts from customers
25. Keeping track of each inventory item purchased and
sold (2 words)
28. How long it takes to sell merchandise (2 words)
Down
1. Tangible long-term assets whose cost includes the
future is the _____ for Uncollectibles
9. Take uncollectible accounts receivable off the company
12. Physical currency (such as dollar bills, coins, etc.) and
bank deposits
depreciation
16. Measures the number of times a company sells its
average inventory level during the year (2 words)
less (2 words)
21. Historical cost is also referred to as _____ cost
26. Another companies’ stock or bond used to store excess
6e Specific Accounts Page 180 Chapter 6
ACTIVITY 56 CASH AND CASH EQUIVALENTS
Purpose: • Reinforce understanding of cash and cash equivalents.
ORACLE CORPORATION (ORCL)
($ in millions)
05/31/11
05/31/10
05/31/09
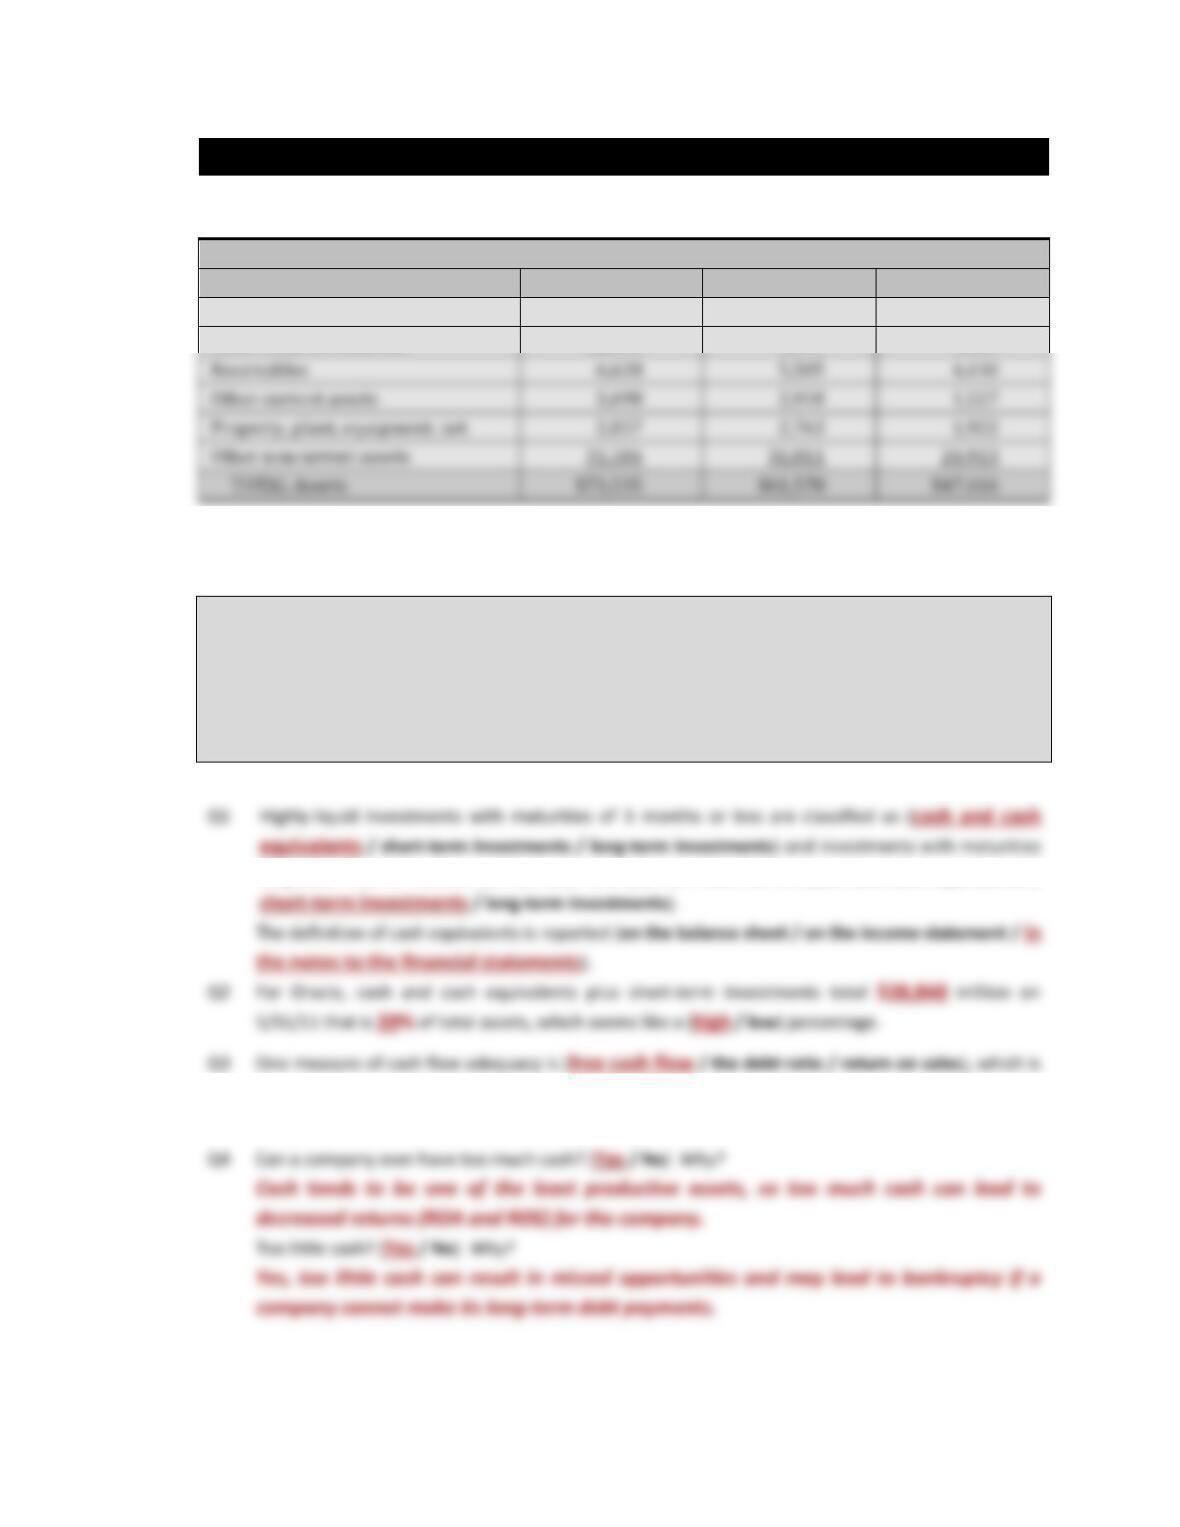
Cash and cash equivalents
$ 16,163
$ 9,914
$ 8,995
Short-term investments
12,685
8,555
3,629
NOTES to the Financial Statements.
A typical note regarding accounting policy for Cash, Cash Equivalents, and Short-term Investments reads:
Cash, Cash Equivalents, and Short-term Investments.
Cash and cash equivalents primarily consist of highly-liquid investments in time deposits and certificates
of deposit with original maturities of 3 months or less. Short-term investments, which include marketable
equity securities, time deposits, and government and corporate bonds with original maturities of greater
than 3 months but less than one year when purchased, are classified as available-for-sale and are
recorded at fair value using the specific identification method.
Refer to the information presented above to answer the following questions:
of greater than 3 months but less than one year are classified as (cash and cash equivalents /
the amount of cash available from operations after paying for planned investments in property,
plant, and equipment and dividends.
Receivables
6,628
5,585
4,430
Property, plant, equipment, net
2,857
2,763
1,922
Other noncurrent assets
31,504
31,811
26,913
TOTAL Assets
6e Specific Accounts Page 181 Chapter 6
ACTIVITY 57 SHORT–TERM INVESTMENTS
Purpose: • Reinforce understanding of amounts reported for short-term investments.
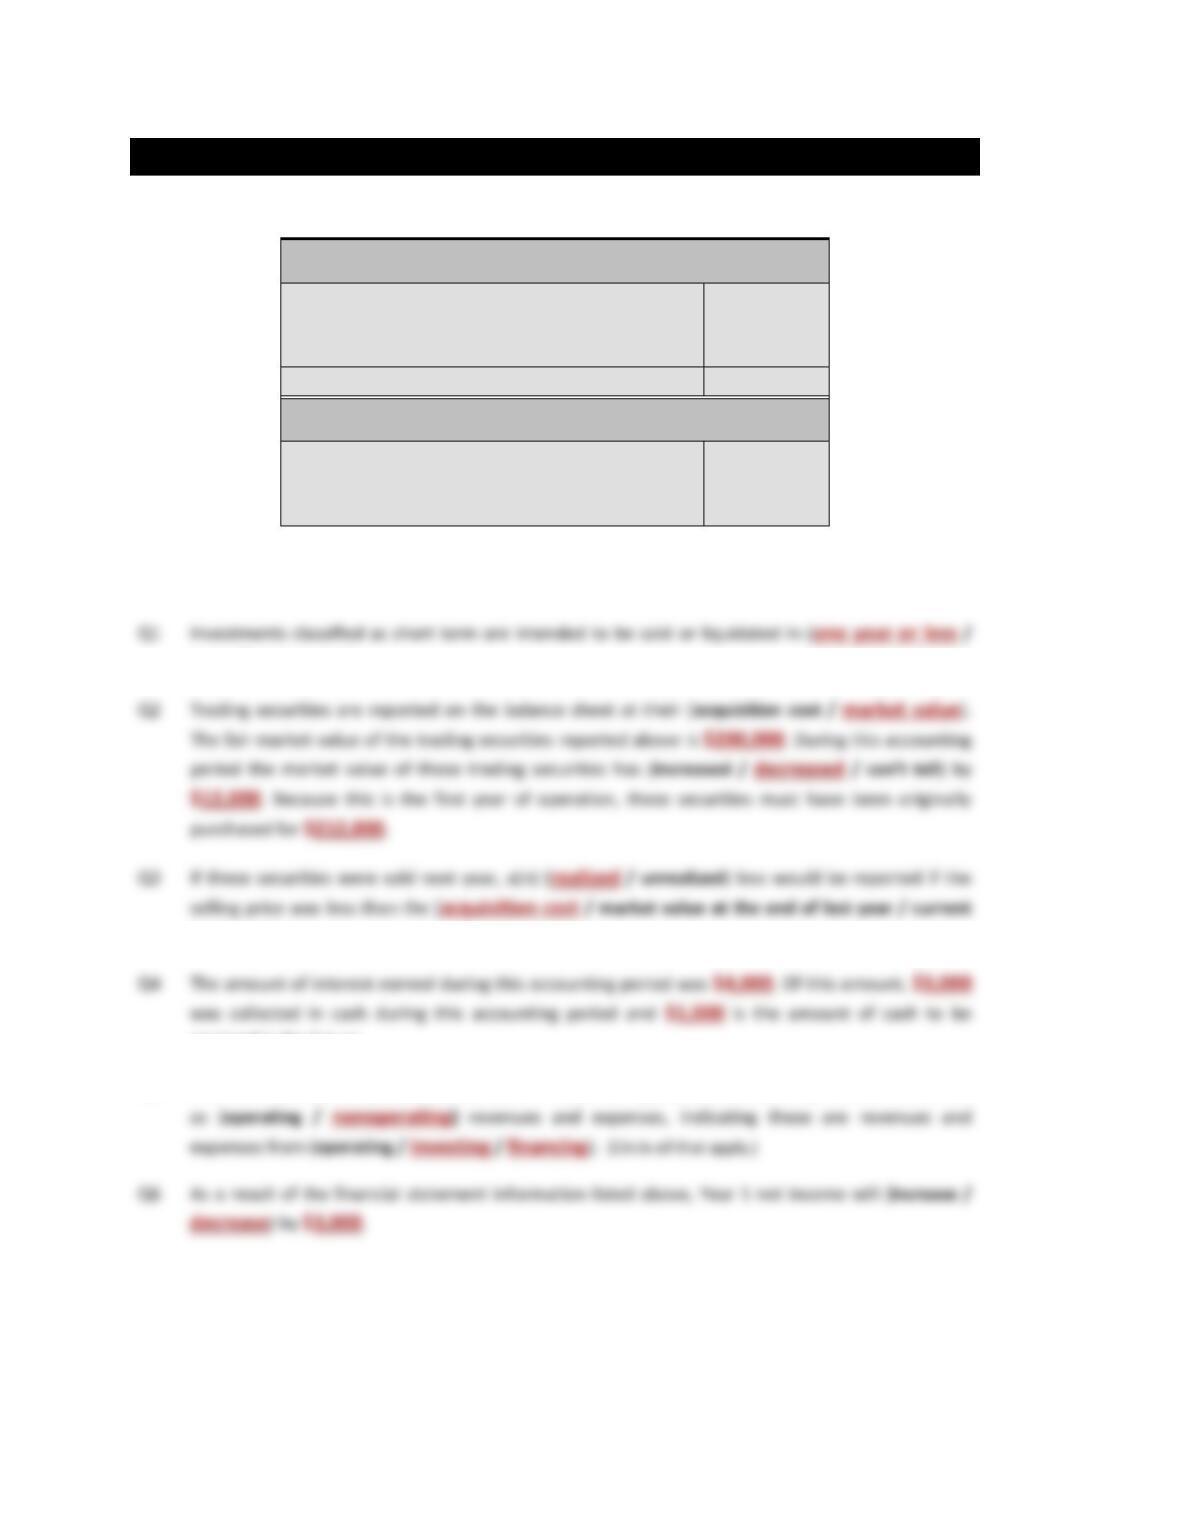
BALANCE SHEET ACCOUNTS—December 31, Year 1
Cash
$ 30,000
Short-term investments—Trading securities
200,000
Interest receivable
1,000
Total current assets
$ 231,000
INCOME STATEMENT ACCOUNTS—Year 1
Interest revenue
$ 4,000
Dividend revenue
5,000
Unrealized loss on trading securities
12,000
Refer to the information presented above to answer the following questions. Assume this is the first year
of operation.
more than one year).
market value).
received in the future.
Q5 The income statement accounts listed above would be reported on a multi-step income statement
6e Specific Accounts Page 182 Chapter 6
ACTIVITY 58 ACCOUNTS RECEIVABLE
Purpose: • Reinforce understanding of amounts reported on the financial statements for
accounts receivable.
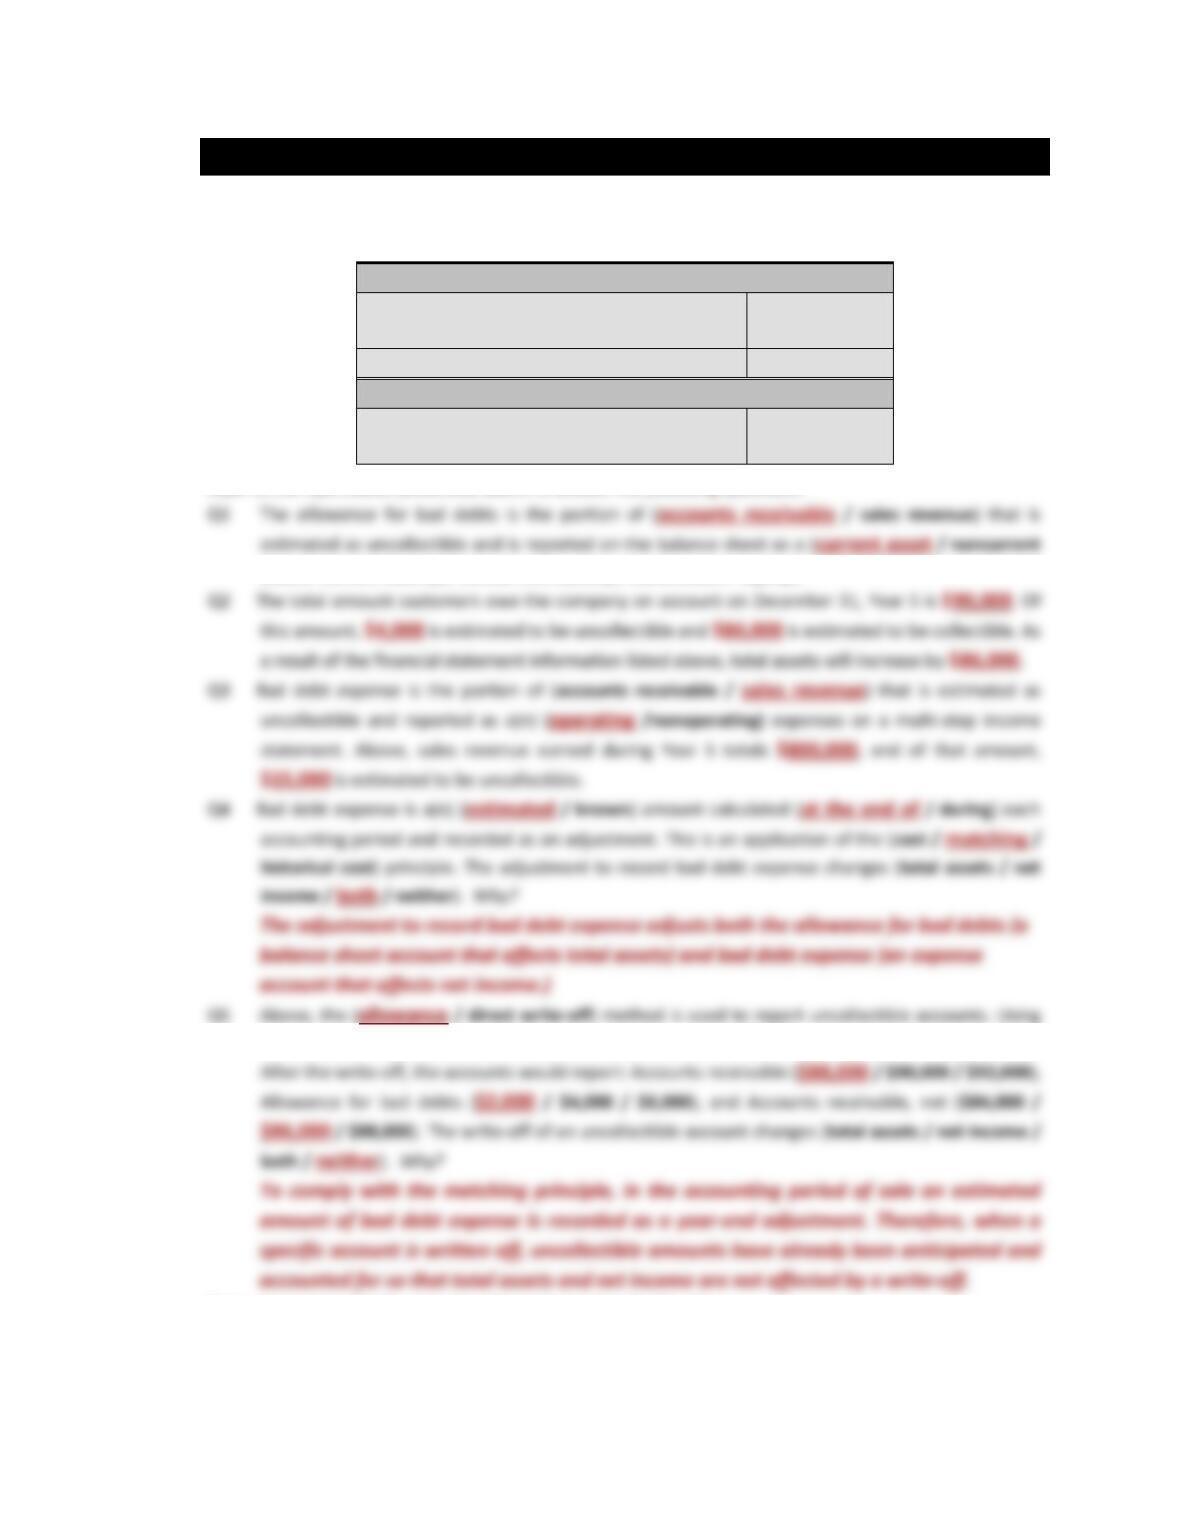
BALANCE SHEET ACCOUNTS—December 31, Year 5
Accounts receivable
$ 90,000
Allowance for bad debts
(4,000)
Accounts receivable, net
86,000
INCOME STATEMENT ACCOUNTS—Year 5
Sales revenue
$ 800,000
Bad debt expense
15,000
Refer to the information presented above to answer the following questions:
asset / current liability / noncurrent liability / stockholders’ equity).
the above amounts, assume that $2,000 owed by Customer Ryan was written off as uncollectible.
Note: Accounts receivable, net is also referred to as net realizable value.
Bad debt expense is also referred to as doubtful-account expense or uncollectible account expense.
Nonoperating revenues and expenses are also referred to as other gains and losses.
6e Specific Accounts Page 183 Chapter 6
ACTIVITY 59 EVALUATING ACCOUNTS RECEIVABLE
Purpose: • Analyze trends in Accounts Receivable and the Allowance for Bad Debt accounts.
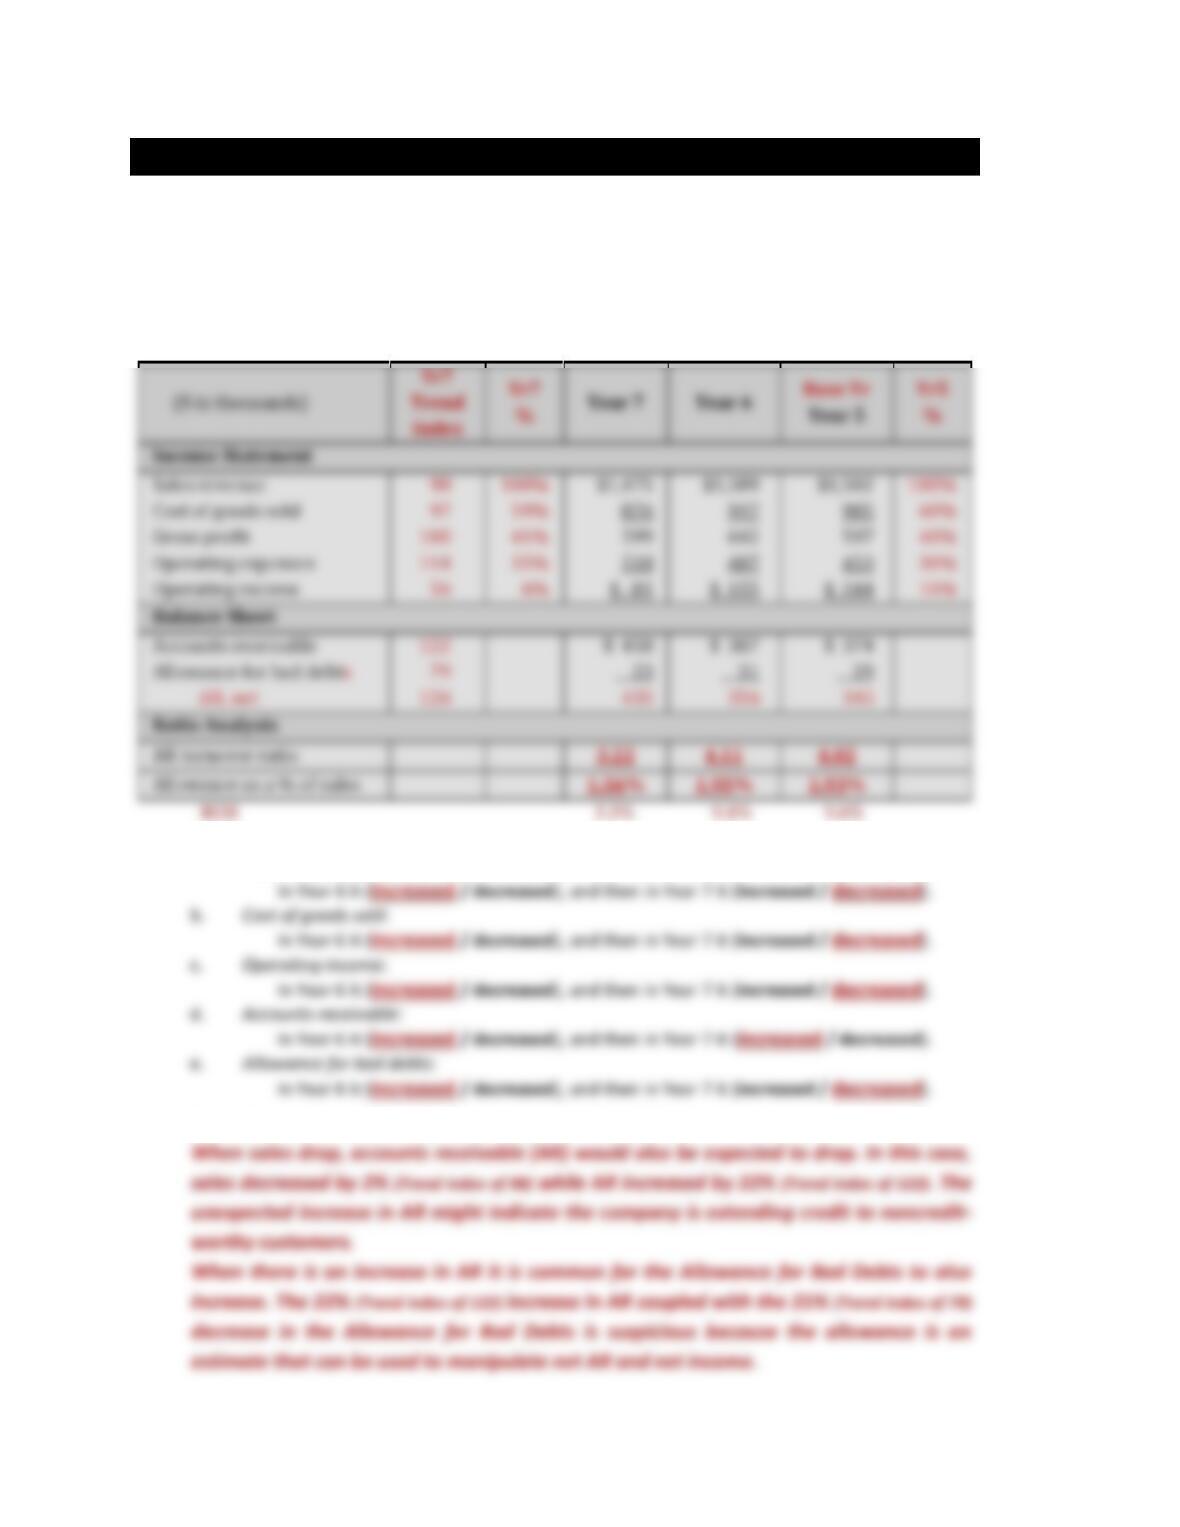
Assume you work in the corporate loan office of Lanford Bank. Chris Ives, owner of CI Manufacturing, Inc.
has come to you seeking a loan of $350,000 for new manufacturing equipment to expand his operations.
He proposes to use his accounts receivable as collateral for the loan and has provided you with the
following financial statements.
Q1 Examine the trend in each of the following accounts.
a. Sales revenue:
f. Comment on any unexpected or suspicious observations.
6e Specific Accounts Page 184 Chapter 6
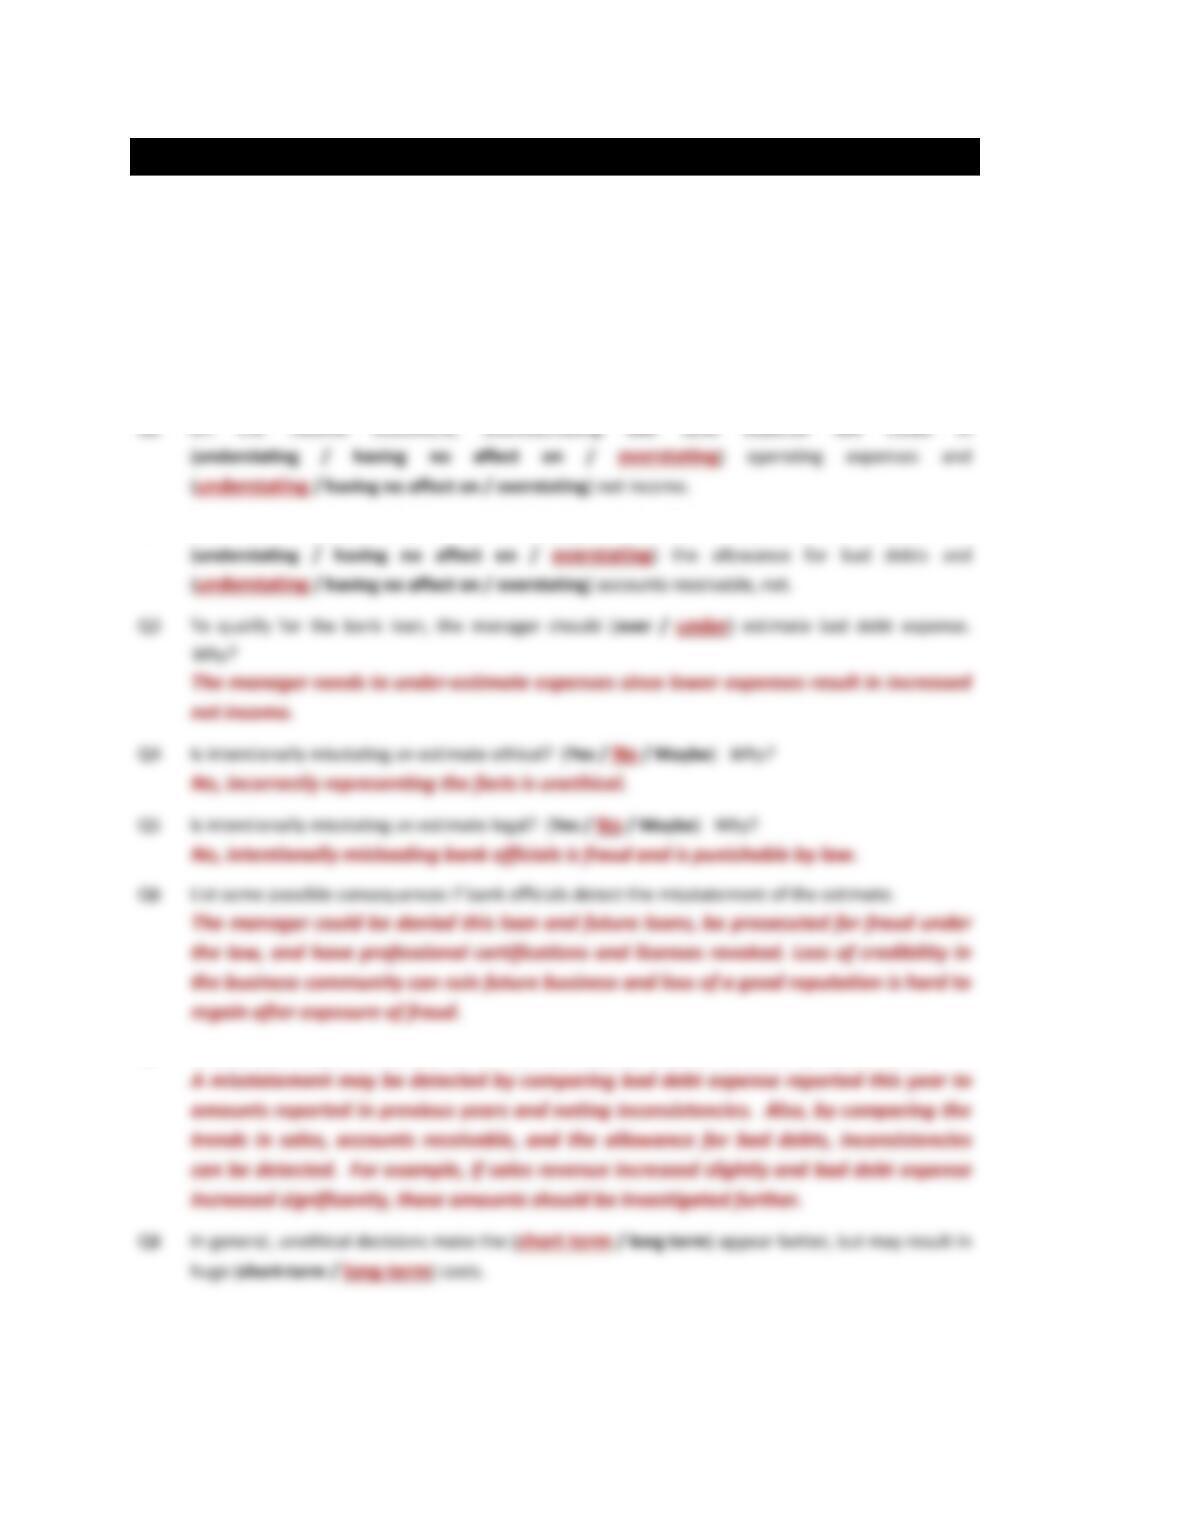
Q2 Compute the Accounts Receivable Turnover ratio and the Allowance as a Percentage of Sales ratio
If not, what additional information would you request before granting a loan? Explain.
6e Specific Accounts Page 185 Chapter 6
ACTIVITY 60 ETHICS AFFECTING FINANCIAL STATEMENT AMOUNTS
Purpose: • Understand the effect ethical decisions have on amounts reported for accounts
receivable.
A manager of a small electronics store would like to expand and also sell computers. The expansion would
require seeking a loan from a local bank. The manager knows net income for this year is lower than what
is needed to qualify for additional financing at his current bank. The manager also realizes some of the
estimates used to calculate net income could be adjusted to make net income come within the qualifying
range for an additional loan.
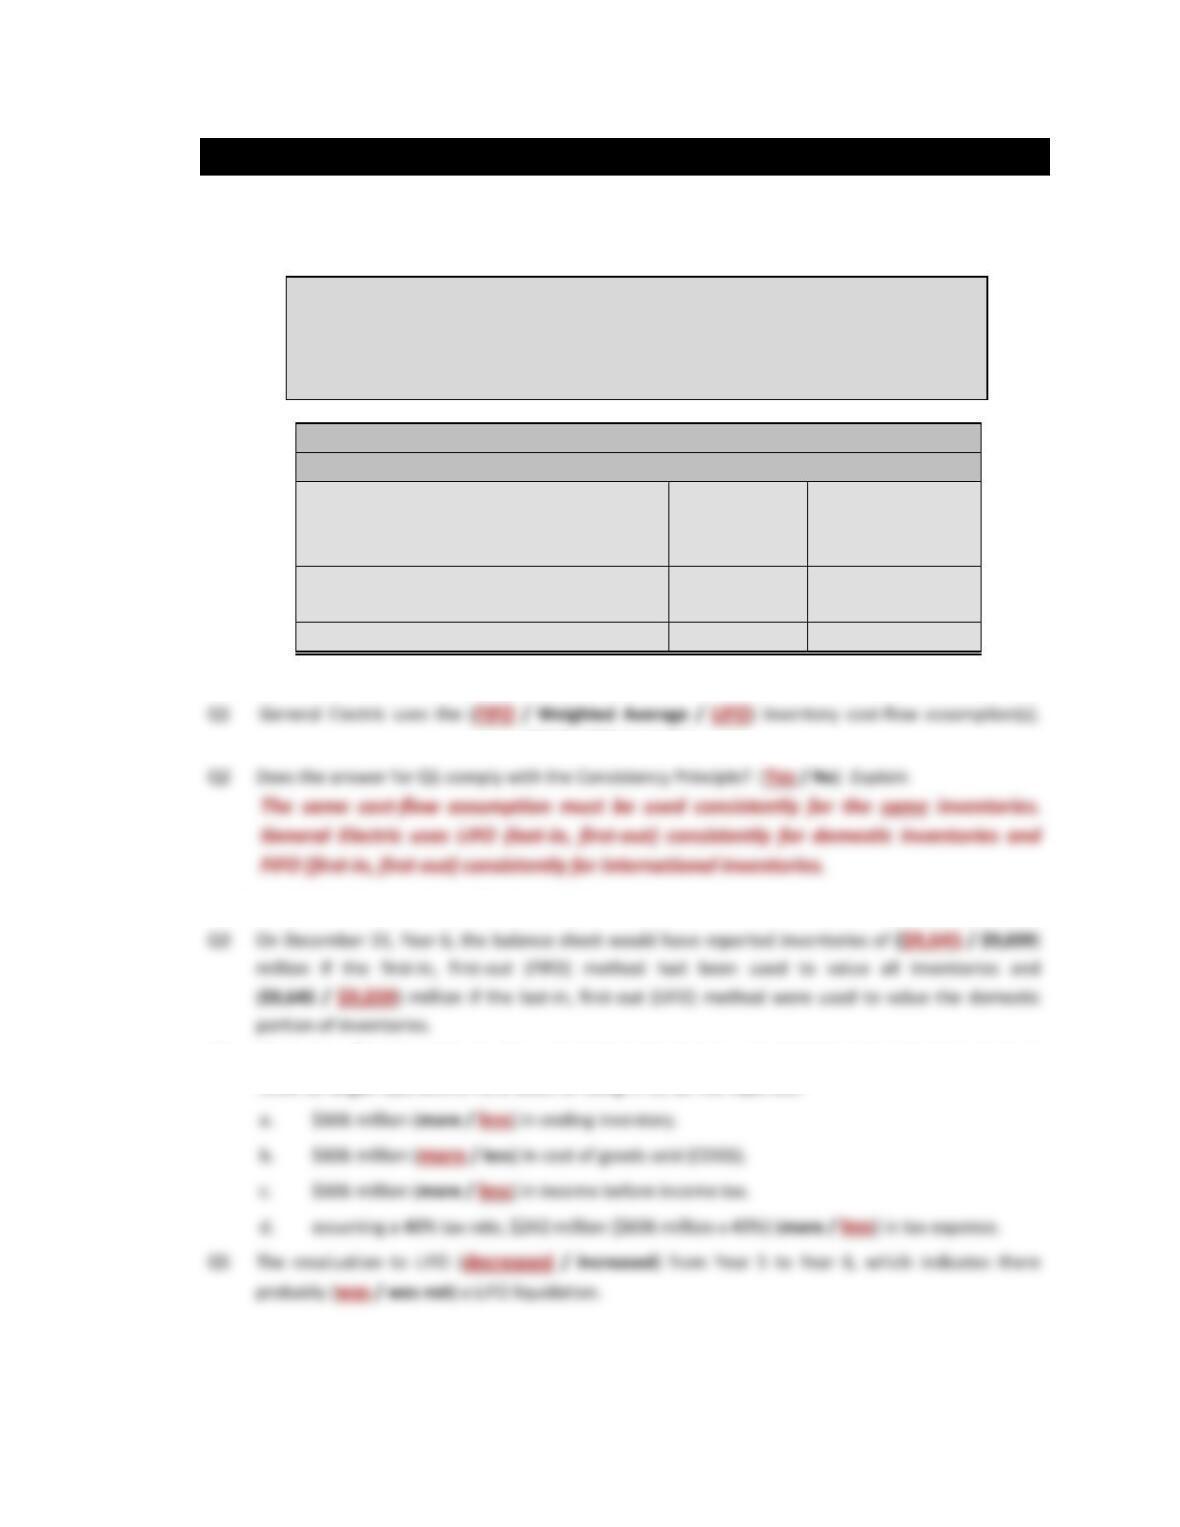
Q2 On the balance sheet, overestimating bad debt expense will result in
Q7 Discuss some ways the misstatement of bad debt expense could be detected by bank officials.
6e Specific Accounts Page 186 Chapter 6
ACTIVITY 61 INVENTORY
Purpose: • Reinforce understanding of amounts reported for inventory from using different
cost-flow assumption; LIFO or FIFO.
GENERAL ELECTRIC COMPANY (GE)
Note 1: Summary of Significant Accounting Policies Inventories.
All inventories are stated at the lower of cost or realizable values. Cost for
substantially all of GE’s U.S. inventories is determined on a last-in, first-out (LIFO)
basis. Cost of other GE inventories is primarily determined on a first-in, first-out (FIFO)
basis.
Note 11: GE Inventories (Adapted)
($ in millions) December 31,
Year 6
Year 5
Raw material and work in process
$4,894
$4,708
Finished goods
4,379
3,951
Unbilled shipments
372
312
9,645
8,971
Less revaluation to LIFO
(606)
(676)
$9,039
$8,295
Refer to Note 1 above to answer Q1 and Q2.
(Circle all that apply.)
Refer to Note 11 above to answer Q3 through Q7.
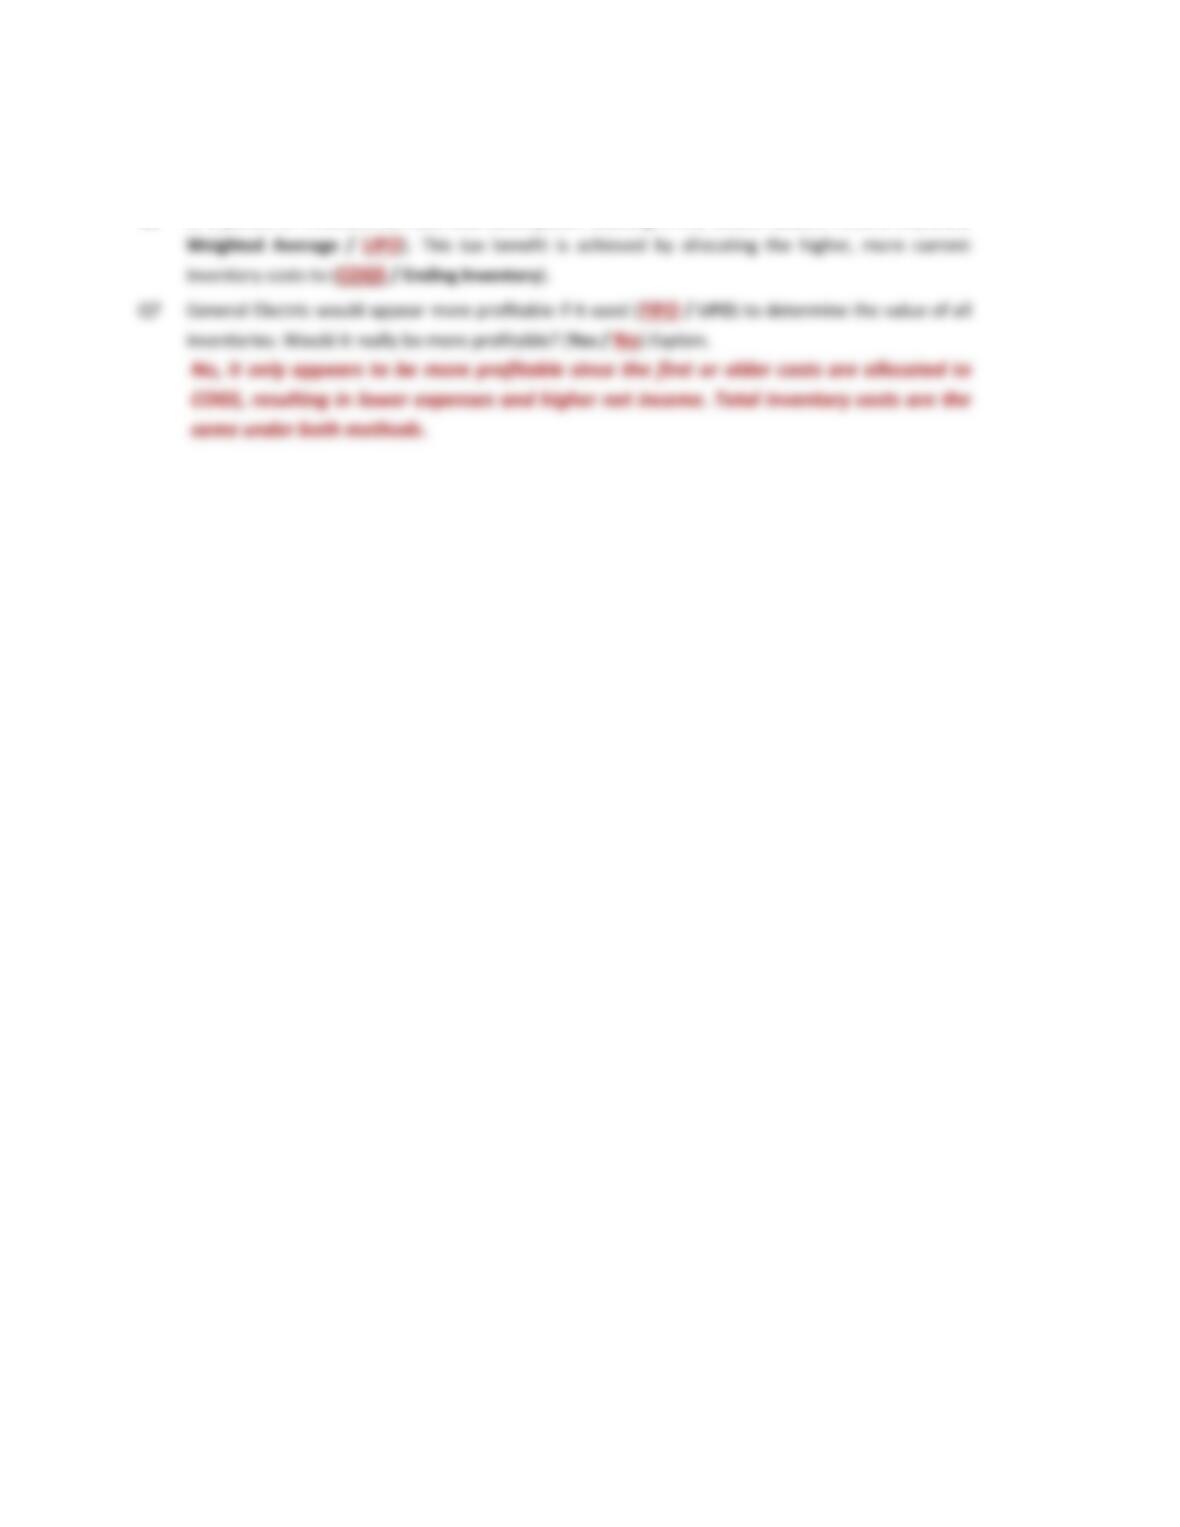
Q4 Circle the effect the LIFO cost-flow assumption has had on reported financial statement amounts
since GE began operations. As a result of using LIFO, GE has reported:
6e Specific Accounts Page 187 Chapter 6
Q6 In a period of inflation, the cost-flow assumption resulting in the lowest taxable income is (FIFO /
6e Specific Accounts Page 188 Chapter 6
ACTIVITY 62 INVENTORY: LIFO AND FIFO CALCULATIONS
Purpose: • Compute COGS and Ending Inventory when using the LIFO and FIFO cost-flow
assumptions.
At the end of the accounting period inventory costs must be assigned to either cost of goods sold or
ending inventory so the financial statements can be prepared.
The specific identification inventory method tracks when each inventory item is purchased and sold. This
method is used when dealing with unique and expensive inventory items such as jewelry, custom-built
homes, or automobiles.
Many times tracking individual units is not cost effective, and GAAP allows companies to select an
inventory cost-flow assumption to allocate costs between cost of goods sold and ending inventory. In a
craft store, imagine trying to track when each wooden bead or Styrofoam cone is purchased and then
sold.
Two commonly used cost-flow assumptions are first-in, first-out (FIFO) and last-in, first-out (LIFO). FIFO
assumes the first units purchased are the first units sold during the accounting period, whereas LIFO
assumes the last units purchased are the first units sold during the accounting period.
Use the information in the chart immediately below to answer the following questions.
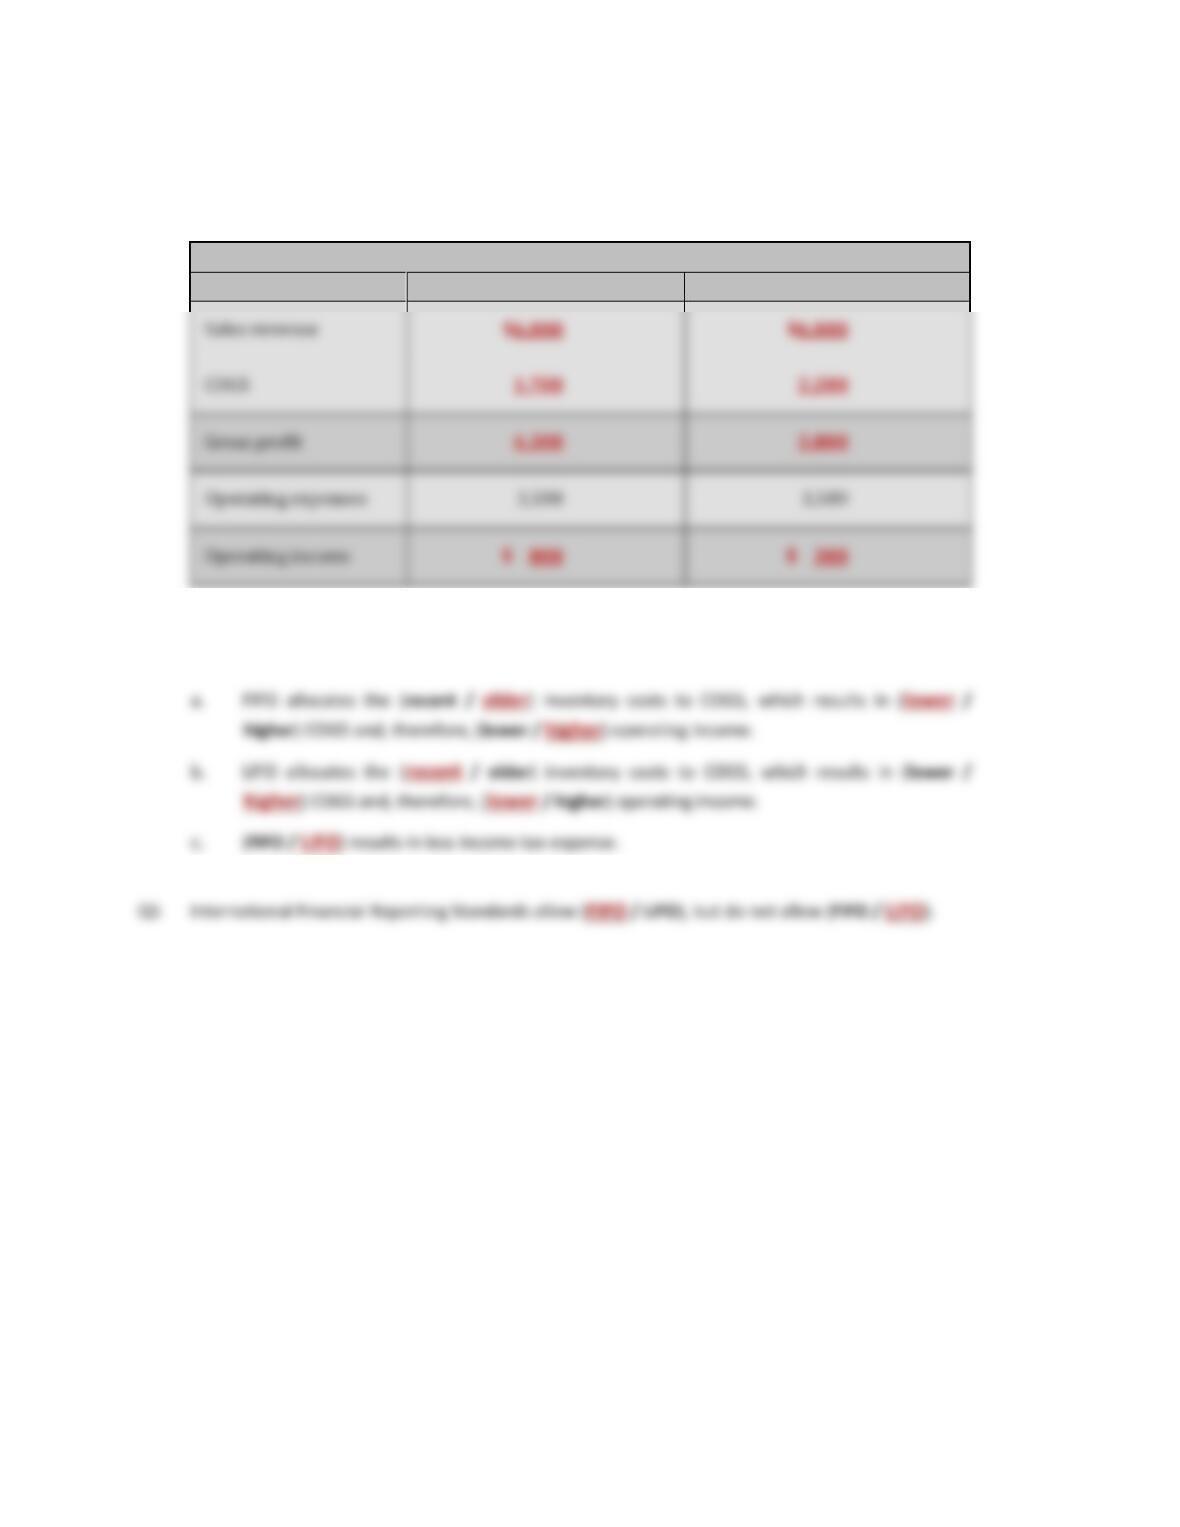
Jan 1 Beg inventory
20 units @ $20 per unit =
$ 400
Q1 Assume 60 units were sold. Using FIFO and LIFO, calculate the cost allocated to cost of goods sold
(COGS) and ending inventory in the space provided below.
FIFO
LIFO
Q2 Examine the results above. In a period of inflation:
6e Specific Accounts Page 189 Chapter 6
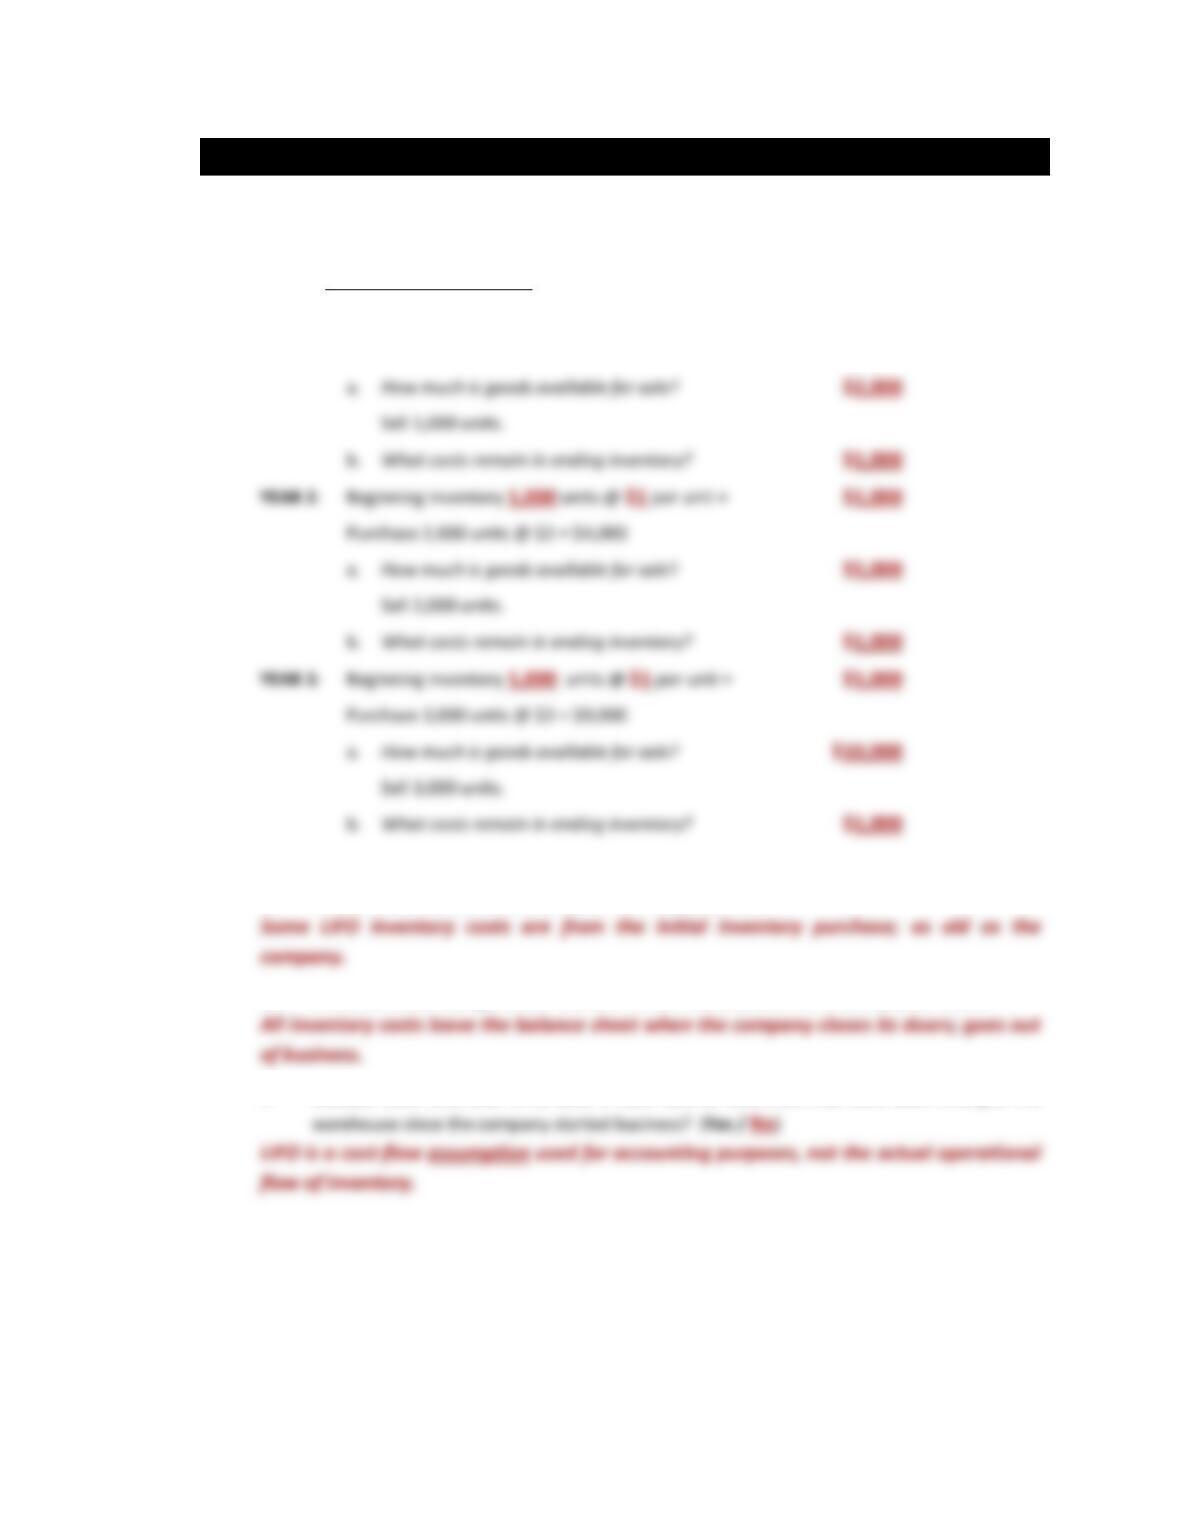
Q3 Assume the 60 units in Q1 sold for $100 each and operating expenses total $3,500. Using FIFO and
LIFO, complete the income statement in the space provided below.
INCOME STATEMENT—Sell 60 units for $100 each
FIFO
LIFO
Q4 Examine the income statement above. In a period of inflation:
6e Specific Accounts Page 190 Chapter 6
ACTIVITY 63 INVENTORY: THE EFFECTS OF LIFO
Purpose: • Understand if recent or older costs are allocated to the income statement or the
balance sheet when using LIFO and FIFO.
Q1 Use the LIFO cost-flow assumption to answer the following questions.
YEAR 1: Purchase #1 1,000 units @ $1 = $1,000
Purchase #2 1,000 units @ $1 = $1,000
Q2 The Coca-Cola Company is more than 100 years old. Coca-Cola uses the LIFO cost-flow assumption.
a. So how old are those inventory costs on the balance sheet?
b. When will Coca–Cola get those “ancient” LIFO inventory costs off of the balance sheet?
c. Because Coca-Cola uses LIFO, does it have cans of Coca-Cola that have been sitting in the
6e Specific Accounts Page 191 Chapter 6
Q3 Summarize the effects of using the FIFO and LIFO cost-flow assumptions on COGS and Ending
Inventory by circling the type of costs allocated to each below.
FIFO
LIFO
Why would a company want to do this?
6e Specific Accounts Page 192 Chapter 6
ACTIVITY 64 GROSS PROFIT MARGIN
Purpose: • Understanding that gross profit margin, ROS, and inventory turnover ratios vary by
industry.
The gross profit margin (GP%) compares gross profit to sales revenue. It expresses gross profit as a
percentage of sales. This ratio is the first measure of profitability reported on the income statement.
GROSS PROFIT MARGIN =
Gross profit
Sales revenue
Q1 Guess the GP% and ROS for each of the following companies:
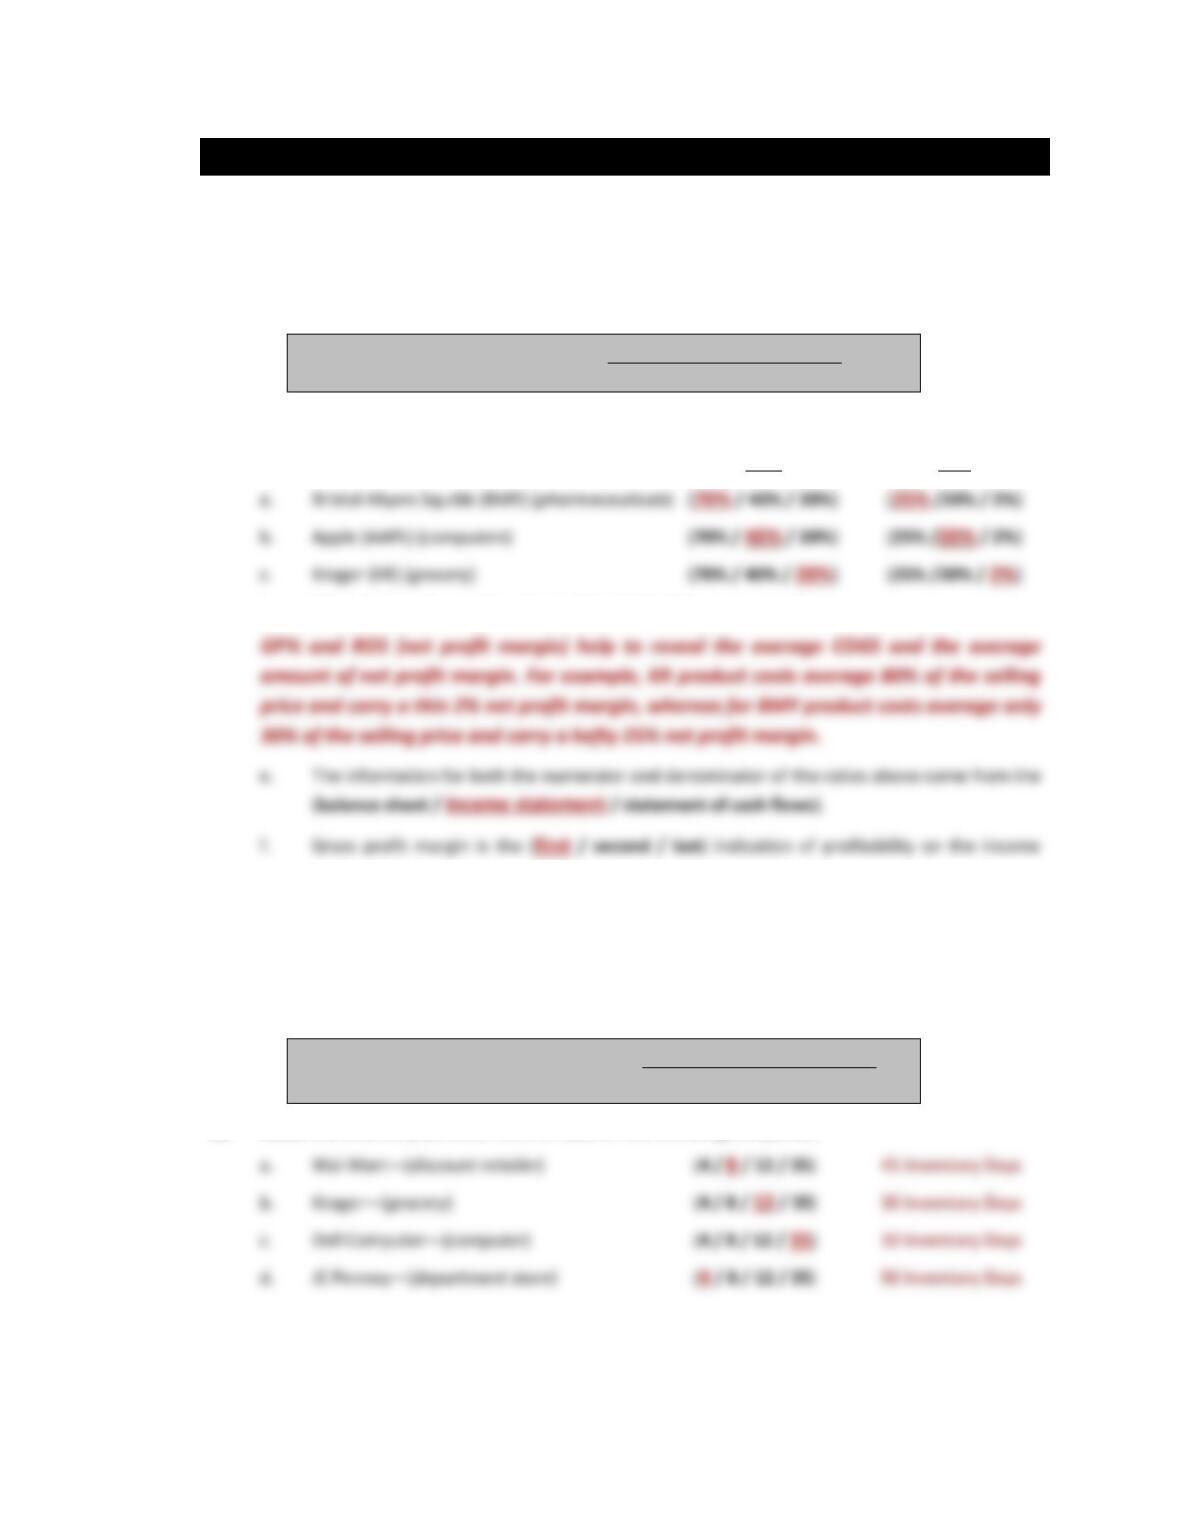
GP% ROS
d. What do the above ratios reveal about each of the companies?
statement.
INVENTORY TURNOVER RATIO
The inventory turnover ratio indicates the number of times a company sells its average inventory level
during the year. It measures how efficiently a company uses its investment in inventory. It is a measure of
efficiency.
INVENTORY TURNOVER RATIO =
Cost of goods sold
Inventory
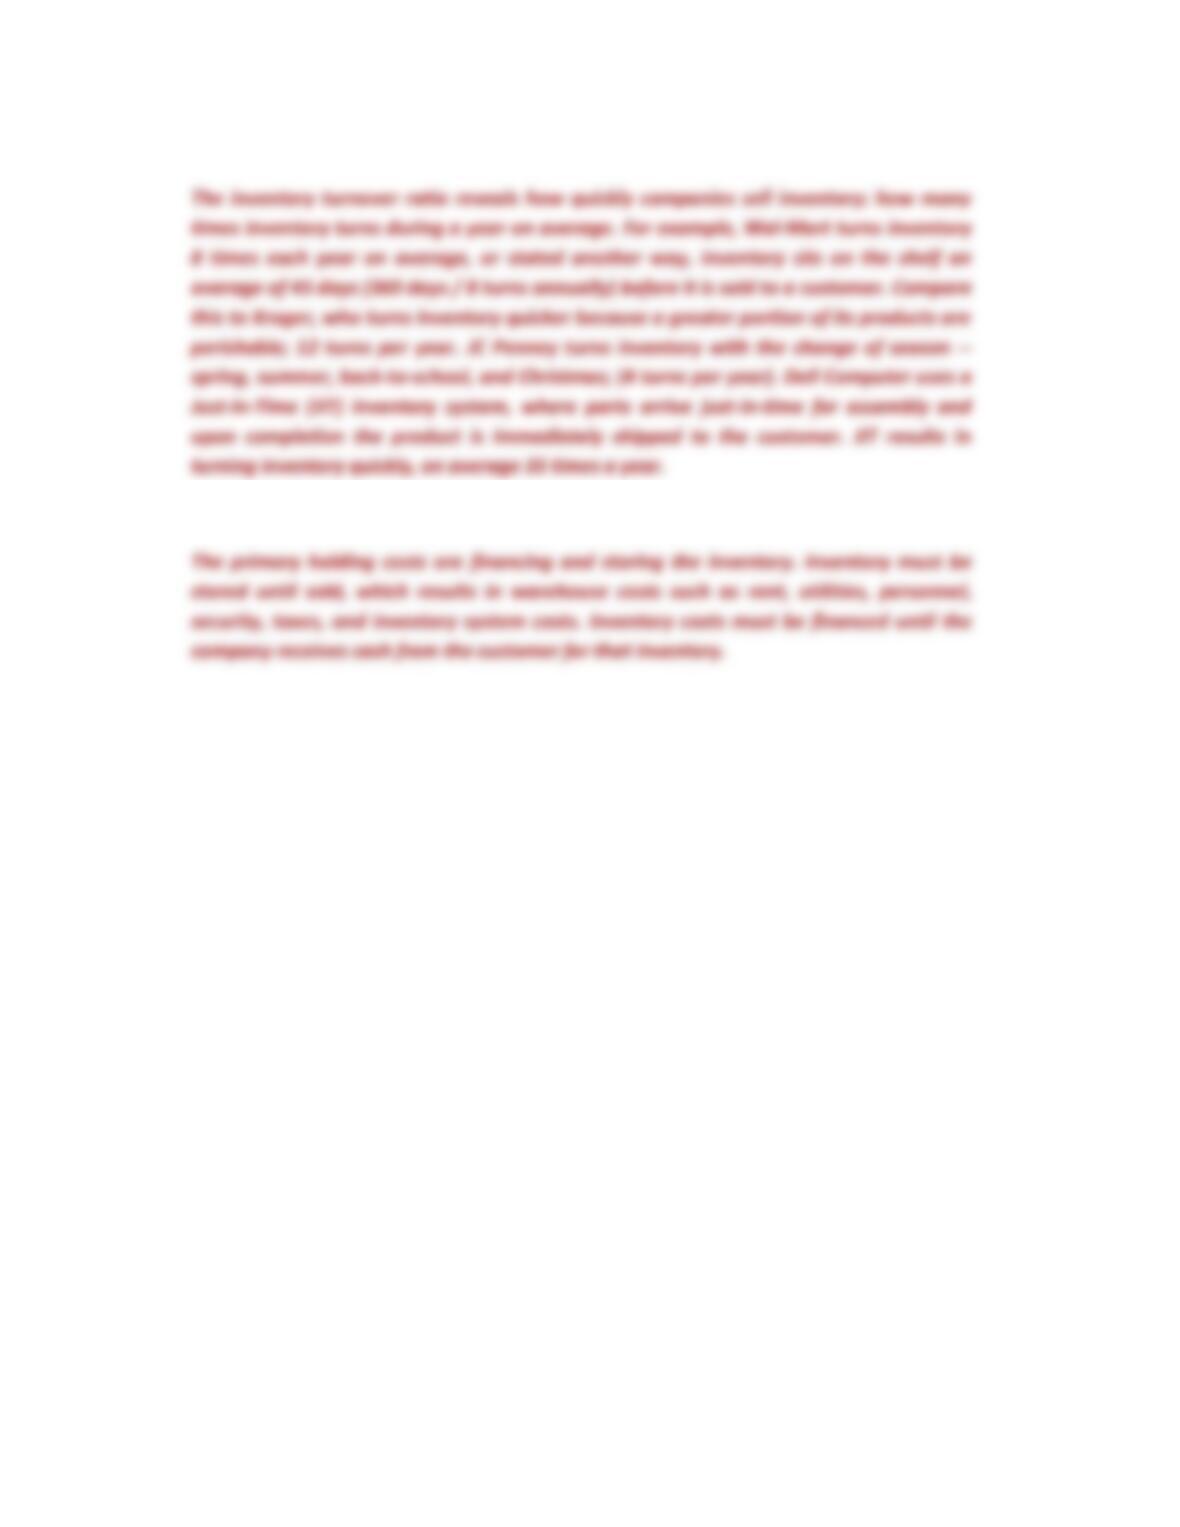
Q2 Guess the inventory turnover ratio for each of the following companies:
6e Specific Accounts Page 193 Chapter 6
Q3 What does the inventory turnover ratio reveal about each of the companies?
Q4 What are some of the costs of holding inventory?
6e Specific Accounts Page 194 Chapter 6
ACTIVITY 65 ETHICS AFFECTING FINANCIAL STATEMENT AMOUNTS
Purpose: • Understand the effect ethical decisions have on amounts reported for inventory.
A manager of a men’s clothing store receives a bonus based on the amount of gross profit earned by the
department. This year the manager is only two thousand dollars short from qualifying for a sizable year–
end bonus. The manager is in a position to have a portion of the inventory counted twice in the year-end
physical inventory count. Cost of goods sold is adjusted for any changes to year-end inventory.
Q1 On the balance sheet, double counting a portion of ending inventory will result in
Q2 On the income statement, double counting a portion of ending inventory will result in
thousand dollars of ending inventory.
Why?
Q6 List some possible consequences if upper management detects double counting of ending
inventory.
Q7 Discuss some ways the double counting of inventory could be detected by management.
6e Specific Accounts Page 195 Chapter 6
ACTIVITY 66 PROPERTY, PLANT, AND EQUIPMENT
Purpose: • Reinforce understanding of property, plant, and equipment amounts reported on the
financial statements.
BALANCE SHEET ACCOUNTS—12/31/Year 5
Equipment
$ 400,000
Accumulated depreciation
(150,000)
Book value
$ 250,000
INCOME STATEMENT ACCOUNTS—Year 5
Depreciation expense
$ (50,000)
Gain on sale of equipment
7,000
Loss on sale of land
(3,000)
Refer to the financial statement information presented above to answer the following questions.
Q1 The amount originally paid (acquisition cost) to purchase the equipment was $400,000, which was
capitalized and recorded as a(n) (noncurrent asset / expense).
6e Specific Accounts Page 196 Chapter 6
ACTIVITY 67 PPE: STRAIGHT–LINE DEPRECIATION
Purpose: • Compute depreciation using the straight-line method.
• Understand what amounts are reported for depreciation on the financial statements.
Property, Plant, and Equipment = PPE = fixed assets = capital assets
Acquisition Cost = Original cost = Historical cost = The amount reported as the acquisition cost of PPE
includes all costs to make the asset operational including purchase, delivery, and set-up costs.
Residual Value = salvage value = scrap value
The estimated value of the asset at the end of the estimated useful life.
Depreciable Base = Acquisition Cost – Residual Value
Depreciation is the allocation of the Depreciable Base over the expected useful life of the asset. Two
widely used depreciation methods include straight-line (SL) and double-declining balance (DDB). Straight-
Line (SL) depreciation allocates an equal amount of expense to each year of the asset’s expected useful
life. Double-Declining-Balance (DDB) depreciation is an accelerated method, which allocates more
expense to the early years of the asset’s useful life.
Accumulated Depreciation is the total amount of depreciation expensed since acquisition.
Book value = Acquisition Cost minus Accumulated Depreciation
= Carrying value = PPE, net = Cost not yet depreciated
= Amount reported on the balance sheet and added to arrive at total assets
STRAIGHT-LINE DEPRECIATION
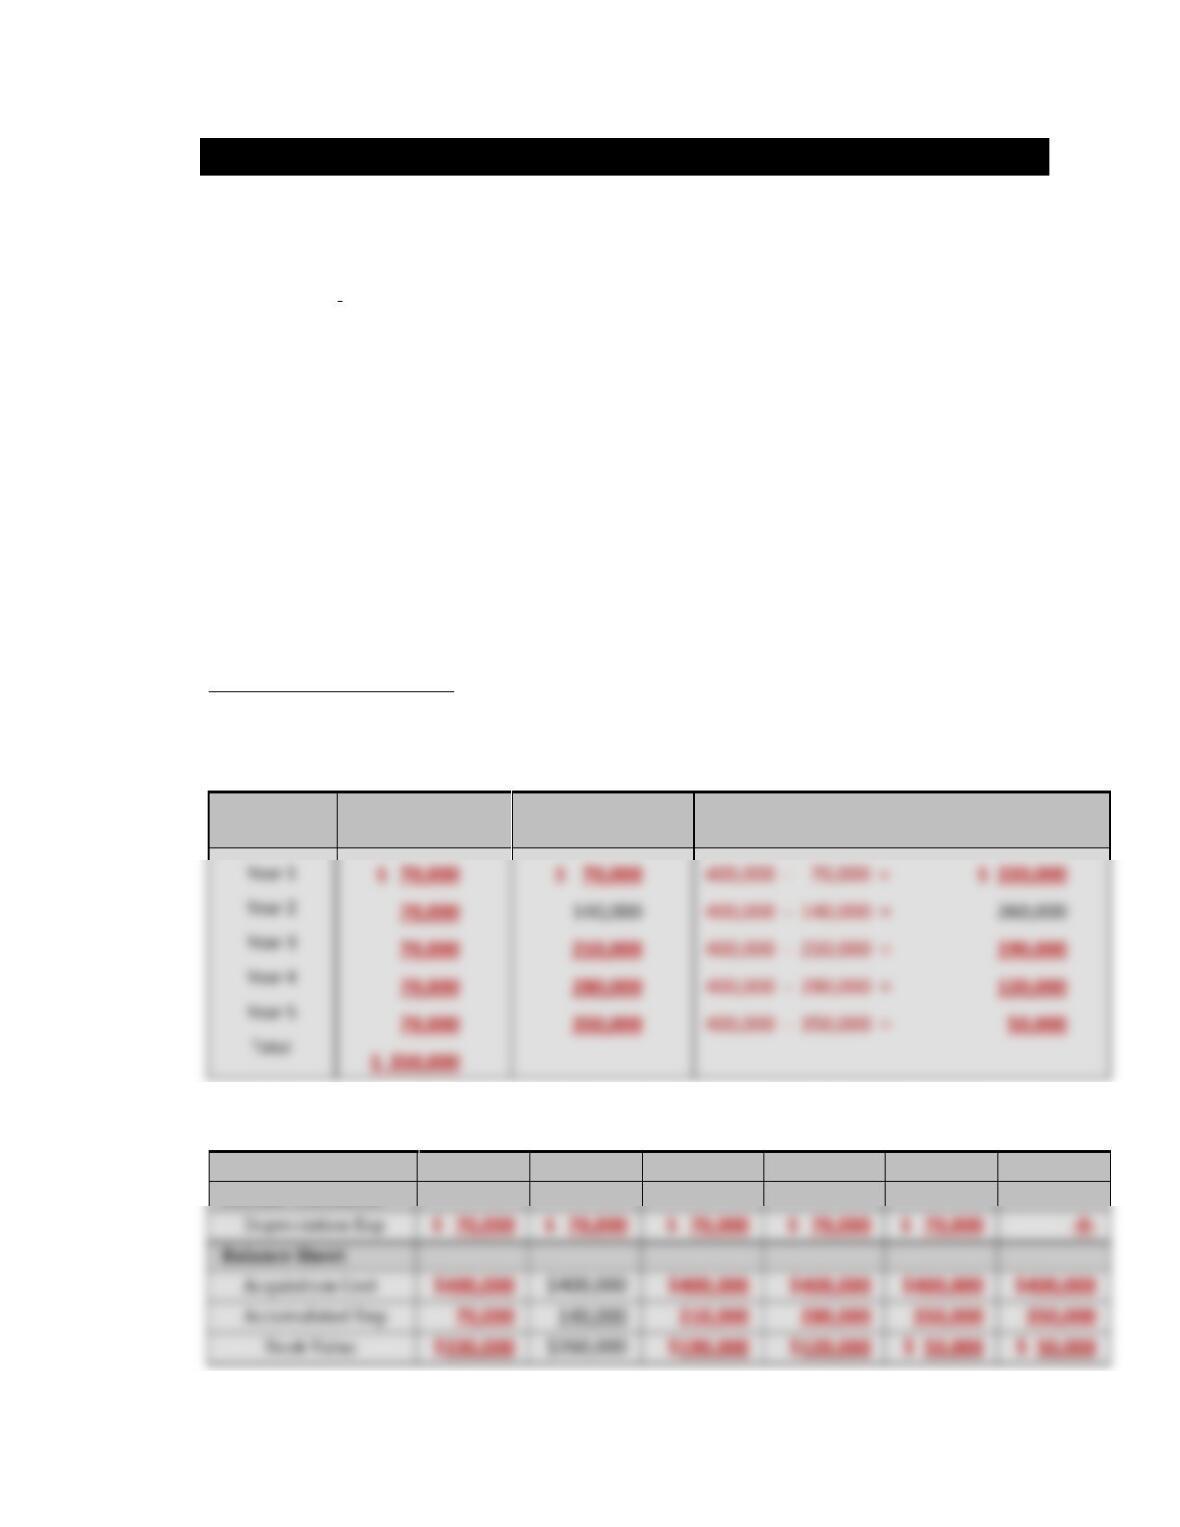
Q1 Equipment costing $400,000 has an estimated useful life of five years and a residual value of
$50,000. Record depreciation expense, accumulated depreciation, and book value in the chart
below for each year of the five-year useful life using the straight-line method of depreciation.
SL
Depreciation
Expense
Accumulated
Depreciation
Book Value
(Acquisition Cost – Acc Dep = Book Value)
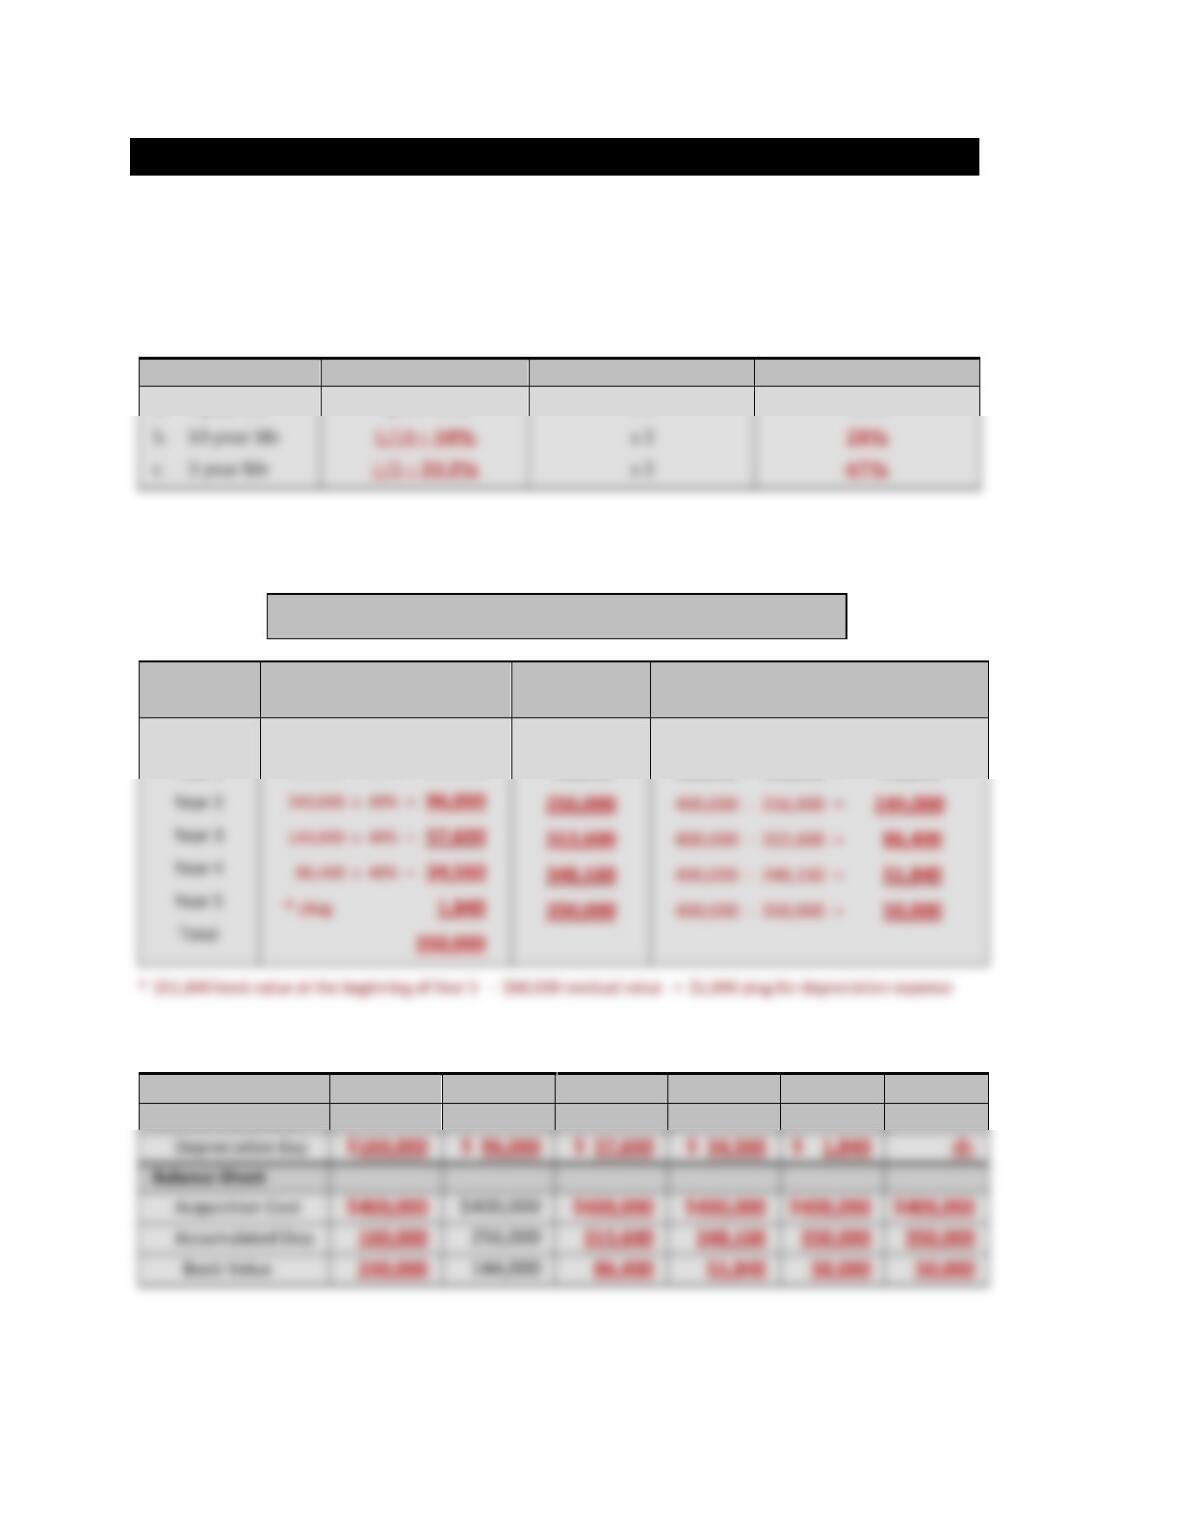
Q2 Record amounts reported on the income statement and the balance sheet over a six-year period in
the chart below.
Year 1
Year 2
Year 3
Year 4
Year 5
Year 6
Income Statement
Balance Sheet
6e Specific Accounts Page 197 Chapter 6
ACTIVITY 68 PPE: DOUBLE–DECLINING–BALANCE DEPRECIATION
Purpose: • Compute depreciation using the double-declining-balance method.
• Understand what amounts are reported for depreciation on the financial statements.
Q1 Compute the Double-Declining-Balance (DDB) Rate for each useful life below.
Straight-Line Rate = (1 / Useful Life)
DDB Rate = Straight-Line Rate x 2 = Double the Straight-line Rate
SL Rate
Double It =
DDB Rate
a. 5 year life
1/5 = 20%
x 2
40%
Q2 Equipment costing $400,000 has an estimated useful life of five years and a residual value of
$50,000. Complete the table below for Years 2-5 using the DDB method of depreciation.
Beginning Book Value x DDB Rate = DDB Depreciation Expense
DDB
Depreciation
Expense
Accumulated
Depreciation
Book Value
= Acquisition Cost – Accumulated Dep
Acquisition
Year 1
400,000 x 40% = 160,000
160,000
400,000 – 0 = 400,000
400,000 – 160,000 = 240,000
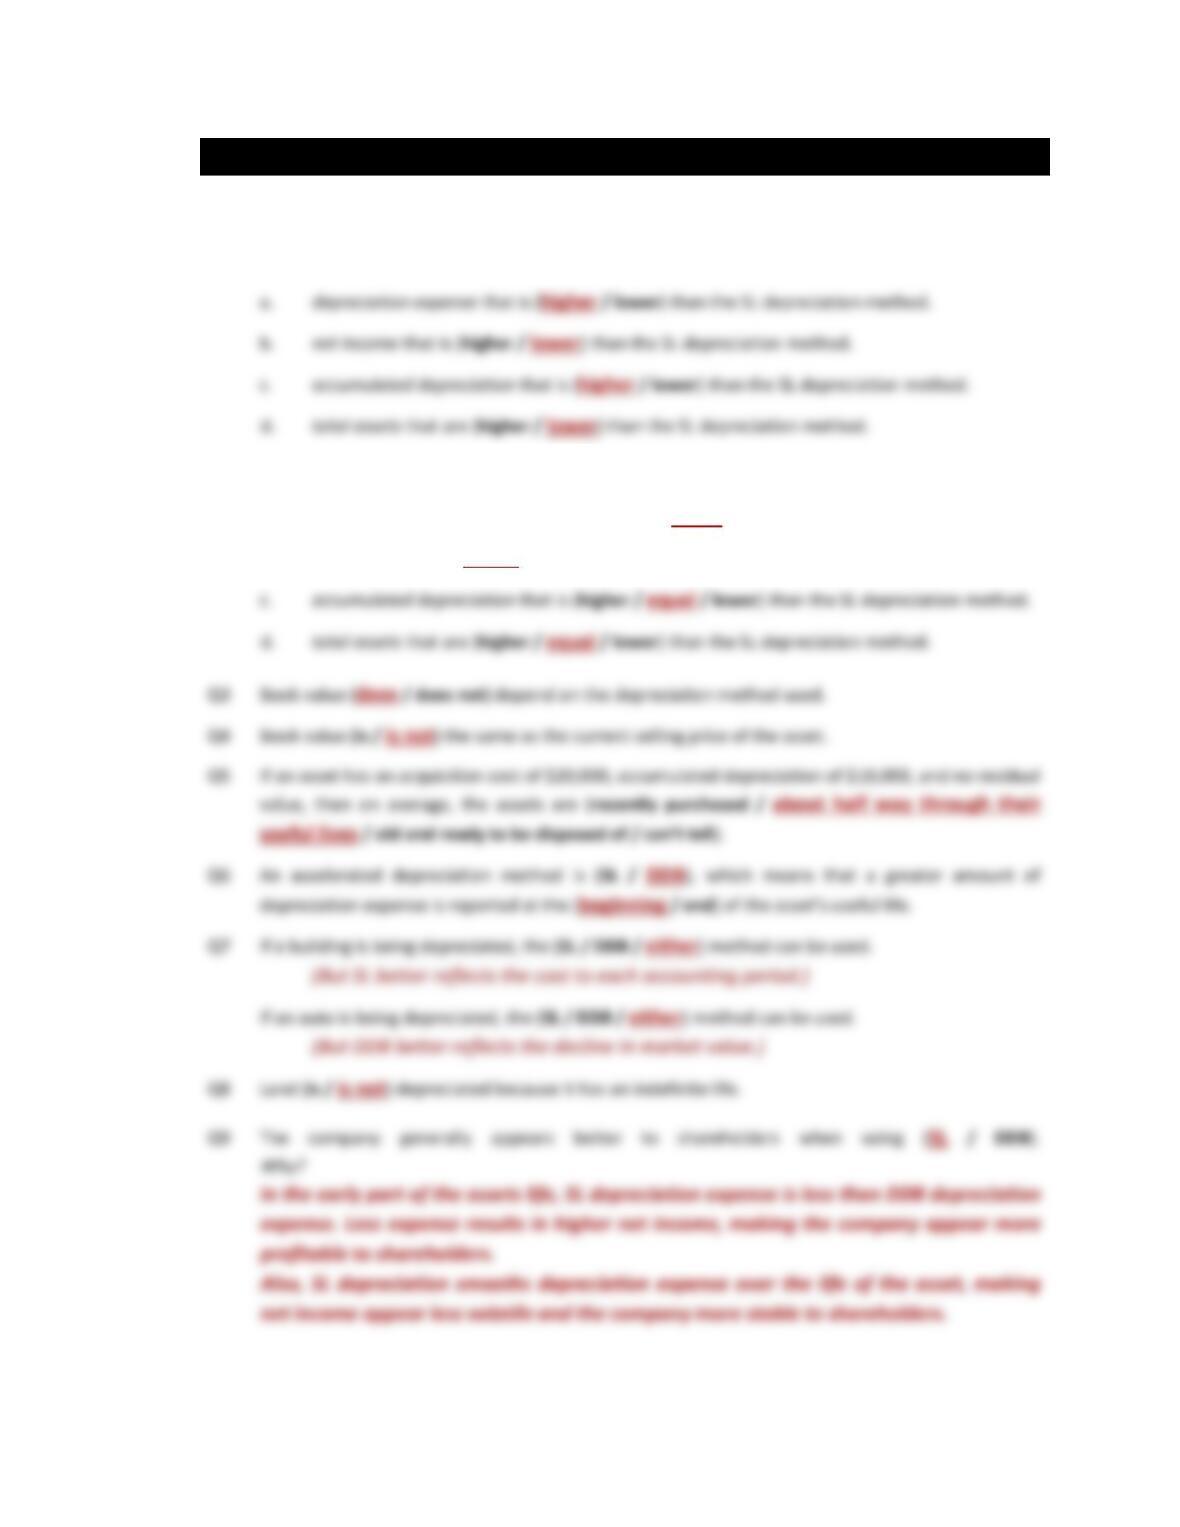
Q3 Record the amounts reported on the income statement and the balance sheet over a six-year period.
Year 1
Year 2
Year 3
Year 4
Year 5
Year 6
Income Statement
6e Specific Accounts Page 198 Chapter 6
ACTIVITY 69 PPE: COMPARING SL AND DDB
Purpose: • Understand how SL and DDB depreciation methods affect the financial statements.
Q1 In the first year of an asset’s useful life, the DDB depreciation method reports:
Q2 In the final year of an asset’s useful life, the DDB depreciation method reports:
a. depreciation expense that is (higher / equal / lower) than the SL depreciation method.
b. net income that is (higher / equal / lower) than the SL depreciation method.