*PROBLEM 6-8A (Continued)
(b)
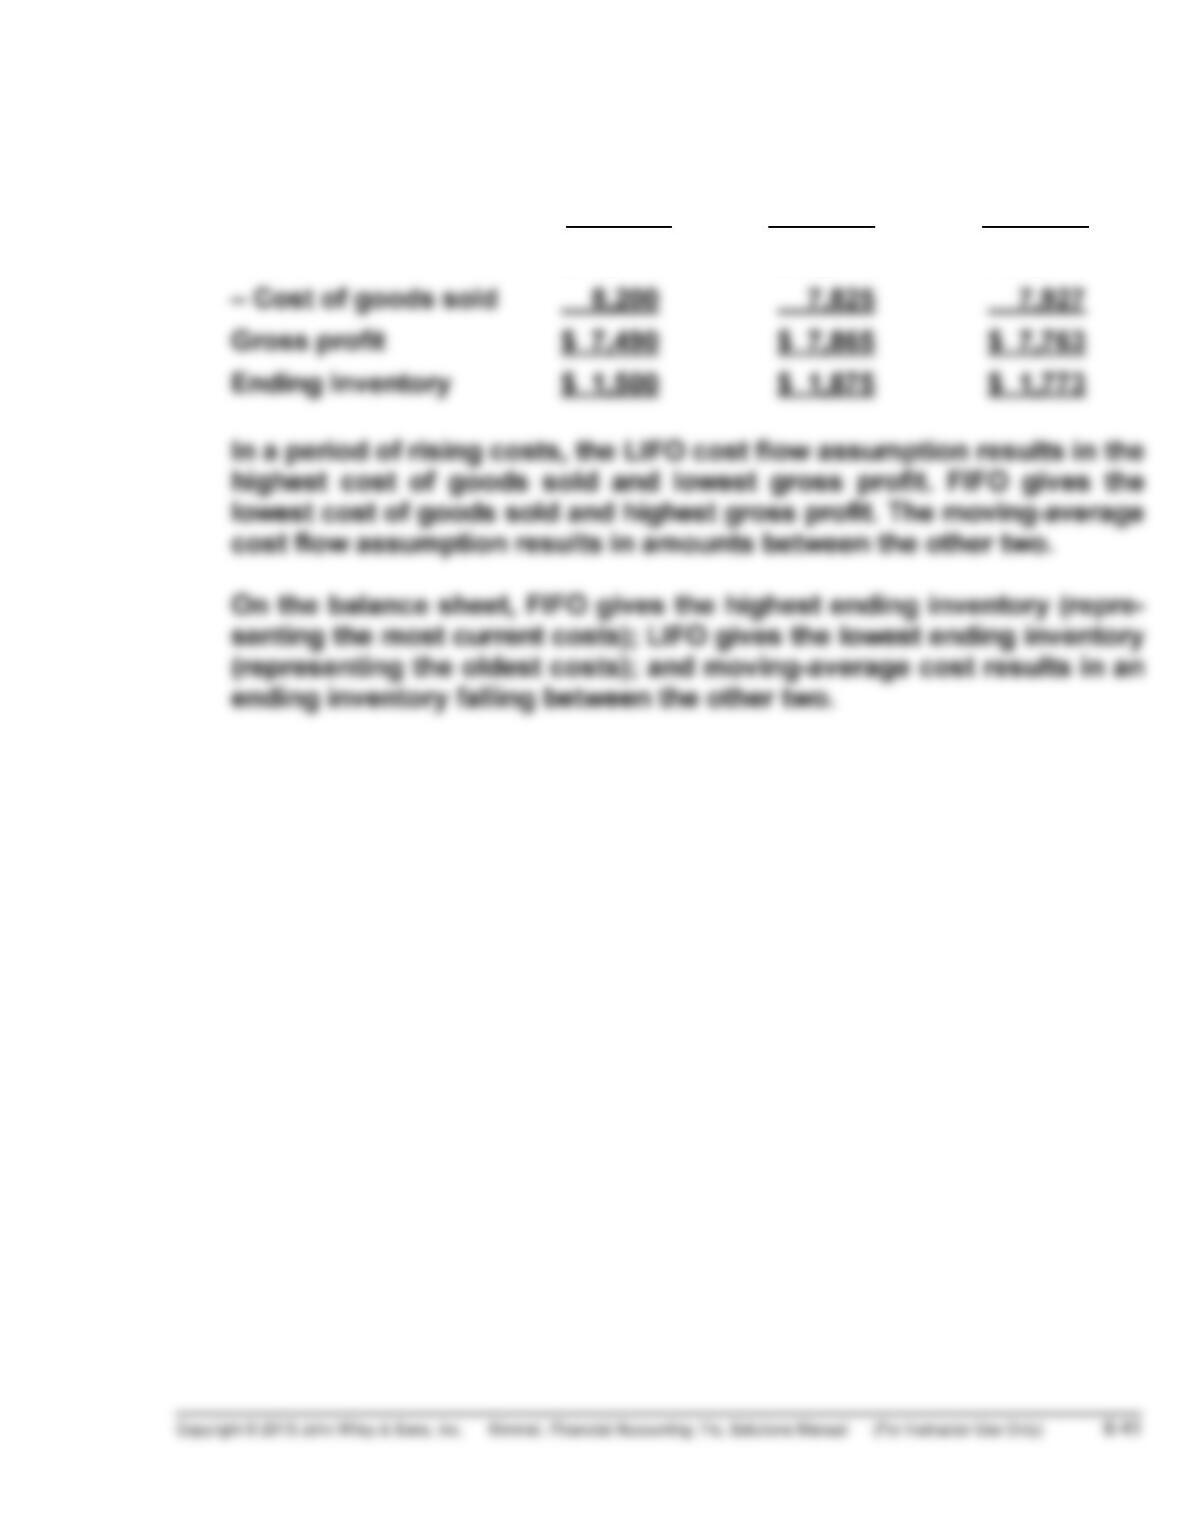
Gross profit:
LIFO FIFO
Moving-
Average
Sales $15,690 $15,690 $15,690
*PROBLEM 6-9A
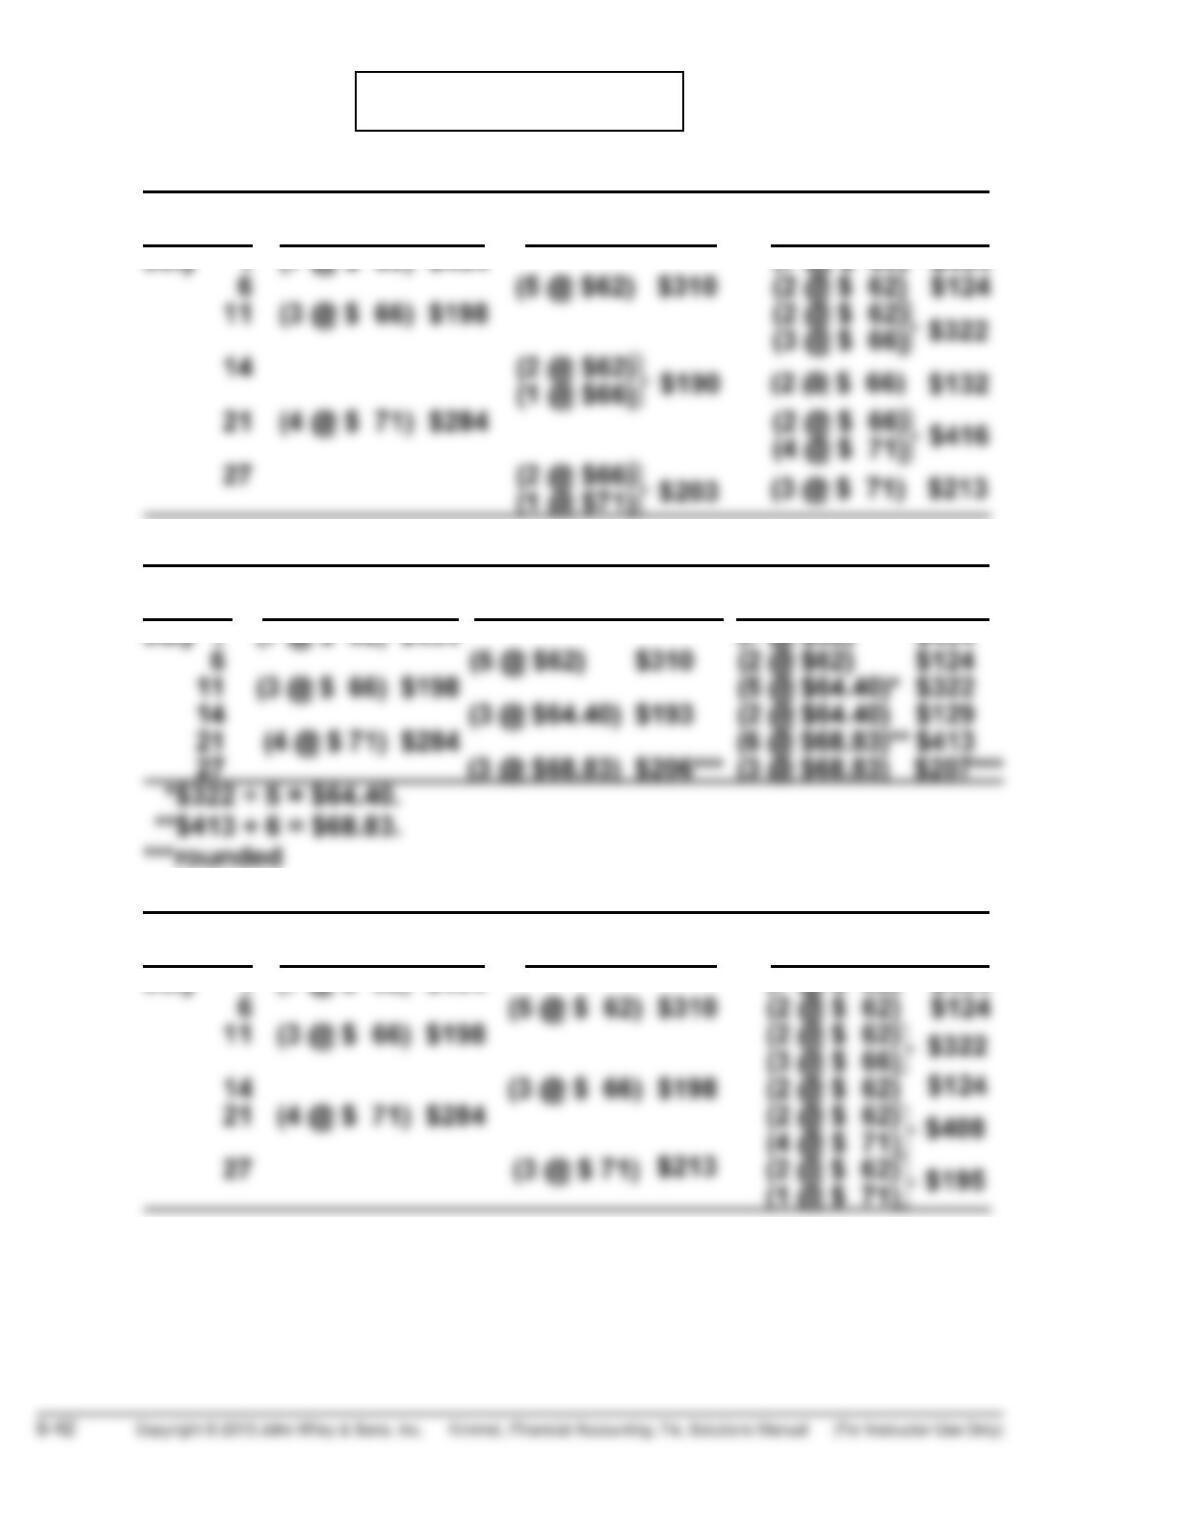
(a) (1) FIFO
Cost of
Date Purchases Goods Sold Balance
(2) MOVING-AVERAGE
Cost of
Date Purchases Goods Sold Balance
(3) LIFO
Cost of
Date Purchases Goods Sold Balance
July 1 (7 @ $ 62) $434 (7 @ $ 62) $434
(b) The highest ending inventory is $213 under the FIFO method.
SOLUTIONS TO PROBLEMS—SET B
PROBLEM 6-1B
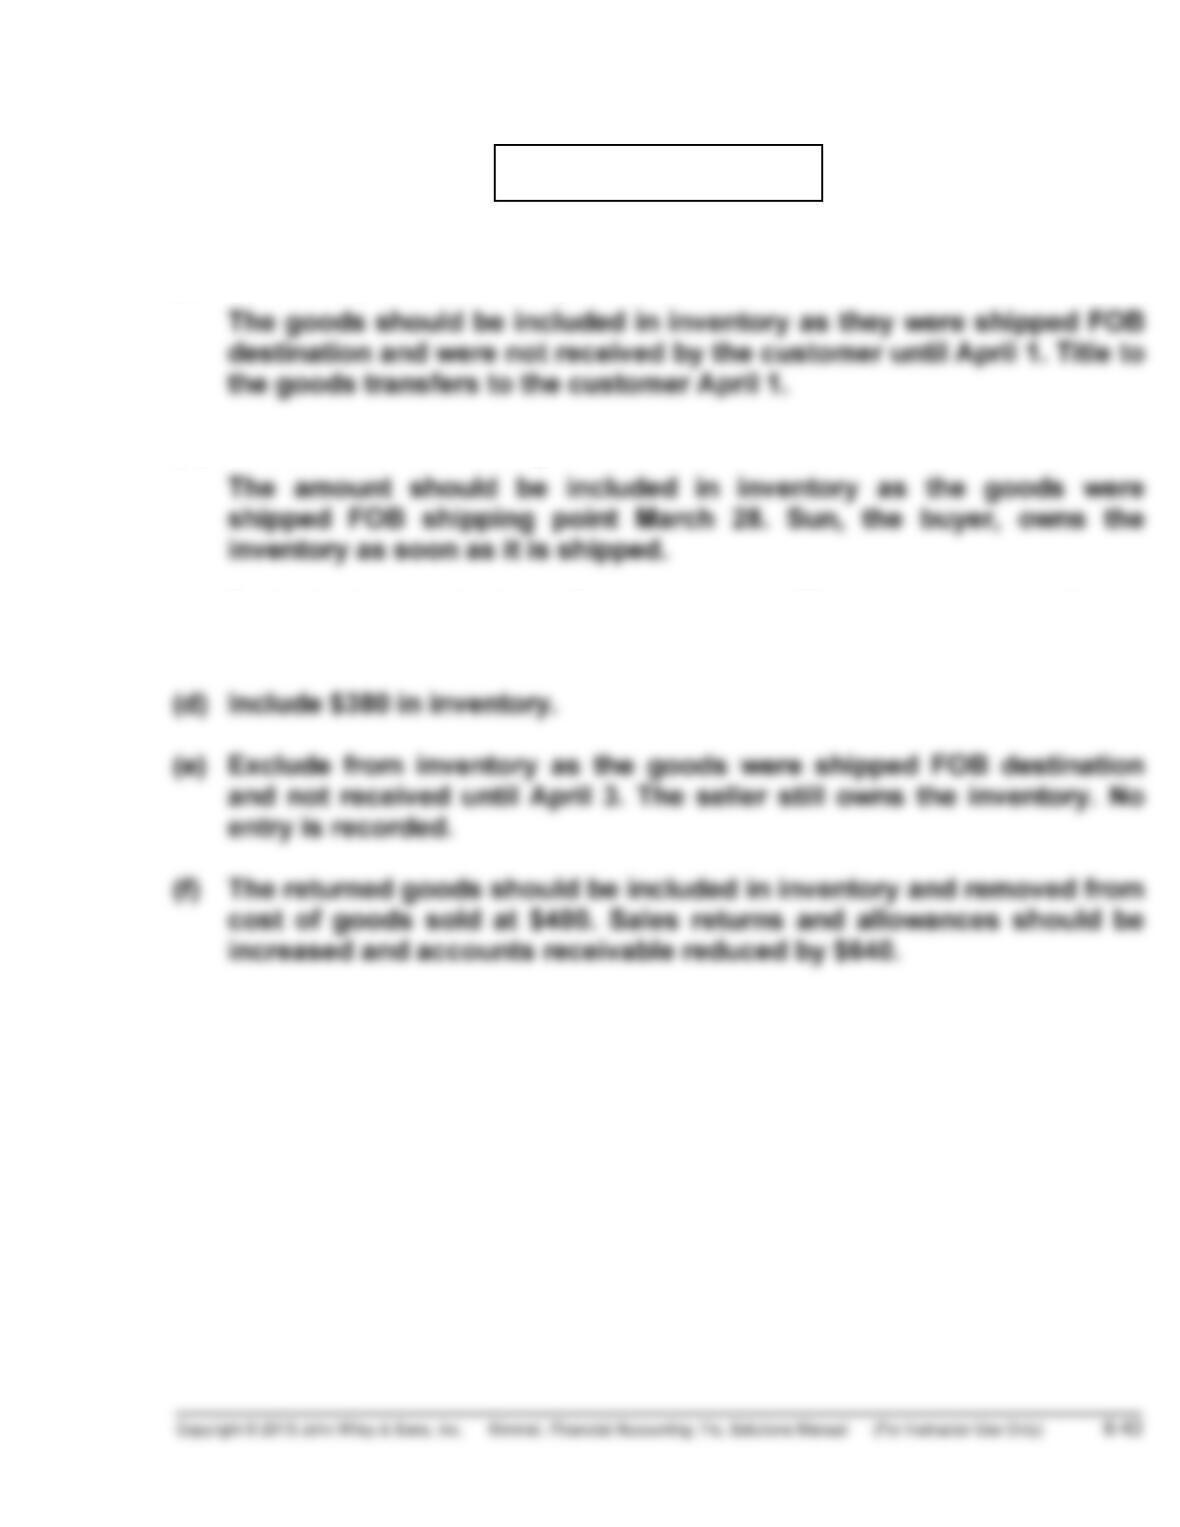
(a) Include $1,000 in inventory.
(b) Include $620 in inventory.
(c) Exclude the goods from Sun’s inventory. The consigned goods are
owned by Frederick Inc. No entry is recorded.
PROBLEM 6-2B
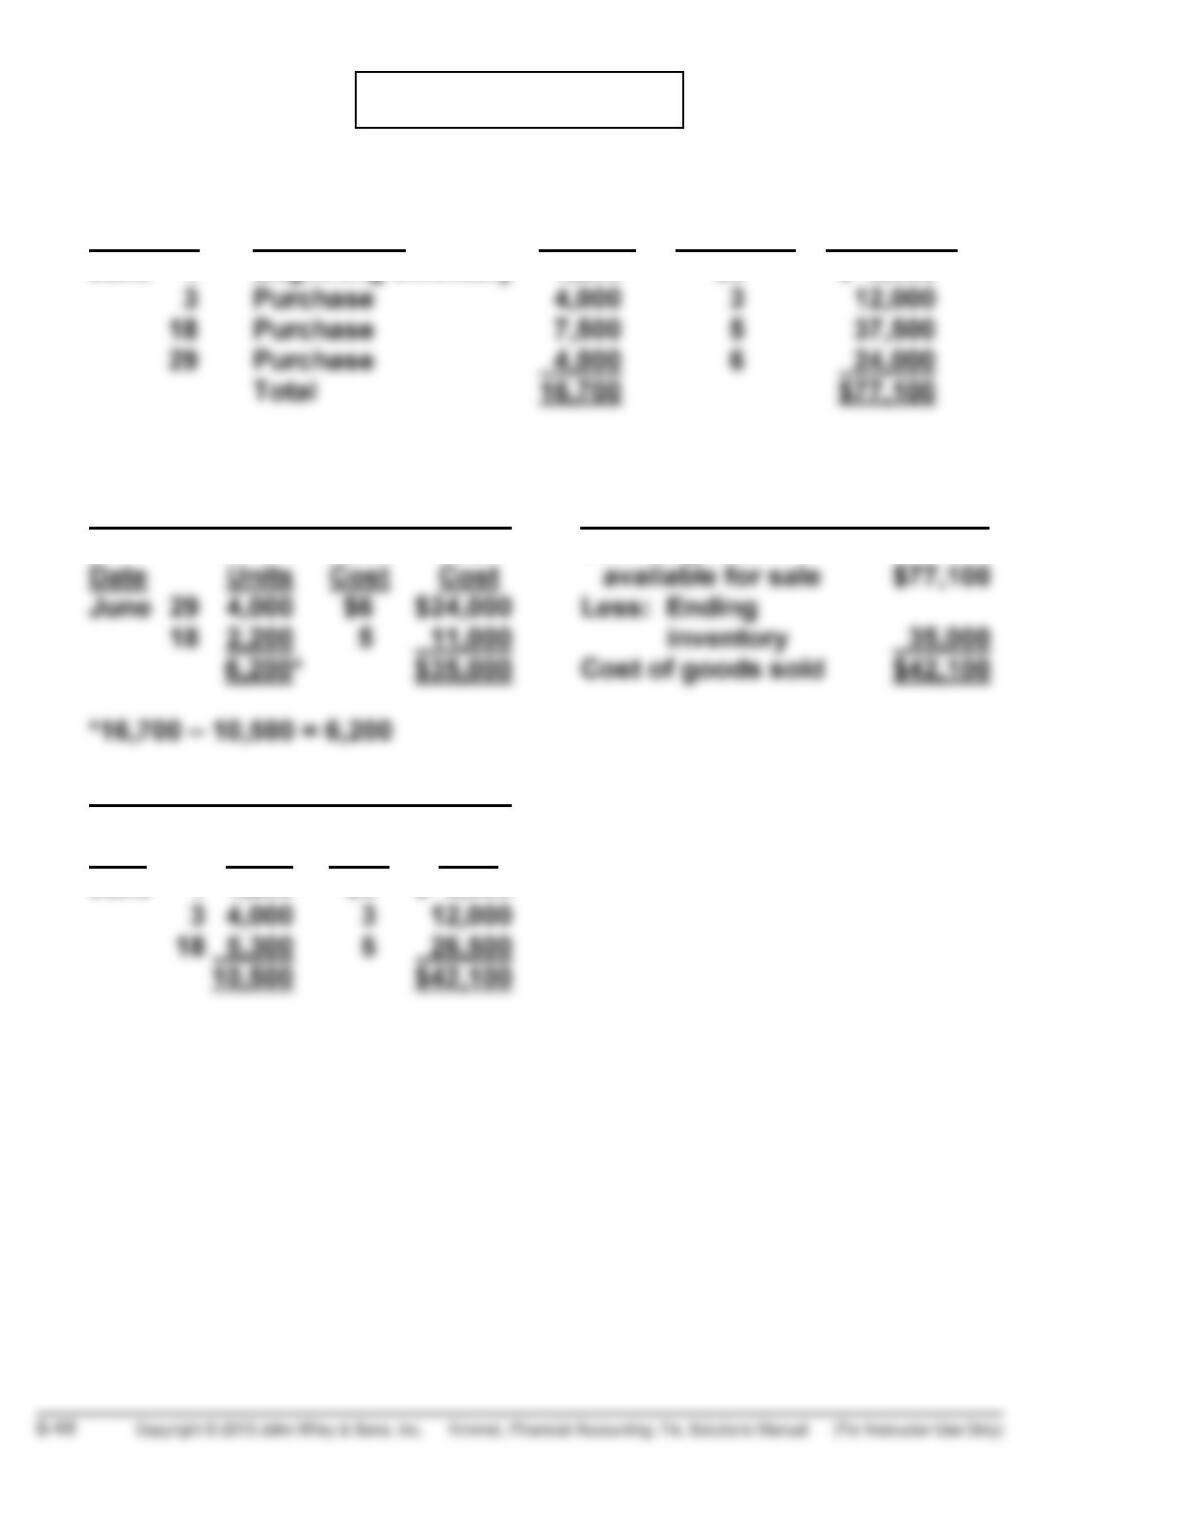
(a) COST OF GOODS AVAILABLE FOR SALE
Date Explanation Units Unit Cost Total Cost
June 1 Beginning inventory 1,200 $3 $ 3,600
(b) FIFO
(1) Ending Inventory (2) Cost of Goods Sold
Unit Total Cost of goods
Proof of Cost of Goods Sold
Unit Total
Date Units Cost Cost
June 1 1,200 $3 $ 3,600
PROBLEM 6-2B (Continued)
LIFO
(1) Ending Inventory (2) Cost of Goods Sold
Unit Total Cost of goods
Date Units Cost Cost available for sale $77,100
June 1 1,200 $3 $ 3,600 Less: Ending
Proof of Cost of Goods Sold
Unit Total
Date Units Cost Cost
June 29 4,000 $6 $24,000
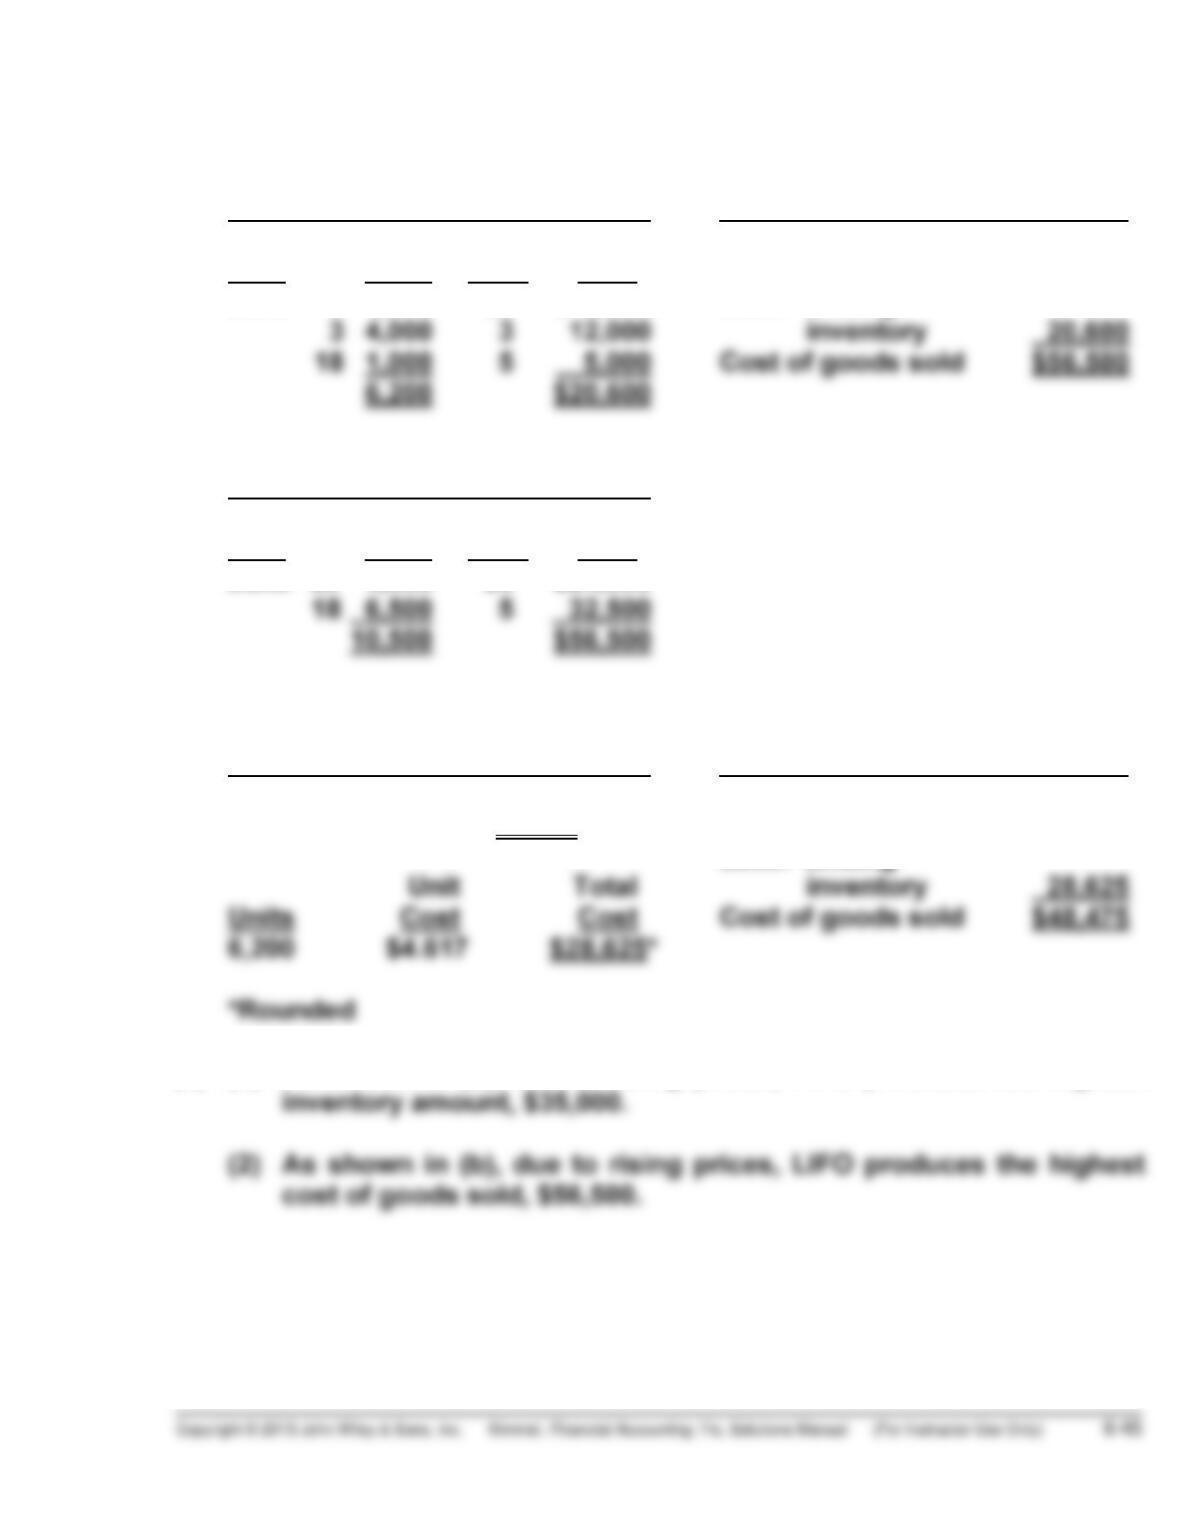
AVERAGE-COST
(1) Ending Inventory (2) Cost of Goods Sold
Cost of goods
$77,100 ÷ 16,700 = $4.617 available for sale $77,100
Less: Ending
(c) (1) As shown in (b), due to rising prices, FIFO produces the highest
PROBLEM 6-3B
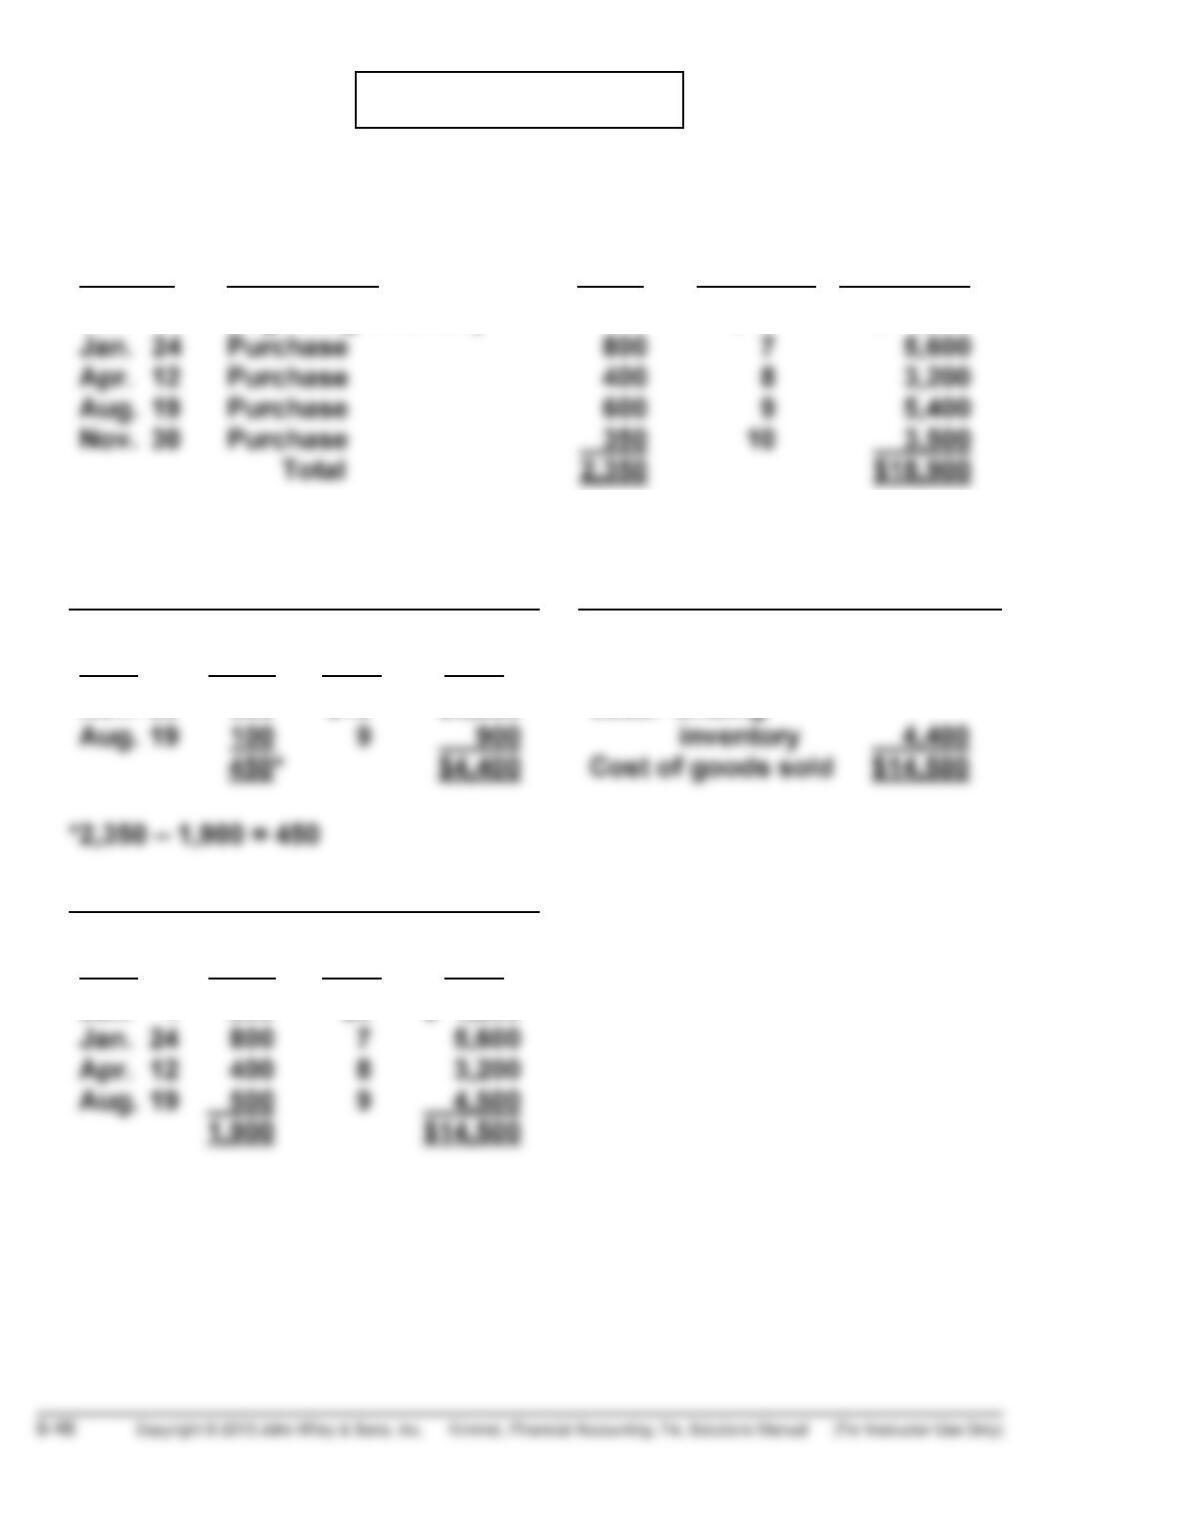
(a) COST OF GOODS AVAILABLE FOR SALE
Date Explanation Units Unit Cost Total Cost
Jan. 1 Beginning inventory 200 $ 6 $ 1,200
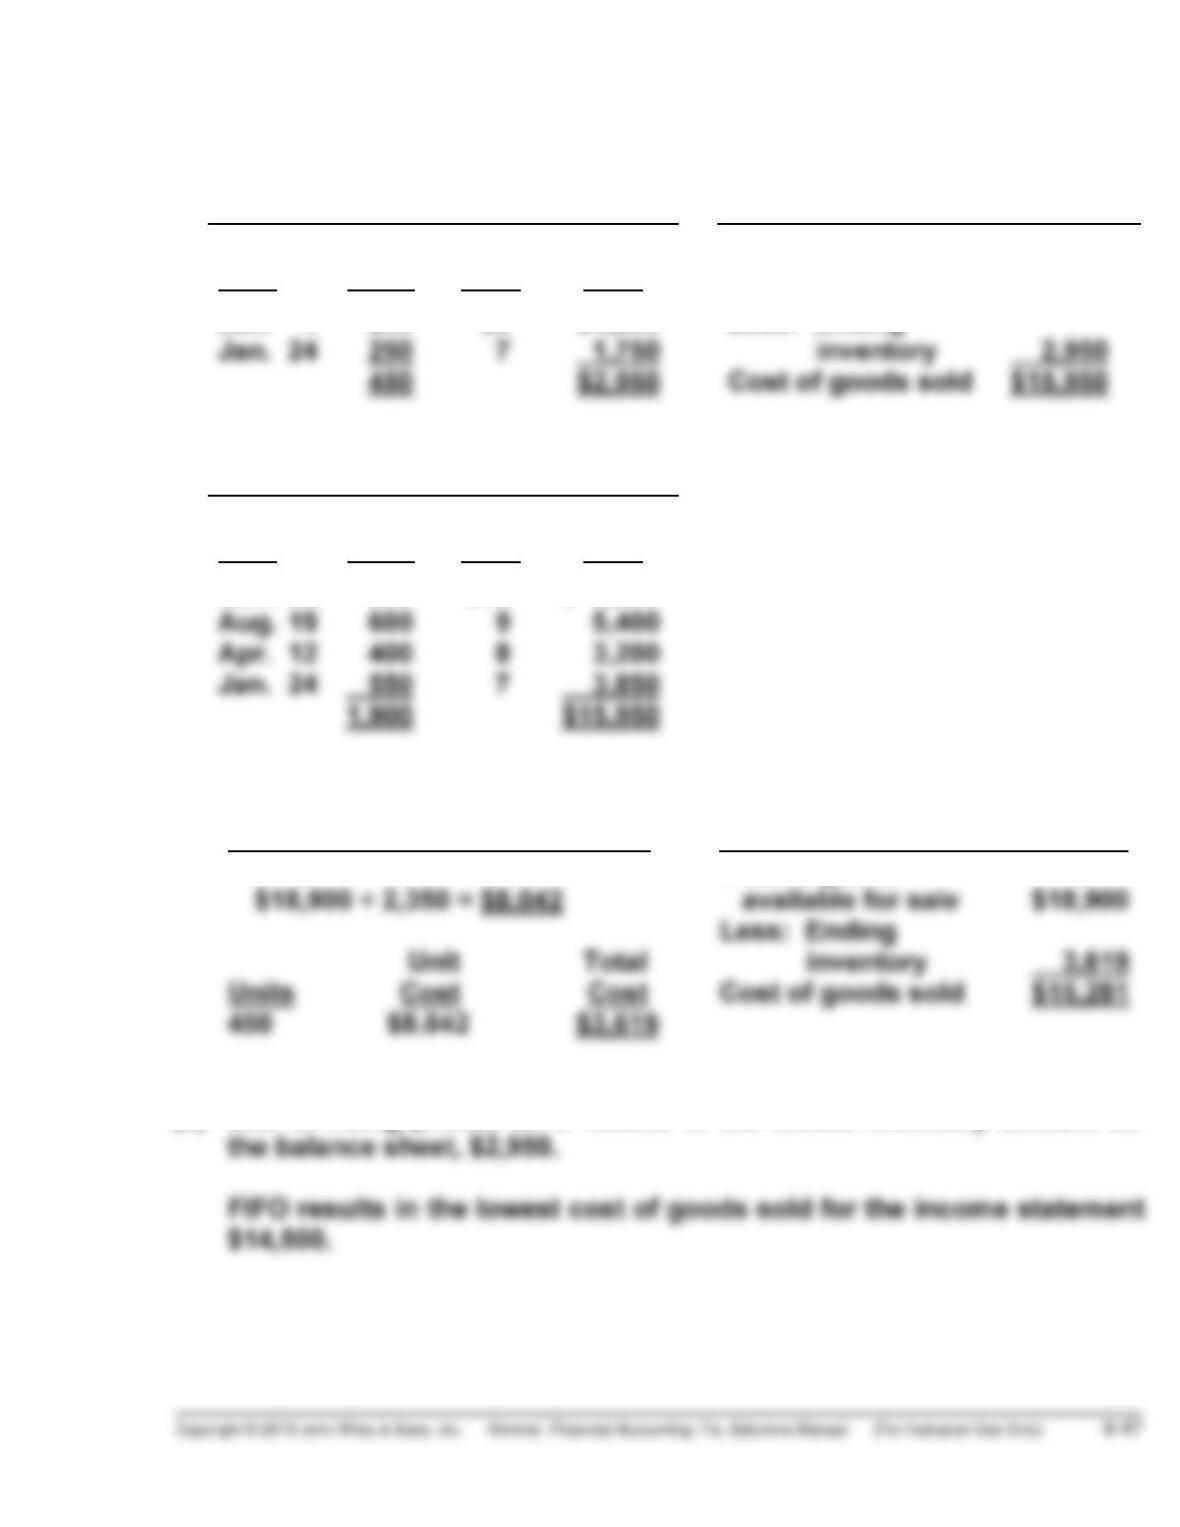
(b) FIFO
(1) Ending Inventory (2) Cost of Goods Sold
Date Units
Unit
Cost
Total
Cost
Cost of goods
available for sale $18,900
Nov. 30 350 $10 $3,500 Less: Ending
Proof of Cost of Goods Sold
Date Units
Unit
Cost
Total
Cost
Jan. 1 200 $6 $ 1,200
PROBLEM 6-3B (Continued)
LIFO
(1) Ending Inventory (2) Cost of Goods Sold
Date Units
Unit
Cost
Total
Cost
Cost of goods
available for sale $18,900
Jan. 1 200 $6 $1,200 Less: Ending
Proof of Cost of Goods Sold
Date Units
Unit
Cost
Total
Cost
Nov. 30 350 $10 $ 3,500
AVERAGE-COST
(1) Ending Inventory (2) Cost of Goods Sold
Cost of goods
(c) Due to rising prices, LIFO results in the lowest inventory amount for
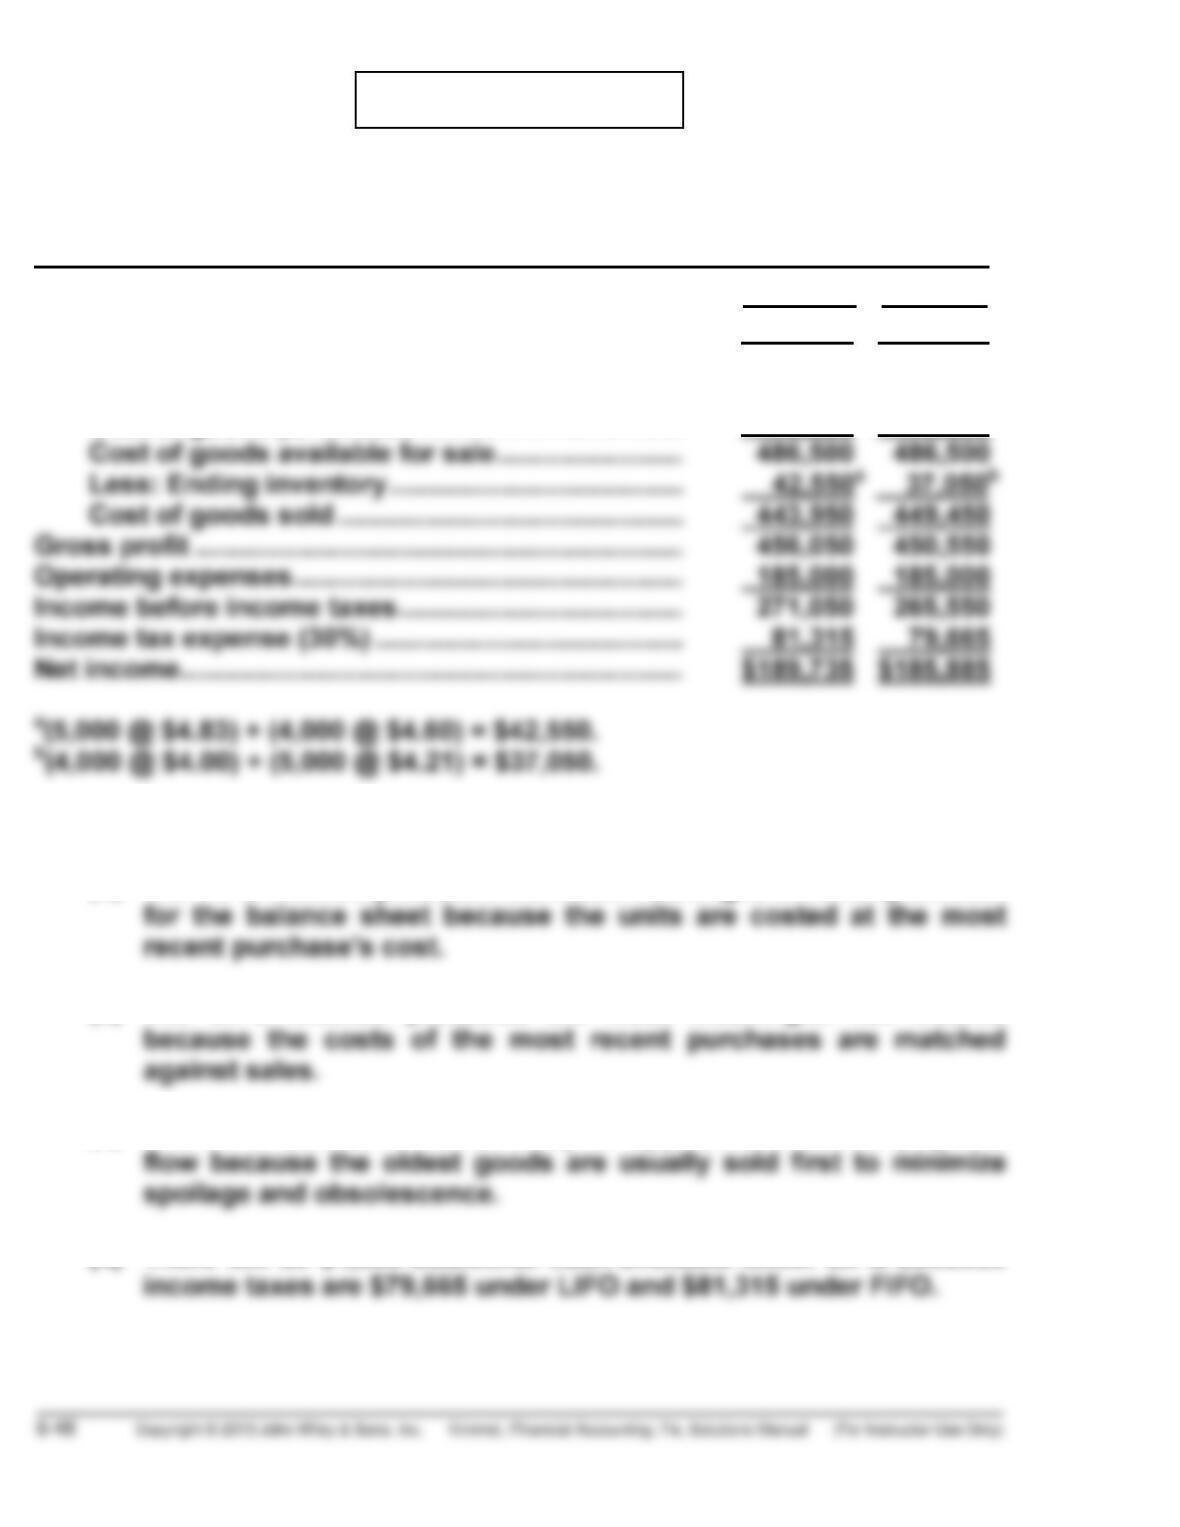
PROBLEM 6-4B
(a) WEIGEL INC.
Condensed Income Statements
For the Year Ended December 31, 2014
FIFO LIFO
Sales………………………………………………………………….. $900,000 $900,000
Cost of goods sold
Beginning inventory …………………………………….. 16,000 16,000
Cost of goods purchased …………………………….. 470,500 470,500
(b) Answers to questions:
(1) The FIFO method produces the most meaningful inventory amount
(2) The LIFO method produces the most meaningful net income
(3) The FIFO method is most likely to approximate actual physical
(4) There will be $1,650 additional cash available under LIFO because
PROBLEM 6-4B (Continued)
(5) The illusionary gross profit is $5,500 ($456,050 – $450,550) under
FIFO. Under LIFO, Weigel Inc. has recovered the current
replacement cost of the units ($449,450), whereas under FIFO, it
has only recovered the earlier costs ($443,950). This means that
under FIFO, the company must reinvest $5,500 of the gross profit to
replace the units used.
Answer in business-letter form:
The LIFO method produces the most meaningful net income
because the costs of the most recent purchases are matched
against sales. There will be $1,650 additional cash available under
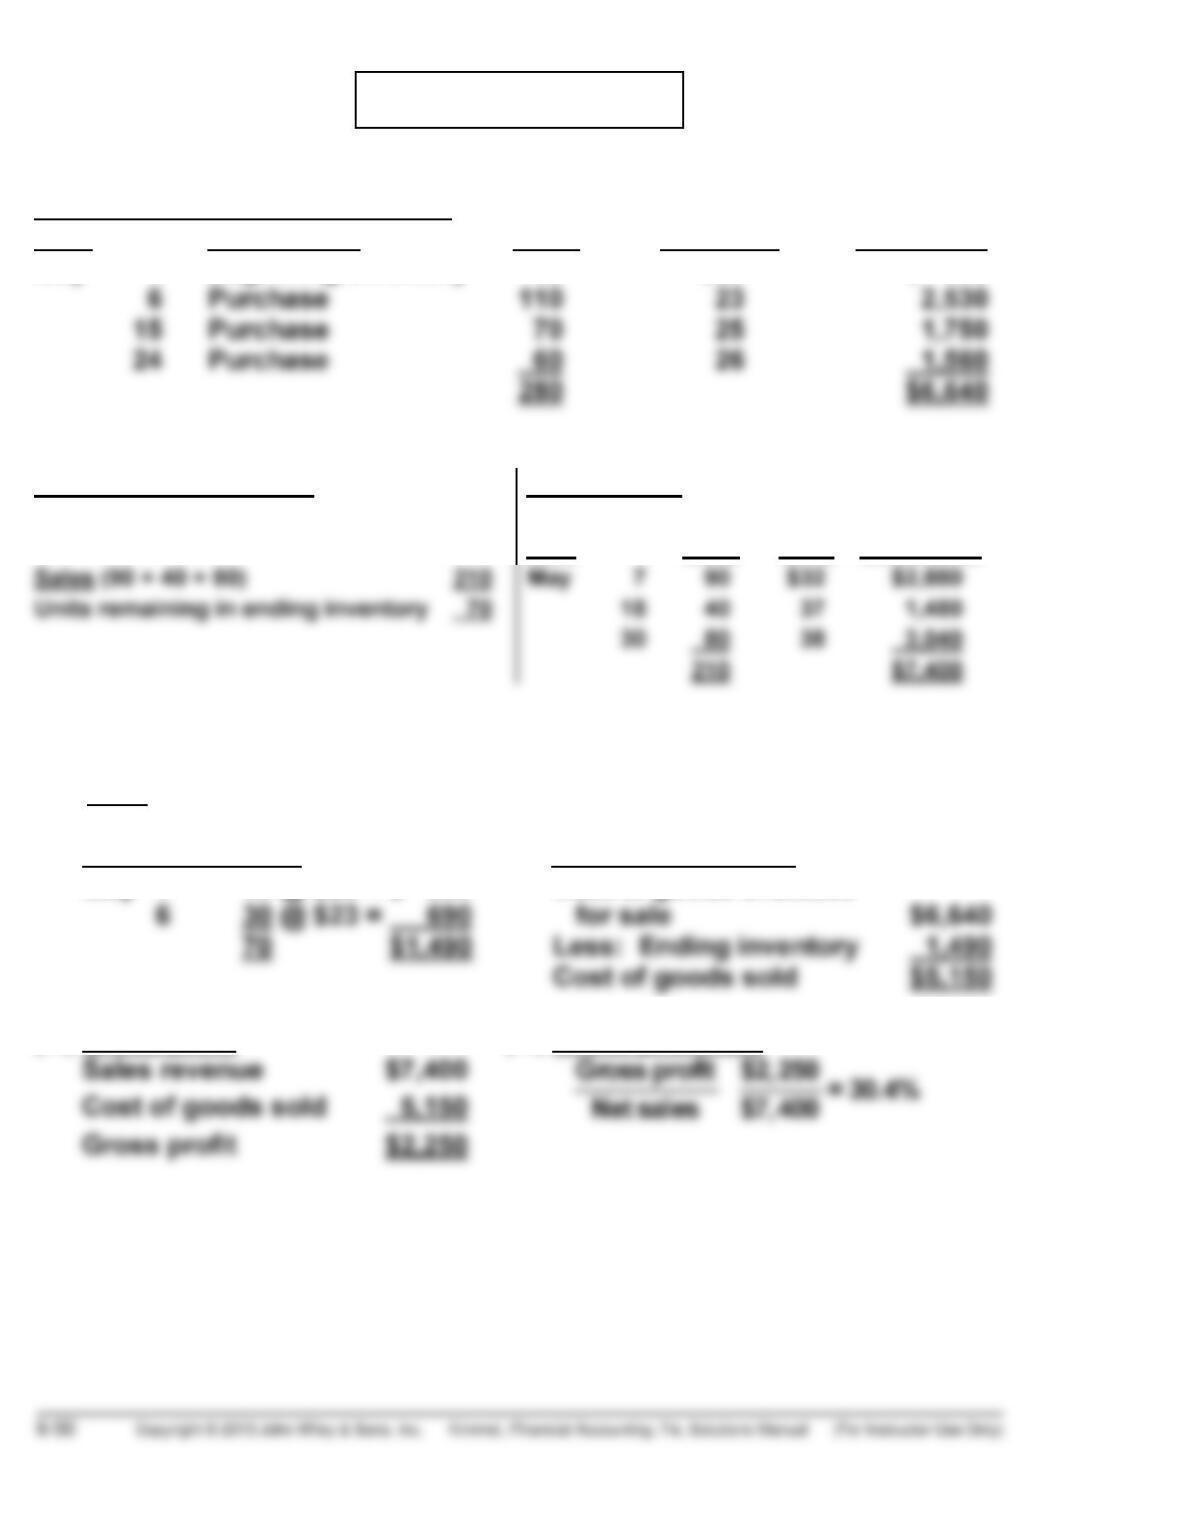
PROBLEM 6-5B
Cost of Goods Available for Sale
Date Explanation Units Unit Cost Total Cost
May 1 Beginning inventory 40 $20 $ 800
Ending Inventory in Units Sales revenue
Units available for sale 280
Date Units
Unit
Price Total Sales
(a)
(1) LIFO
(i) Ending inventory (ii) Cost of goods sold
May 1 40 @ $20 = $ 800
Cost of goods available
(iii) Gross profit (iv) Gross profit rate
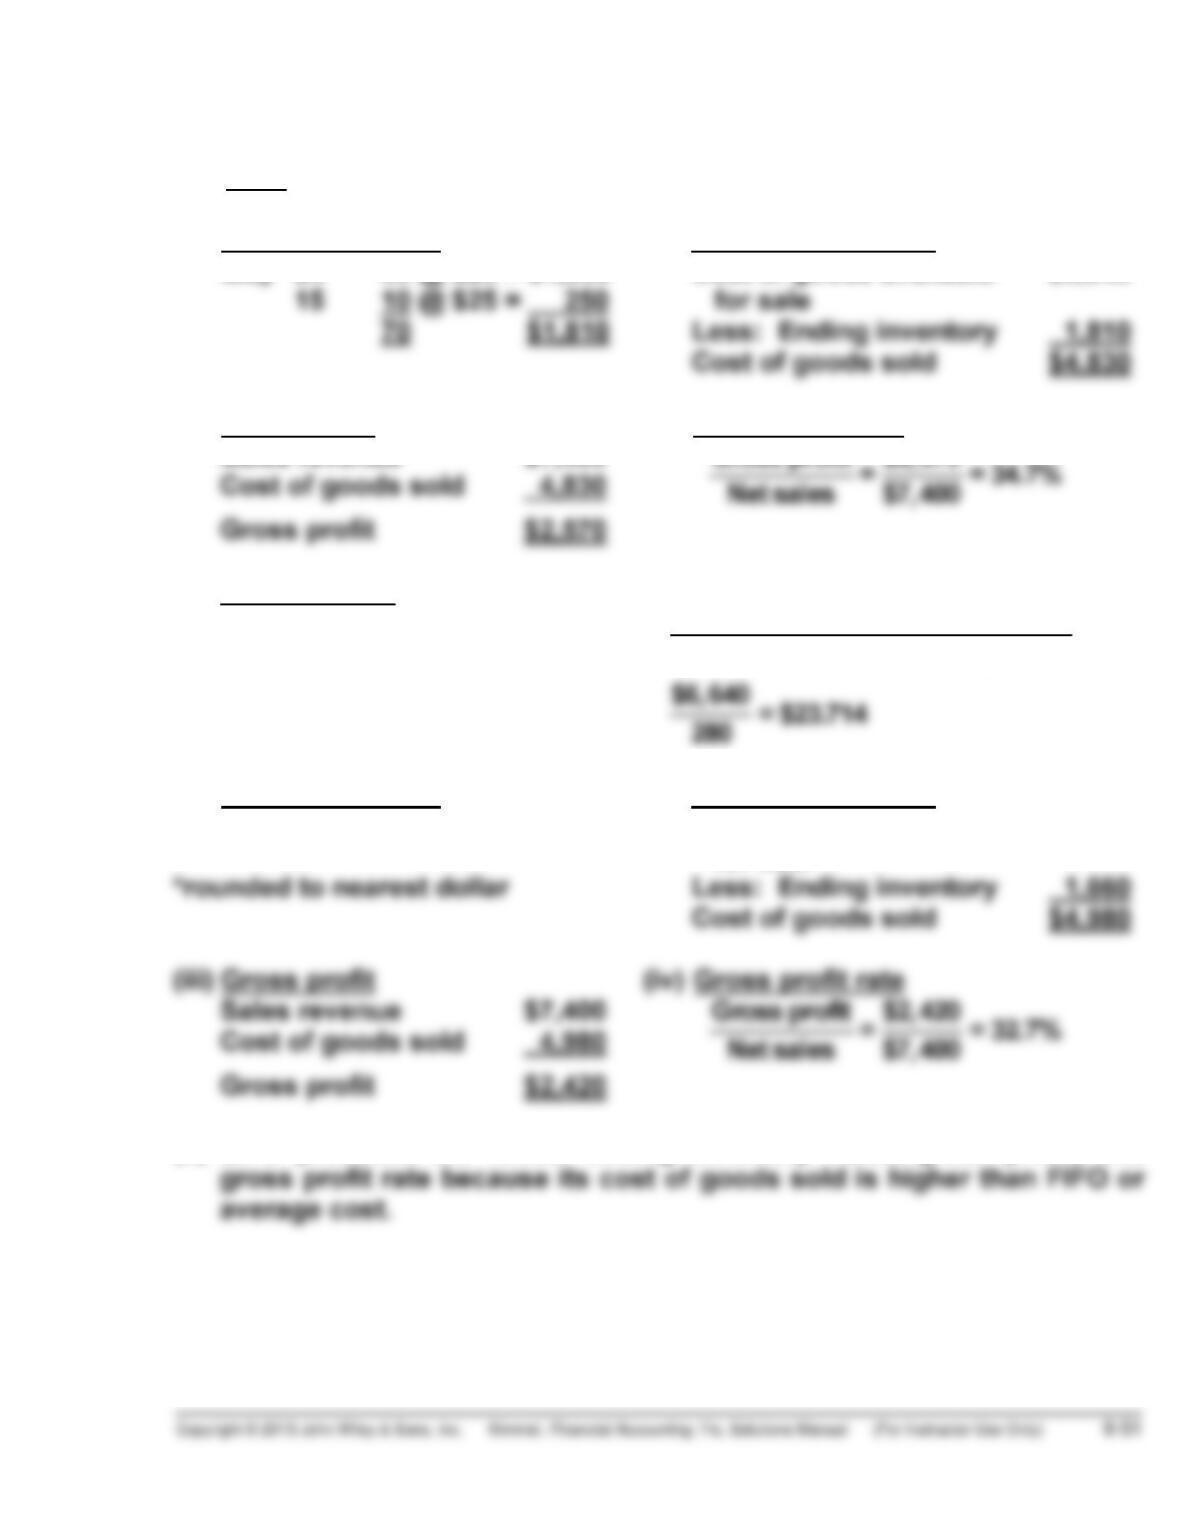
PROBLEM 6-5B (Continued)
(2) FIFO
(i) Ending inventory (ii) Cost of goods sold
May 24 60 @ $26 = $1,560
Cost of goods available
$6,640
(iii) Gross profit (iv) Gross profit rate
Sales revenue $7,400 Gross profit
(3) Average-Cost
Weighted-average cost per unit: cost of goods available for sale
units available for sale
(i) Ending inventory (ii) Cost of goods sold
70 @ $23.714 = $1,660* Cost of goods available
for sale
$6,640
(b) LIFO produces the lowest ending inventory value, gross profit, and
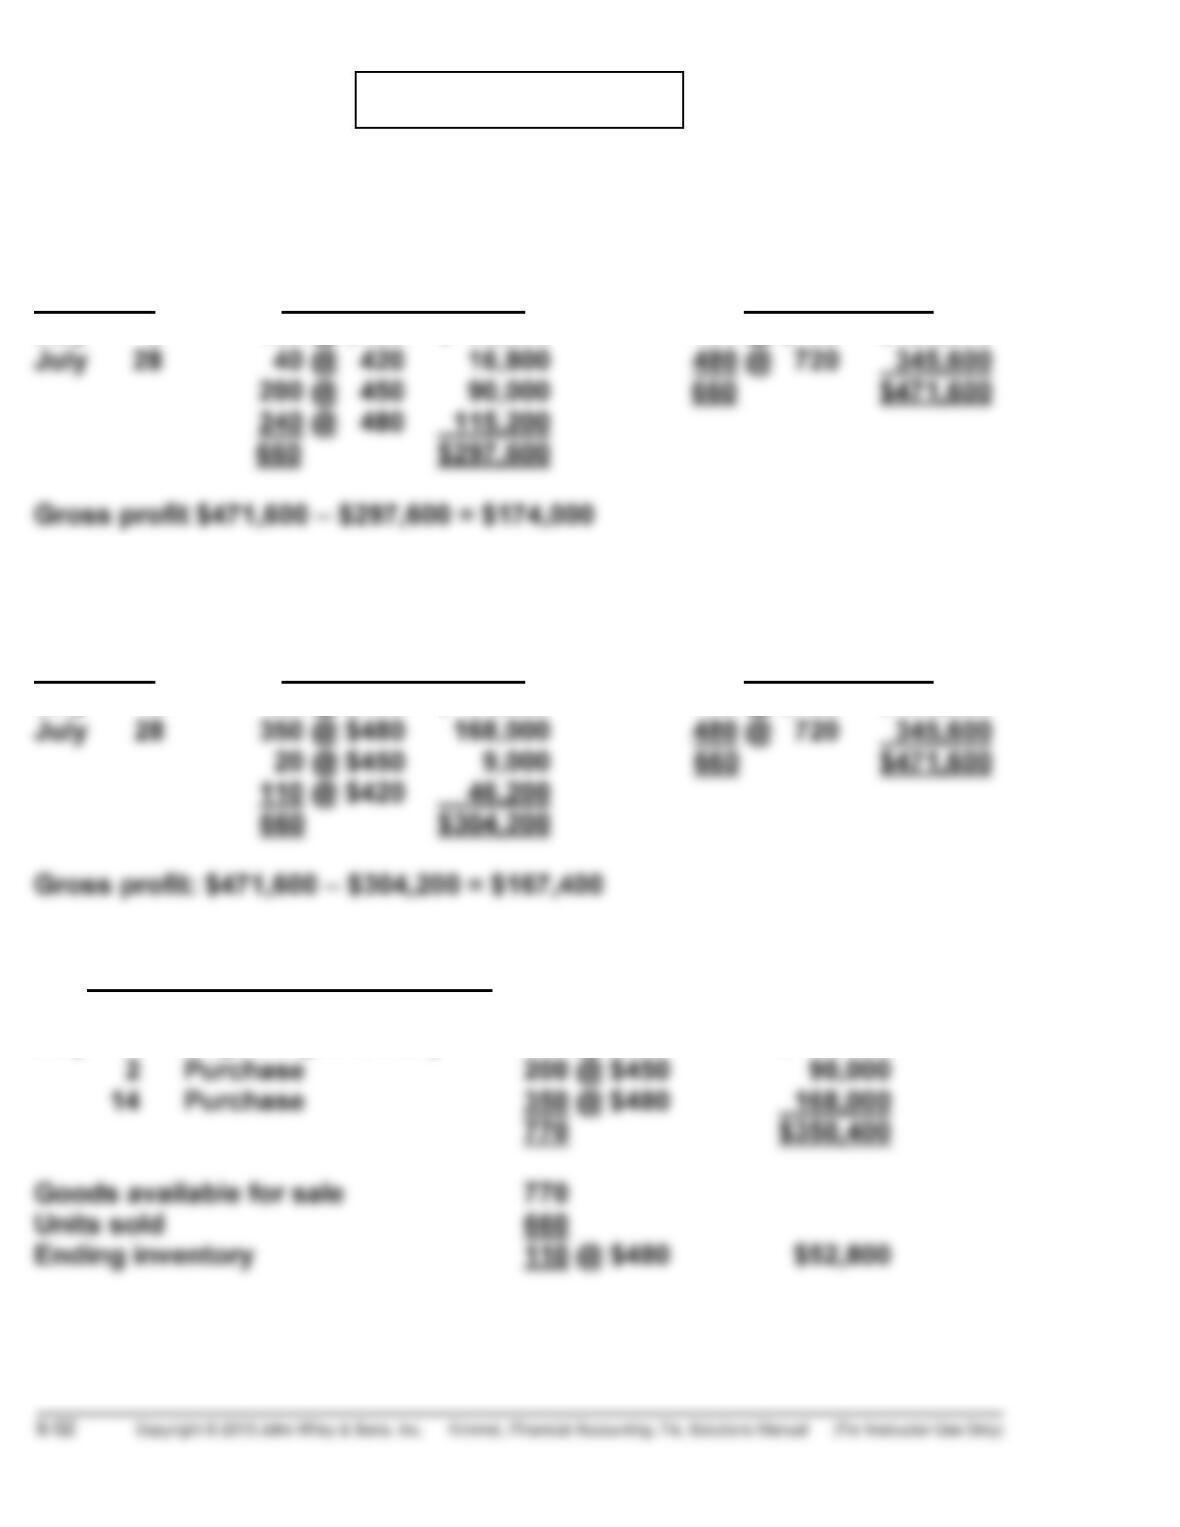
PROBLEM 6-6B
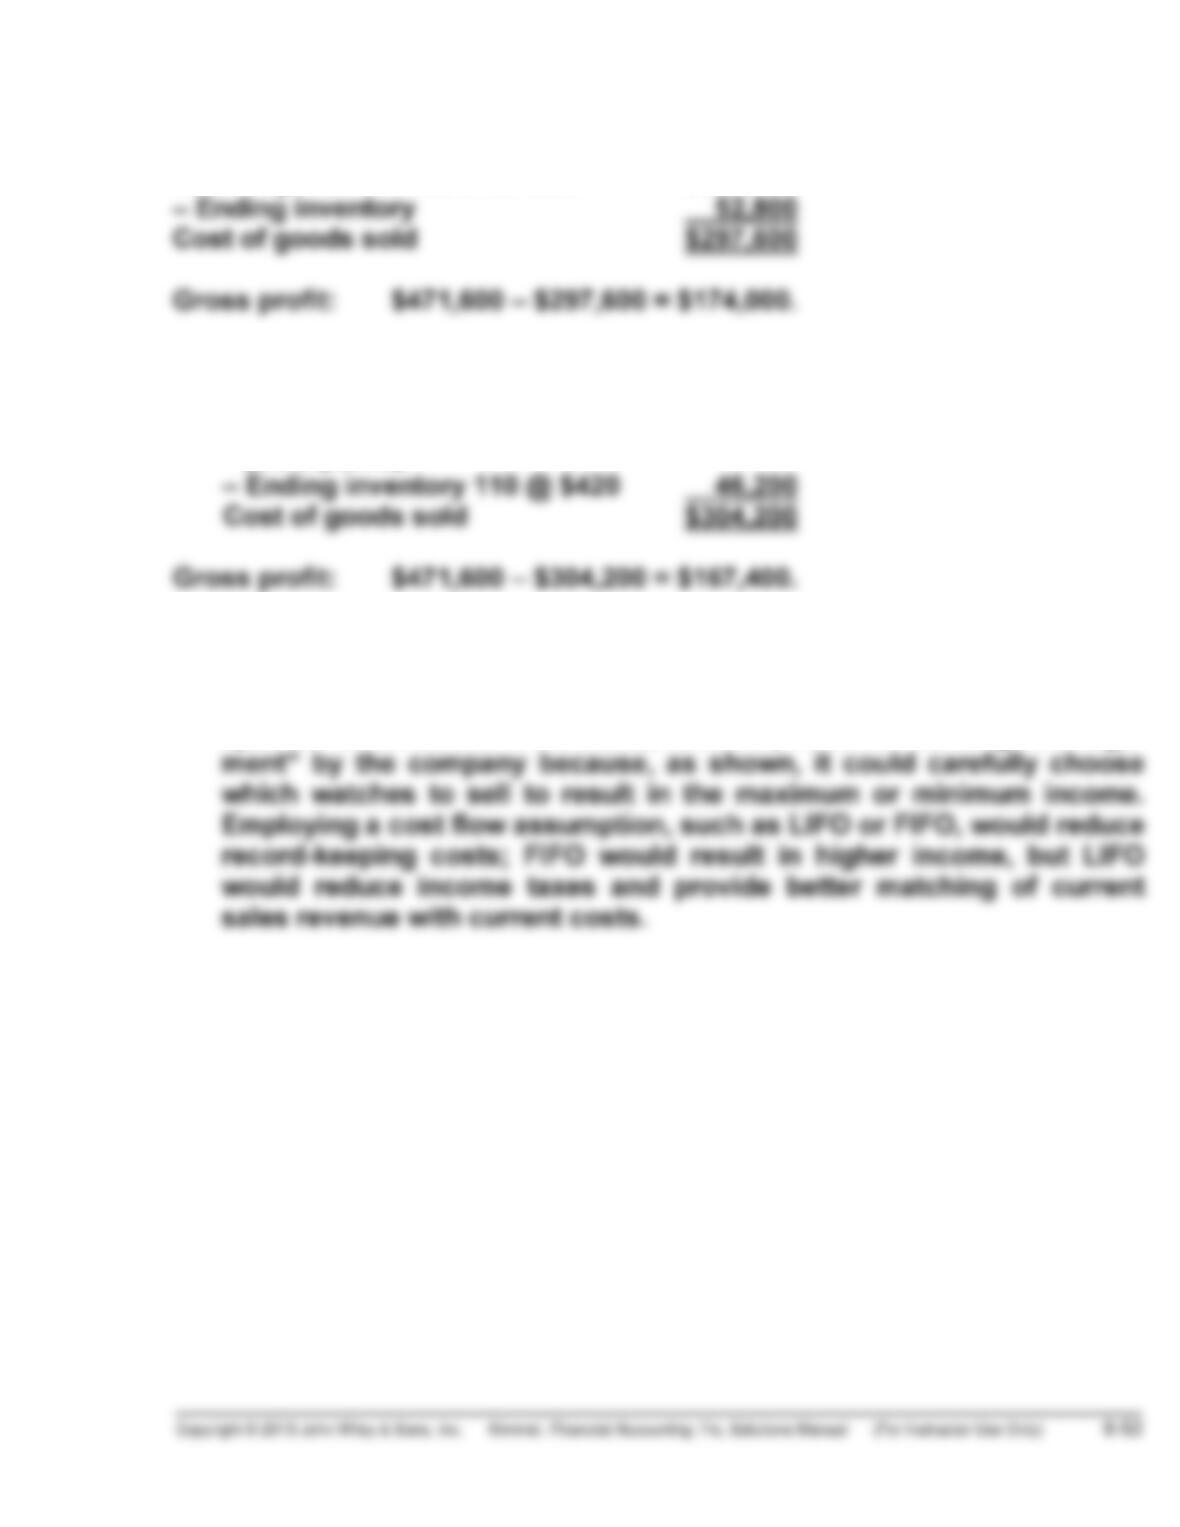
(a) (1) To maximize gross profit, Limex Watches should sell the watches
with the lowest cost.
Sale Date Cost o
f
goods sold Sales Revenue
July 5 180 @ $420 $ 75,600 180 @ $700 $126,000
(2) To minimize gross profit, Limex Watches should sell the watches
with the highest cost.
Sale Date Cost of goods sold Sales Revenue
July 5 180 @ $450 $ 81,000 180 @ $700 $126,000
(b) FIFO
Cost of goods available for sale
July 1 Beginning inventory 220 @ $420 $ 92,400
PROBLEM 6-6B (Continued)
Cost of goods available for sale $350,400
(c) LIFO
Cost of goods available for sale $350,400
(from part b)
(d) The choice of inventory method depends on the company’s objectives.
Since the watches are marked and coded, the company could use
specific identification. This could, however, result in “earnings manage-
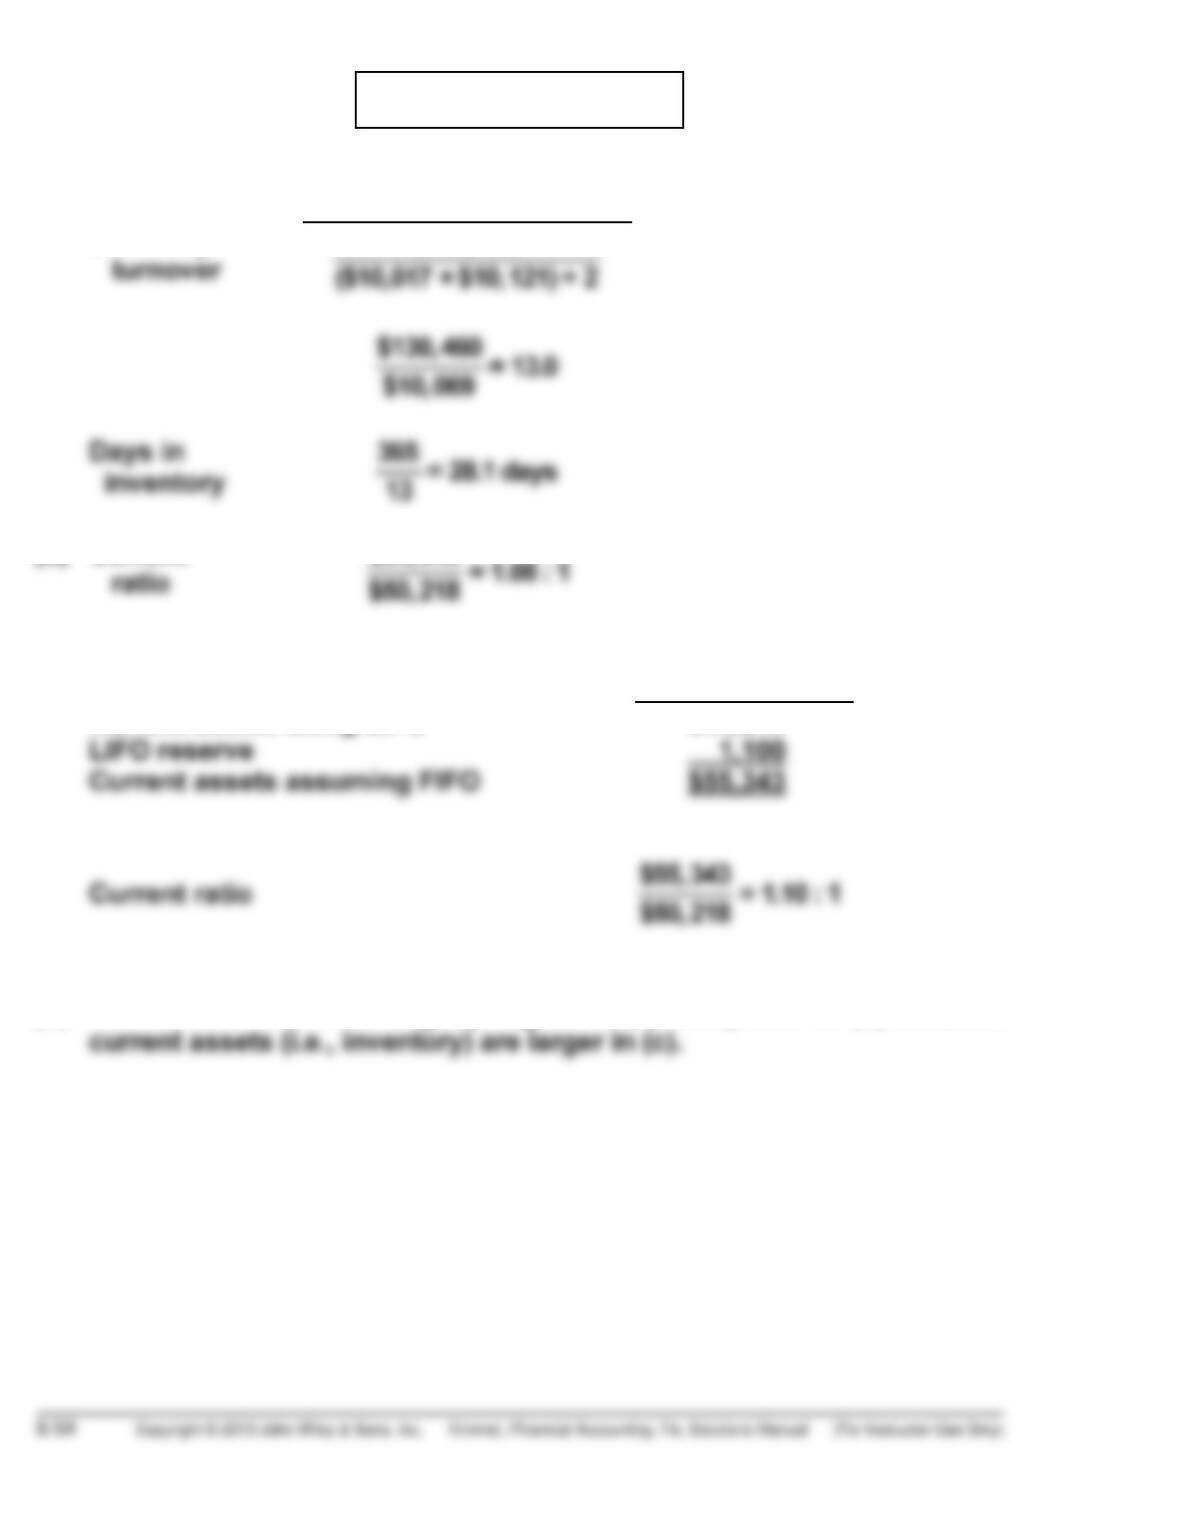
PROBLEM 6-7B
(a) 2014
Inventory
$130, 460
(b) Current
$54, 243
(c) 2014
Current assets using LIFO $54,243
(d) The current ratio was slightly higher in (c) compared to (b) because
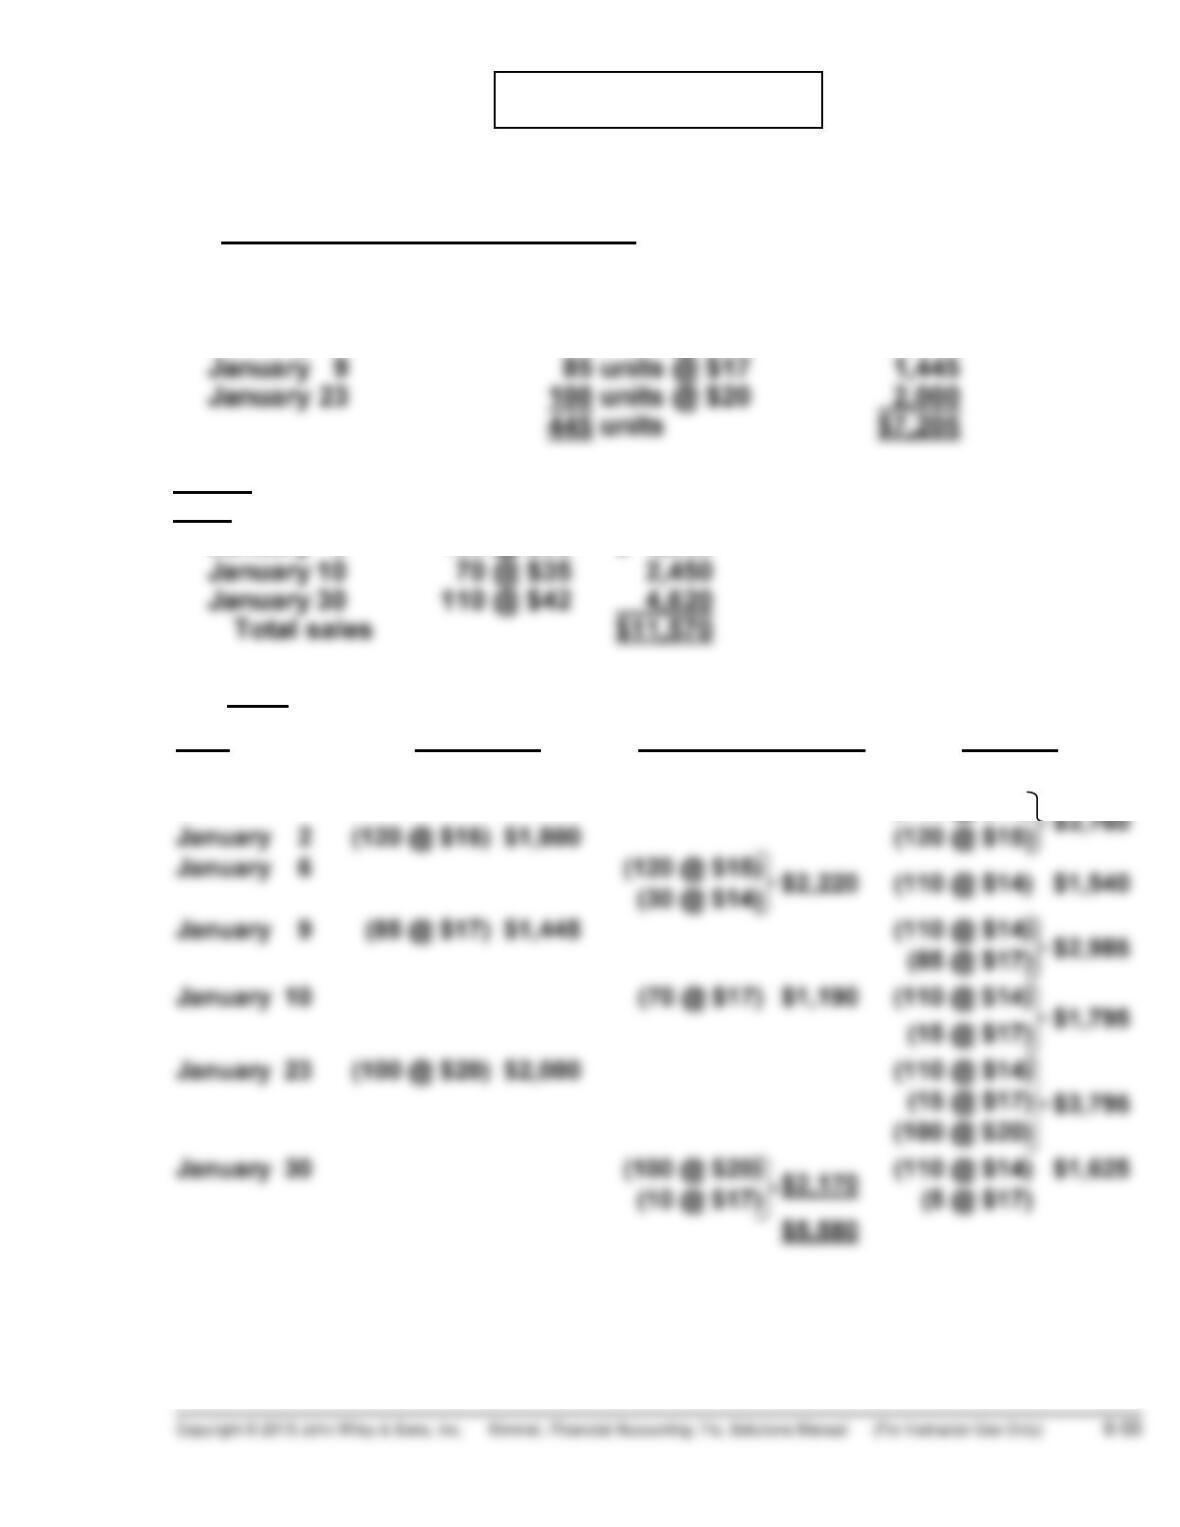
*PROBLEM 6-8B
(a)
Cost of goods available for sale:
Inventory
Purchases
140 units @ $14 $1,960
January 2 120 units @ $15 1,800
Sales:
Date
January 6 150 @ $30 $ 4,500
(1) LIFO
Date Purchases Cost of goods sold Balance
January 1 (140 @ $14) $1,960
(140 @ $14)
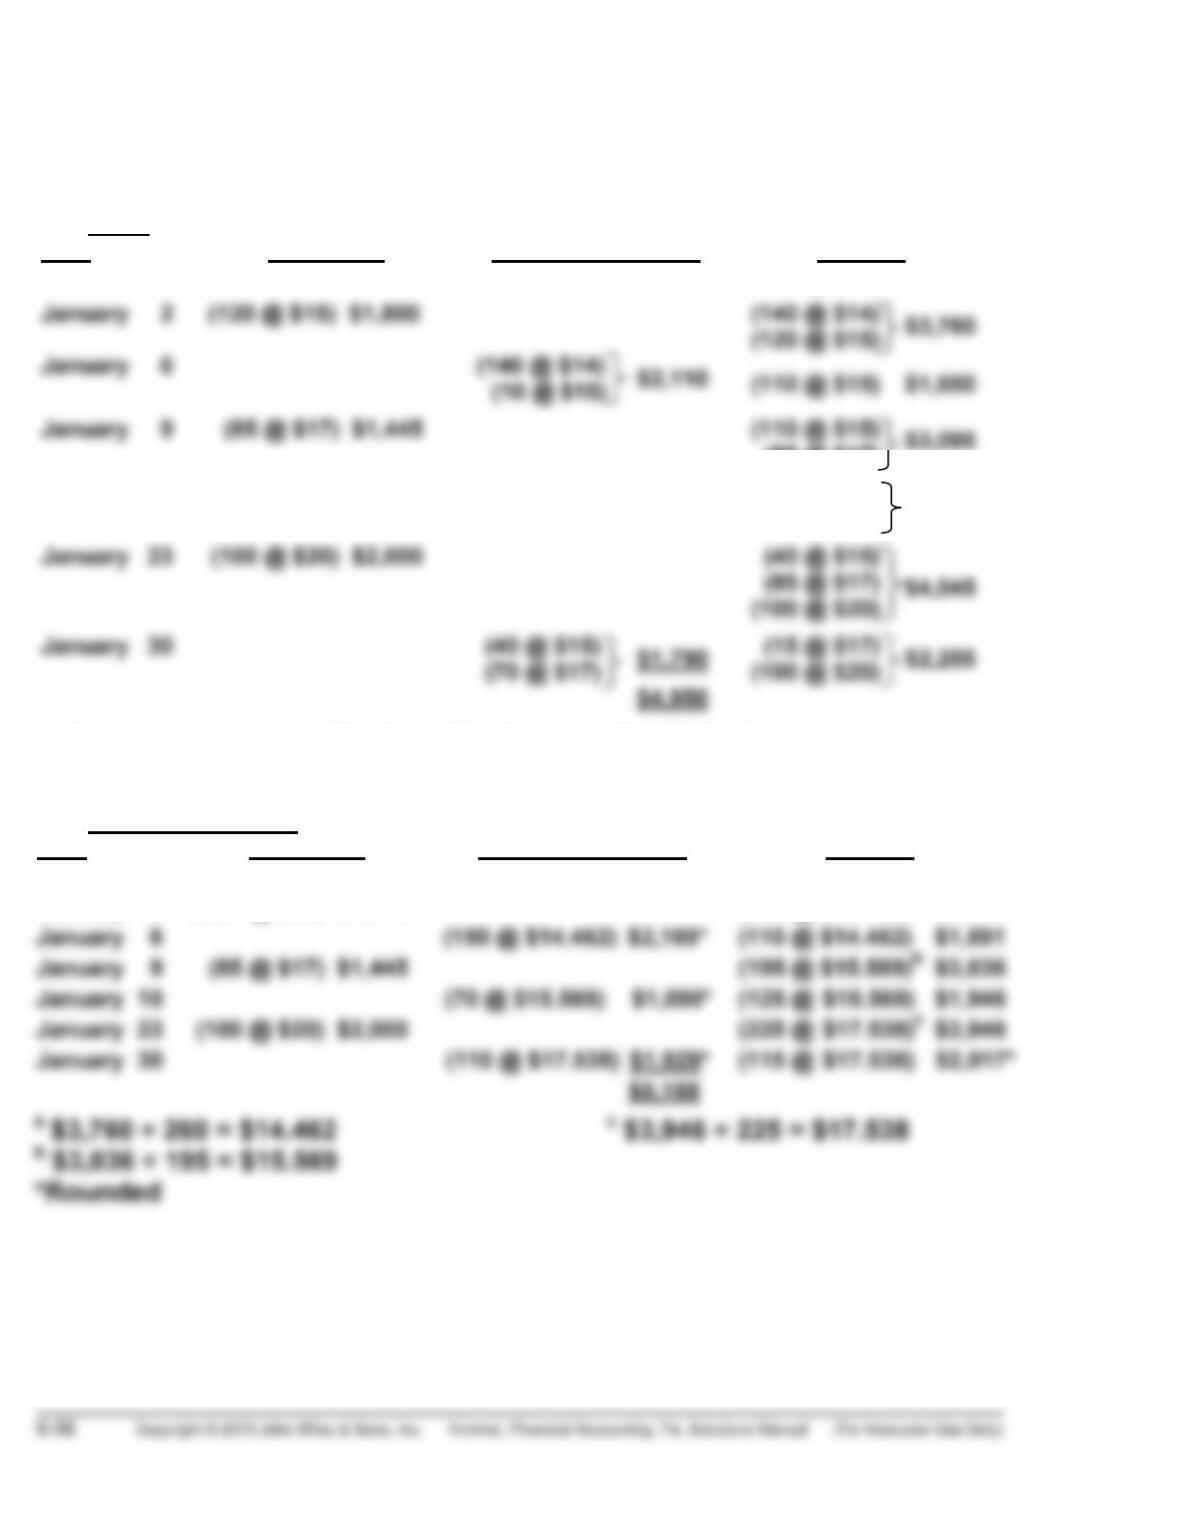
*PROBLEM 6-8B (Continued)
(i) Cost of goods sold: $7,205 – $1,625 = $5,580. (ii) Ending inventory = $1,625.
(iii) Gross profit = $11,570 – $5,580 = $5,990.
(2) FIFO
Date Purchases Cost of goods sold Balance
January 1 (140 @ $14) $1,960
(85 @ $17) $3,095
January 10 (70 @ $15) $1,050 (40 @ $15)
(85 @ $17) $2,045
(i) Cost of goods sold: $7,205 – $2,255 = $4,950. (ii) Ending inventory =
$2,255. (iii) Gross profit = $11,570 – $4,950 = $6,620.
(3) Moving-Average:
Date Purchases Cost of goods sold Balance
January 1 (140 @ $14) $1,960
January 2 (120 @ $15) $1,800 (260 @ $14.462)a $3,760
*PROBLEM 6-8B (Continued)
(i) Cost of goods sold: $7,205 – $2,017 = $5,188. (ii) Ending inventory = $2,017.
(iii) Gross profit = $11,570 – $5,188 = $6,382.
(b)
Gross profit:
LIFO FIFO
Moving-
Average
Sales $11,570 $11,570 $11,570
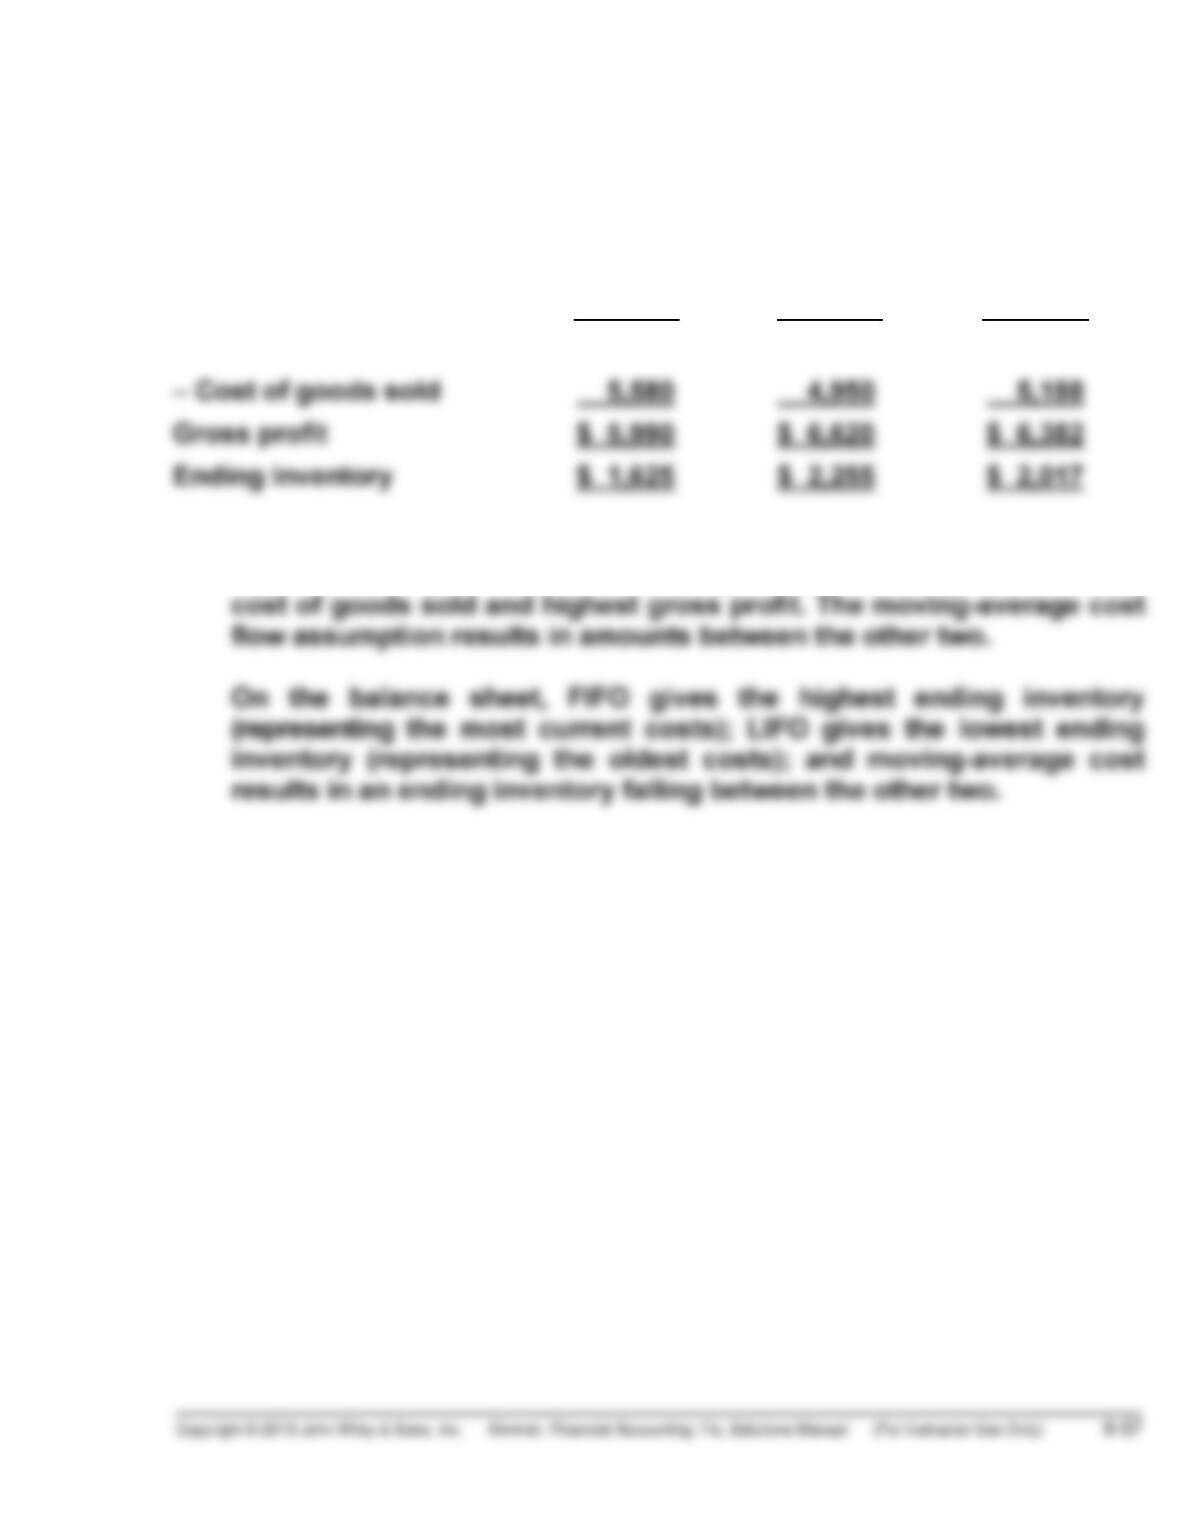
In a period of rising costs, the LIFO cost flow assumption results in the
highest cost of goods sold and lowest gross profit. FIFO gives the lowest
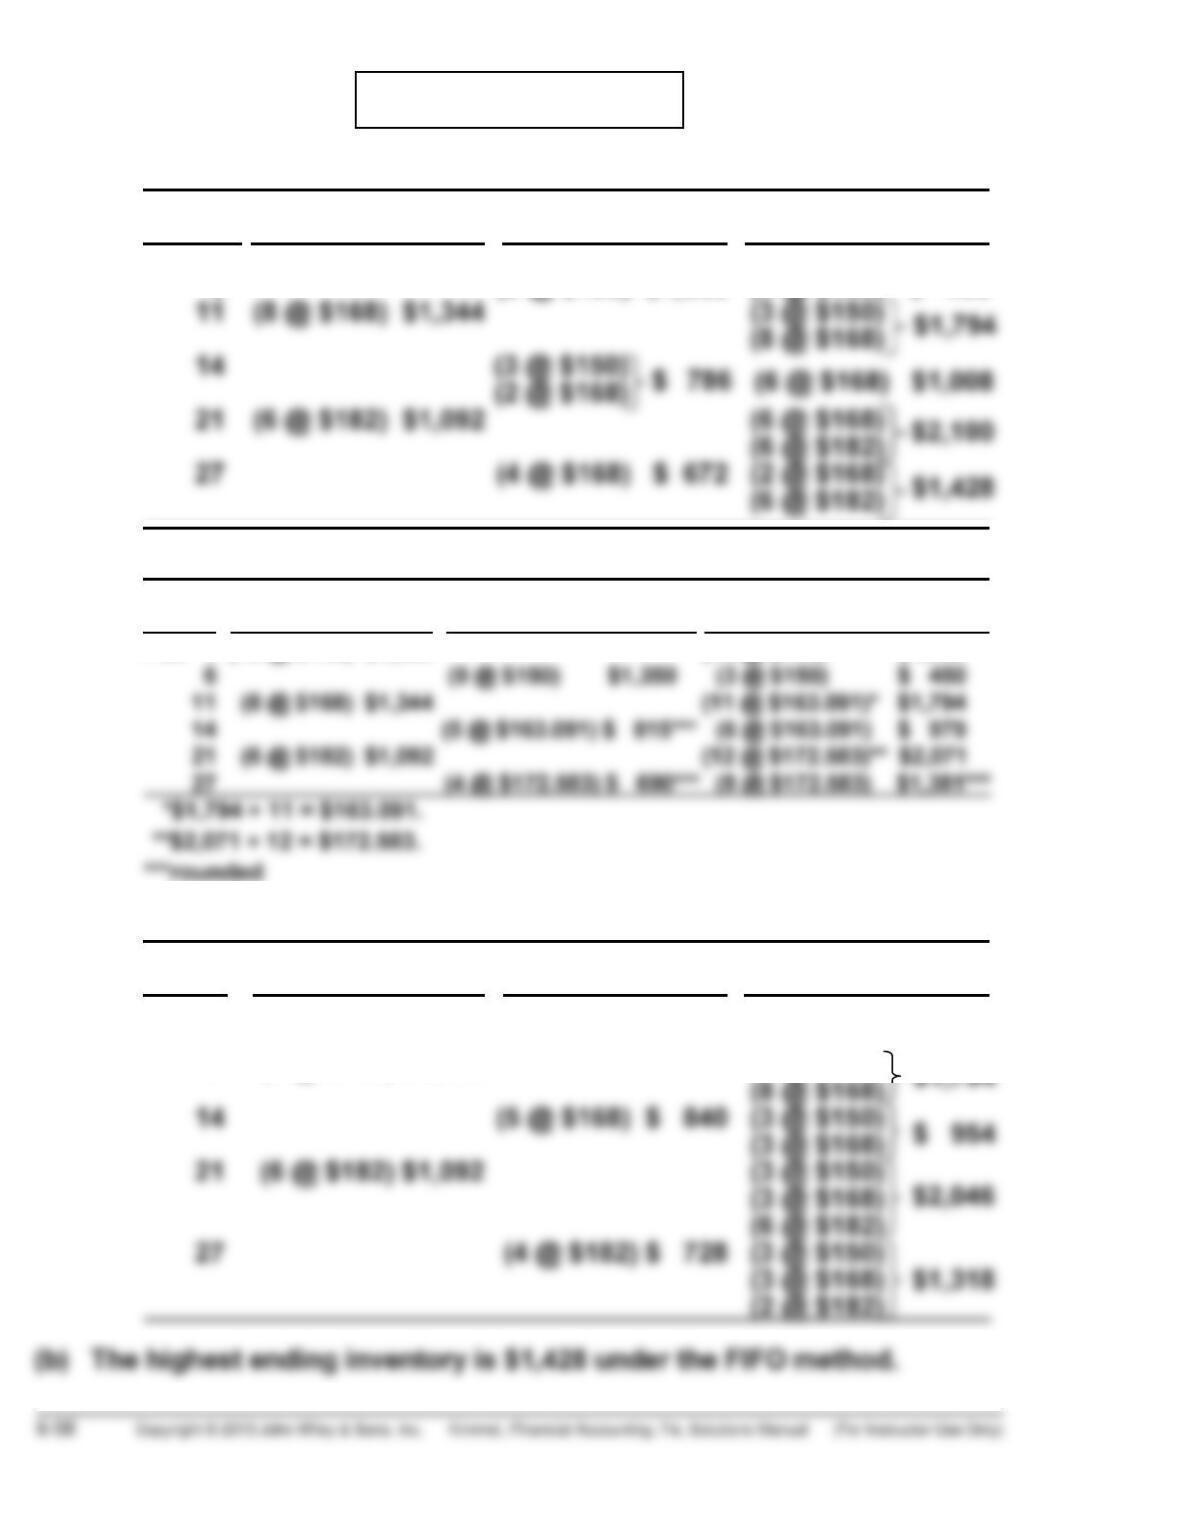
*PROBLEM 6-9B
(a) (1) FIFO
Cost of
Date Purchases Goods Sold Balance
Feb. 1 (12 @ $150) $1,800 (12 @ $150) $1,800
6 (9 @ $150) $1,350 (3 @ $150) $ 450
(2) MOVING-AVERAGE
Cost of
Date Purchases Goods Sold Balance
Feb. 1 (12 @ $150) $1,800 (12 @ $150) $1,800
(3) LIFO
Cost of
Date Purchases Goods Sold Balance
Feb. 1 (12 @ $150) $1,800 (12 @ $150) $1,800
6 (9 @ $150) $1,350 (3 @ $150) $ 450
11 (8 @ $168) $1,344 (3 @ $150)
COMPREHENSIVE PROBLEM SOLUTION
(a) Dec. 3 Inventory (4,000 X $0.72)……………………….
Accounts Payable ………………………….
2,880
2,880
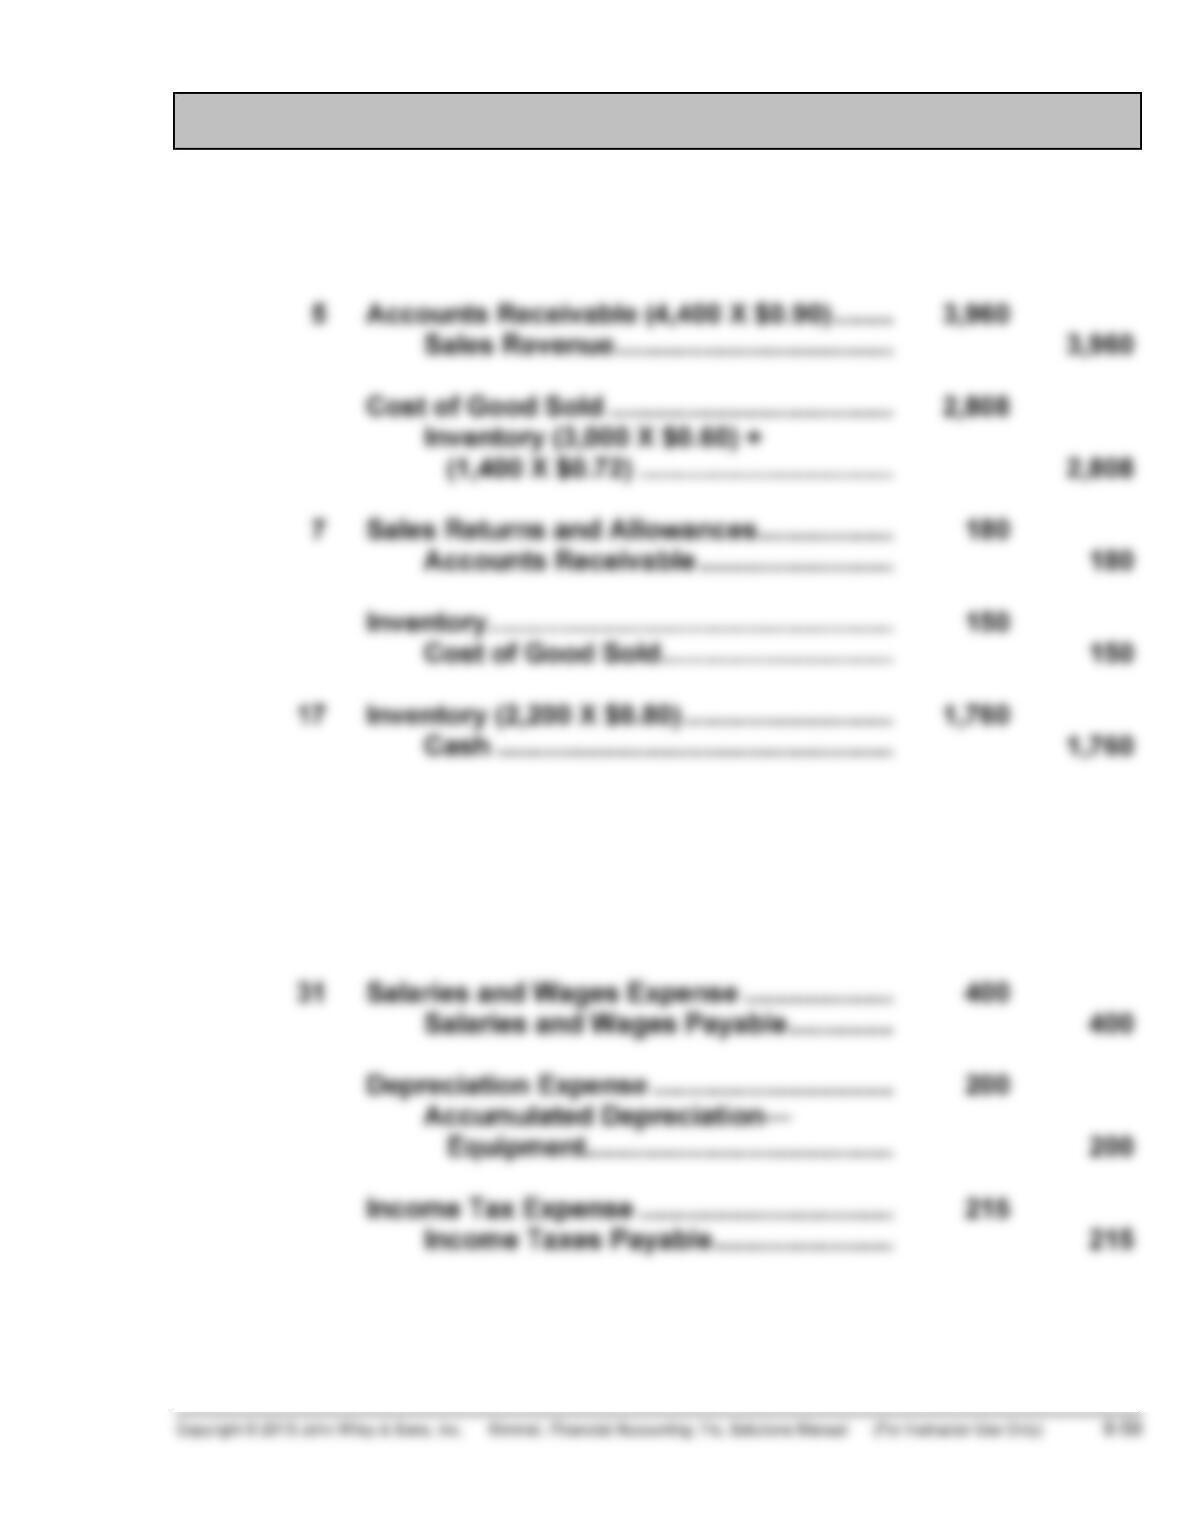
22 Accounts Receivable (2,000 X $0.95) ……..
Sales Revenue ……………………………….
Cost of Goods Sold (2,000 X $0.72) ……….
Inventory ……………………………………….
1,900
1,440
1,900
1,440
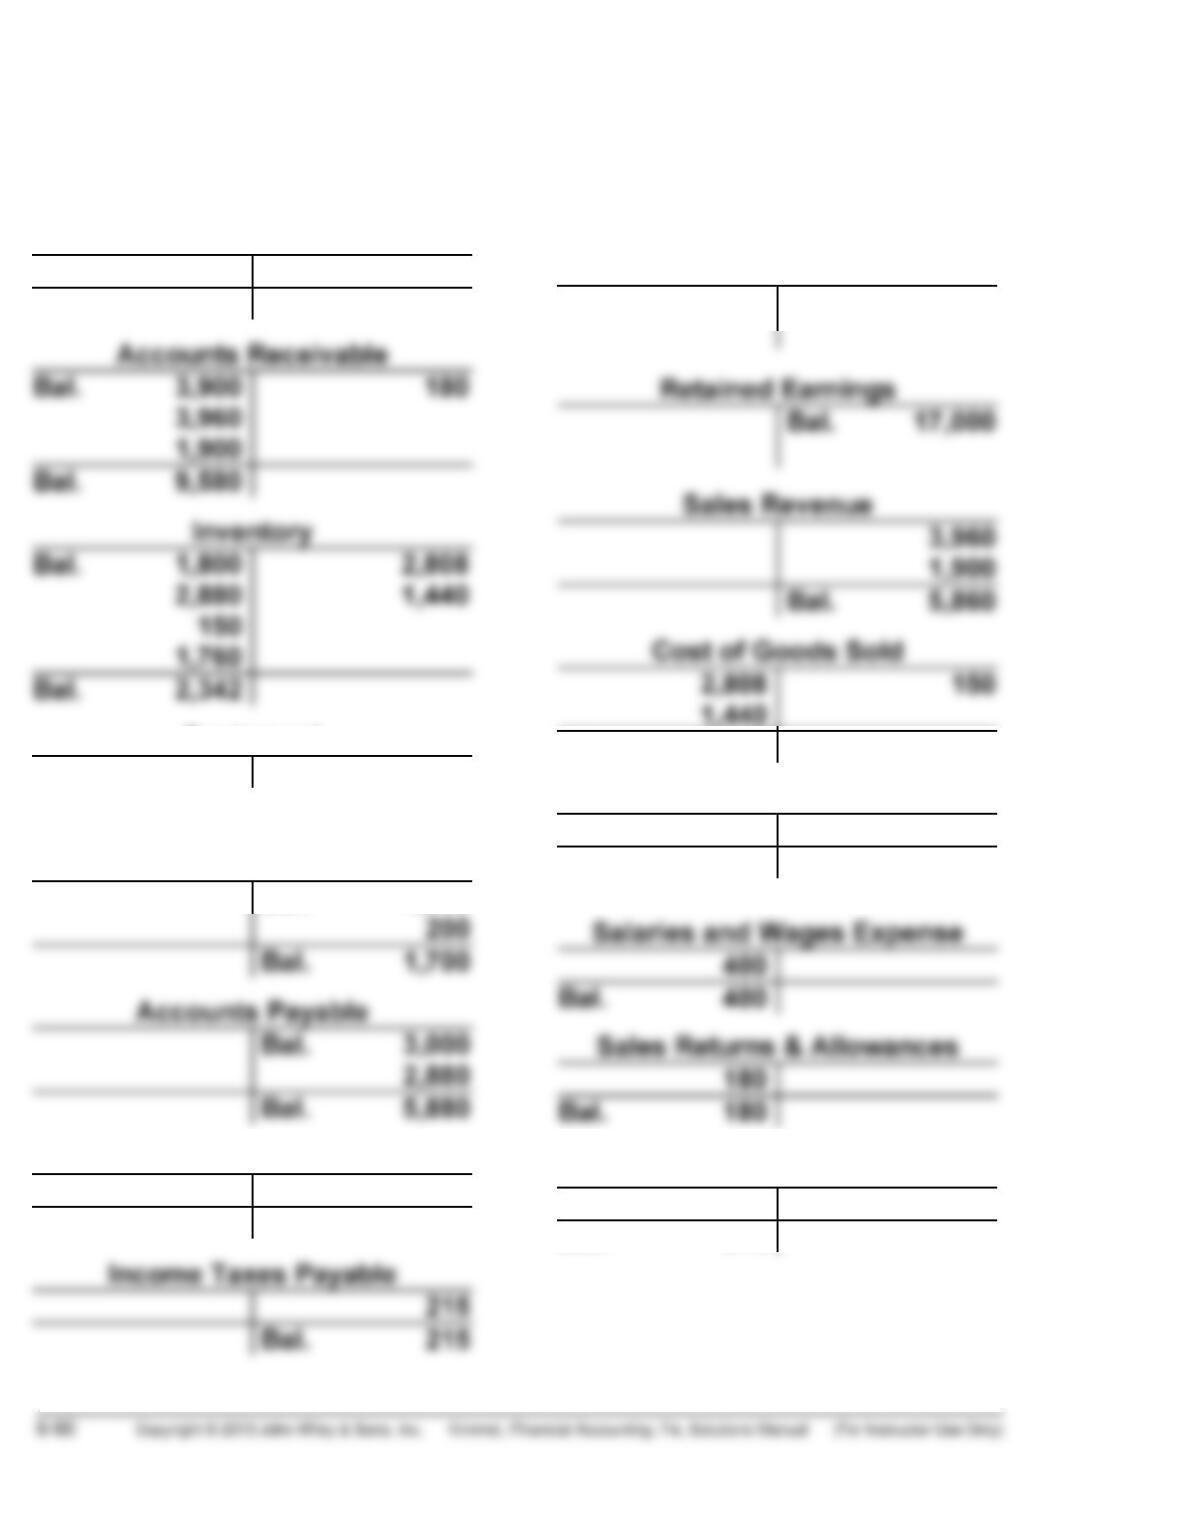
COMPREHENSIVE PROBLEM SOLUTION (Continued)
(b) General Ledger
Cash
Bal. 4,800 1,760
Bal. 3,040
Equipment
Bal. 21,000
Accumulated
Depreciation—Equipment
Bal. 1,500
Salaries and Wages Payable
400
Bal. 400
Common Stock
Bal. 10,000
Bal. 4,098
Depreciation Expense
200
Bal. 200
Income Tax Expense
215
Bal. 215