CHAPTER 20 (FIN MAN); CHAPTER 6 (MAN)
COST-VOLUME-PROFIT ANALYSIS
DISCUSSION QUESTIONS
1. Total variable costs change in proportion to changes in the level of activity. Unit variable costs
remain the same regardless of the level of activity.
2. a. Variable costs
b. Variable costs
3. Total fixed cost remains the same regardless of changes in the level of activity. Fixed cost per unit
decreases as the activity level increases and increases as the activity level decreases.
5. a. No impact on the contribution margin.
b. Operating income would decrease.
8. Austin Company had lower fixed costs and a higher percentage of variable costs to sales than
did Hill Company. Such a situation resulted in a lower break-even point for Austin Company.
9. The individual products are treated as components of one overall enterprise product. These
components are weighted by the sales mix percentages when determining the contribution margin.
Therefore, the sales mix affects the contribution margin and thus the break-even point.
10. Operating leverage measures the relationship between a company’s contribution margin and
operating income. The difference between contribution margin and operating income is fixed
costs. Thus, companies with high fixed costs will normally have a high operating leverage. Low
CHAPTER 20 (FIN MAN); CHAPTER 6 (MAN) Cost-Volume-Profit Analysis
BASIC EXERCISES
BE 20–1 (FIN MAN); BE 6–1 (MAN)
BE 20–2 (FIN MAN); BE 6–2 (MAN)
a.
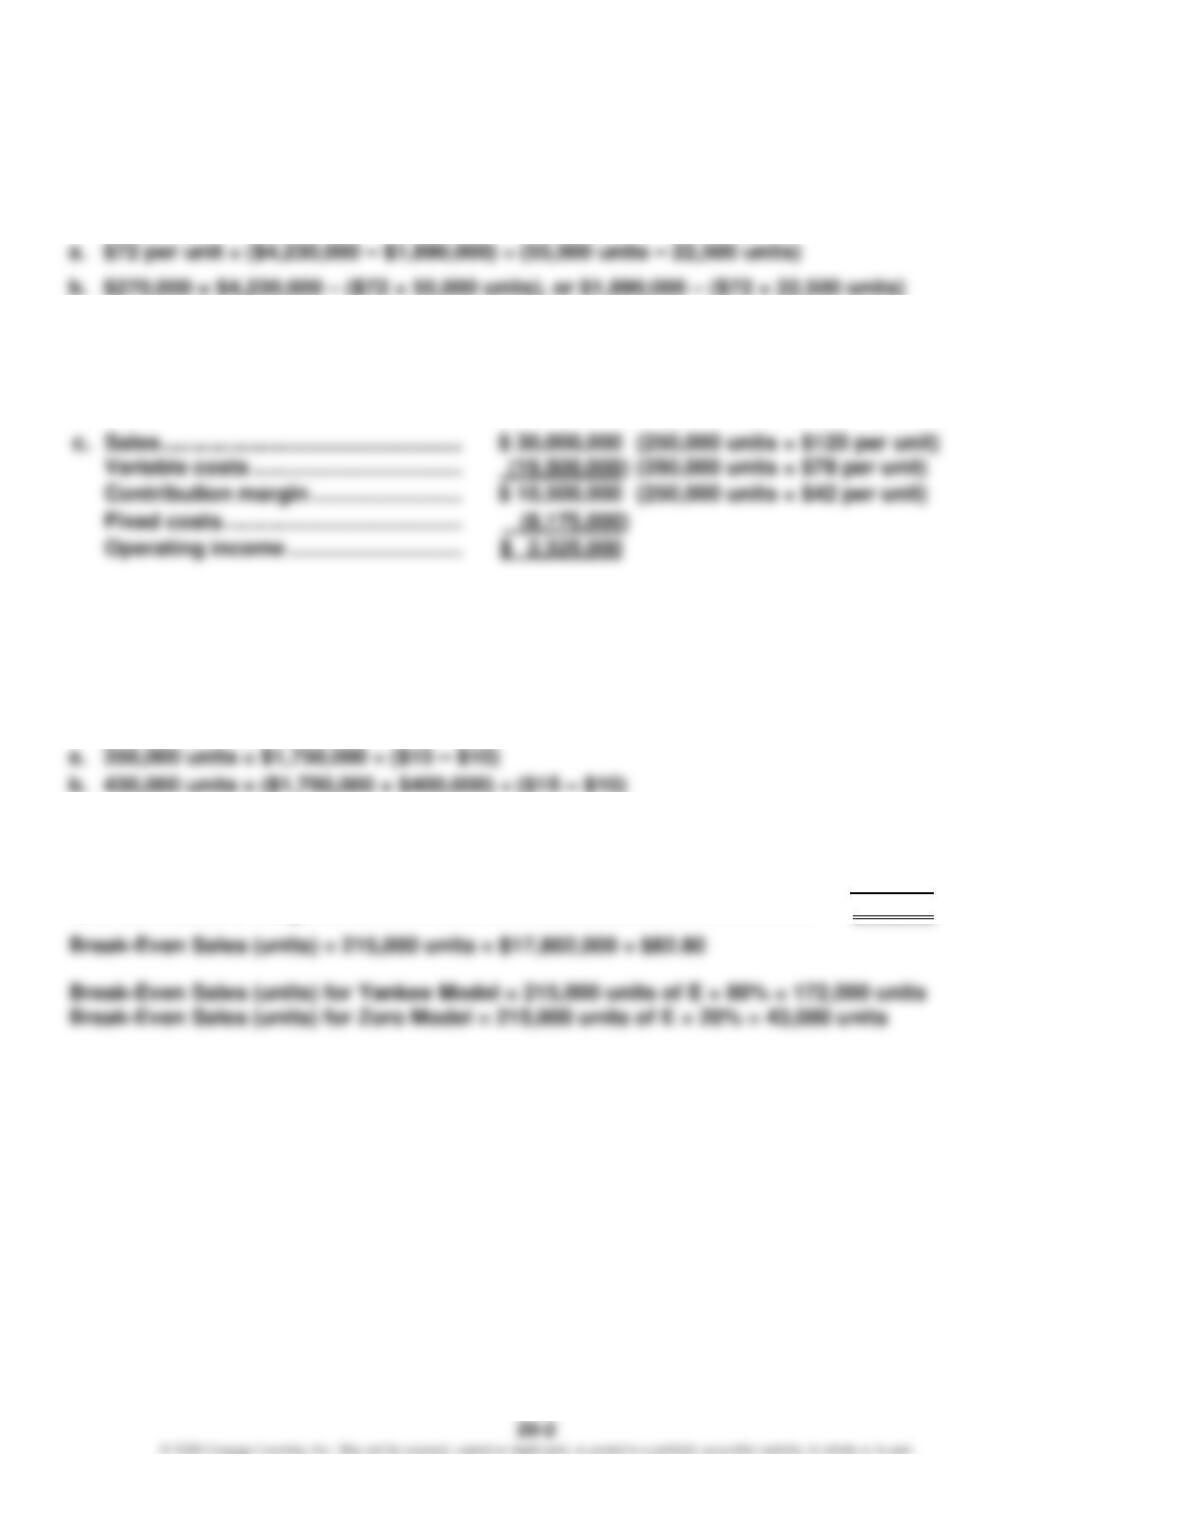
35% = ($120 – $78) ÷ $120, or ($30,000,000 – $19,500,000) ÷ $30,000,000
b.
$42 per unit = $120 – $78
Sales …………………………………………..
(250,000 units × $120 per unit)
Variable costs ……………………………..
(250,000 units × $78 per unit)
Fixed costs ………………………………….
Operating income ………………………..
BE 20–3 (FIN MAN); BE 6–3 (MAN)
a. 22,000 units = $4,290,000 ÷ ($650 – $455)
b. 21,450 units = $4,290,000 ÷ ($655 – $455)
BE 20–4 (FIN MAN); BE 6–4 (MAN)
BE 20–5 (FIN MAN); BE 6–5 (MAN)
Unit selling price of E [($180 × 0.80) + ($225 × 0.20)] ……………………………….
$ 189.00
Unit variable cost of E [($99 × 0.80) + ($135 × 0.20)] ………………………………..
(106.20)
Unit contribution margin of E ………………………………………………………………..
$ 82.80
CHAPTER 20 (FIN MAN); CHAPTER 6 (MAN) Cost-Volume-Profit Analysis
BE 20–6 (FIN MAN); BE 6–6 (MAN)
BE 20–7 (FIN MAN); BE 6–7 (MAN)
– Sales – Sales at Break Even Point
Margin of safety = Sales
($380,000,000 – $323,000,000) $57,000,000
= = = 15%
$380,000,000 $380,000,000
CHAPTER 20 (FIN MAN); CHAPTER 6 (MAN) Cost-Volume-Profit Analysis
EXERCISES
Ex. 20–1 (FIN MAN); Ex. 6–1 (MAN)
1.
Variable
9.
Mixed
2.
Variable
10.
Mixed
3.
Fixed
11.
Fixed
4.
Fixed
12.
Variable
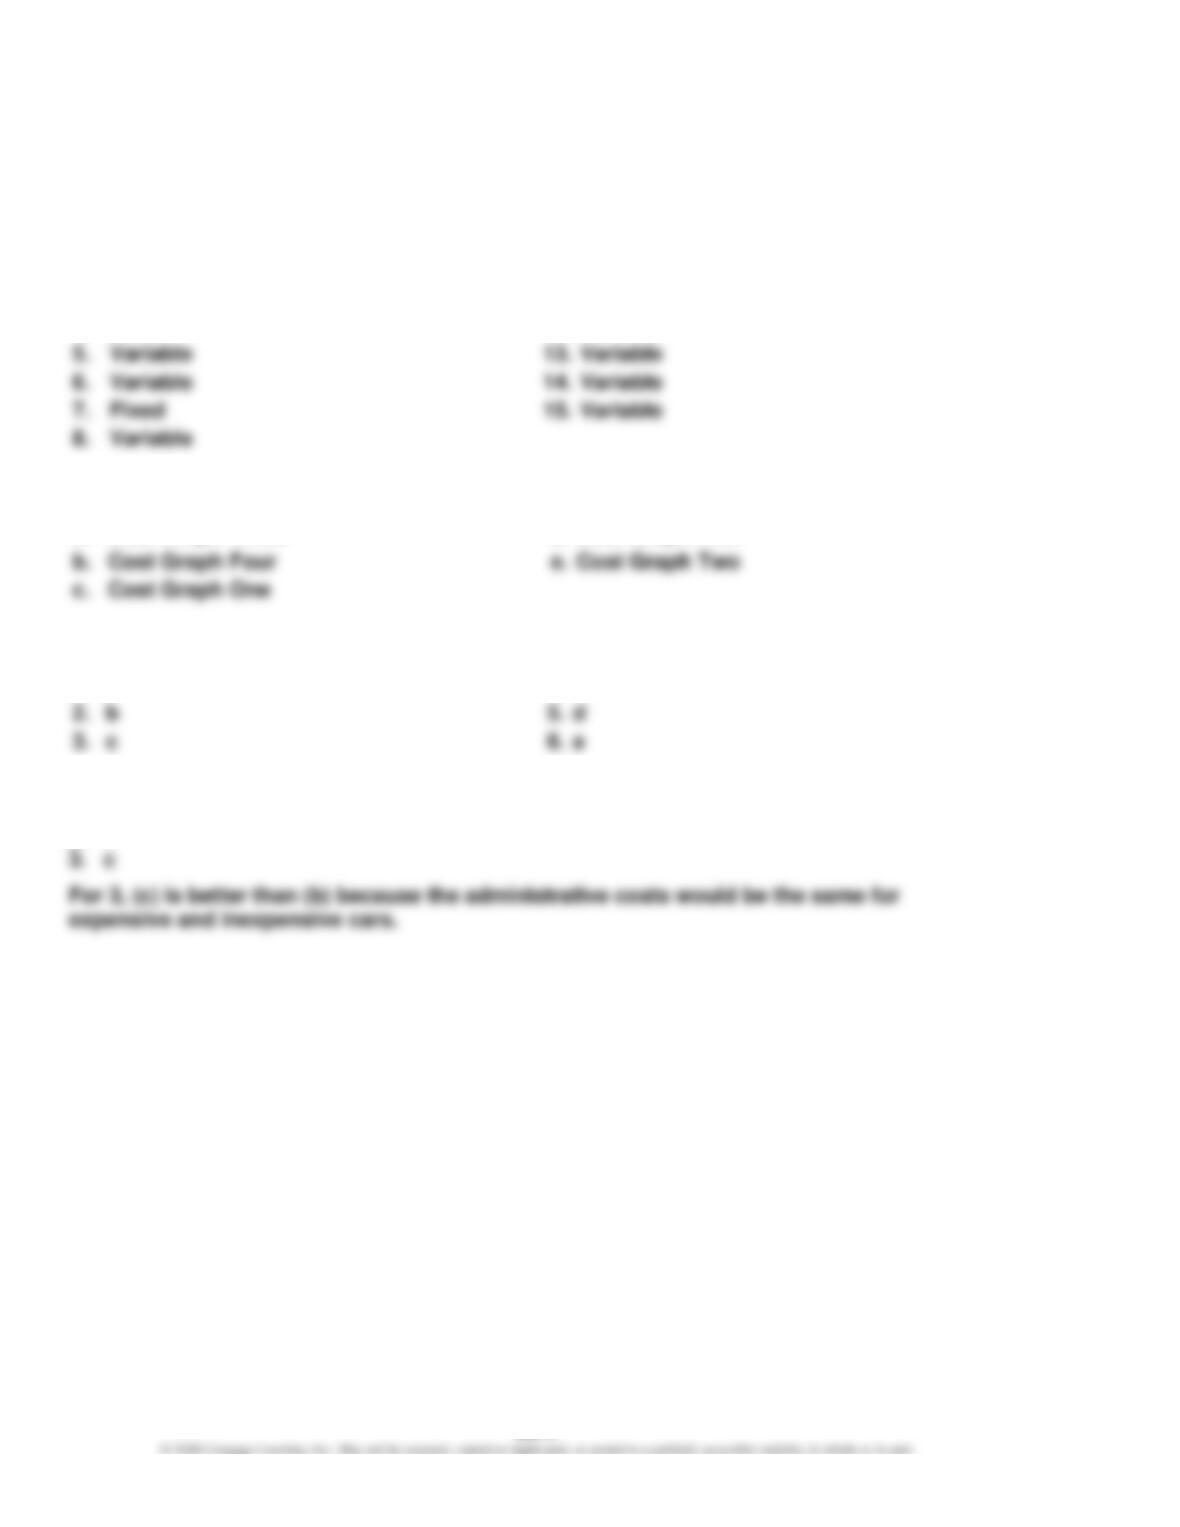
5.
Variable
13.
Variable
6.
Variable
14.
Variable
7.
Fixed
15.
Variable
Ex. 20–2 (FIN MAN); Ex. 6–2 (MAN)
a.
Cost Graph Three
d.
Cost Graph Two
Ex. 20–3 (FIN MAN); Ex. 6–3 (MAN)
1.
e
4.
f
2.
b
d
Ex. 20–4 (FIN MAN); Ex. 6–4 (MAN)
1. e
2. f
CHAPTER 20 (FIN MAN); CHAPTER 6 (MAN) Cost-Volume-Profit Analysis
Ex. 20–5 (FIN MAN); Ex. 6–5 (MAN)
a.
Variable
g.
Fixed*
b.
Variable
h.
Fixed
d.
Variable
Variable
* The developer salaries are fixed because they are more variable to the number of titles or releases rather
than the number of units sold. For example, a title could sell one copy or a million copies, and the salaries
of the developers would not be affected.
Ex. 20–6 (FIN MAN); Ex. 6–6 (MAN)
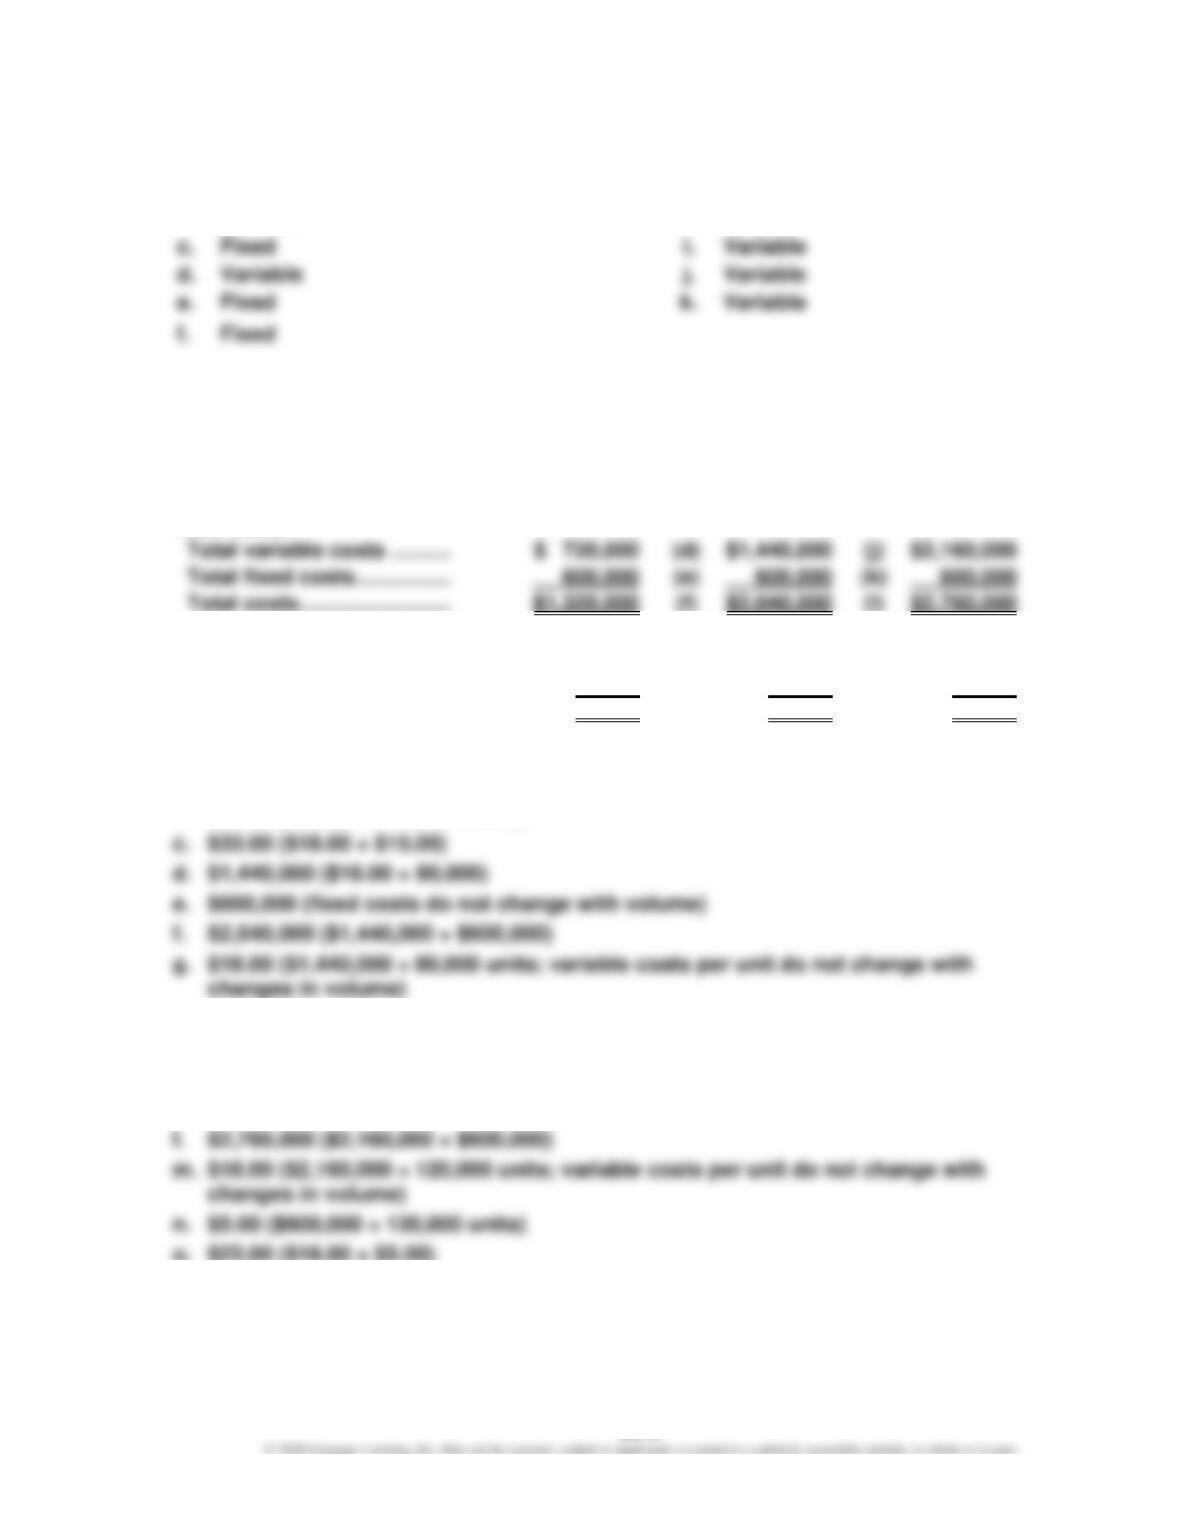
Toys produced ………………..
40,000
80,000
120,000
Total costs:
Cost per unit:
Variable cost per unit……..
(a)
$18.00
(g)
$18.00
(m)
$18.00
Fixed cost per unit …………
(b)
15.00
(h)
7.50
(n)
5.00
Total cost per unit ………….
(c)
$33.00
(i)
$25.50
(o)
$23.00
Supporting calculations:
a. $18.00 ($720,000 ÷ 40,000 units)
b. $15.00 ($600,000 ÷ 40,000 units)
h. $7.50 ($600,000 ÷ 80,000 units)
I. $25.50 ($18.00 + $7.50)
j. $2,160,000 ($18.00 × 120,000 units)
k. $600,000 (fixed costs do not change with volume)
CHAPTER 20 (FIN MAN); CHAPTER 6 (MAN) Cost-Volume-Profit Analysis
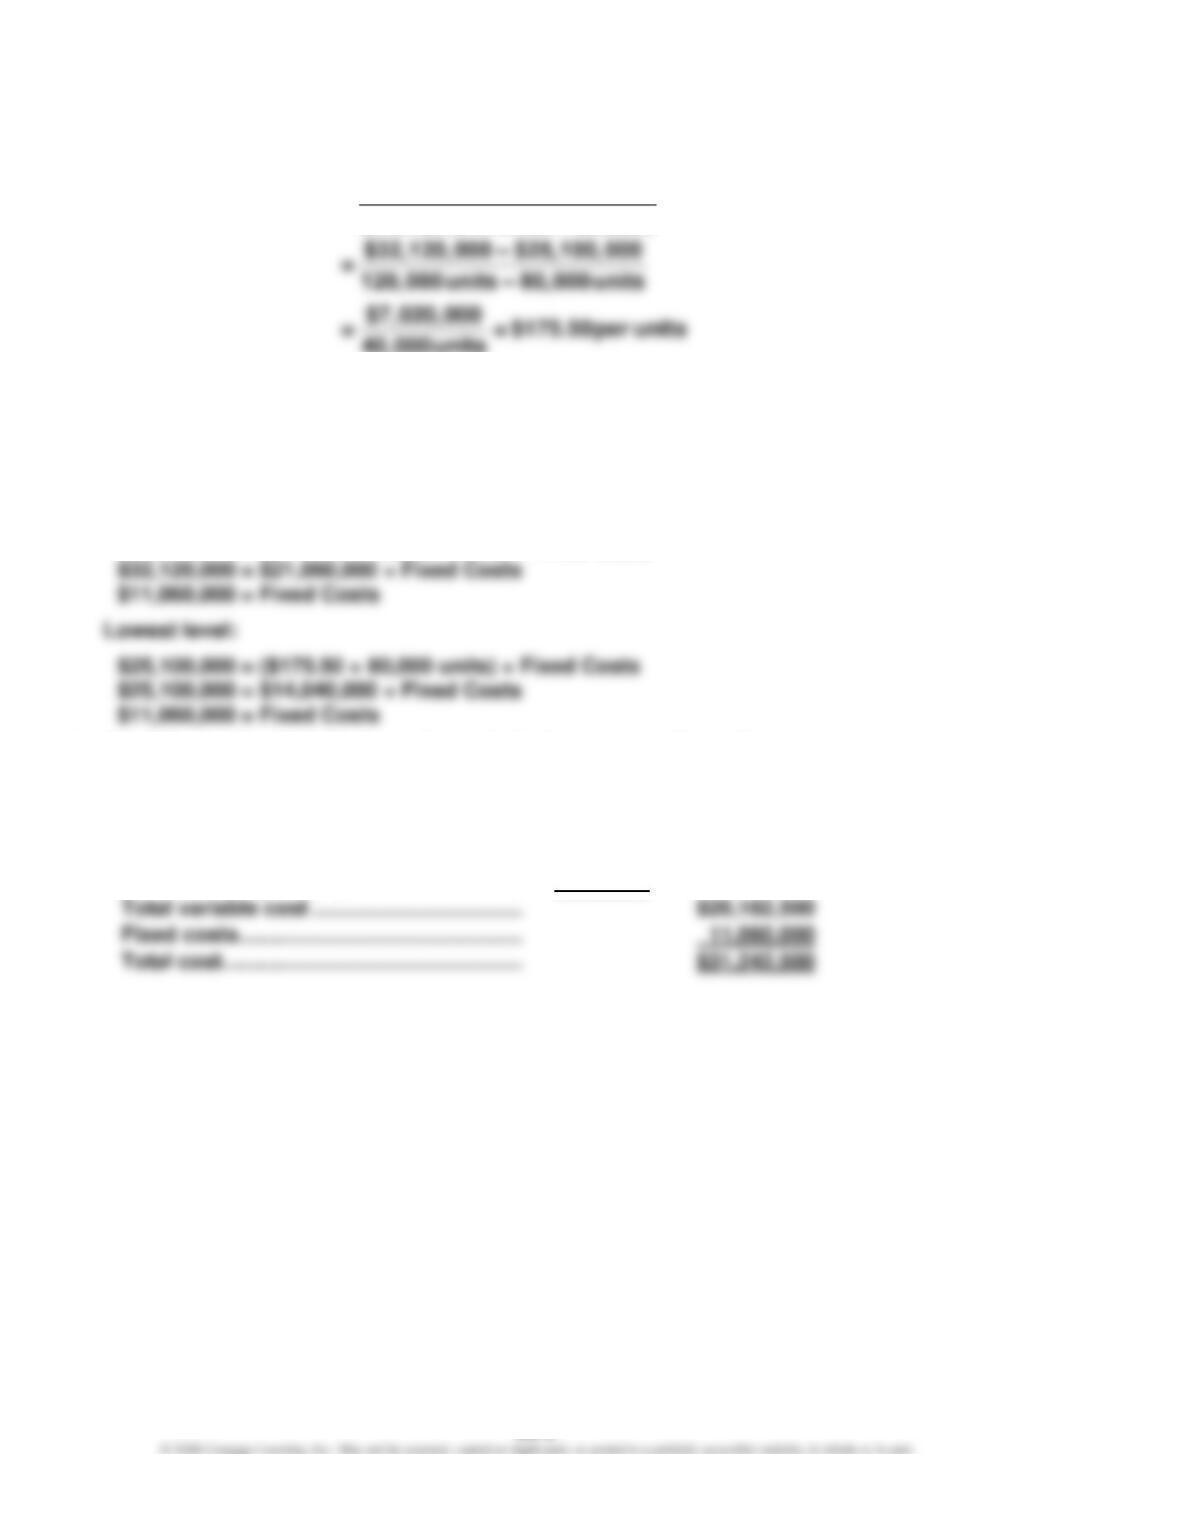
Ex. 20–7 (FIN MAN); Ex. 6–7 (MAN)
a.
Difference in Total Costs
Variable Cost per Unit = Difference in Units Produced
40,000units
The fixed cost can be determined by subtracting the estimated total variable
cost from the total cost at either the highest or lowest level of production, as
follows:
Total Cost = (Variable Cost per Unit × Units Produced) + Fixed Costs
Highest level:
$32,120,000 = ($175.50 × 120,000 units) + Fixed Costs
b. Total Cost = (Variable Cost per Unit × Units Produced) + Fixed Costs
Total cost for 115,000 units:
Variable cost:
Units …………………………………………………
115,000
Variable cost per unit …………………………
× $175.50
Total variable cost ……………………………..
Fixed costs ………………………………………..
Total cost …………………………………………..
CHAPTER 20 (FIN MAN); CHAPTER 6 (MAN) Cost-Volume-Profit Analysis
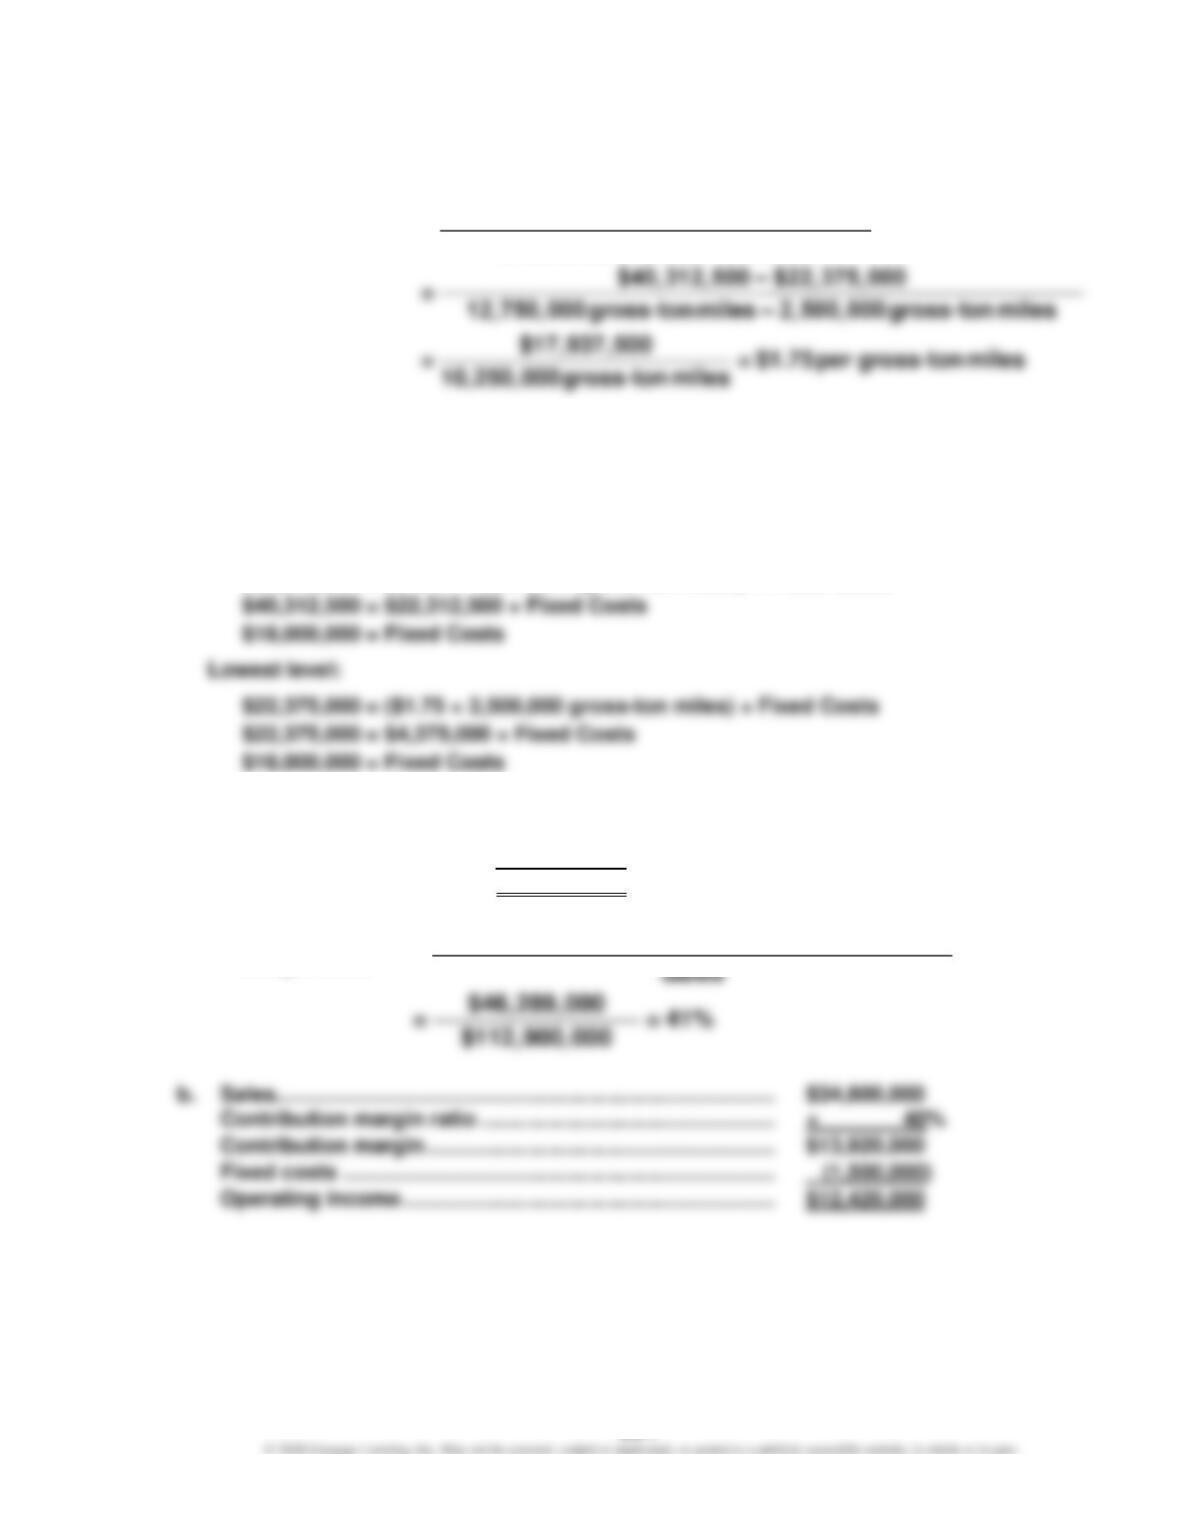
Ex. 20–8 (FIN MAN); Ex. 6–8 (MAN)
Variable Cost per
–
Difference in Total Costs
=Difference in Gross Ton Miles
Gross-Ton Mile
The fixed costs can be determined by subtracting the estimated total variable
cost from the total cost at either the highest or lowest level of gross-ton mile,
as follows:
Total Cost = (Variable Cost per Gross-Ton Mile × Gross-Ton Miles) + Fixed Costs
Highest level:
$40,312,500 = ($1.75 × 12,750,000 gross-ton miles) + Fixed Costs
Ex. 20–9 (FIN MAN); Ex. 6–9 (MAN)
a.
Sales ………………………….
$112,900,000
Variable costs …………….
(66,611,000)
Contribution margin ……
$ 46,289,000
Contribution
Sales – Variable Costs
=Sales
Contribution margin ratio ………………………………………….
Contribution margin ………………………………………………….
Fixed costs ………………………………………………………………
Operating income ……………………………………………………..
Margin Ratio

CHAPTER 20 (FIN MAN); CHAPTER 6 (MAN) Cost-Volume-Profit Analysis
Ex. 20–10 (FIN MAN); Ex. 6–10 (MAN)
a.
Sales (in millions) ………………………………………………………………………….
$15,295.0
Contribution margin (in millions) ……………………………………………………
Variable costs (in millions):
b.
Sales – Variales Costs
Contribution Margin Ratio = Sales
$5,310.1 million
= = 34.7%
$15,295.0 million
the computation.
Ex. 20–11 (FIN MAN); Ex. 6–11 (MAN)
a.
–Fixed Costs
Break Even Sales (units) = Units Contribution Margin
$27,600,000
= = 80,000units
$1,150 – $805
CHAPTER 20 (FIN MAN); CHAPTER 6 (MAN) Cost-Volume-Profit Analysis
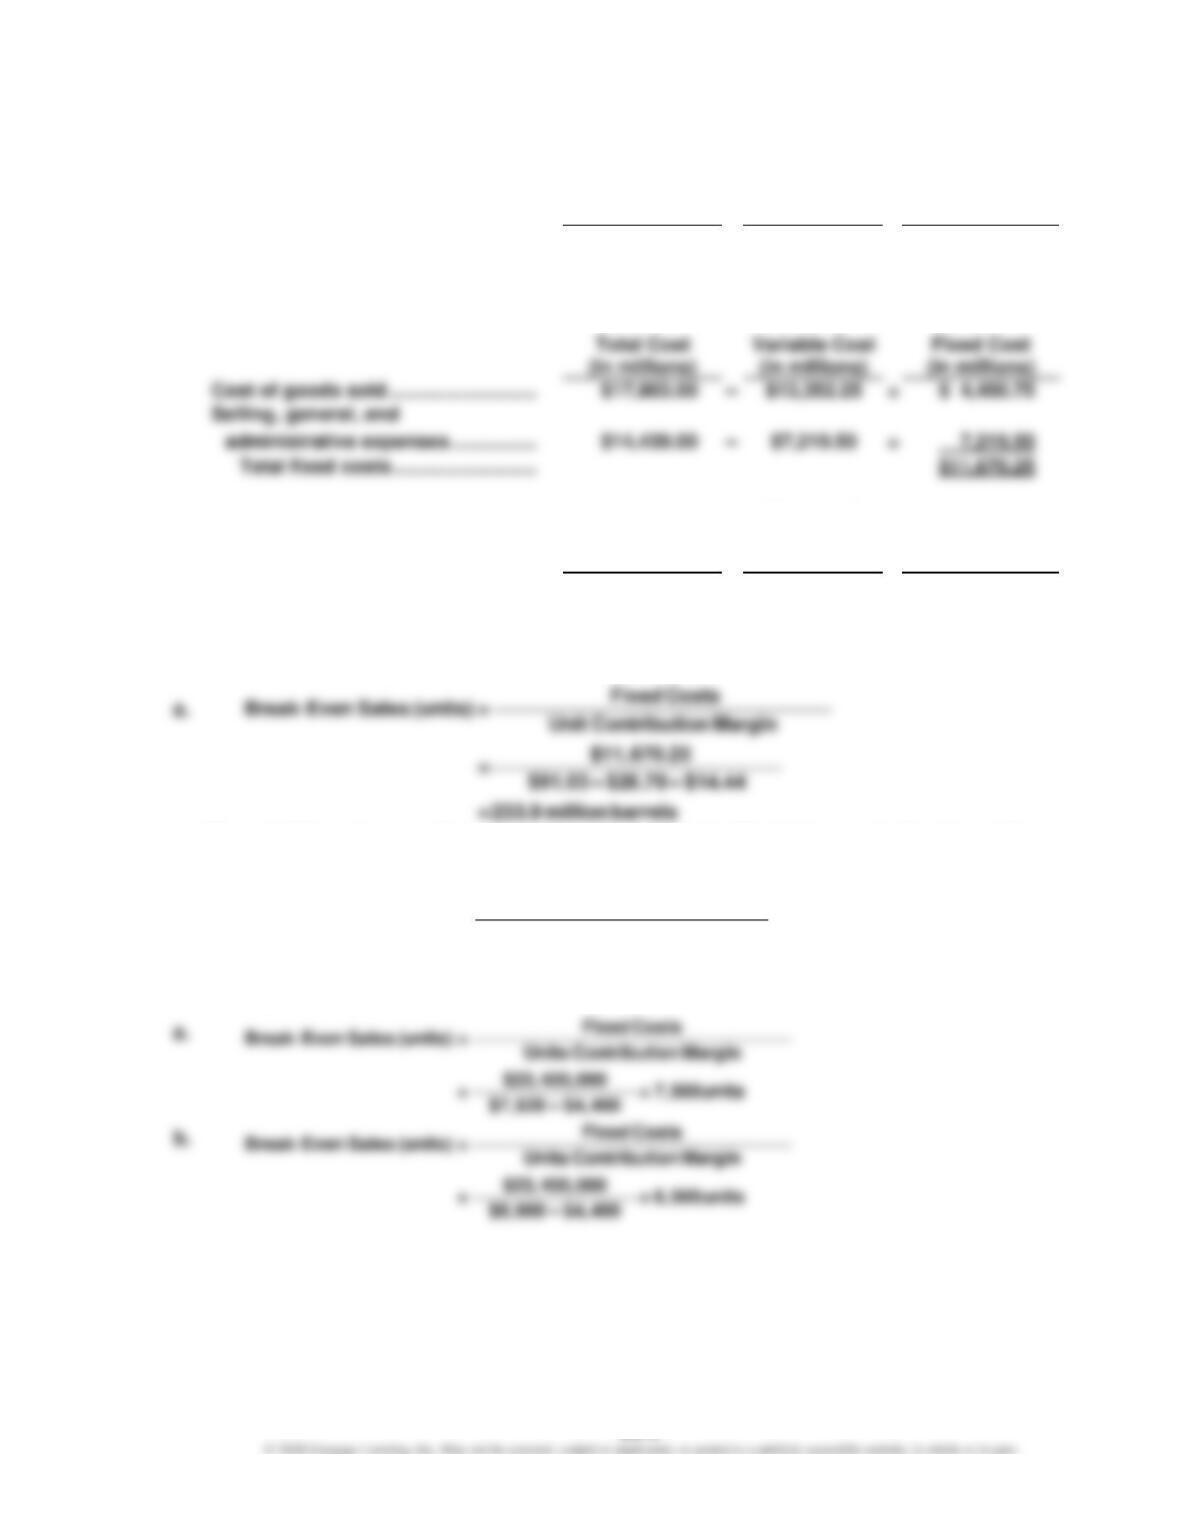
Ex. 20–12 (FIN MAN); Ex. 6–12 (MAN)
Total Cost
(in millions)
Variable Cost
Percentage
Variable Cost
(in millions)
Cost of goods sold ……………………….
$17,803.00
×
75%
=
$13,352.25
Selling, general, and
administrative expenses …………….
$14,439.00
×
50%
=
$7,219.50
(in millions)
(in millions)
(in millions)
Number of
Barrels
(in millions)
Per-Barrel
Amount
Total Amount
(in millions)
Sales ……………………………………………
$45,517.00
÷
500
=
$91.03
Variable cost of goods sold ………….
$13,352.25
÷
500
=
26.70
Variable selling, general, and
administrative expenses …………….
$7,219.50
÷
500
=
14.44
The variable costs per unit are determined by multiplying the total amount of each cost by
the variable cost percentage (75% for cost of goods sold and 50% for selling, general, and
administrative expenses), then dividing by the number of barrels.
b.
–––
$11,670.25 + $400.00
Break Even Sales (units) = $91.03 $26.70 $14.44
= 241.9 million barrels
Ex. 20–13 (FIN MAN); Ex. 6–13 (MAN)
CHAPTER 20 (FIN MAN); CHAPTER 6 (MAN) Cost-Volume-Profit Analysis
Ex. 20–14 (FIN MAN); Ex. 6–14 (MAN)
–Fixed Costs
Break Even Sales (units)= Units Contribution Margin
Ex. 20–15 (FIN MAN); Ex. 6–15 (MAN)
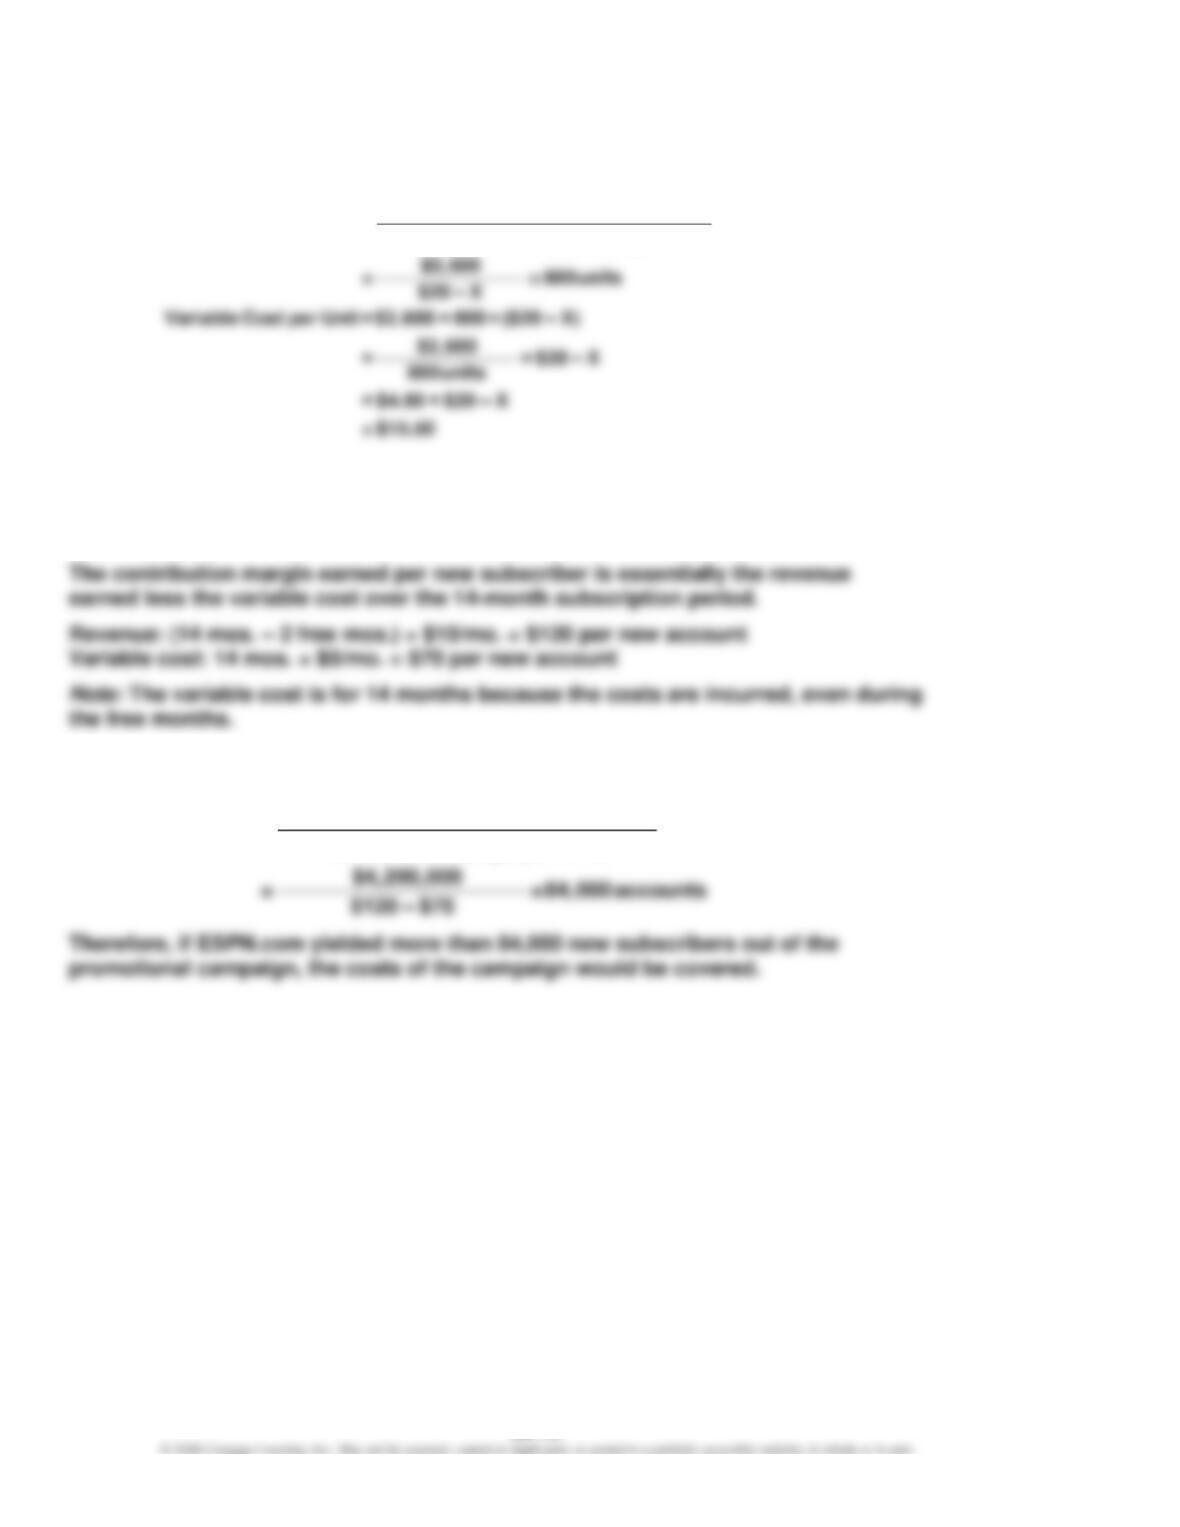
The cost of the promotional campaign is the fixed cost in this analysis because
we’re trying to determine the break-even adoption rate of the campaign.
The break-even number of subscribers necessary to cover the fixed cost of the
promotion would be computed as follows:
–Fixed Costs
Break Even = Contribution Margin per Units
CHAPTER 20 (FIN MAN); CHAPTER 6 (MAN) Cost-Volume-Profit Analysis
Ex. 20–16 (FIN MAN); Ex. 6–16 (MAN)
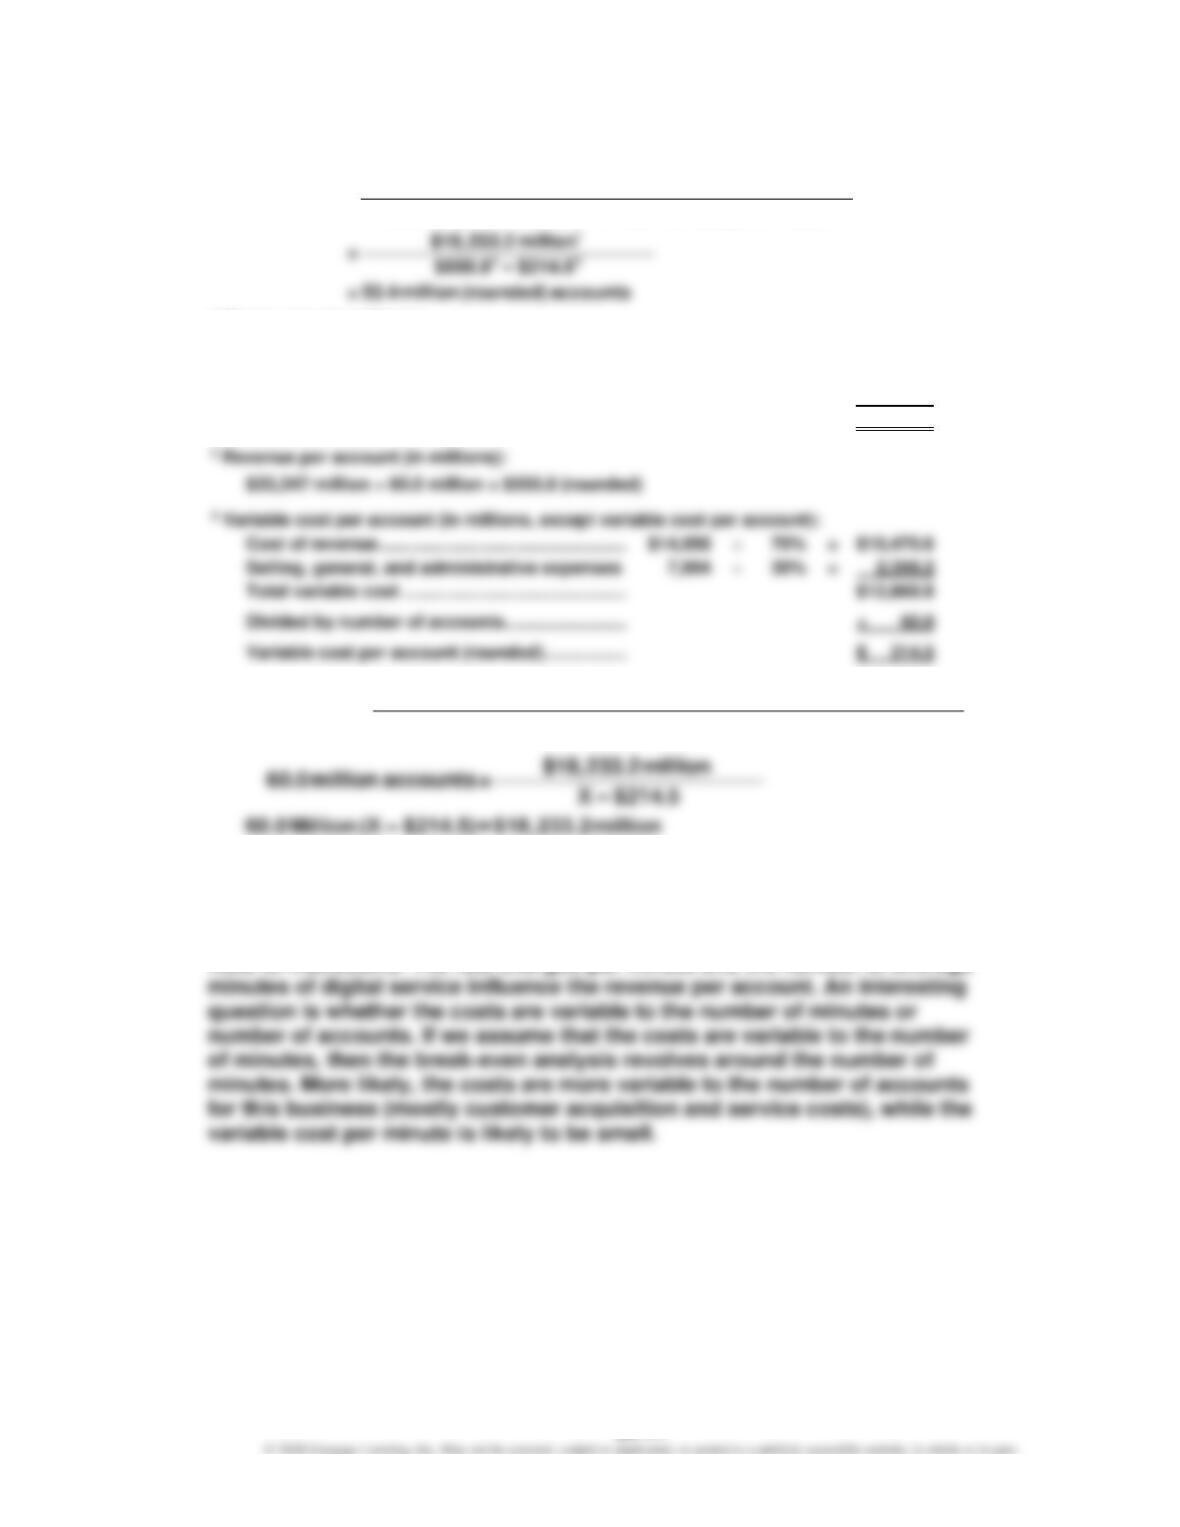
a.
–
Fixed Costs
Break Even= Revenue per Accounts – Variable Costs per Account
1 Fixed costs (in millions):
Cost of revenue ……………………………………………
$14,958
×
30%
=
$ 4,487.4
Selling, general, and administrative expenses
7,994
×
70%
=
5,595.8
Depreciation and amortization ……………………..
8,150
×
100%
=
8,150.0
Total fixed costs…………………………………………..
$18,233.2
Cost of revenue ……………………………………………
$14,958
70%
=
Selling, general, and administrative expenses
7,994
30%
=
Divided by number of accounts…………………….
Variable cost per account (rounded) ……………..
b.
–Fixed Cost
Break Even= Revenue per Account – Variable Cost per Account
60.0X – $12,870.0 =$18,233.2million
60.0X =$31,103.2
X =$518.4(rounded)
CHAPTER 20 (FIN MAN); CHAPTER 6 (MAN) Cost-Volume-Profit Analysis
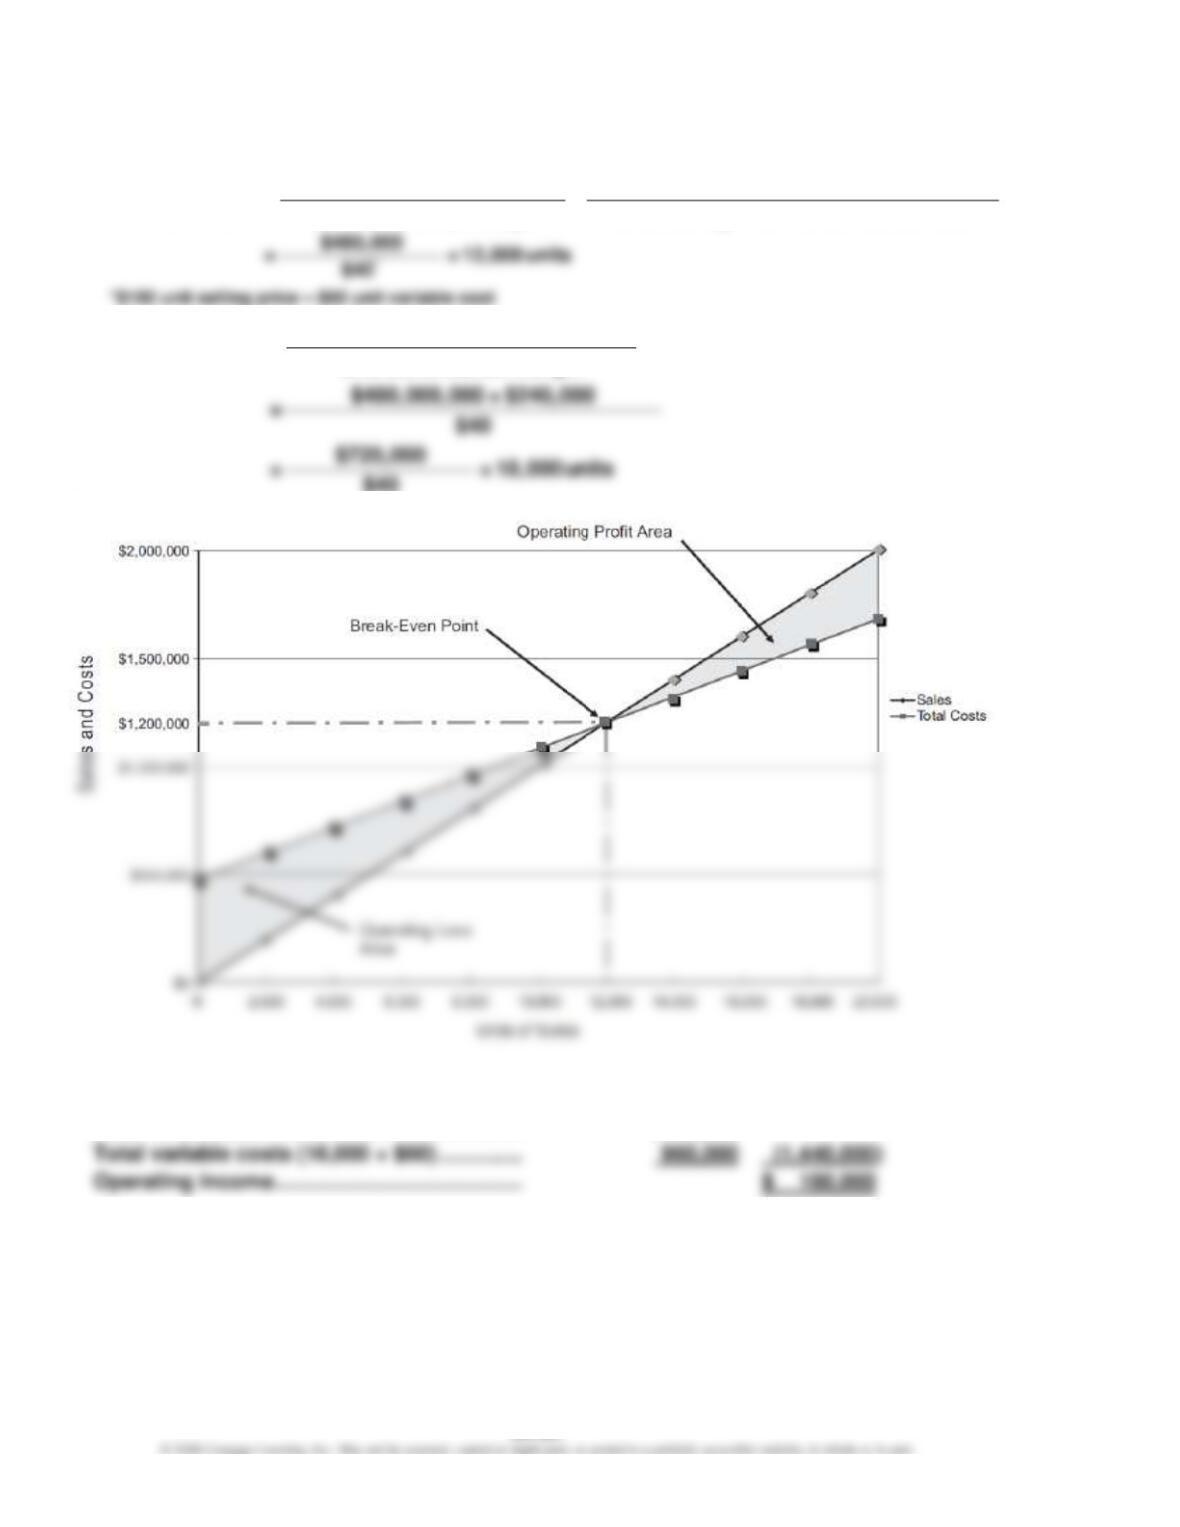
Ex. 20–17 (FIN MAN); Ex. 6–17 (MAN)
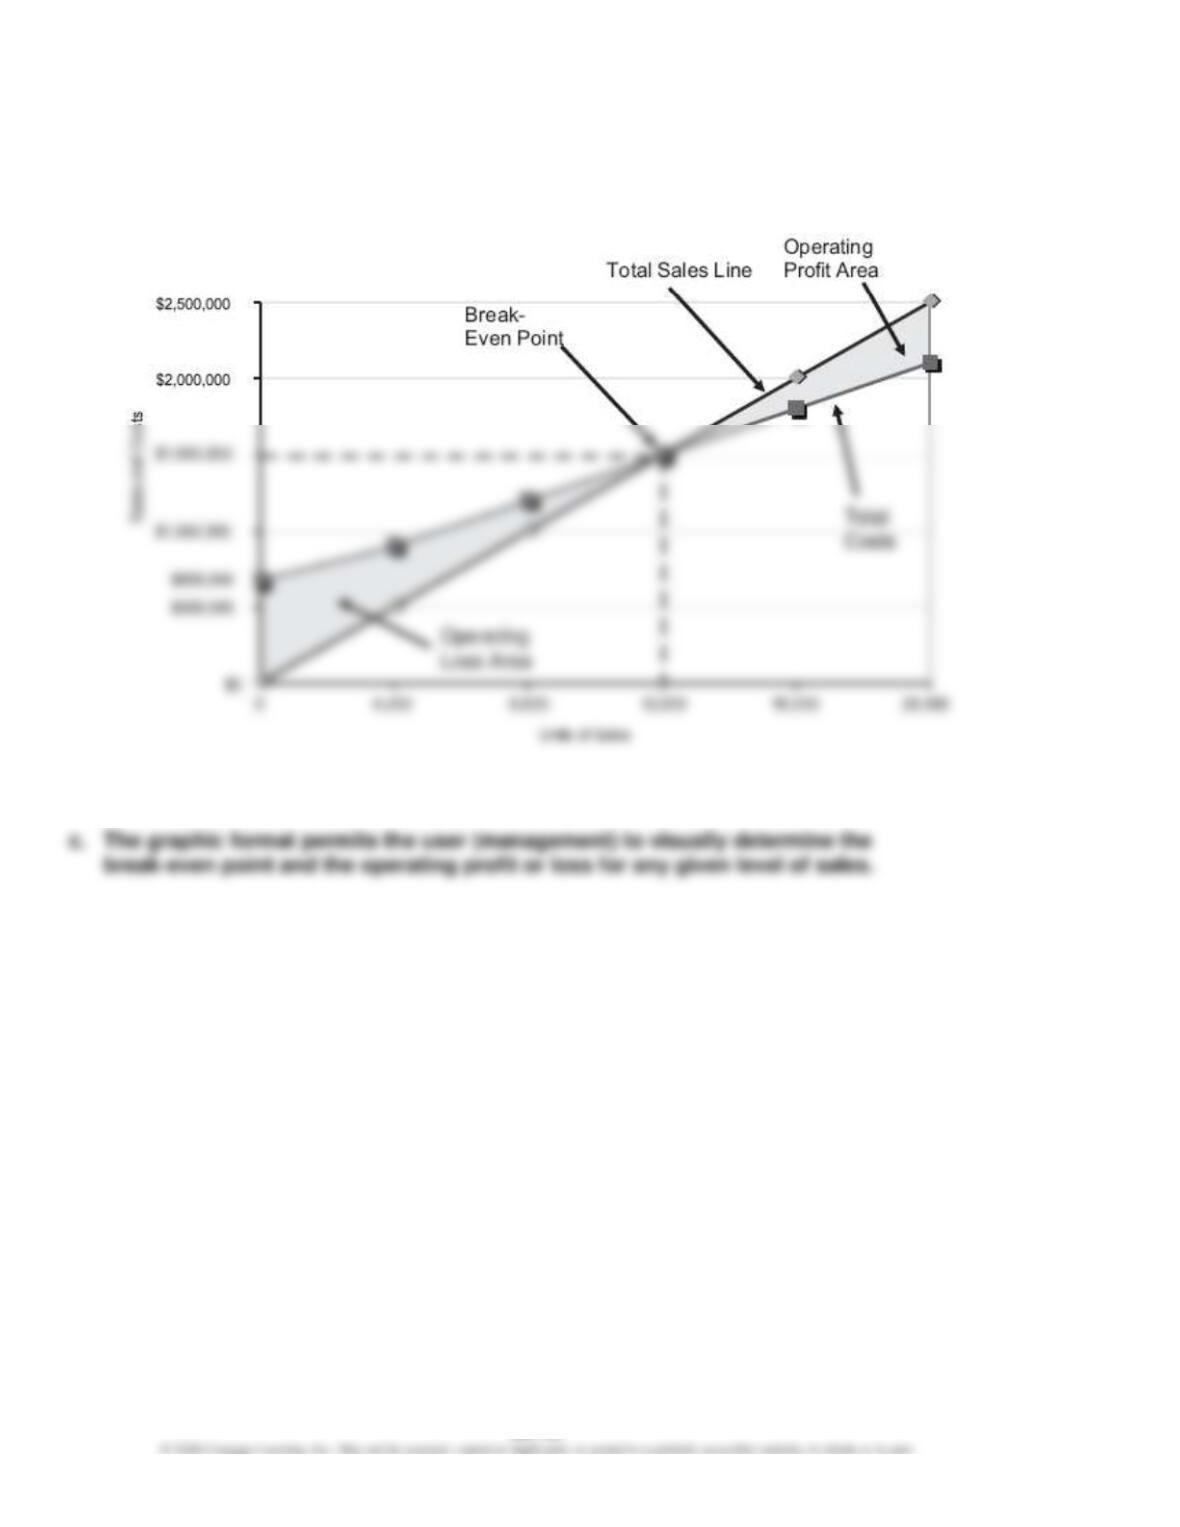
a.
b. $1,500,000 (the intersection of the total sales line and the total costs line)
CHAPTER 20 (FIN MAN); CHAPTER 6 (MAN) Cost-Volume-Profit Analysis
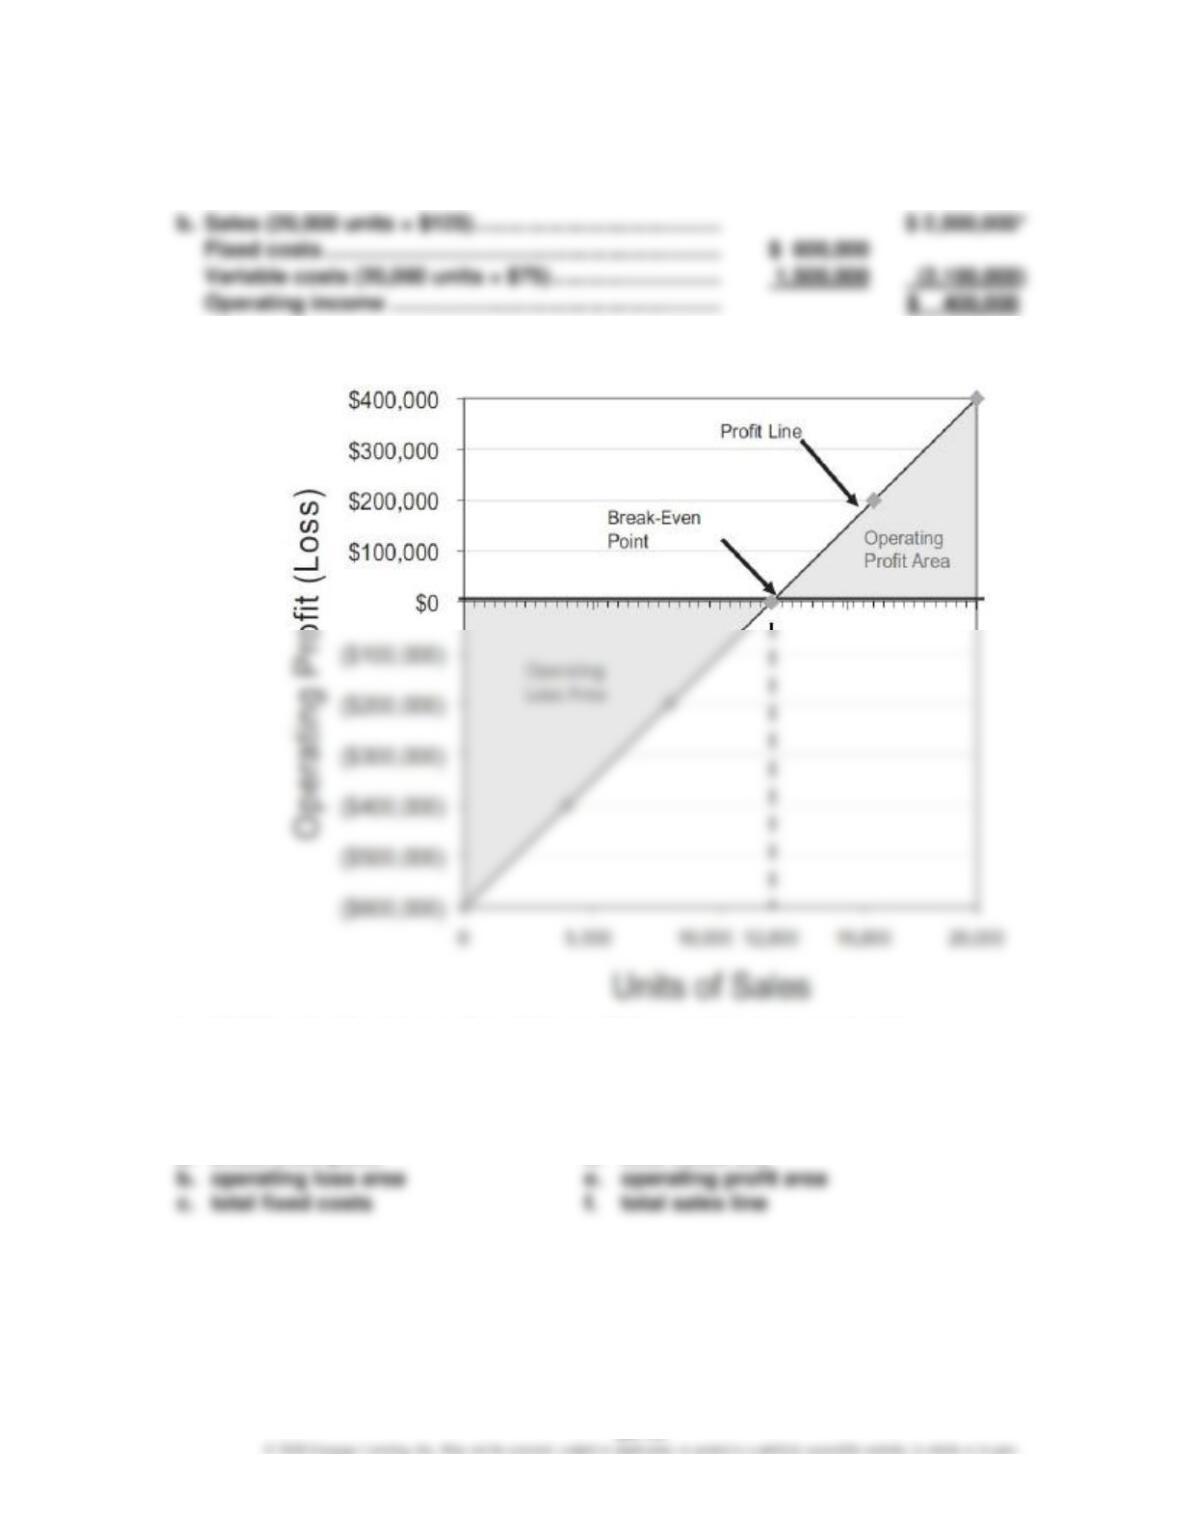
Ex. 20–18 (FIN MAN); Ex. 6–18 (MAN)
a. $600,000 (total fixed costs)
* 20,000 units = $2,500,000 maximum sales ÷ $125 unit selling price
c.
d. 12,000 units (the intersection of the profit line and the horizontal axis)
Ex. 20–19 (FIN MAN); Ex. 6–19 (MAN)
Cost-volume-profit chart
CHAPTER 20 (FIN MAN); CHAPTER 6 (MAN) Cost-Volume-Profit Analysis
Ex. 20–20 (FIN MAN); Ex. 6–20 (MAN)
Profit-volume chart
a. break-even point
b. total fixed costs
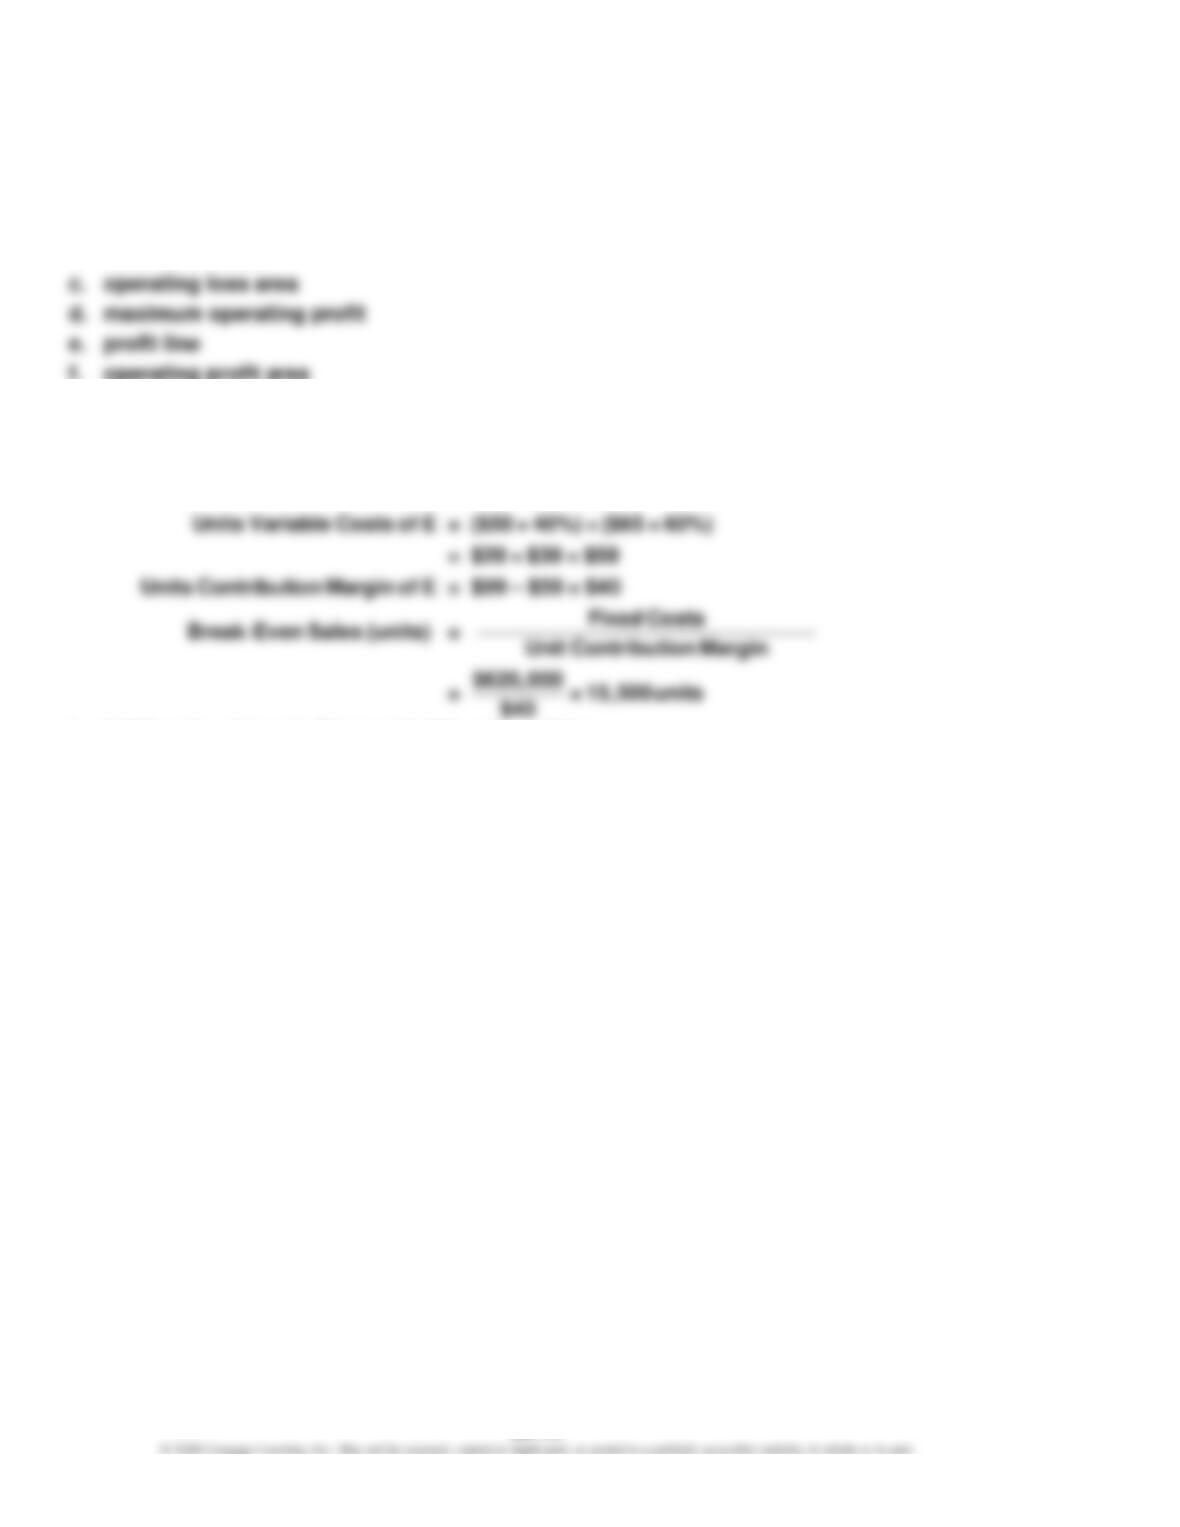
f. operating profit area
Ex. 20–21 (FIN MAN); Ex. 6–21 (MAN)
a.
Units Selling Price of E = ($90 × 40%) + ($105 × 60%)
= $36 + $63 = $99
b. 6,200 units of baseball bats (15,500 units × 40%)
9,300 units of baseball gloves (15,500 units × 60%)
CHAPTER 20 (FIN MAN); CHAPTER 6 (MAN) Cost-Volume-Profit Analysis
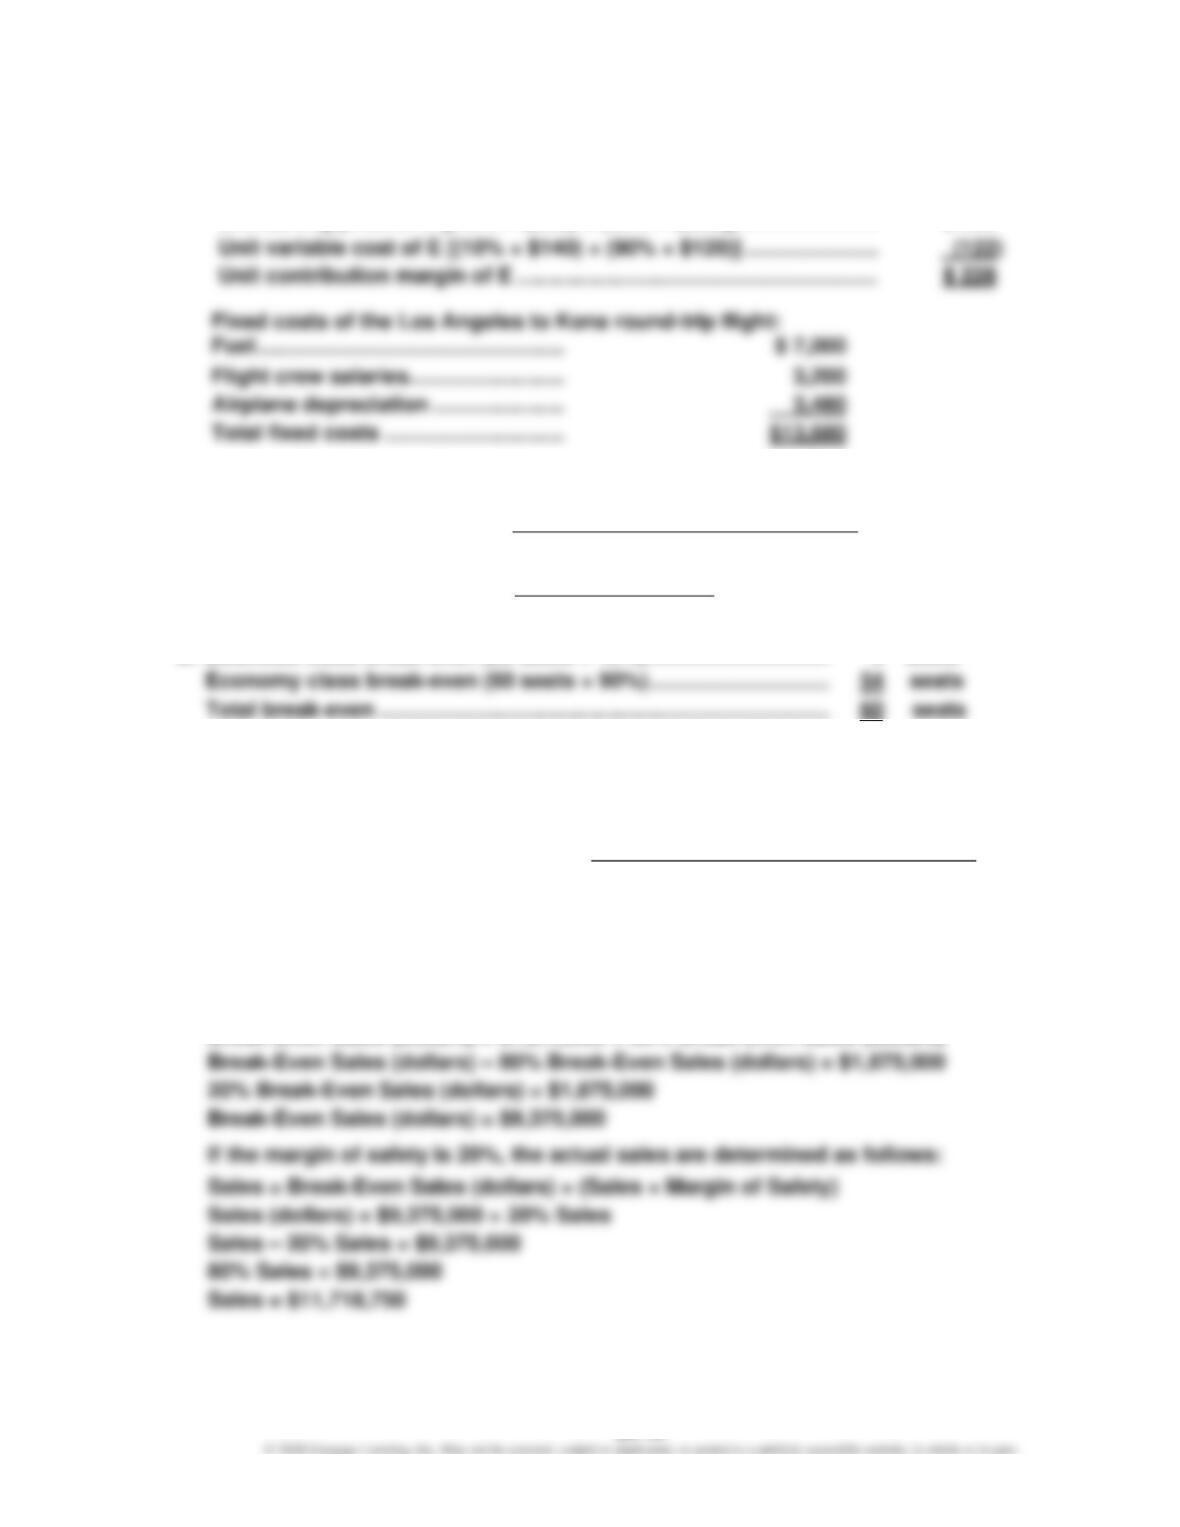
Ex. 20–22 (FIN MAN); Ex. 6–22 (MAN)
a.
Unit contribution margin of overall product (E):
Unit selling price of E [(10% × $800) + (90% × $300)] …………………..
$ 350
Break-even sales (units) of overall product:
–Fixed Costs
Break Even Sales(units)= Unit Contribution Margin
$13,680
= = 60 seats(tickets)
$228per seat
Ex. 20–23 (FIN MAN); Ex. 6–23 (MAN)
a. (1) Margin of Safety (dollars) = Sales – Sales at Break-Even Point
= $1,200,000 – $960,000 = $240,000
(2)
– Sales – Sales at Break Even Point
Margin of Safety (percentage) = Sales
= $240,000 ÷ $1,200,000 = 20%
b. The break-even point (S) is determined as follows:
Break-Even Sales (dollars) = Total Fixed Costs + Total Variable Costs (at Break-Even)
Break-Even Sales (dollars) = Total Fixed Costs + 80% Break-Even Sales (dollars)
CHAPTER 20 (FIN MAN); CHAPTER 6 (MAN) Cost-Volume-Profit Analysis
Ex. 20–24 (FIN MAN); Ex. 6–24 (MAN)
If 420,000 units are sold and sales at the break-even point are 472,500 units, there is no
margin of safety.
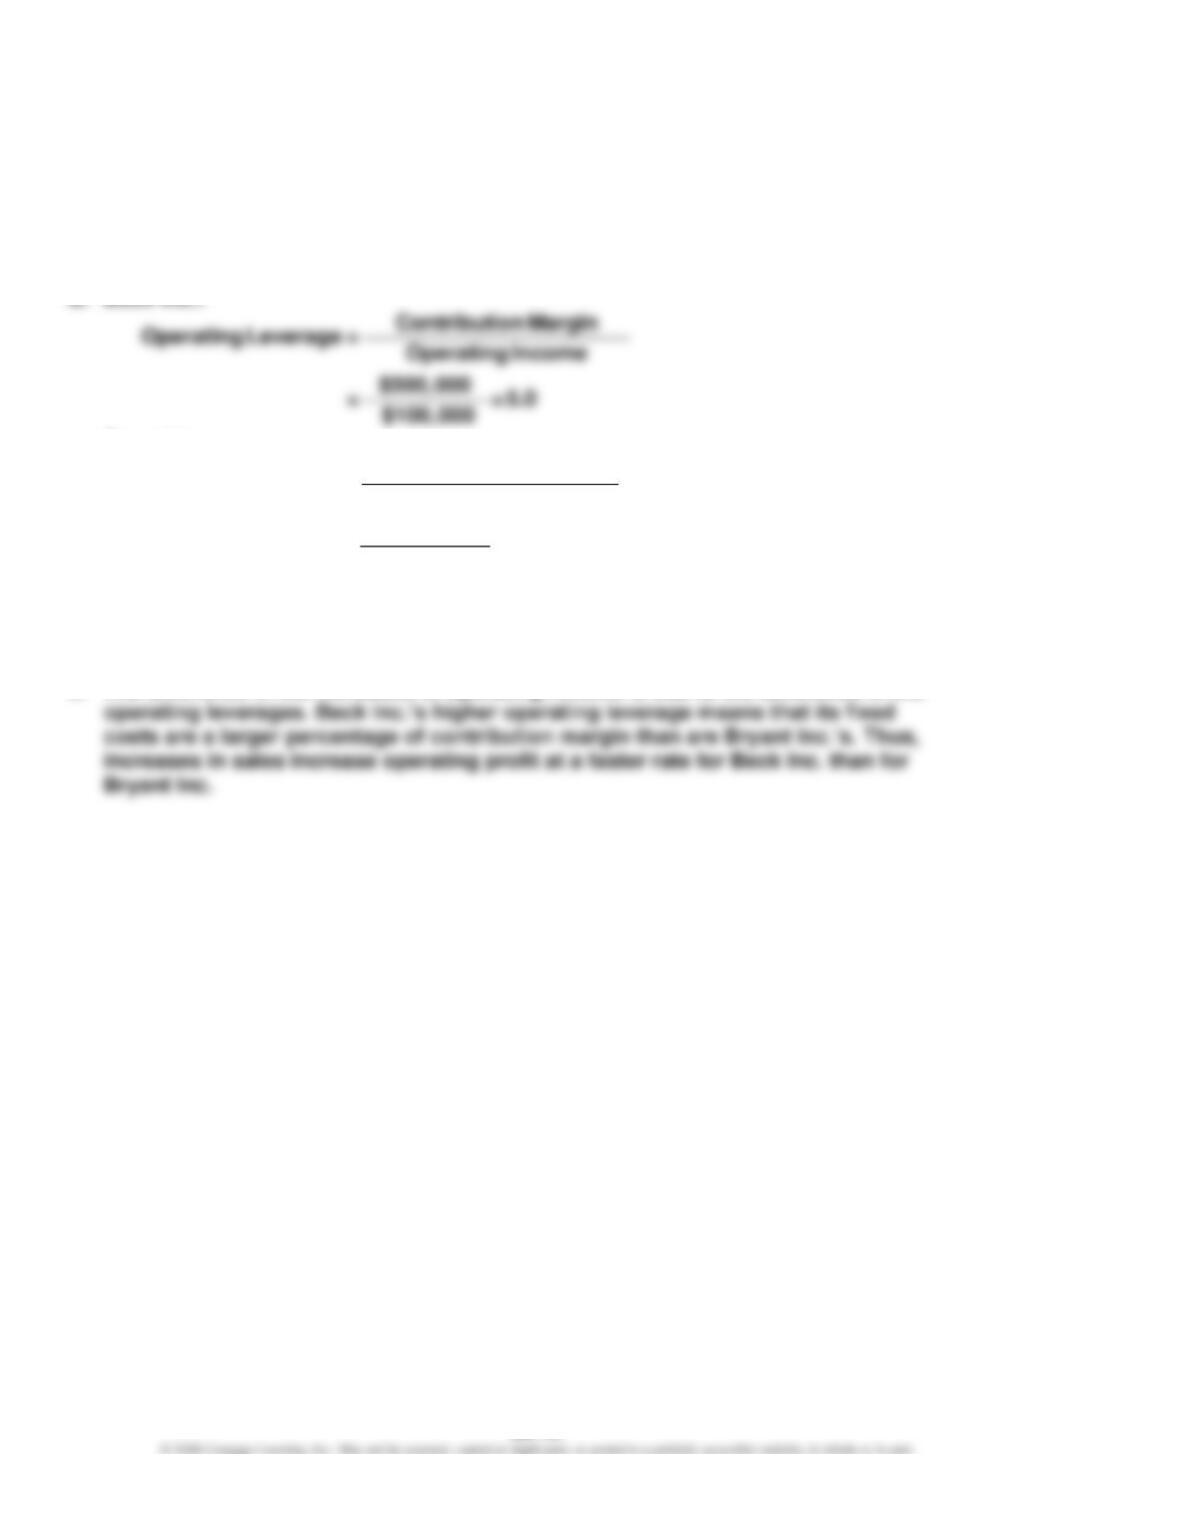
Ex. 20–25 (FIN MAN); Ex. 6–25 (MAN)
Bryant Inc.:
Contribution Margin
Operating Leverage = Operating Income
$750,000
= =2.5
$300,000
b. Beck Inc.’s operating income would increase by 100% (5.0 × 20%), or $100,000
(100% × $100,000), and Bryant Inc.’s operating income would increase by 50%
(2.5 × 20%), or $150,000 (50% × $300,000).
CHAPTER 20 (FIN MAN); CHAPTER 6 (MAN) Cost-Volume-Profit Analysis
PROBLEMS
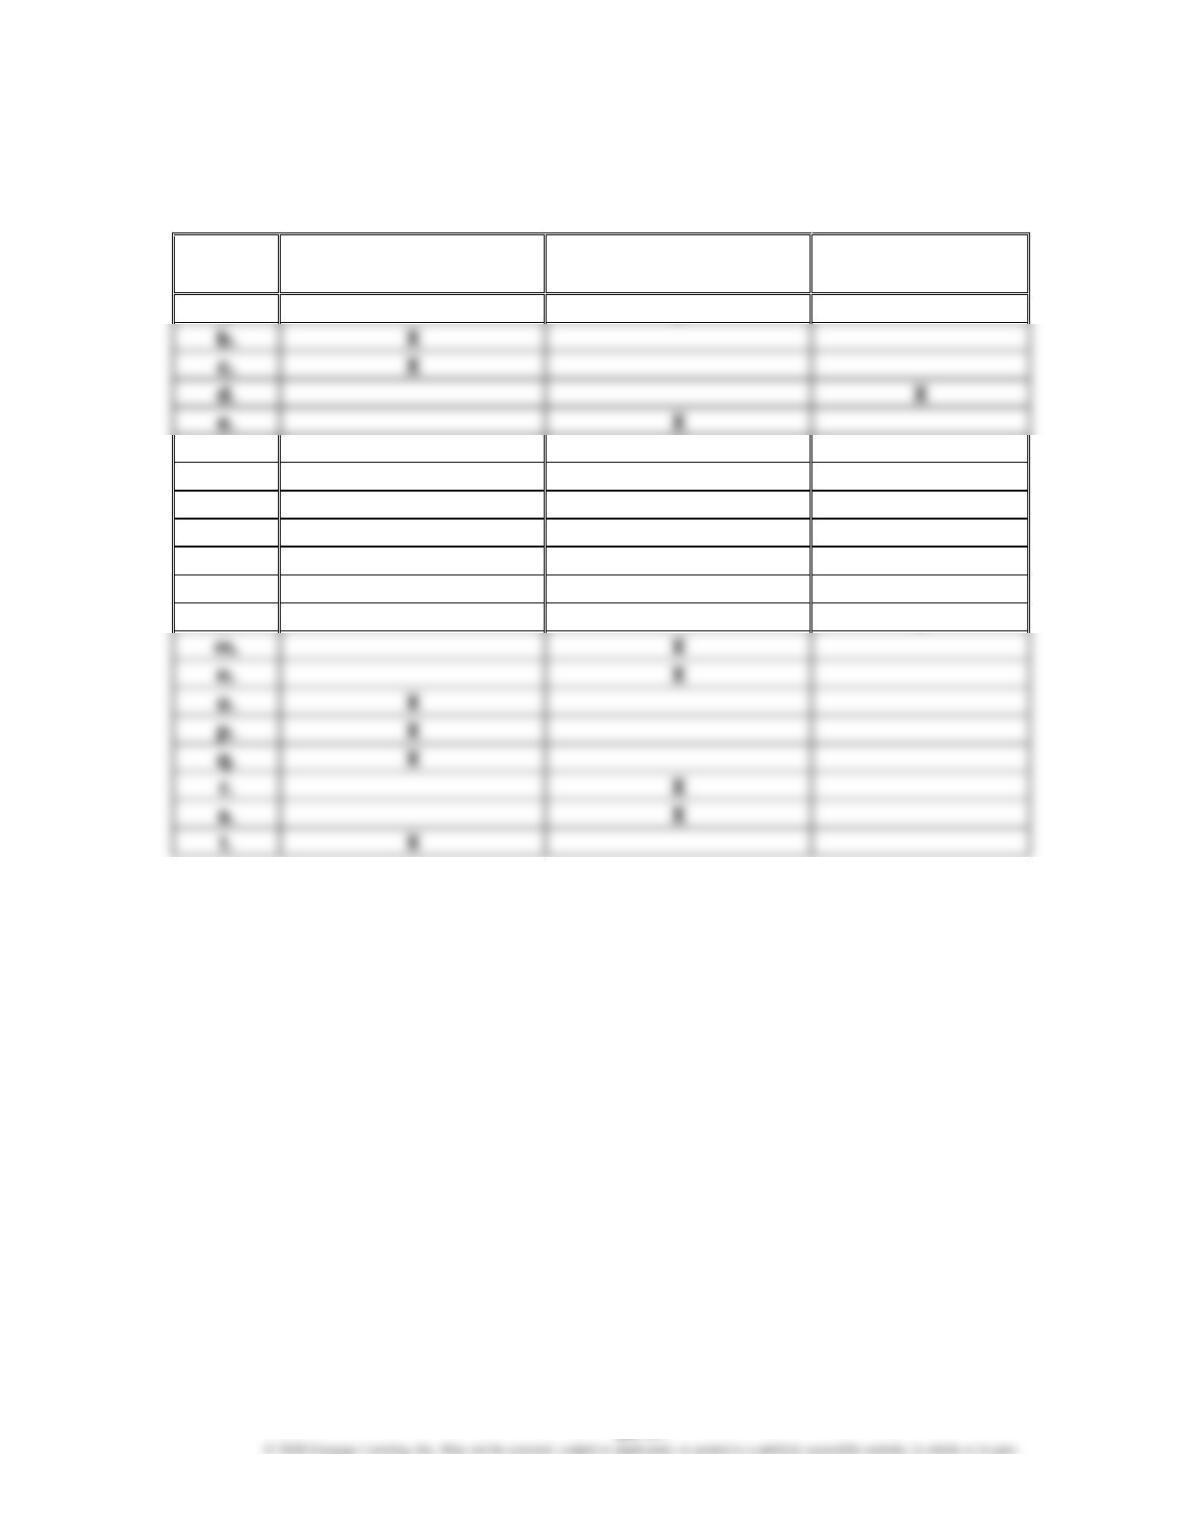
Prob. 20–1A (FIN MAN); Prob. 6–1A (MAN)
Fixed
Variable
Mixed
Cost
Cost
Cost
Cost
a.
X
X
c.
X
d.
X
e.
X
f.
X
g.
X
h.
X
i.
X
j.
X
k.
X
l.
X
X
X
X
p.
X
X
s.
X
X
CHAPTER 20 (FIN MAN); CHAPTER 6 (MAN) Cost-Volume-Profit Analysis
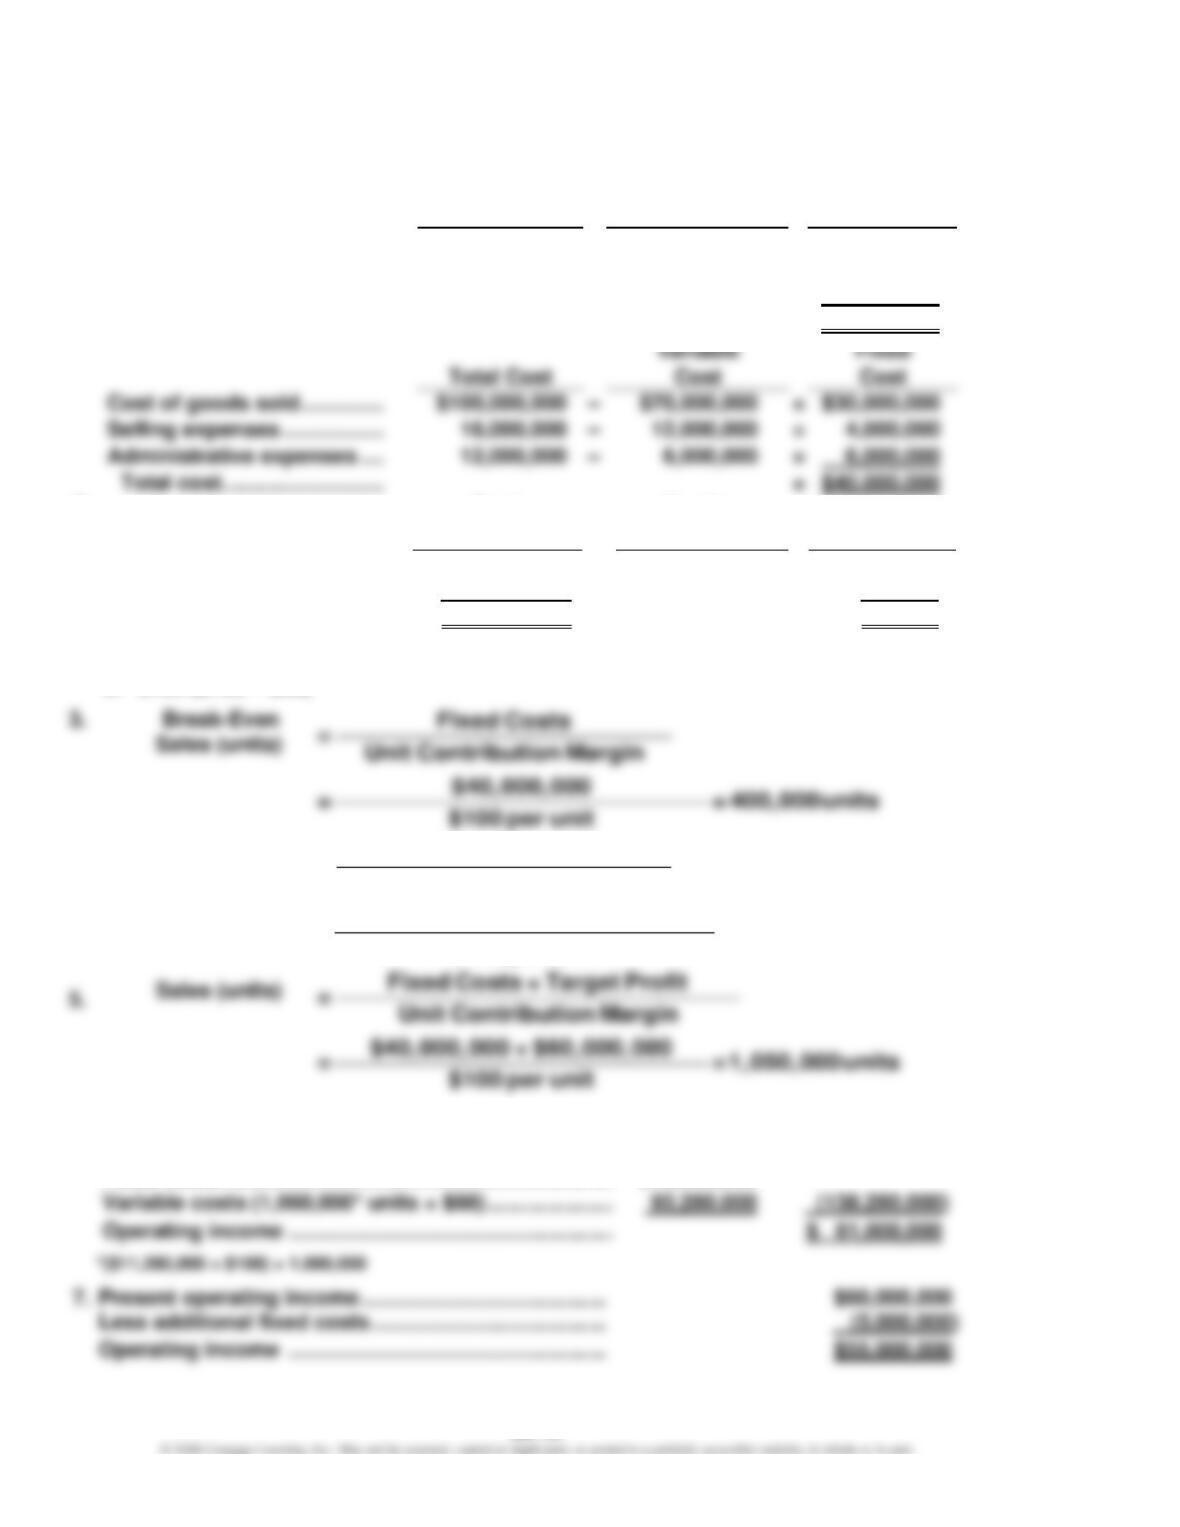
Prob. 20–2A (FIN MAN); Prob. 6–2A (MAN)
1.
Variable
Variable
Total Cost
Cost Percentage
Cost
Cost of goods sold …………..
$100,000,000
×
70%
=
$70,000,000
Selling expenses ……………..
16,000,000
×
75%
=
12,000,000
Administrative expenses ….
12,000,000
×
50%
=
6,000,000
Total variable cost …………
$88,000,000
Cost of goods sold …………..
$100,000,000
=
$30,000,000
Selling expenses ……………..
16,000,000
=
Administrative expenses ….
12,000,000
=
Total cost ………………………
=
$40,000,000
2.
Total
Number
Amount
of Units
Per Unit
Sales ………………………………
$188,000,000
÷
1,000,000
=
$188.00
Variable costs ………………….
(88,000,000)
÷
1,000,000
=
(88.00)
Contribution margin …………
$100,000,000
$100.00
a. $88 ($88,000,000 ÷ 1,000,000 units)
4.
Fixed Costs
= Unit Contribution Margin
$40,000,000 + $5,000,000
=$1 = 450,000units
00 per unit
Break-Even
Sales (units)
6.
Sales ($188,000,000 + $11,280,000) ………………………
$ 199,280,000
CHAPTER 20 (FIN MAN); CHAPTER 6 (MAN) Cost-Volume-Profit Analysis
Prob. 20–2A (FIN MAN); Prob. 6–2A (MAN) (Concluded)
8. In favor of the proposal is the possibility of increasing operating income
from $60,000,000 to $61,000,000. However, there are many points against the
proposal, including:
• The break-even point increases by 50,000 units (from 400,000 to 450,000).
CHAPTER 20 (FIN MAN); CHAPTER 6 (MAN) Cost-Volume-Profit Analysis
Prob. 20–3A (FIN MAN); Prob. 6–3A (MAN)
1.
Break-Even
–
Total Fixed Costs Total Fixed Costs
==
Units Contribution Margin Units Selling Price Units Variable Cost
Sales (units)
2.
Fixed Costs + Target Profit
Sales (units) = Unit Contribution Margin
$40
3.
4. Sales (16,000 × $100) ……………………………..
$ 1,600,000
Total fixed costs …………………………………….
$480,000