Chapter 6 – Inventory and Cost of Goods Sold
AP6-1 (continued)
Requirement 1 (b)
Great Adventures, Inc.
Partial Income Statement
For the year ended December 31, 2019
Sales revenue
$60,000
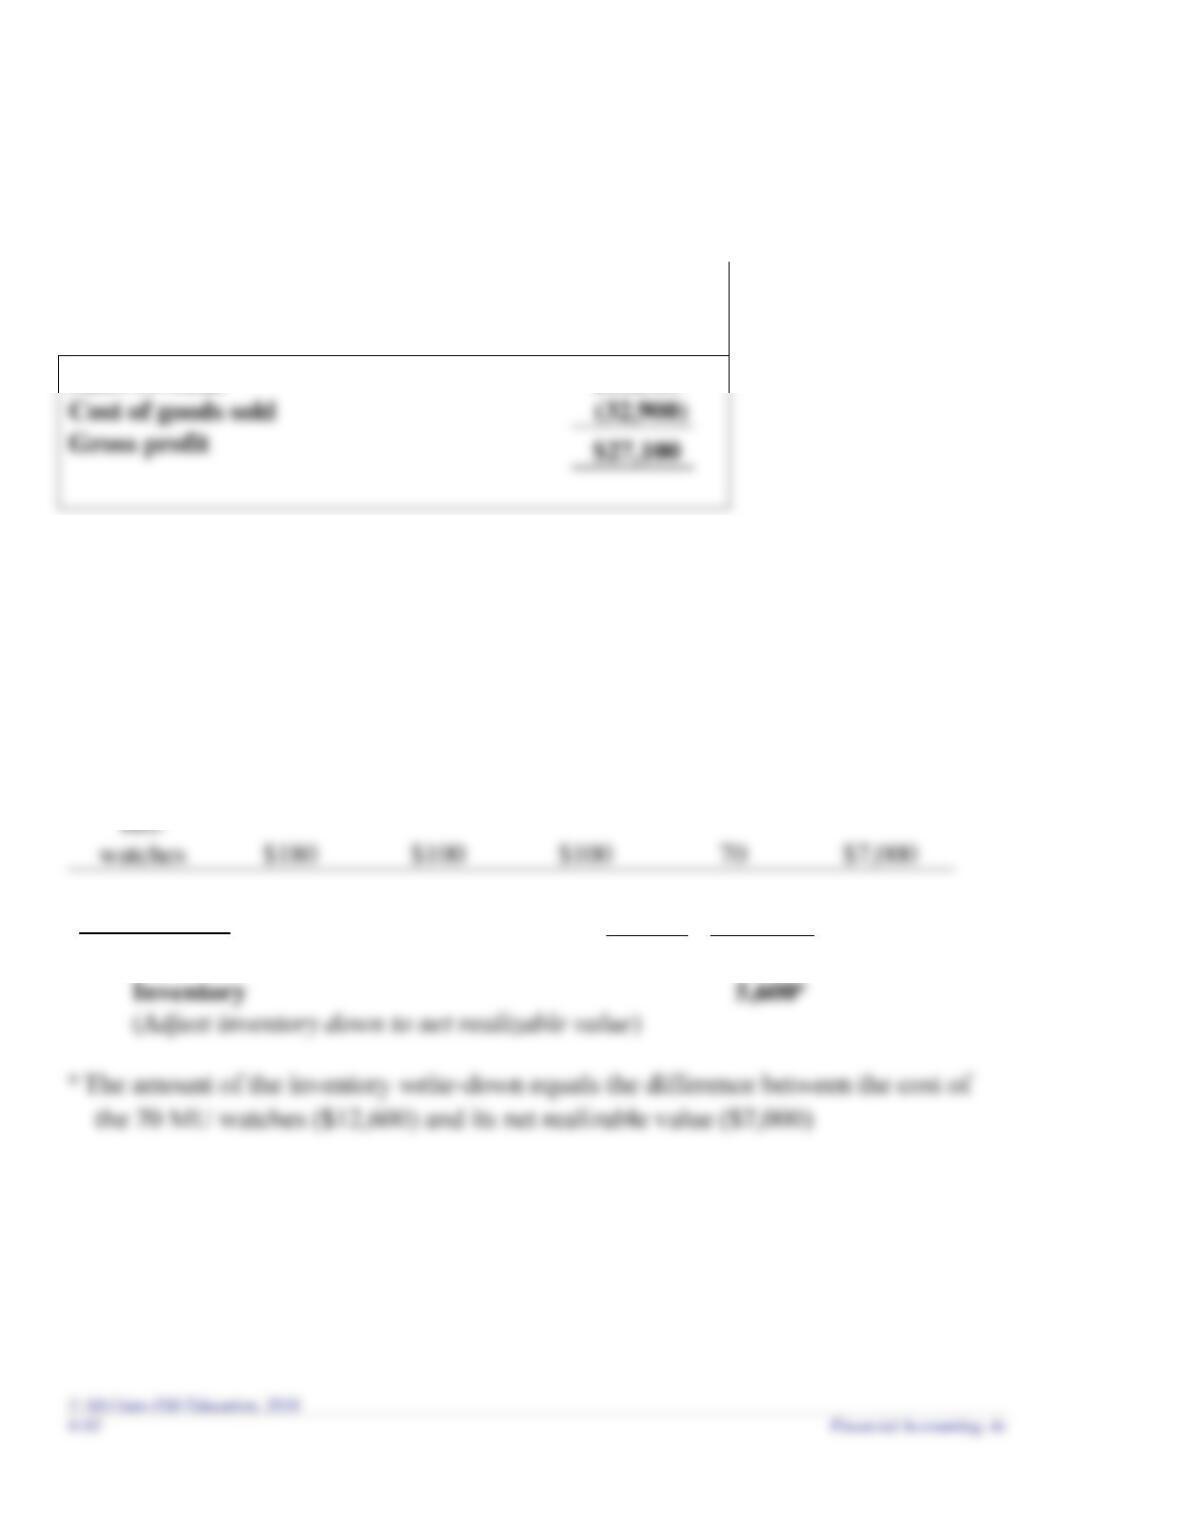
Cost of goods sold
$27,100
Requirement 2 (a)
Inventory
items
Cost
per unit
NRV
per unit
Lower of
Cost and
NRV
per unit
Quantity
Lower of
Cost and
NRV
Dec. 31, 2019
Debit
Credit
Cost of Goods Sold
5,600
Requirement 2 (b)
Great Adventures reports its inventory in the balance sheet at the lower of cost and net
realizable value, which equals $7,000, as demonstrated in requirement 2(a).
Chapter 6 – Inventory and Cost of Goods Sold
AP6-1 (concluded)
Requirement 2 (c)
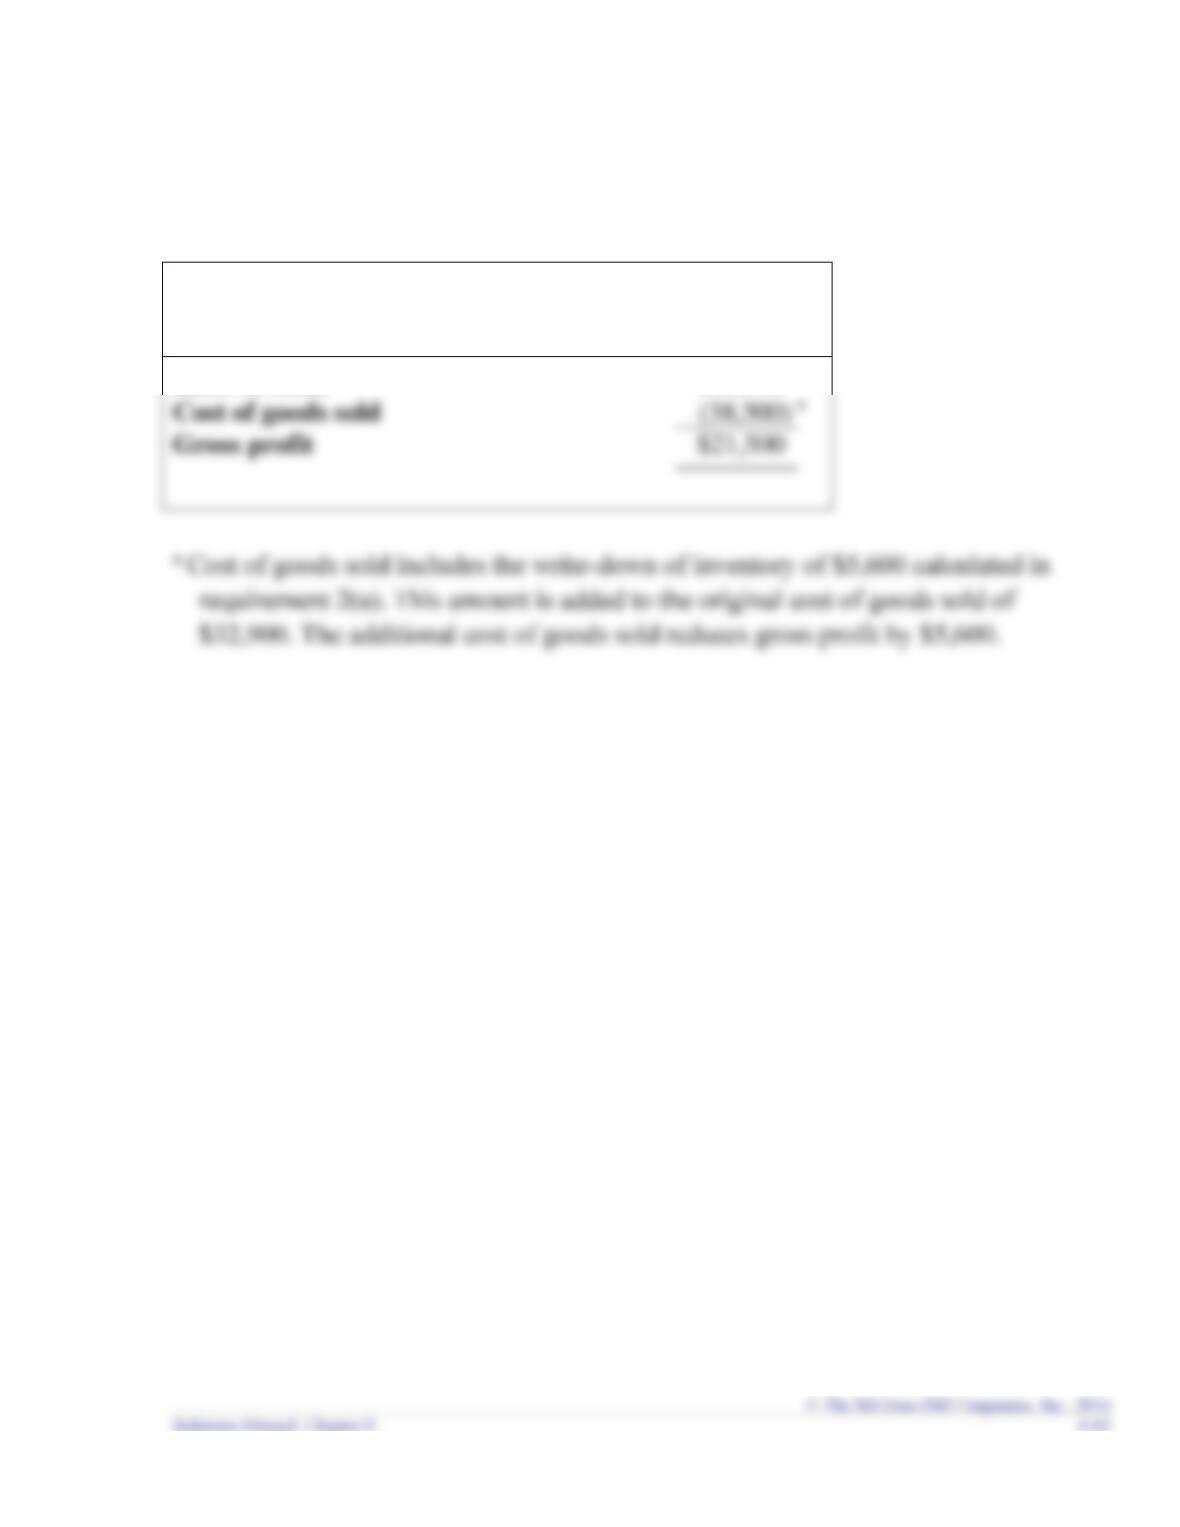
Great Adventures, Inc.
Partial Income Statement
For the year ended December 31, 2019
Sales revenue
$60,000
Chapter 6 – Inventory and Cost of Goods Sold
Additional Perspective 6-2
Requirement 1
The amount of inventory reported in the balance sheet is $278,972. This amount
represents the cost, less any write-downs, of inventory that has not been sold by the
end of the year.
Requirement 2
Requirement 3
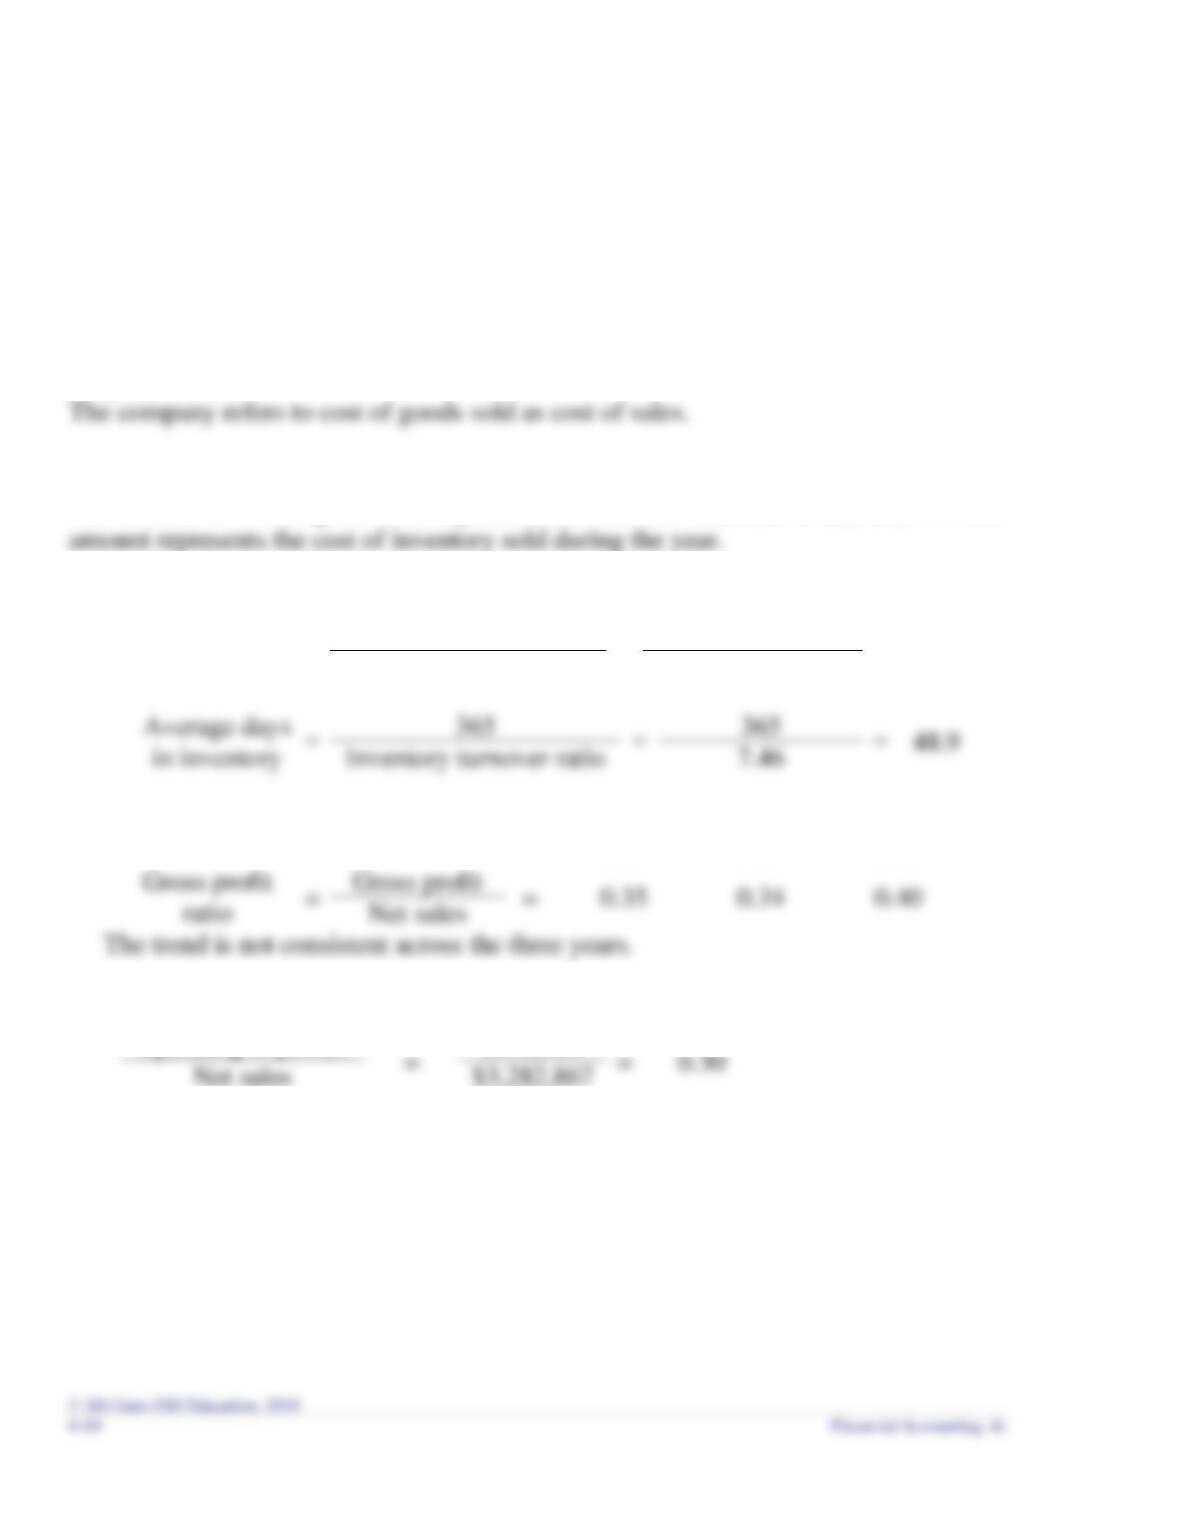
The amount of cost of goods sold reported in the income statement is $2,128,193. This
Requirement 4
Inventory
turnover ratio
=
Cost of goods sold
=
$2,128,193
=
7.46
Average inventory
$285,256.5
=
=
Requirement 5
2015
2014
2013
Gross profit
Requirement 6
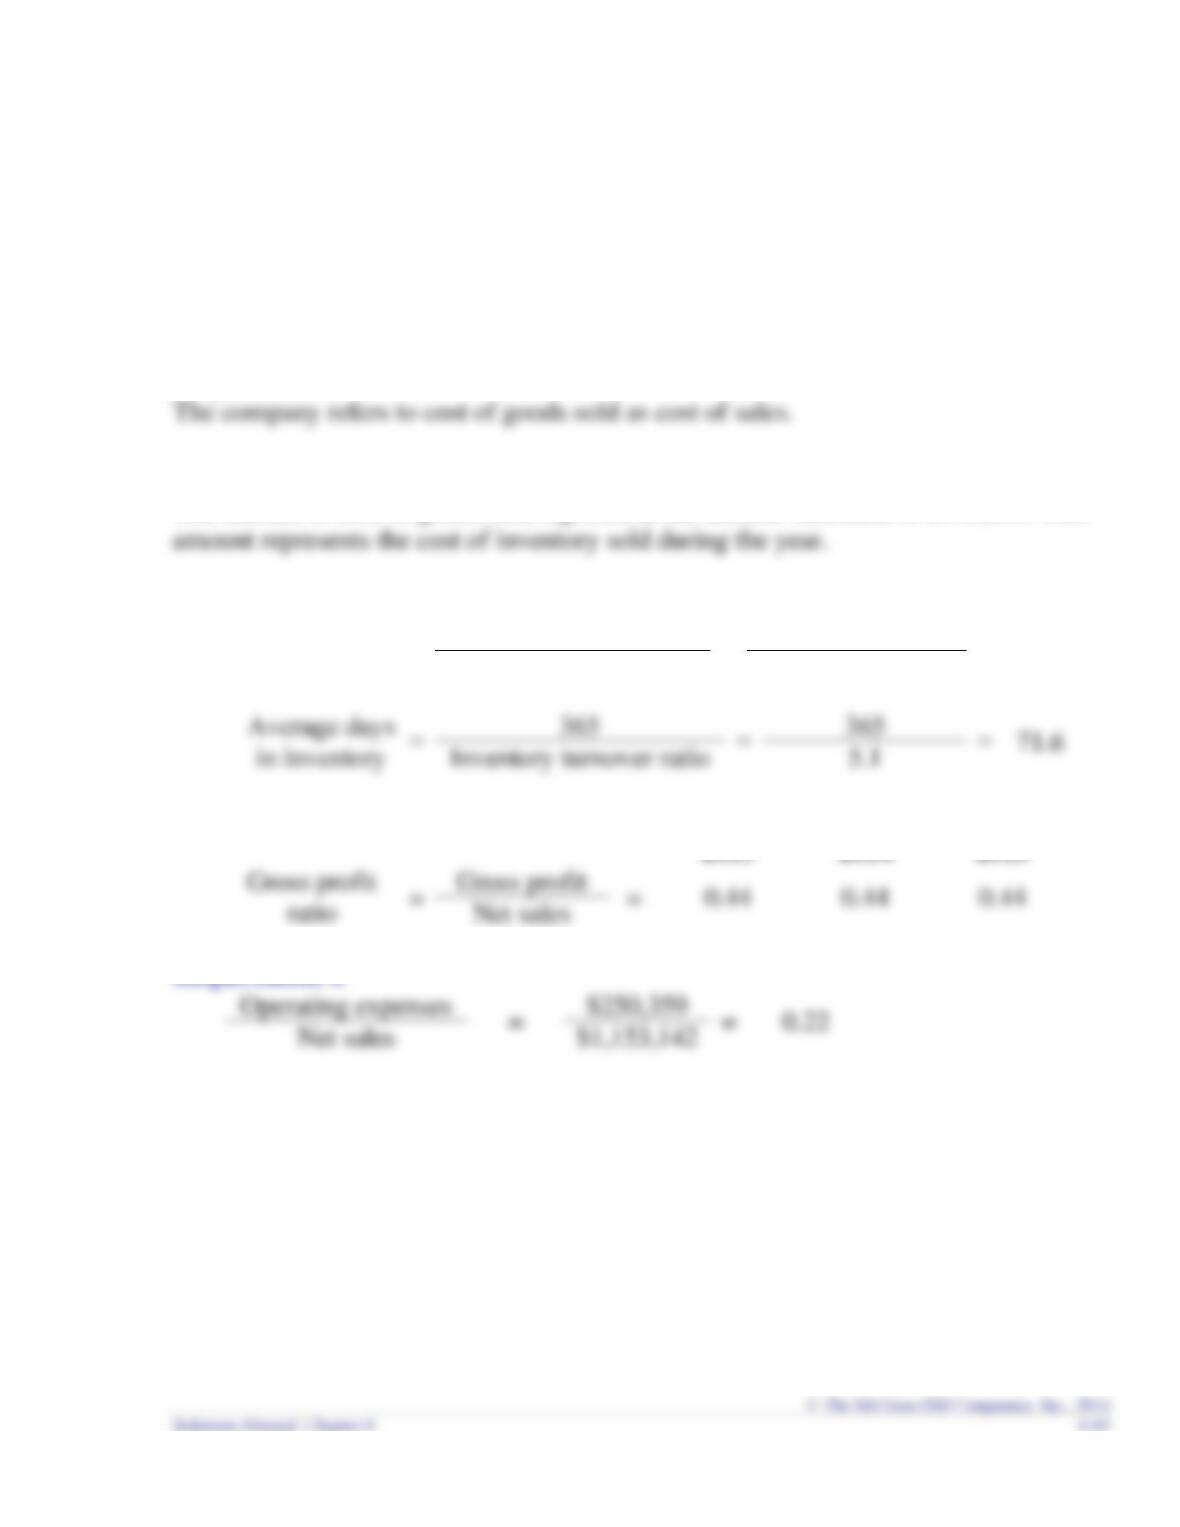
Operating expenses
$998,909
Chapter 6 – Inventory and Cost of Goods Sold
Additional Perspective 6-3
Requirement 1
The amount of inventory reported in the balance sheet is $129,921. This amount
represents the cost, less any write-downs, of inventory that has not been sold by the
end of the year.
Requirement 2
Requirement 3
The amount of cost of goods sold reported in the income statement is $645,810. This
Requirement 4
Inventory
turnover ratio
=
Cost of goods sold
=
$645,810
=
5.1
Average inventory
$127,031
=
=
Requirement 5
2015
2014
2013
Requirement 6
Chapter 6 – Inventory and Cost of Goods Sold
Additional Perspective 6-4
Requirement 1
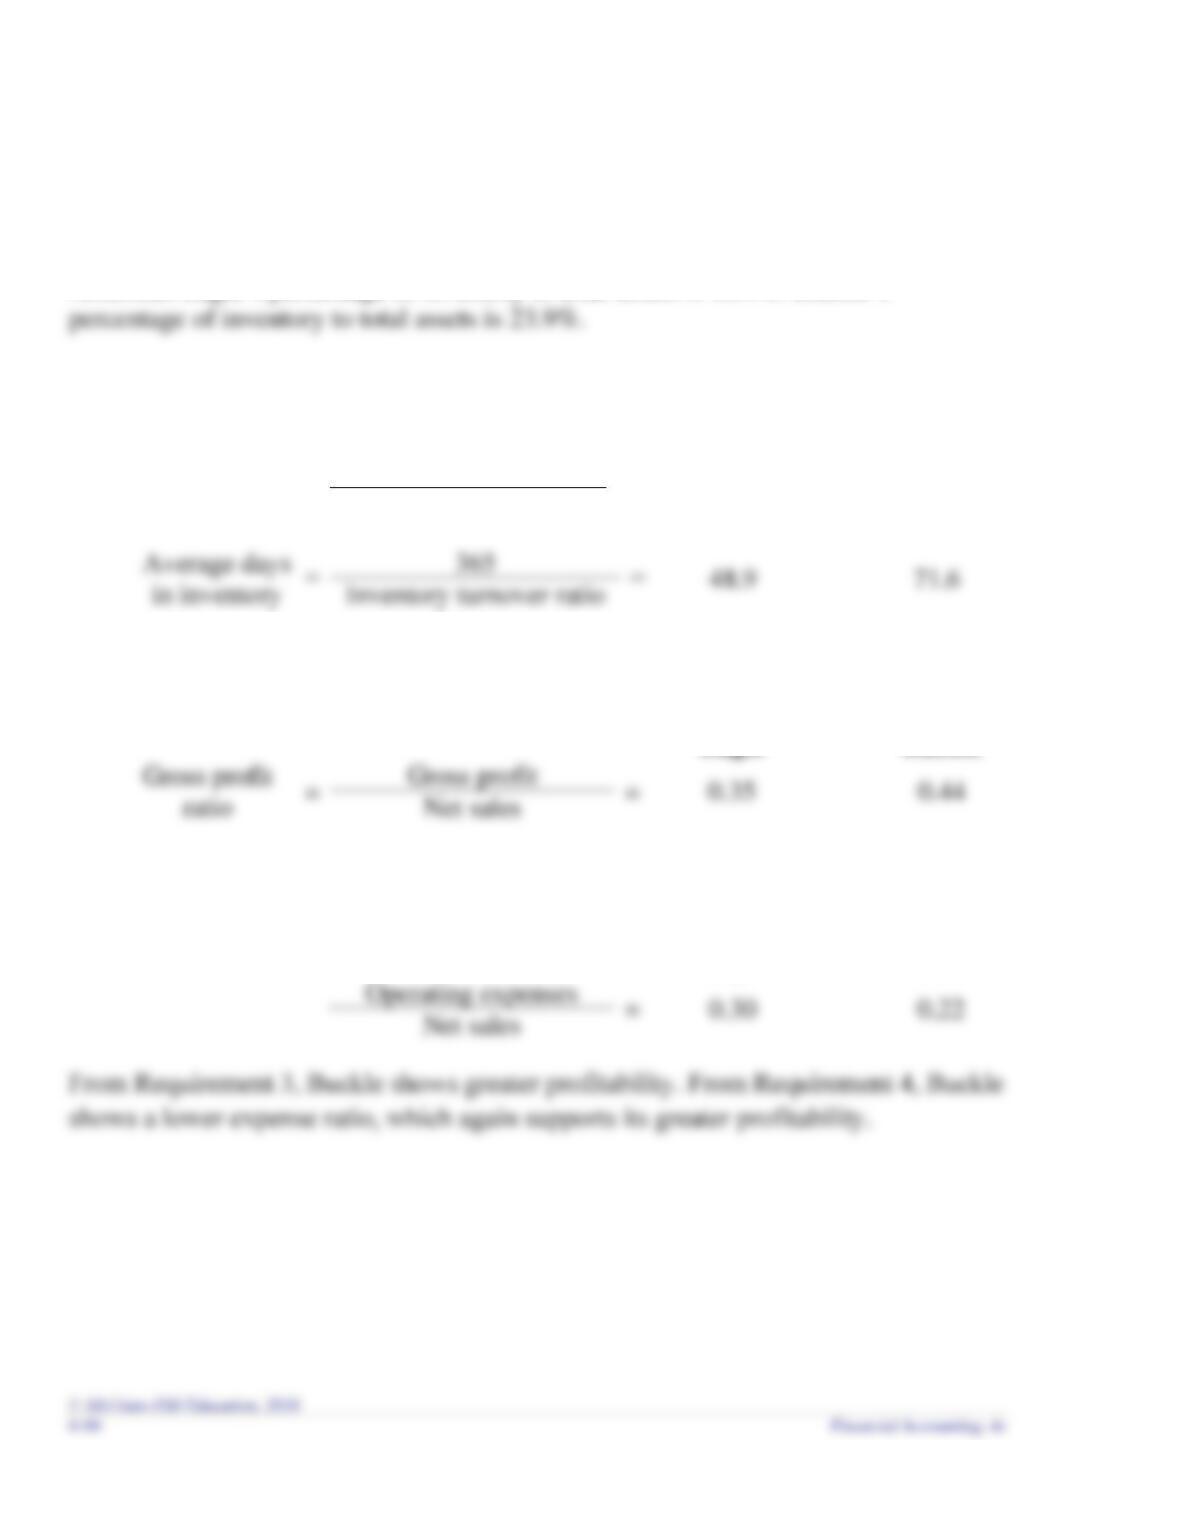
American Eagle’s percentage of inventory to total assets is 16.4%. Buckle’s
Requirement 2
American
Eagle
Buckle
Inventory
turnover ratio
=
Cost of goods sold
=
7.5
5.1
Average inventory
Requirement 3
American
Eagle
Buckle
Requirement 4
American
Eagle
Buckle
Chapter 6 – Inventory and Cost of Goods Sold
Additional Perspective 6-5
What is the issue?
When the net realizable value of inventory falls below its cost, companies are required
to write down inventory, resulting in a loss being reported in the income statement.
The company’s assets (inventory) will also be reported for lower amounts, showing
that the company’s resources have declined.
Who are the parties involved?
Jim knows the importance to the company of reporting acceptable profits in 2018. If
profits are too low, Jim will lose his job and so will all of his coworkers. However,
reporting the sale would lead to misstated financial statements. Even if creditors are
What factors should Jim consider in making his decision?
Jim doesn’t want to be the one to blame for everyone losing their job. If he allows the
“fake” sale to be reported, he and his coworkers will have time to start looking for
other jobs. He will also please his boss, and if the company somehow is able to
continue its existence, this could mean promotions and pay raises.
Chapter 6 – Inventory and Cost of Goods Sold
Additional Perspective 6-6
(Note to instructor: Amounts are based on annual reports filed December 31, 2014)
Requirement 1
($ in millions)
Coca-Cola
PepsiCo
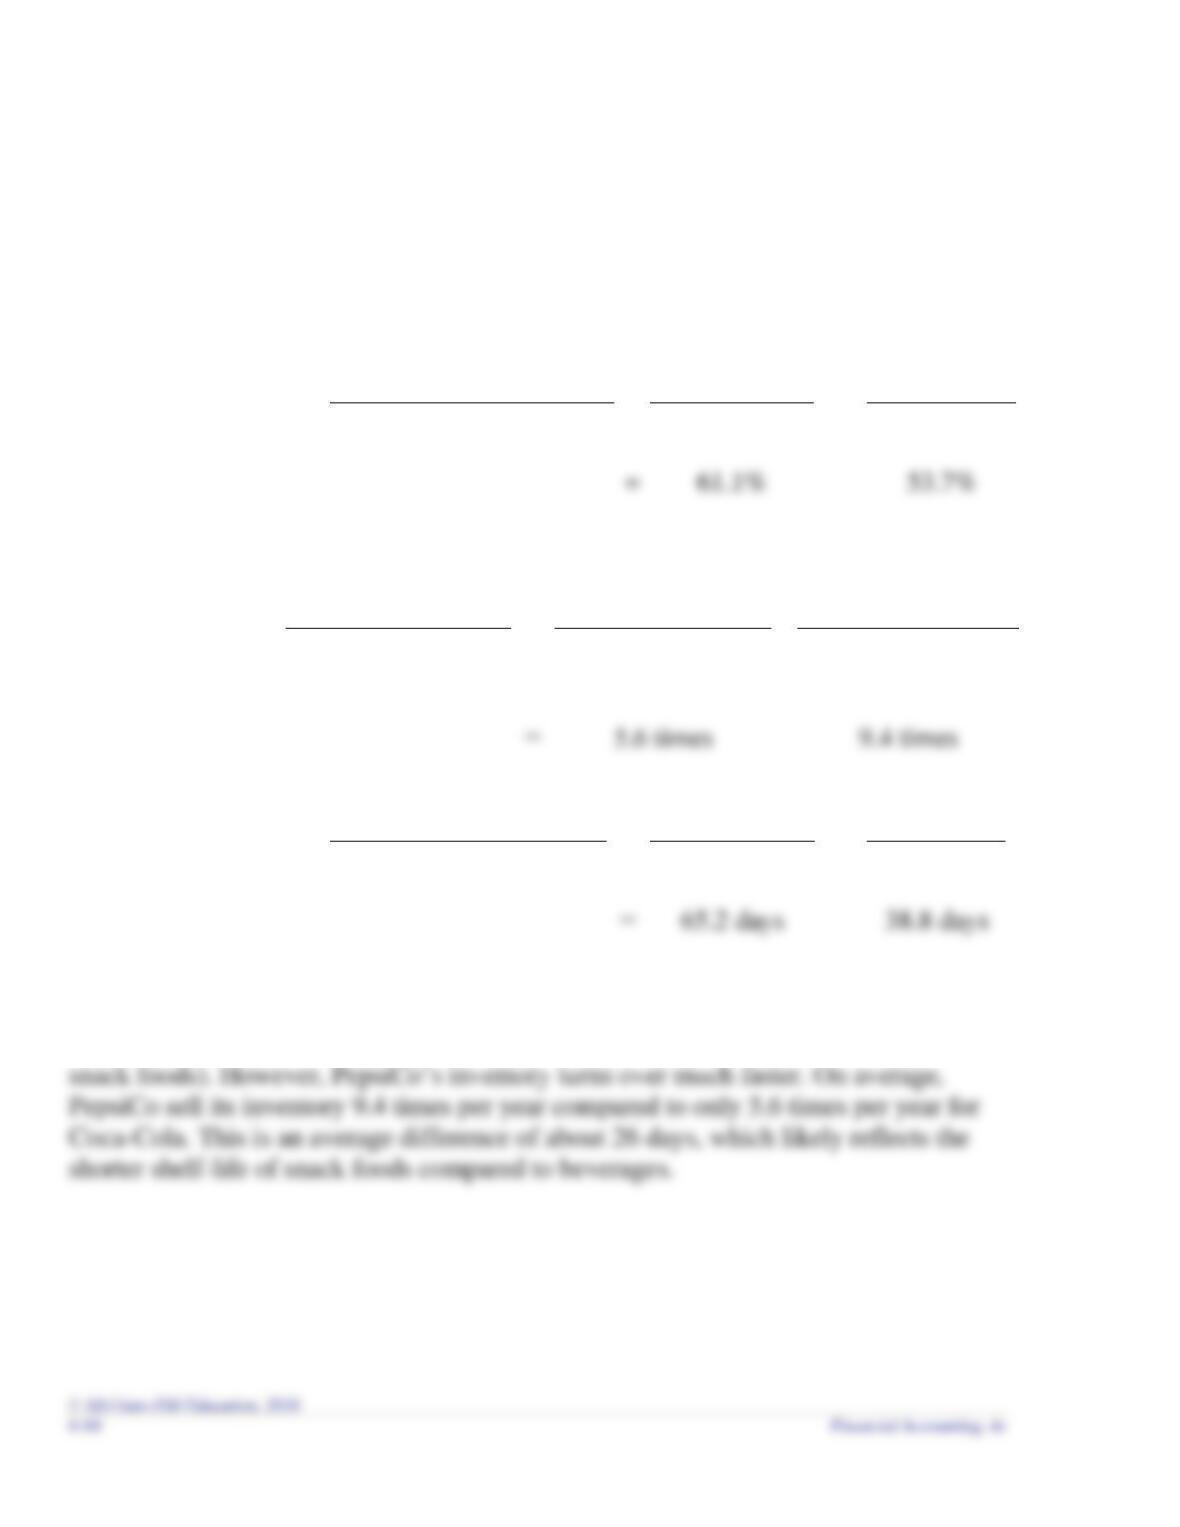
Gross profit
ratio
=
Gross profit
=
$28,109
$35,799
Net sales
$45,998
$66,683
Coca-Cola
PepsiCo
Inventory
turnover
ratio
=
Cost of goods sold
=
$17,889
$30,884
Average inventory
($3,100+$3,277)/2
($3,143+$3,409)/2
=
Average days
in inventory
=
365
=
365
365
Inventory turnover ratio
5.6
9.4
=
Requirement 2
As indicated by the higher gross profit ratio, Coca-Cola is able to generate more profit
selling its inventory (beverages) than PepsiCo is selling its inventory (beverages and
Chapter 6 – Inventory and Cost of Goods Sold
Additional Perspective 6-7
Students should discuss the following issues.
For FIFO,
– FIFO assumes that the first units purchased are sold first.
– It is likely that FIFO more closely matches the actual flow of inventory.
– By more closely matching actual flow, FIFO results in a better approximate
For LIFO,
– LIFO assumes that the last units purchased are sold first.
– LIFO may better match current inventory costs with current inventory sales,
resulting in a more accurate measure of profitability in the income statement.
– If inventory costs are rising, which is typically the case for most businesses,
LIFO generally results in a lower amount being reported for assets and net
income. The lower amount being reported for net income will reduce the
amount of income taxes payable.
– If inventory costs are declining, LIFO results in a higher amount being reported
for assets and net income.
Chapter 6 – Inventory and Cost of Goods Sold
Additional Perspective 6-8
Requirement 1
Date
Transaction
Number
of units
Unit
cost
Ending
Inventory
Aug. 22
Purchase
30
$600
$18,000
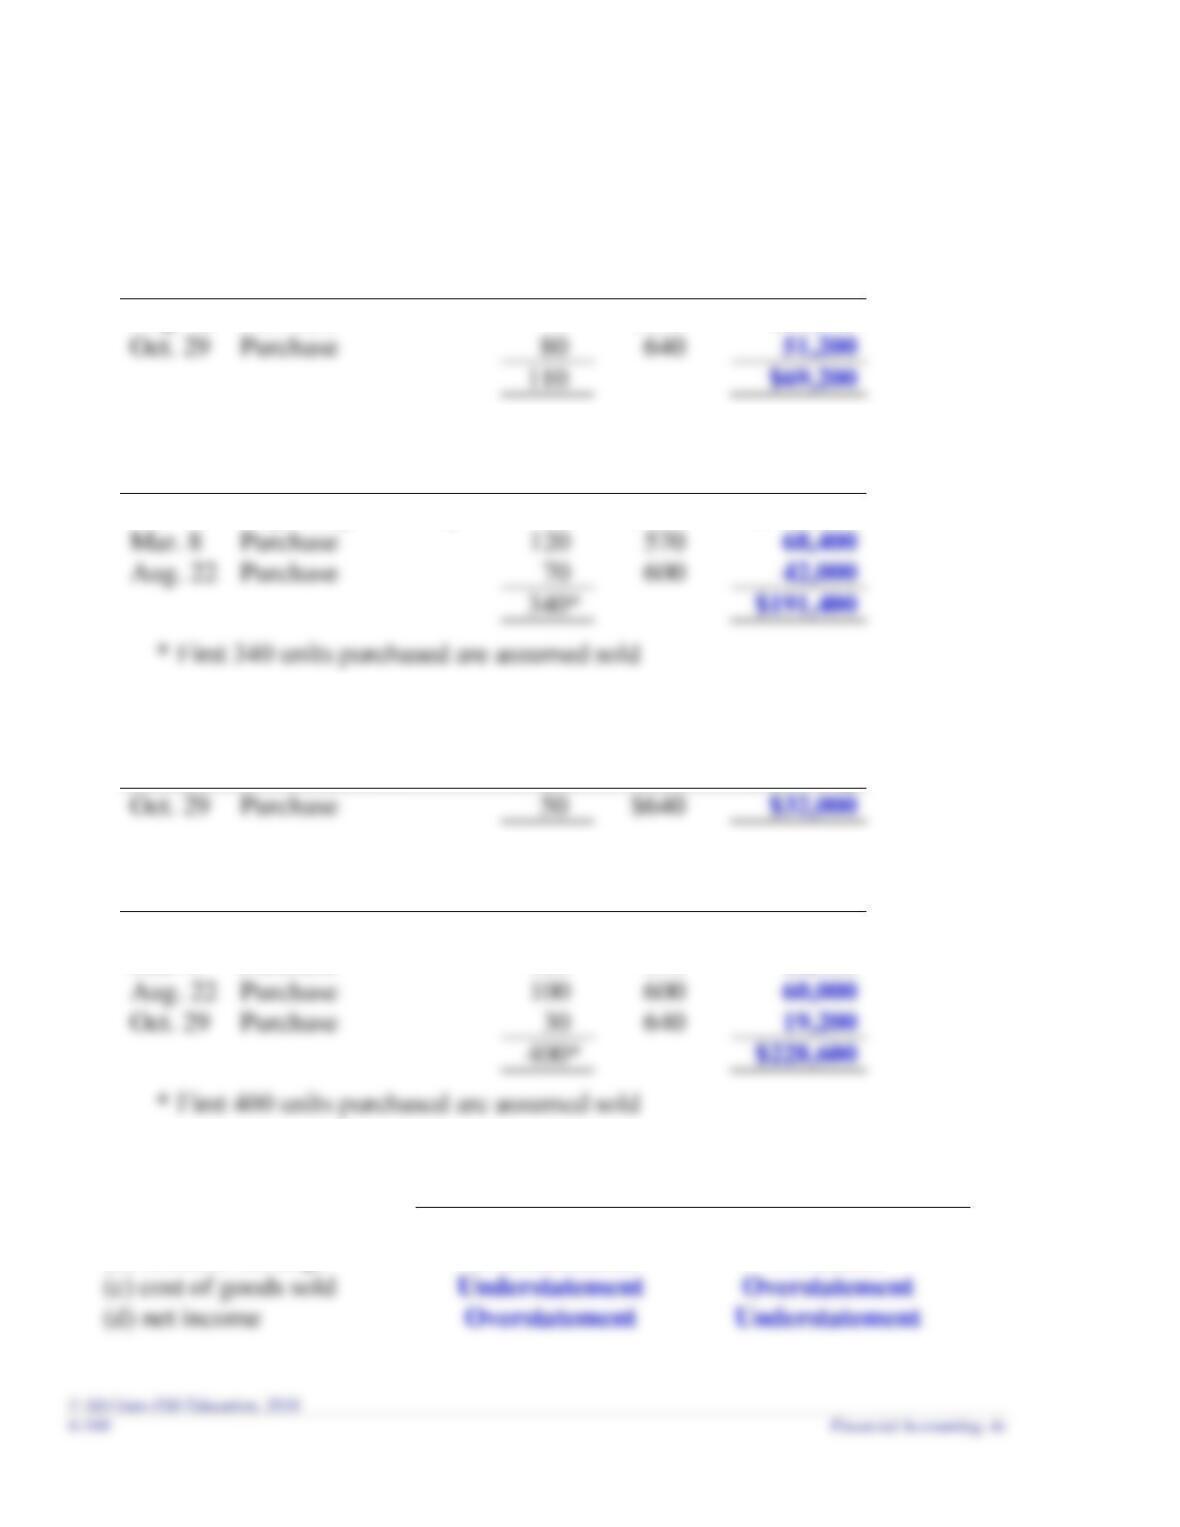
Oct. 29
Purchase
80
640
51,200
Date
Transaction
Number
of units
Unit
cost
Cost of
Goods Sold
Jan. 1
Beginning inventory
150
$540
$ 81,000
Mar. 8
Purchase
120
570
68,400
Aug. 22
Purchase
600
42,000
340*
$191,400
Requirement 2
Date
Transaction
Number
of units
Unit
cost
Ending
Inventory
Oct. 29
Purchase
50
$640
Date
Transaction
Number
of units
Unit
cost
Cost of
Goods Sold
Jan. 1
Beginning inventory
150
$540
$ 81,000
Mar. 8
Purchase
120
570
68,400
Aug. 22
Purchase
100
600
60,000
Oct. 29
Purchase
640
19,200
Requirements 3 and 4
2018
2019
(a) ending inventory
Overstatement
No Effect
(b) retained earnings
Overstatement
No Effect
(c) cost of goods sold
(d) net income
Overstatement

Chapter 6 – Inventory and Cost of Goods Sold