CHAPTER 6
SOLUTIONS TO PROBLEMS: SET B
PROBLEM 6-1B
(a) The goods should not be included in inventory as they were shipped
FOB shipping point and shipped February 26. Title to the goods
transfers to the customer February 26. Weber should have recorded
the transaction in the Sales and Accounts Receivable accounts.
(b) The amount should not be included in inventory as they were shipped
FOB destination and not received until March 2. The seller still owns
the inventory. No entry is recorded.
(c) Include $500 in inventory.
(d) Include $400 in inventory.
PROBLEM 6-2B
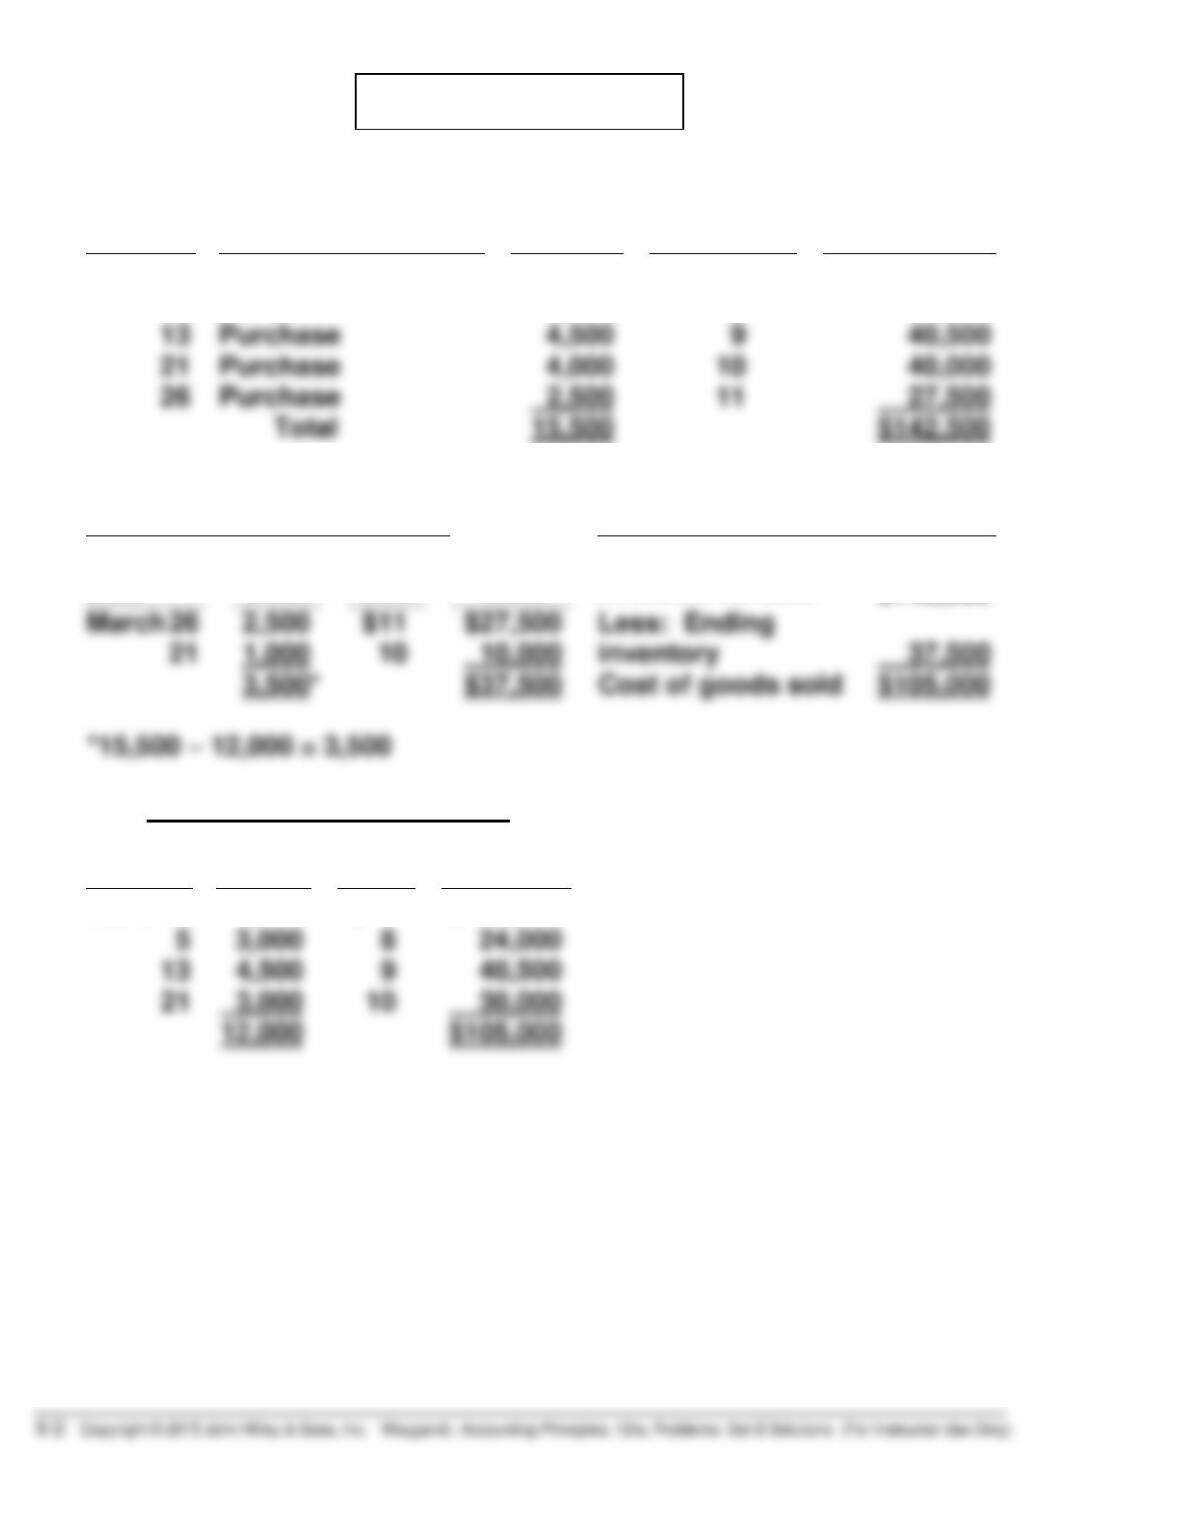
(a)
COST OF GOODS AVAILABLE FOR SALE
Date
Explanation
Units
Unit Cost
Total Cost
March 1
Beginning Inventory
1,500
$ 7
$ 10,500
5
Purchase
3,000
8
24,000
Purchase
4,500
Purchase
4,000
40,000
Purchase
Total
$142,500
(b)
FIFO
(1)
Ending Inventory
(2)
Cost of Goods Sold
Date
Units
Unit
Cost
Total
Cost
Cost of goods
available for sale
$142,500
March 26
$11
$27,500
inventory
37,500
1,000
$37,500
Cost of goods sold
$105,000
Proof of Cost of Goods Sold
Date
Units
Unit
Cost
Total
Cost
March 1
1,500
$ 7
$ 10,500
5
8
4,500
9
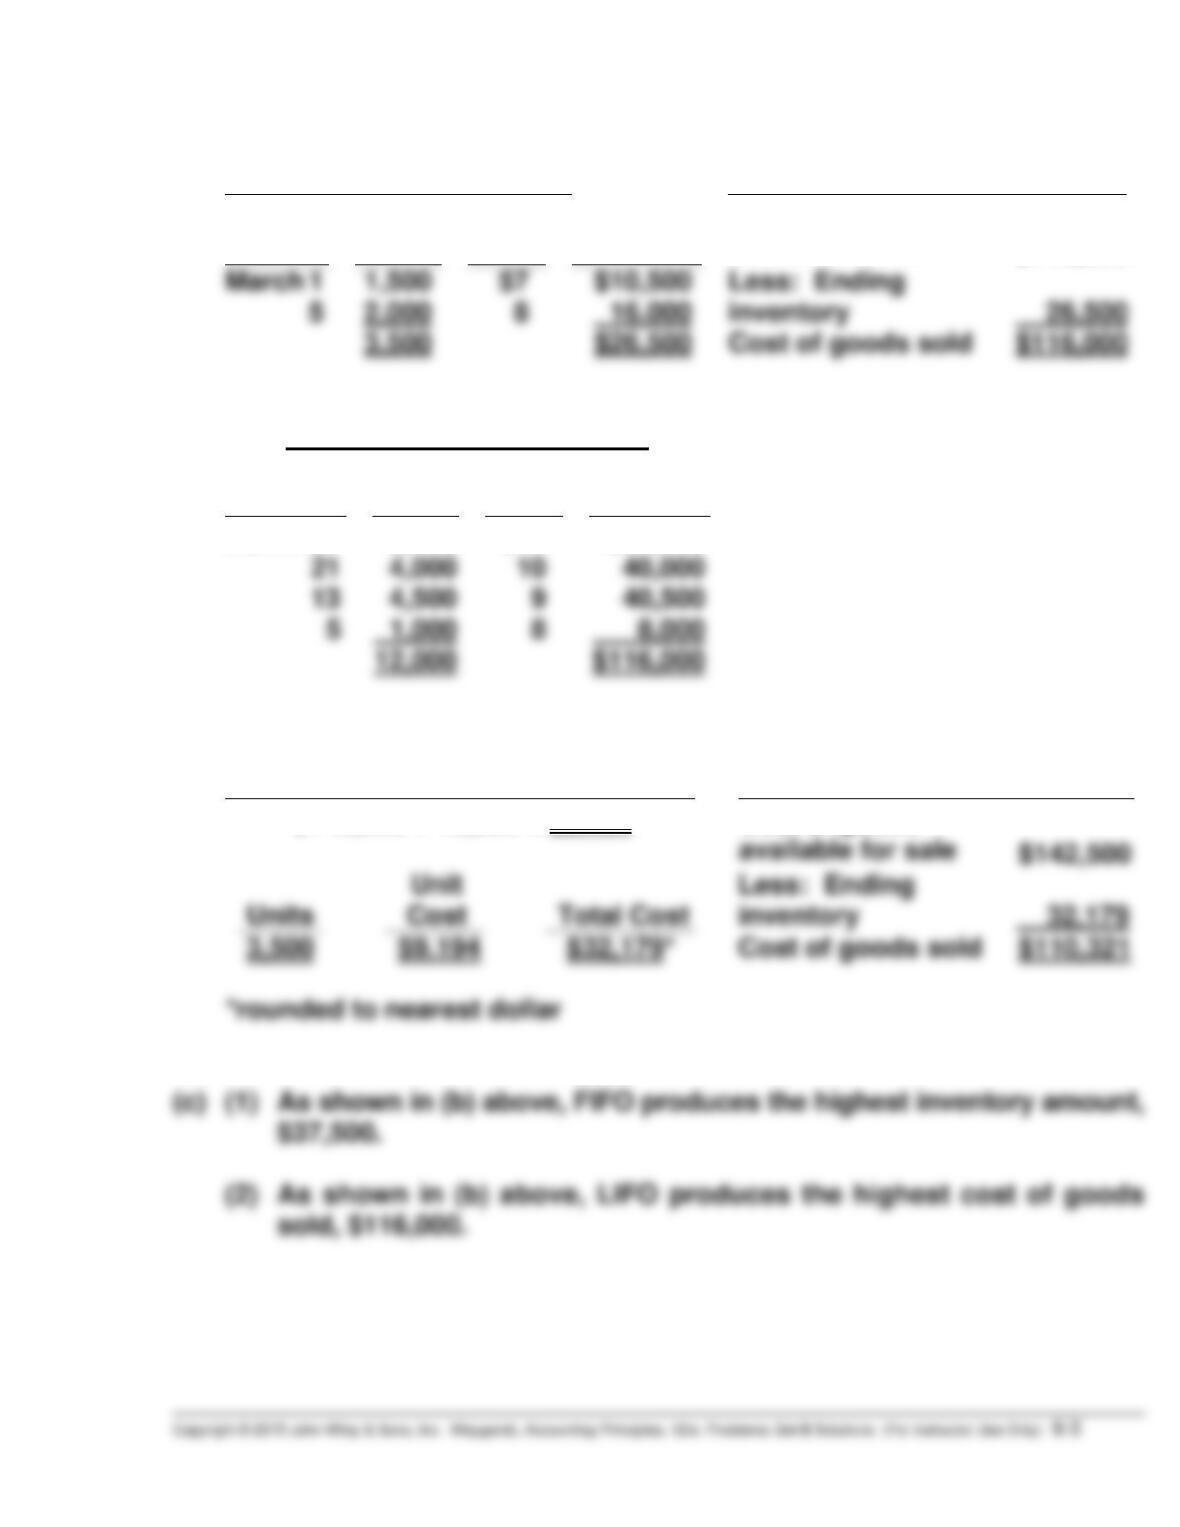
PROBLEM 6-2B (Continued)
LIFO
(1)
Ending Inventory
(2)
Cost of Goods Sold
Date
Units
Unit
Cost
Total
Cost
Cost of goods
available for sale
$142,500
March 1
1,500
$10,500
inventory
26,500
5
2,000
8
3,500
$26,500
Cost of goods sold
$116,000
Proof of Cost of Goods Sold
Date
Units
Unit
Cost
Total
Cost
March 26
2,500
$11
$27,500
4,000
4,500
5
8
12,000
AVERAGE-COST
(1)
Ending Inventory
(2)
Cost of Goods Sold
$142,500 ÷ 15,500 = $9.194
Cost of goods
available for sale
Cost
inventory
Cost of goods sold
(c) (1) As shown in (b) above, FIFO produces the highest inventory amount,
$37,500.
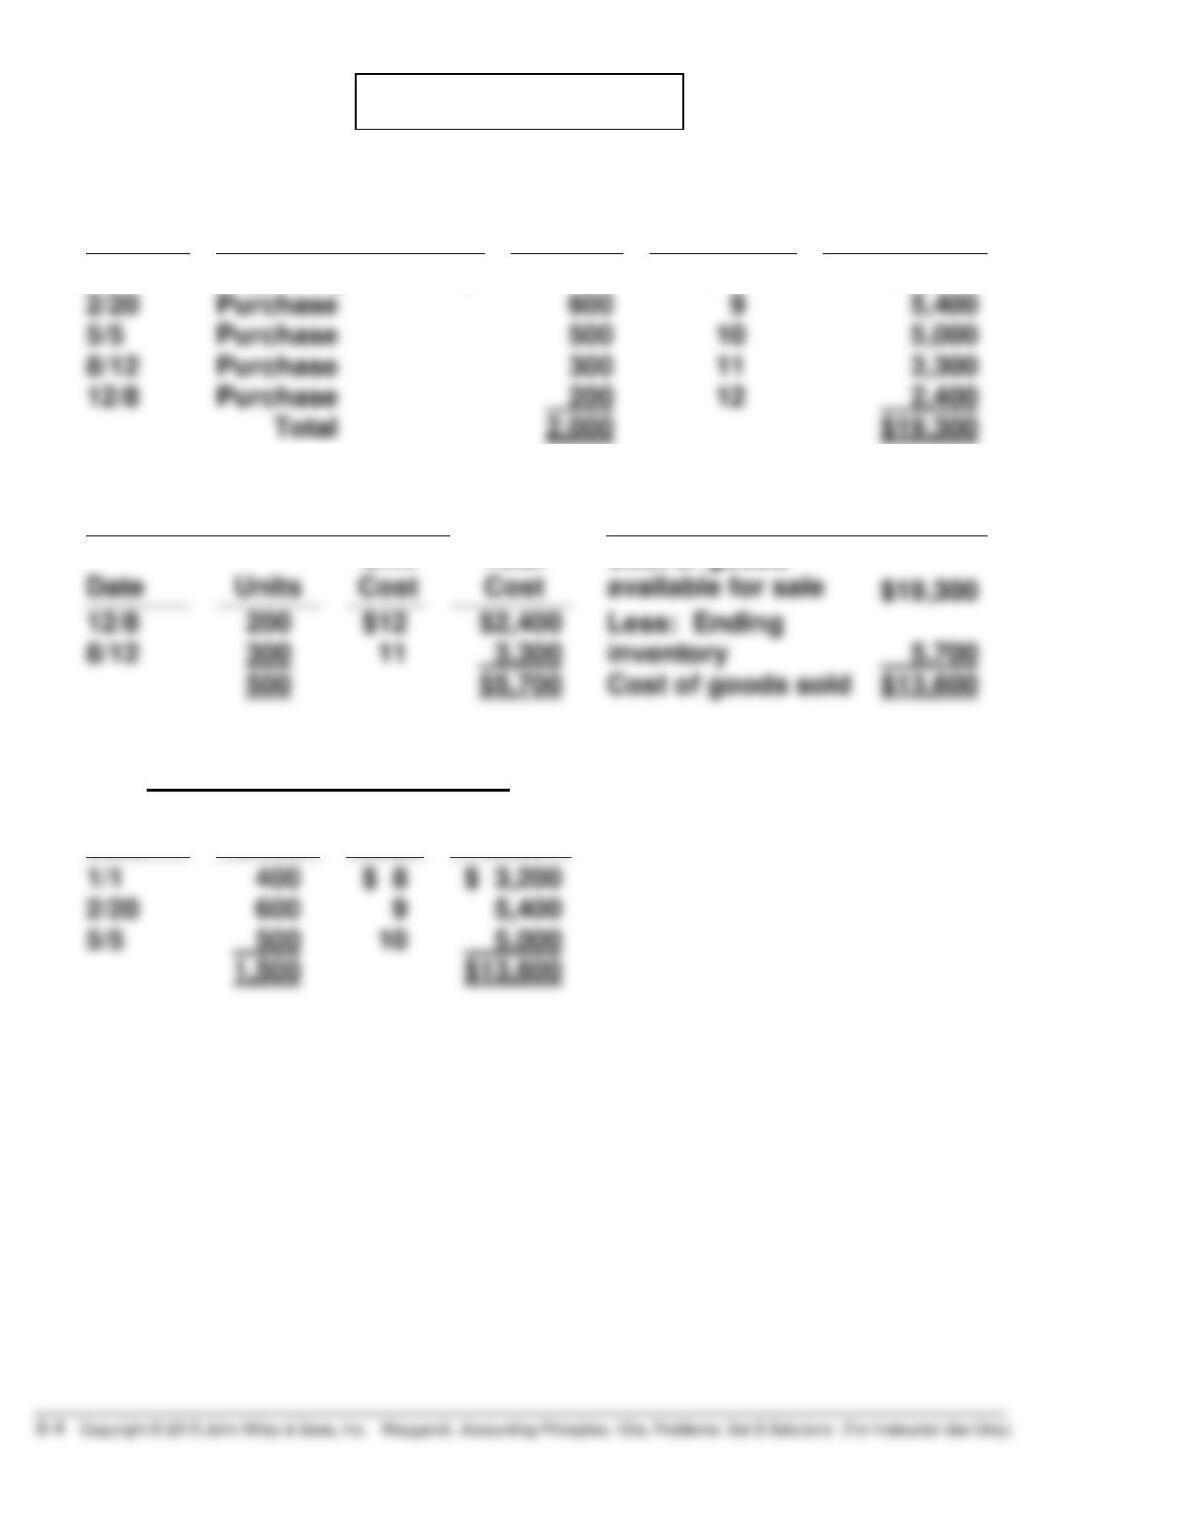
PROBLEM 6-3B
(a)
COST OF GOODS AVAILABLE FOR SALE
Date
Explanation
Units
Unit Cost
Total Cost
1/1
Beginning Inventory
400
$ 8
$ 3,200
2/20
Purchase
5/5
Purchase
8/12
Purchase
12/8
Purchase
Total
$19,300
(b)
FIFO
(1)
Ending Inventory
(2)
Cost of Goods Sold
Date
Units
Unit
Cost
Total
Cost
Cost of goods
available for sale
$19,300
12/8
$12
$2,400
Less: Ending
inventory
5,700
8/12
$5,700
Cost of goods sold
$13,600
Proof of Cost of Goods Sold
Date
Units
Unit
Cost
Total
Cost
1/1
$ 8
2/20
9
5/5
500
5,000
1,500
PROBLEM 6-3B (Continued)
(b)
LIFO
(1)
Ending Inventory
(2)
Cost of Goods Sold
Date
Units
Unit
Cost
Total
Cost
Cost of goods
available for sale
$19,300
1/1
400
$8
$3,200
inventory
4,100
2/20
100
9
500
$4,100
Cost of goods sold
Less: Ending
Proof of Cost of Goods Sold
Date
Units
Unit
Cost
Total
Cost
12/8
200
$12
$ 2,400
8/12
300
5/5
500
10
2/20
500
1,500
$15,200
AVERAGE-COST
(1)
Ending Inventory
(2)
Cost of Goods Sold
$19,300 ÷ 2,000 = $9.65
Cost of goods
available for sale
$19,300
Units
inventory
Cost of goods sold
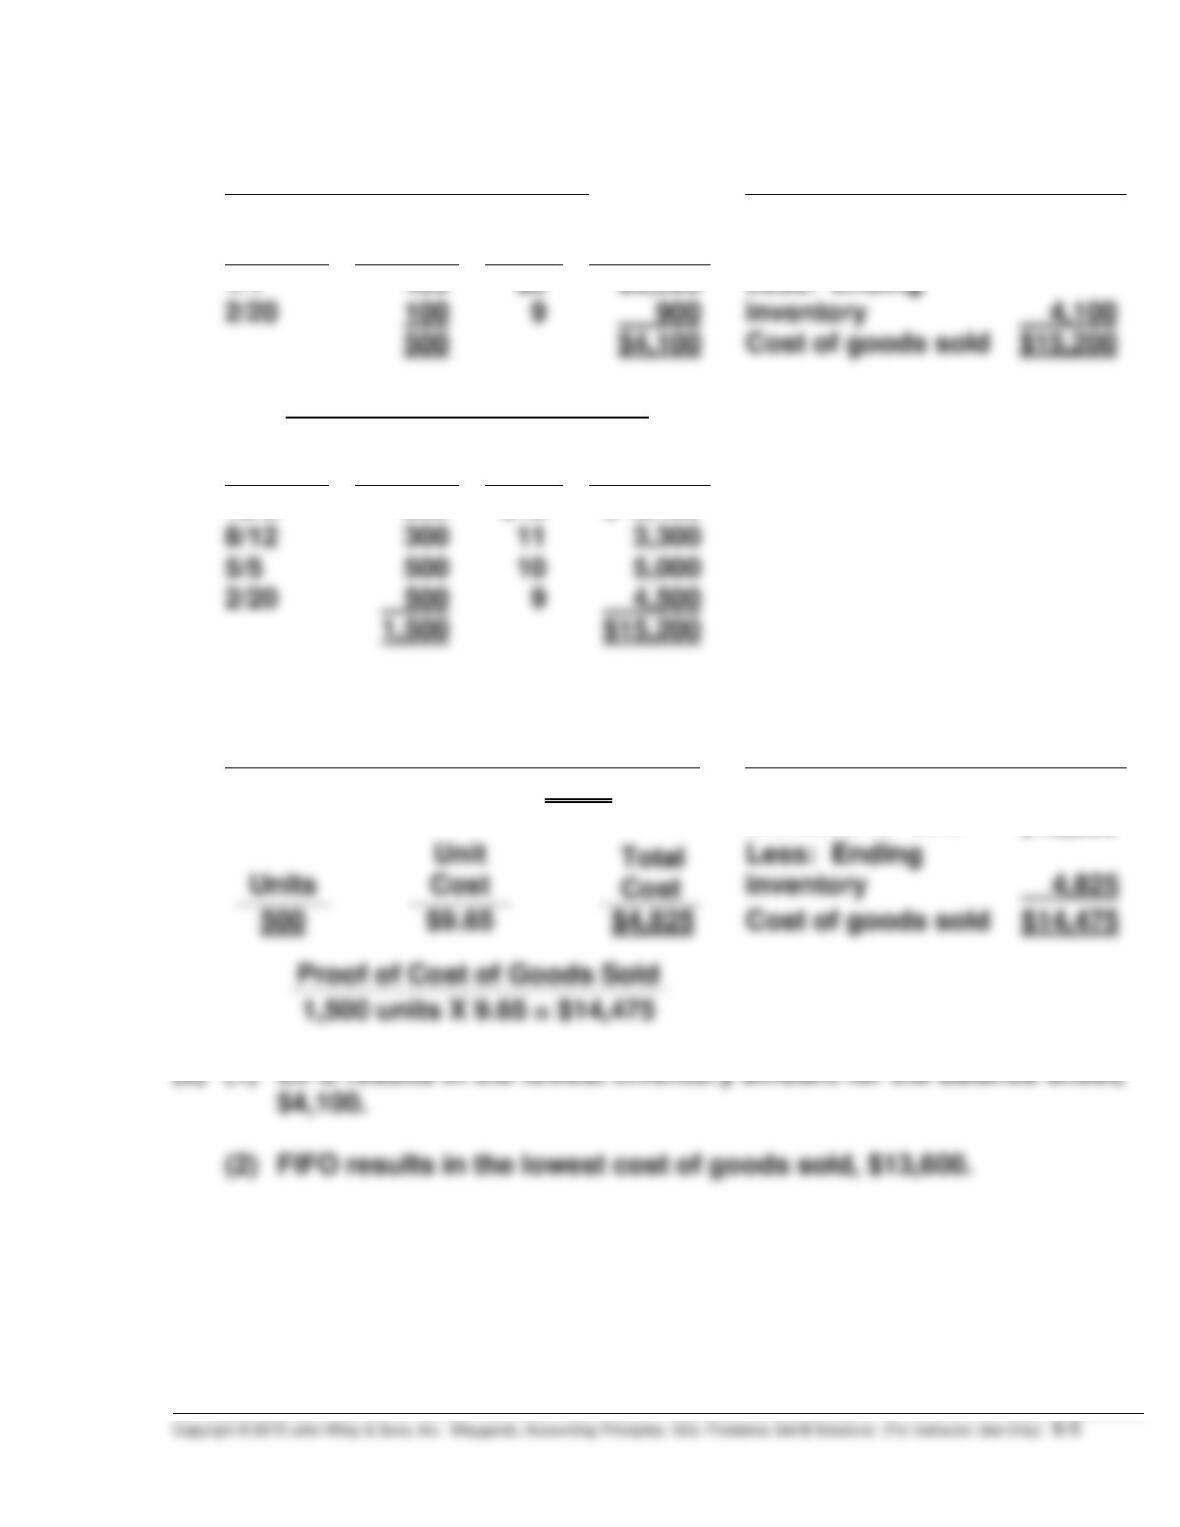
(c) (1) LIFO results in the lowest inventory amount for the balance sheet,
$4,100.
PROBLEM 6-4B
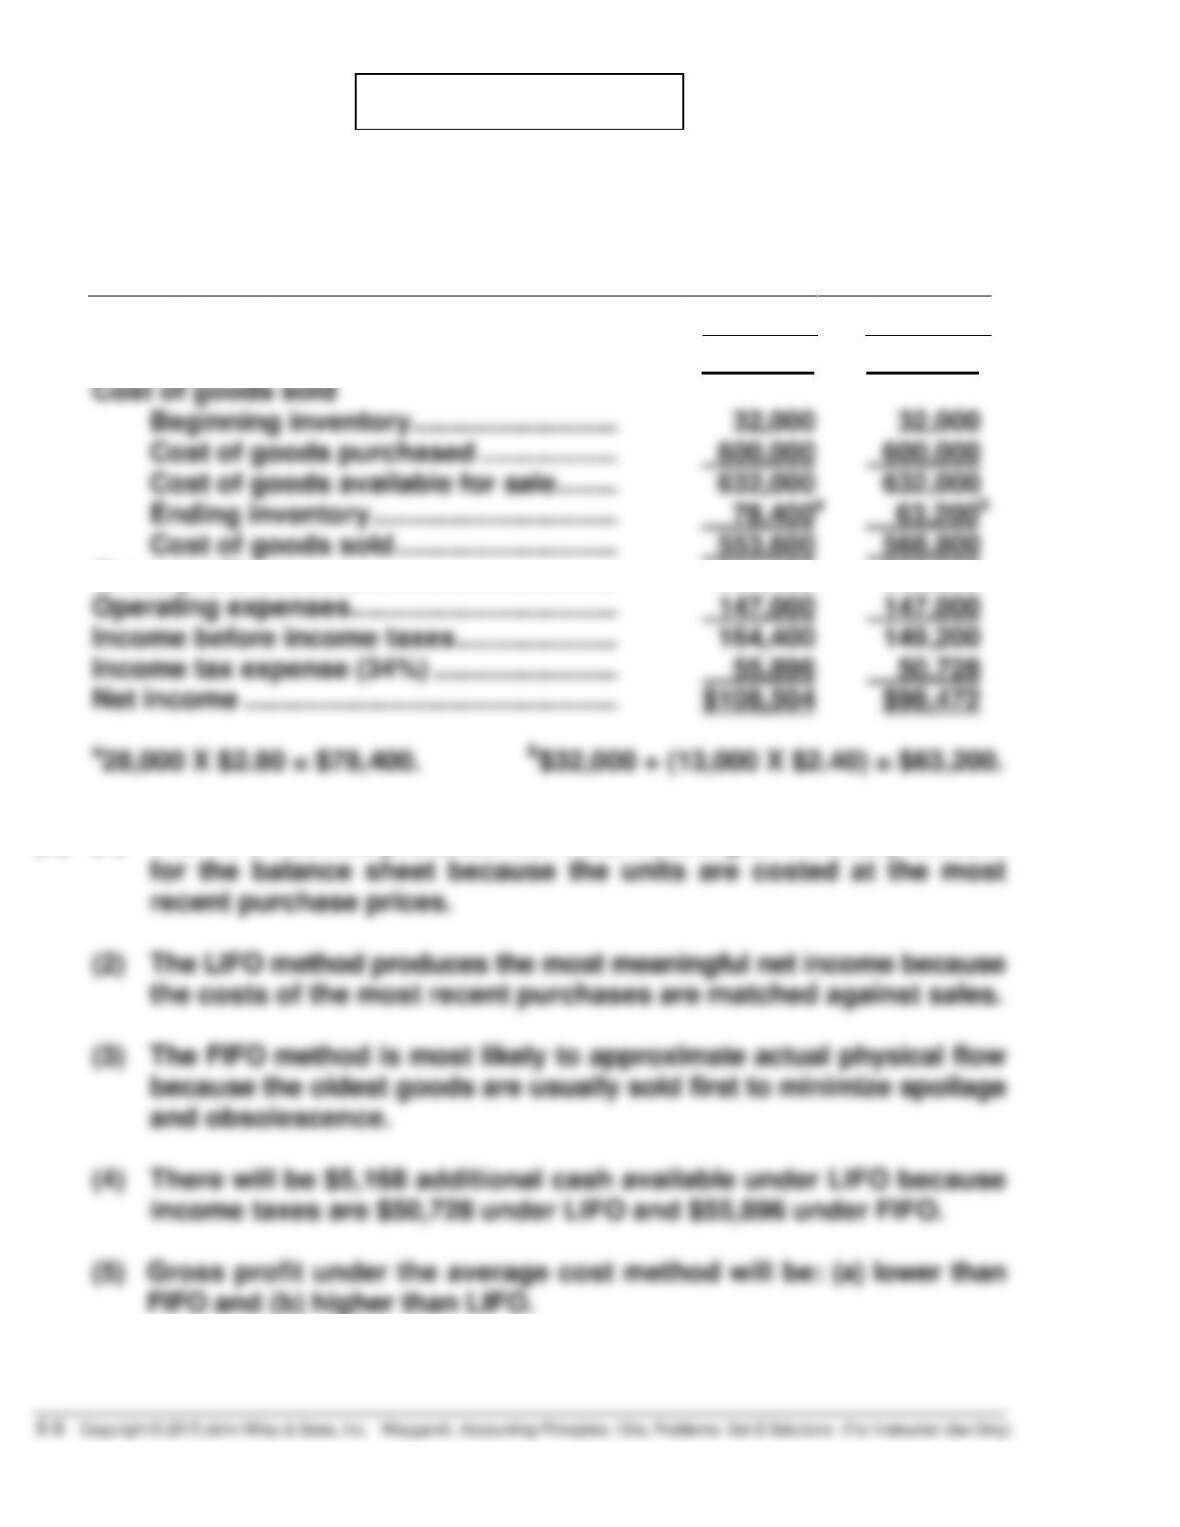
(a) Patel CO.
Condensed Income Statement
For the Year Ended December 31, 2017
FIFO
LIFO
Sales revenue ……………………………………… $865,000 $865,000
Cost of goods sold
Beginning inventory ……………………… 32,000 32,000
Cost of goods sold ……………………….. 553,600 568,800
Gross profit ………………………………………… 311,400 296,200
(b) (1) The FIFO method produces the most meaningful inventory amount
for the balance sheet because the units are costed at the most
recent purchase prices.
(2) The LIFO method produces the most meaningful net income because
the costs of the most recent purchases are matched against sales.

PROBLEM 6-5B
Cost of Goods Available for Sale
Date
Explanation
Units
Unit Cost
Total Cost
October 1
Beginning Inventory
60
$25
$1,500
9
Purchase
120
26
3,120
Purchase
70
Purchase
28
330
Ending Inventory in Units:
Sales Revenue
Units available for sale
330
Unit
Sales (100 + 60 + 110)
270
Date
Units
Price
Total Sales
Units remaining in ending inventory
60
October 11
100
$35
$ 3,500
2,400
110
270
(a)
(1)
LIFO
(i)
Ending Inventory
(ii)
Cost of Goods Sold
October 1
60 @ $25 = $1,500
Cost of goods available
for sale
$8,750
Less: Ending inventory
1,500
Cost of goods sold
(iii)
Gross Profit
(iv)
Gross Profit Rate
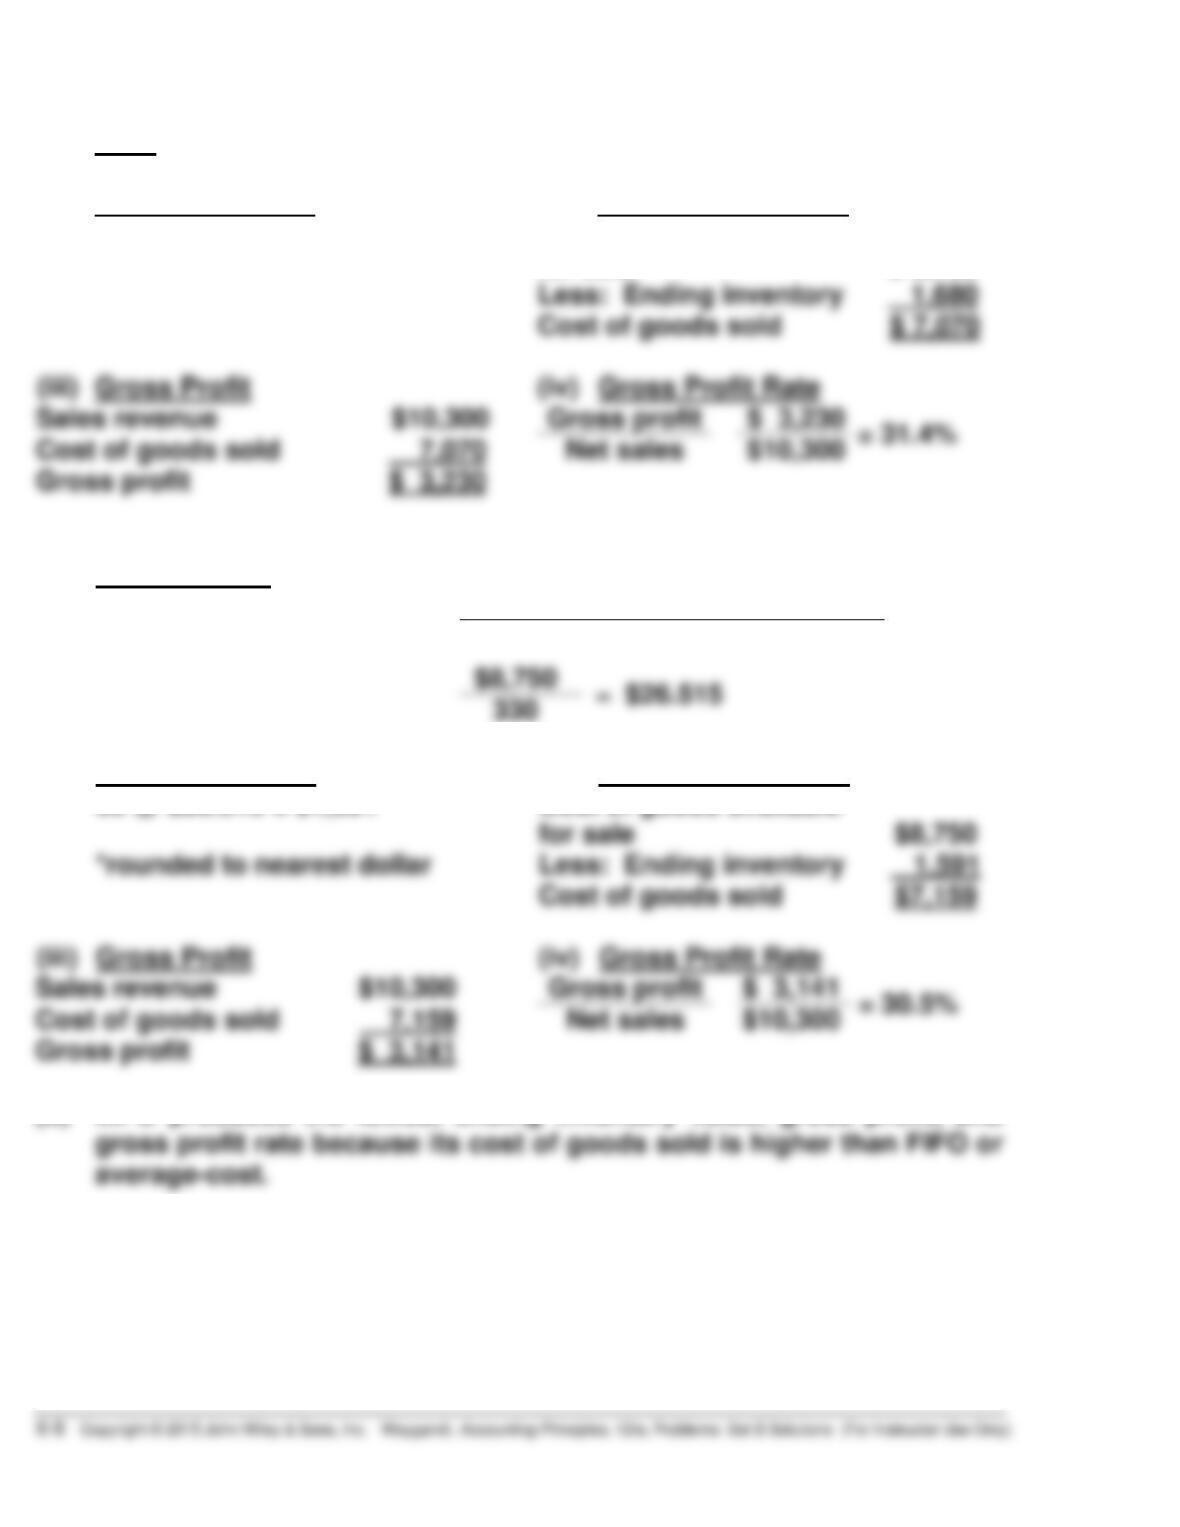
PROBLEM 6-5B (Continued)
(2)
FIFO
(i)
Ending Inventory
(ii)
Cost of Goods Sold
October 25
60 @ $28 = $1,680
Cost of goods available
for sale
$ 8,750
Less: Ending inventory
Cost of goods sold
(iii)
Gross Profit
(iv)
Gross Profit Rate
Sales revenue
$10,300
Cost of goods sold
Gross profit
$ 3,230
(3)
Average-Cost
Weighted-average cost per unit:
cost of goods available for sale
units available for sale
330
(i)
Ending Inventory
(ii)
Cost of Goods Sold
for sale
*rounded to nearest dollar
Less: Ending inventory
Cost of goods sold
(iii)
Gross Profit
(iv)
Gross Profit Rate
Sales revenue
Cost of goods sold
$10,300
Gross profit
60 @ $26.515 = $1,591*
Cost of goods available
(b) LIFO produces the lowest ending inventory value, gross profit, and
gross profit rate because its cost of goods sold is higher than FIFO or
average-cost.
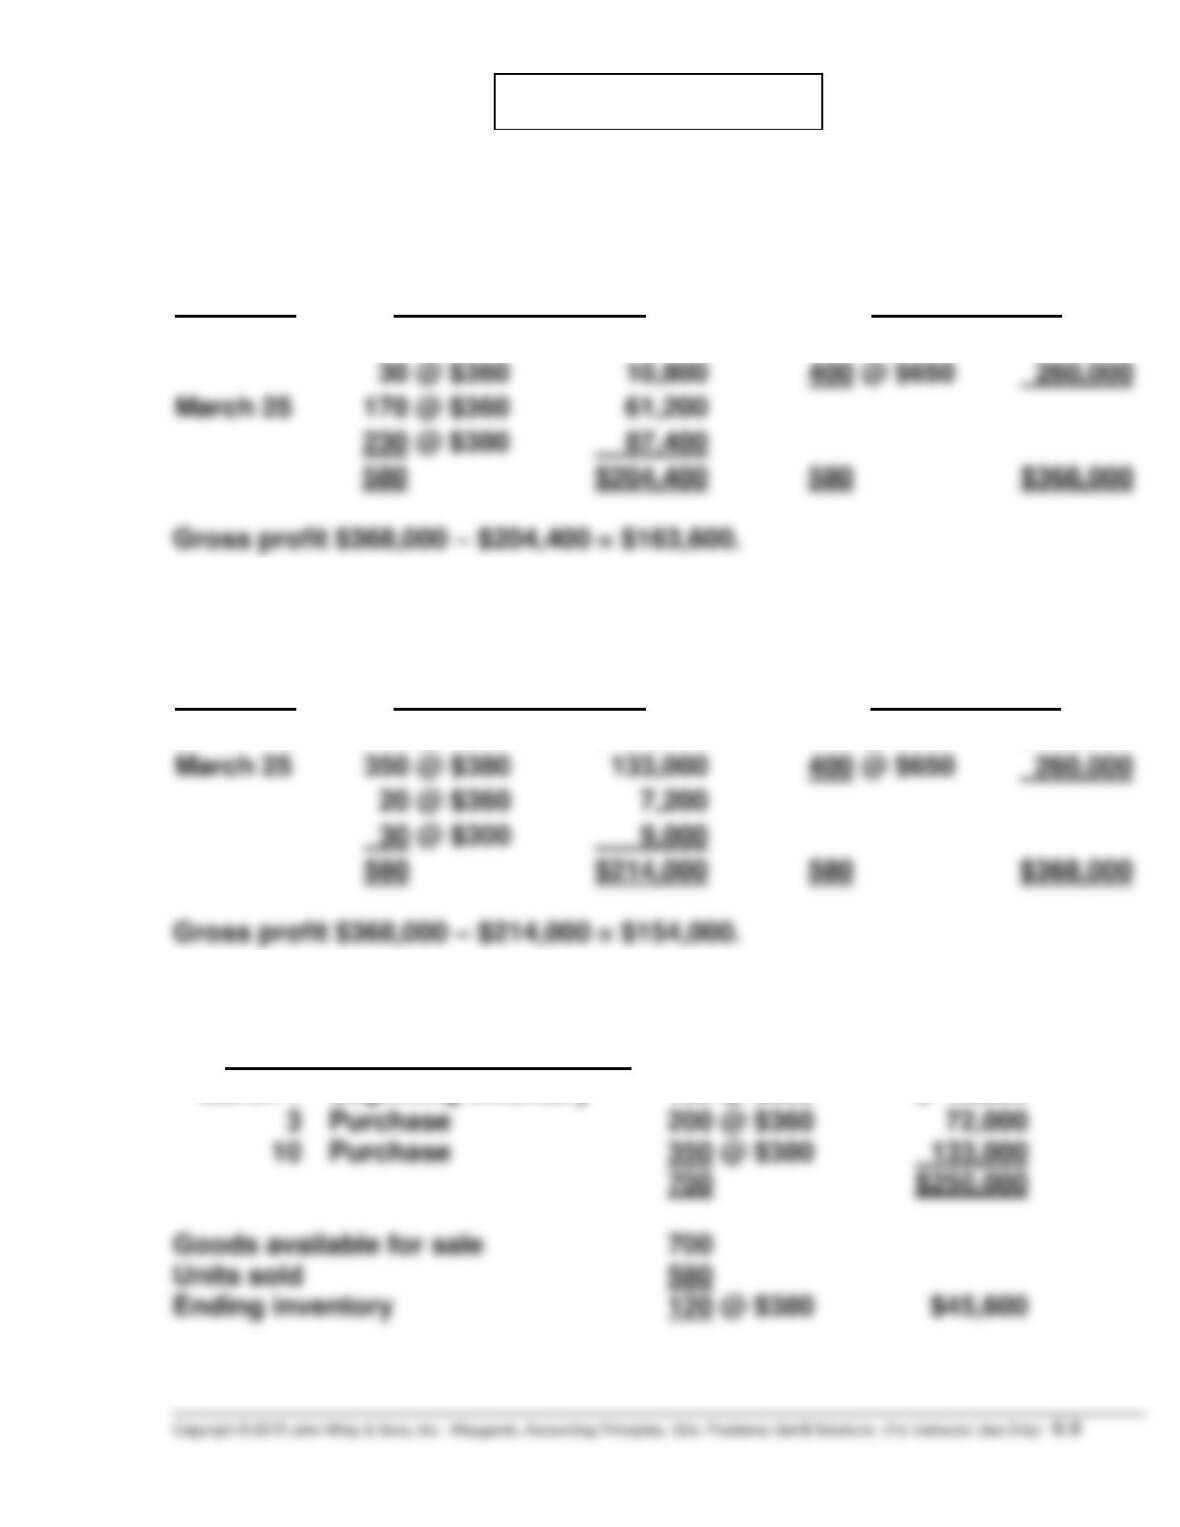
PROBLEM 6-6B
(a) (1) To maximize gross profit, Princess Diamonds should sell the
diamonds with the lowest cost.
Sale Date
Cost of Goods Sold
Sales Revenue
March 5
150 @ $300
$ 45,000
180 @ $600
$108,000
March 25
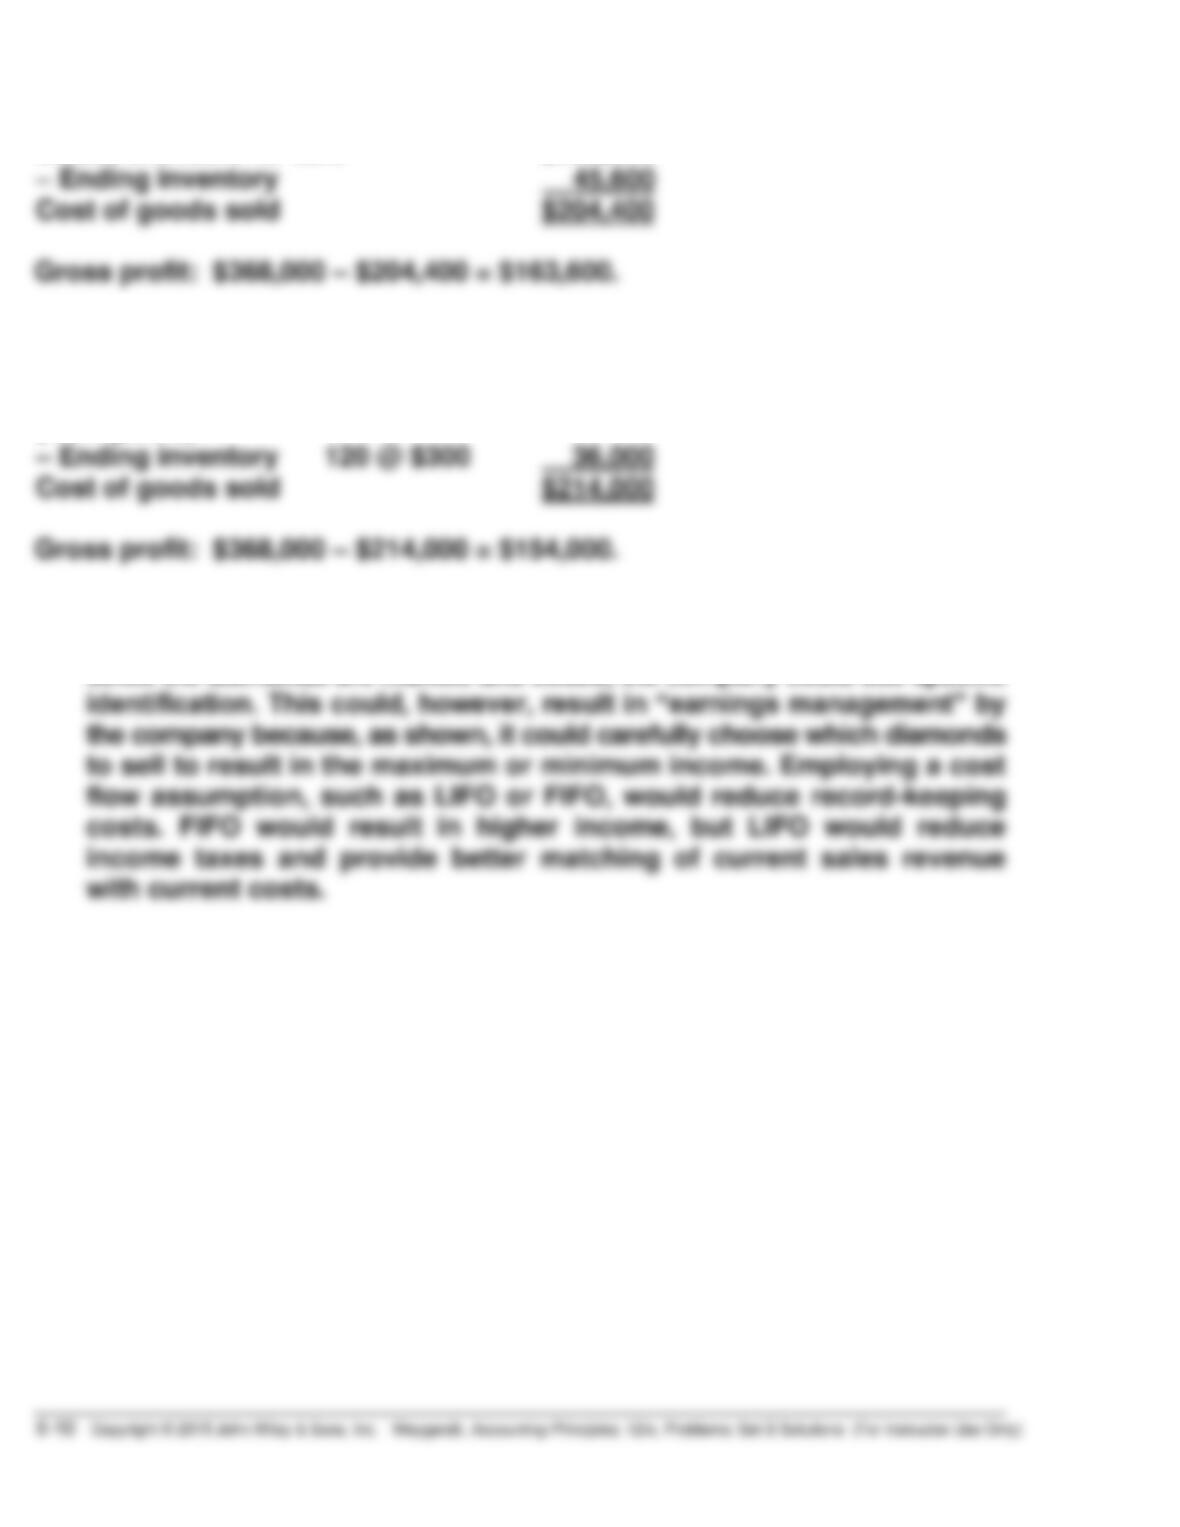
170 @ $360
$204,400
580
$368,000
(2) To minimize gross profit, Princess Diamonds should sell the diamonds
with the highest cost.
Sale Date
Cost of Goods Sold
Sales Revenue
March 5
180 @ $360
$ 64,800
180 @ $600
$108,000
March 25
350 @ $380
400 @ $650
9,000
$214,000
580
$368,000
(b) FIFO
Cost of goods available for sale
March 1
Beginning inventory
150 @ $300
$ 45,000
3
Purchase
200 @ $360
72,000
Ending inventory
PROBLEM 6-6B (Continued)
Goods available for sale
$250,000
Cost of goods sold
$204,400
(c) LIFO
Cost of goods available for sale
$250,000
(from part b)
Cost of goods sold
$214,000
(d) The choice of inventory method depends on the company’s objectives.
Since the diamonds are marked and coded, the company could use specific
identification. This could, however, result in “earnings management” by
PROBLEM 6-7B
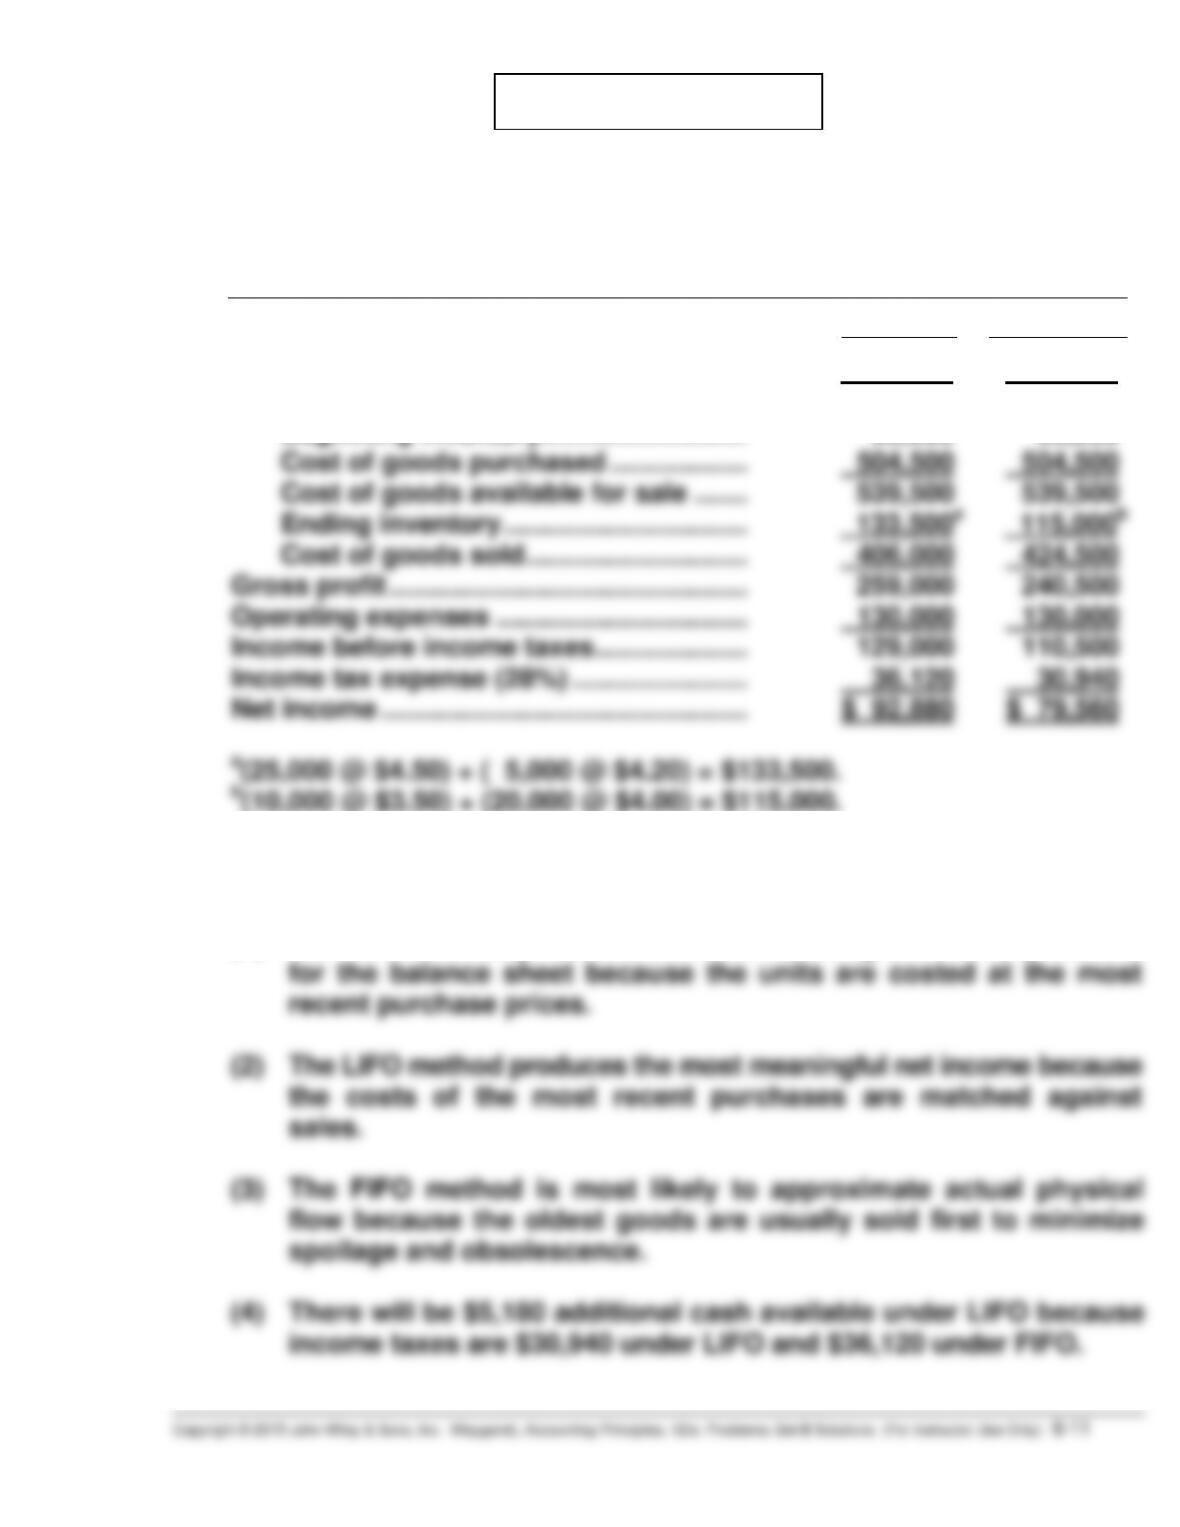
(a) Chelsea INC.
Condensed Income Statement
For the Year Ended December 31, 2017
FIFO
LIFO
Sales revenue ……………………………………. $665,000 $665,000
Cost of goods sold
Beginning inventory……………………… 35,000 35,000
Cost of goods purchased ……………… 504,500 504,500
Cost of goods available for sale ……. 539,500 539,500
Ending inventory ………………………….. 133,500a 115,000b
(b) Answers to questions:
(1) The FIFO method produces the most meaningful inventory amount
for the balance sheet because the units are costed at the most
recent purchase prices.
6-12 Copyright © 2015 John Wiley & Sons, Inc. Weygandt, Accounting Principles, 12/e, Problems: Set B Solutions (For Instructor Use Only)
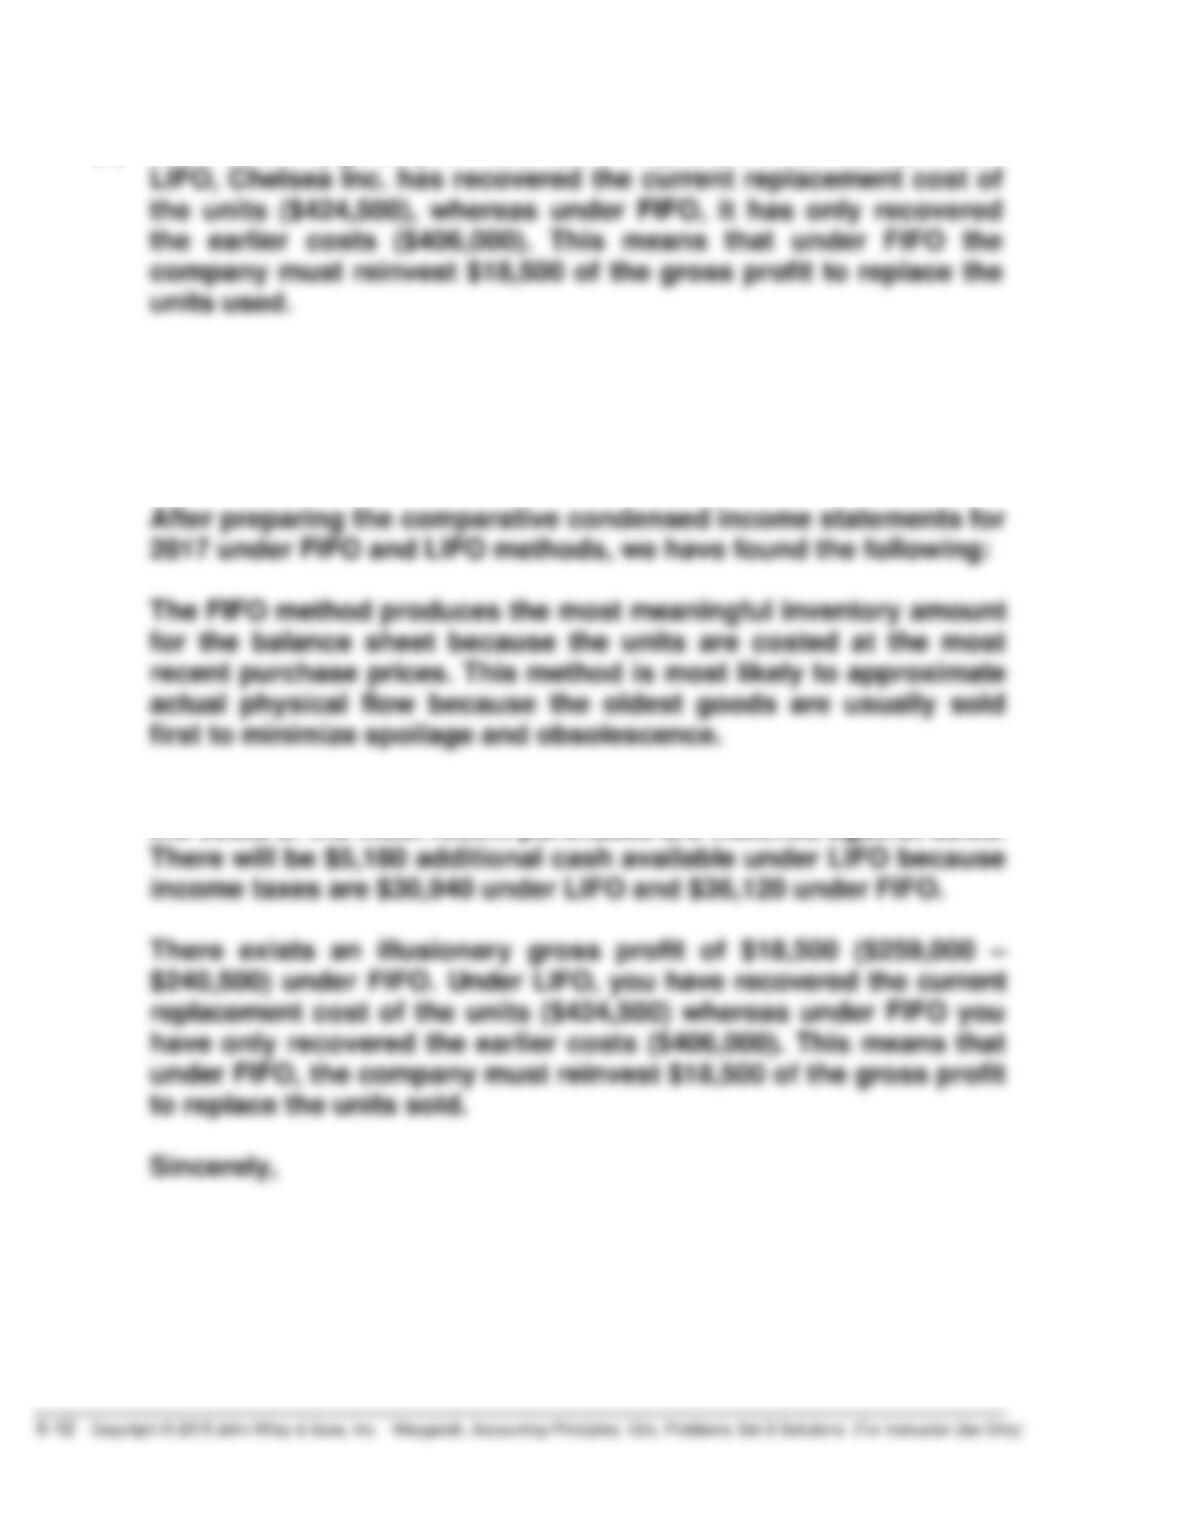
PROBLEM 6-7B (Continued)
(5) The illusionary gross profit is $18,500 or ($259,000 – $240,500). Under
LIFO, Chelsea Inc. has recovered the current replacement cost of
the units ($424,500), whereas under FIFO, it has only recovered
the earlier costs ($406,000). This means that under FIFO the
company must reinvest $18,500 of the gross profit to replace the
units used.
Answer in business letter form:
Dear Chelsea Inc.
The LIFO method produces the most meaningful net income because
the costs of the most recent purchases are matched against sales.
There will be $5,180 additional cash available under LIFO because
income taxes are $30,940 under LIFO and $36,120 under FIFO.
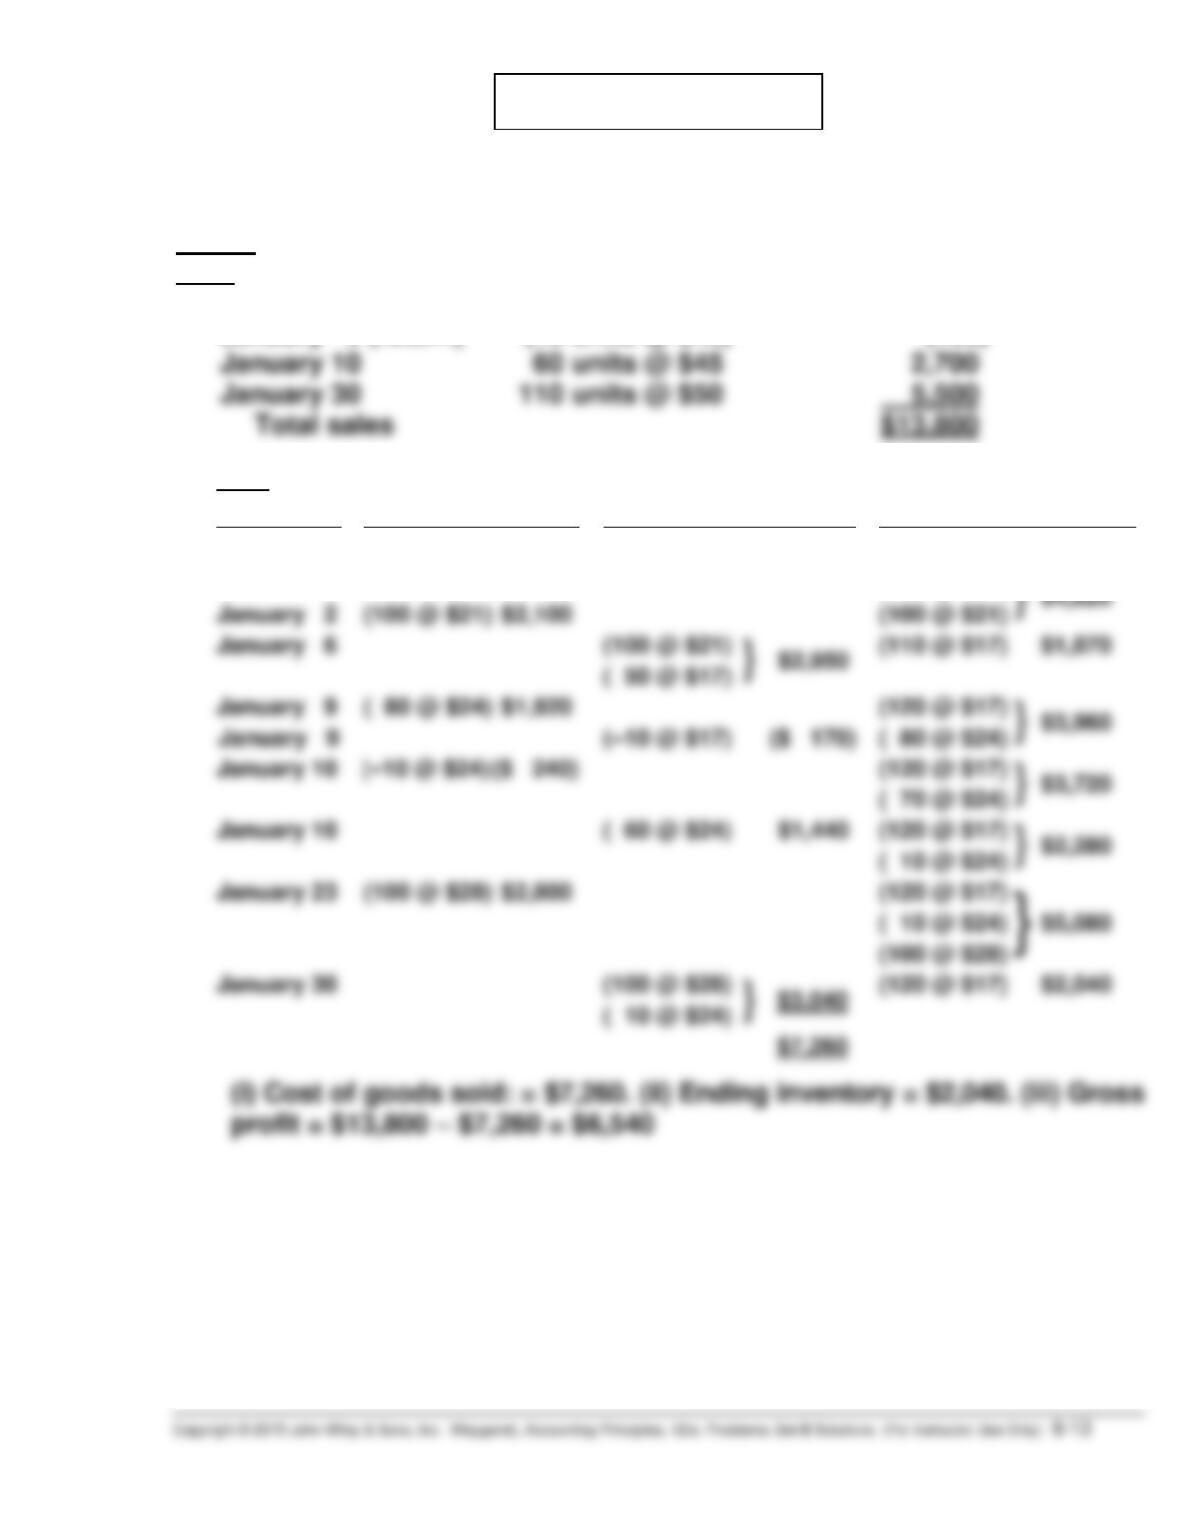
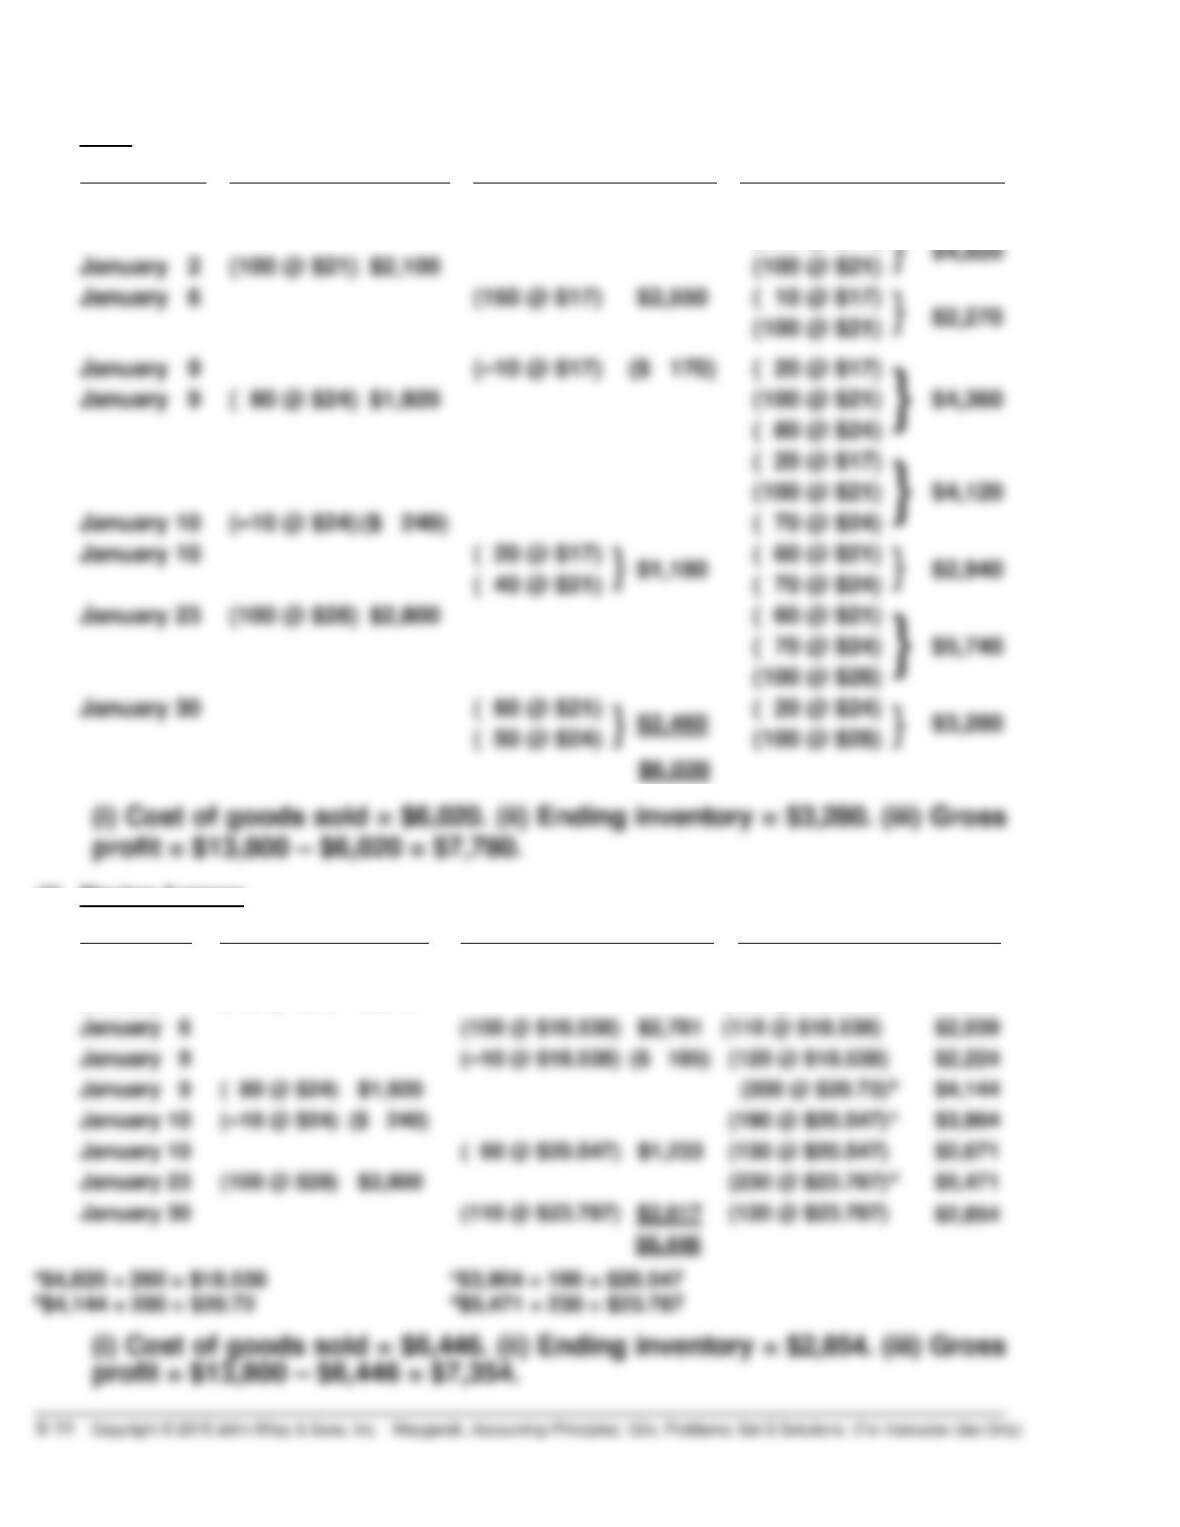
*PROBLEM 6-8B
(a)
Sales:
Date
January 6
150 units @ $40
$ 6,000
January 9 (return)
(10 units @ $40)
(400)
January 30
110 units @ $50
5,500
(1)
LIFO
Date
Purchases
Cost of Goods Sold
Balance
January 1
(160 @ $17)
$2,720
(160 @ $17)
January 2
(100 @ $21) $2,100
(100 @ $21)
January 6
(100 @ $21)
(110 @ $17)
$1,870
( 50 @ $17)
January 9
( 80 @ $24) $1,920
(120 @ $17)
}
$3,960
( 80 @ $24)
January 10
(120 @ $17)
}
$3,720
( 70 @ $24)
January 10
( 60 @ $24) $1,440
(120 @ $17)
}
$2,280
( 10 @ $24)
January 23
(100 @ $28) $2,800
(120 @ $17)
( 10 @ $24)
$5,080
(100 @ $28)
January 30
(100 @ $28)
(120 @ $17)
$2,040
( 10 @ $24)
*PROBLEM 6-8B (Continued)
(2)
FIFO
Date
Purchases
Cost of Goods Sold
Balance
January 1
(160 @ $17)
$2,720
(160 @ $17)
}
$4,820
January 2
(100 @ $21) $2,100
(100 @ $21)
January 6
(150 @ $17)
January 9
(–10 @ $17)
($ 170)
( 20 @ $17)
}
$4,360
January 9
( 80 @ $24) $1,920
(100 @ $21)
( 80 @ $24)
( 20 @ $17)
}
$4,120
(100 @ $21)
January 10
(–10 @ $24) ($ 240)
( 70 @ $24)
January 10
( 20 @ $17)
( 60 @ $21)
$2,940
( 40 @ $21)
( 70 @ $24)
January 23
(100 @ $28) $2,800
( 60 @ $21)
}
$5,740
( 70 @ $24)
(100 @ $28)
January 30
( 60 @ $21)
( 20 @ $24)
$3,280
( 50 @ $24)
(100 @ $28)
(3)
Moving-Average
Date
Purchases
Cost of goods sold
Balance
January 1
(160 @ $17)
$2,720
January 2
(100 @ $21) $2,100
(260 @ $18.538)a
$4,820
January 6
(150 @ $18.538)
$2,781
(110 @ $18.538)
$2,039
January 9
(120 @ $18.538)
$2,224
January 9
( 80 @ $24) $1,920
$4,144
January 10
(190 @ $20.547)
c
$3,904
January 10
( 60 @ $20.547)
$1,233
(130 @ $20.547)
$2,671
January 23
(100 @ $28) $2,800
(230 @ $23.787)
$5,471
January 30
(110 @ $23.787)
$2,617
(120 @ $23.787)
$2,854
$6,446
*PROBLEM 6-8B (Continued)
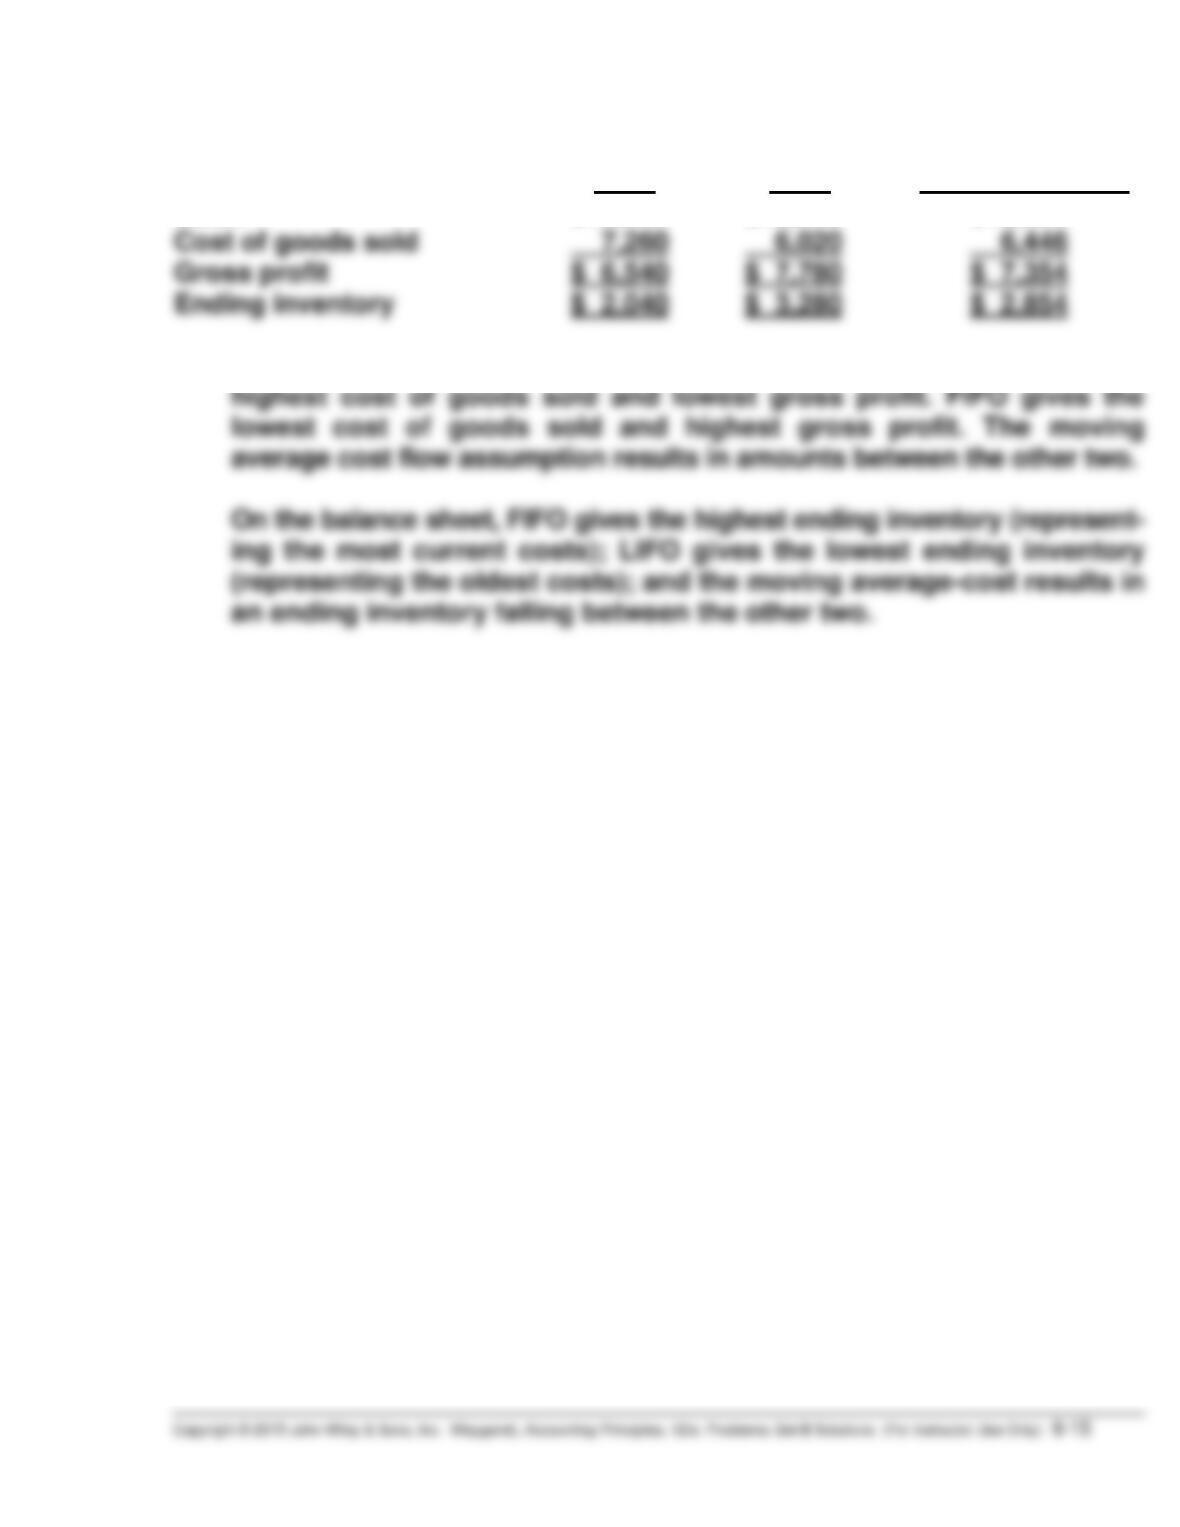
(b)
Gross profit:
LIFO
FIFO
Moving-Average
Sales
$13,800
$13,800
$13,800
Cost of goods sold
Gross profit
Ending inventory
In a period of rising costs, the LIFO cost flow assumption results in the
highest cost of goods sold and lowest gross profit. FIFO gives the
lowest cost of goods sold and highest gross profit. The moving
average cost flow assumption results in amounts between the other two.
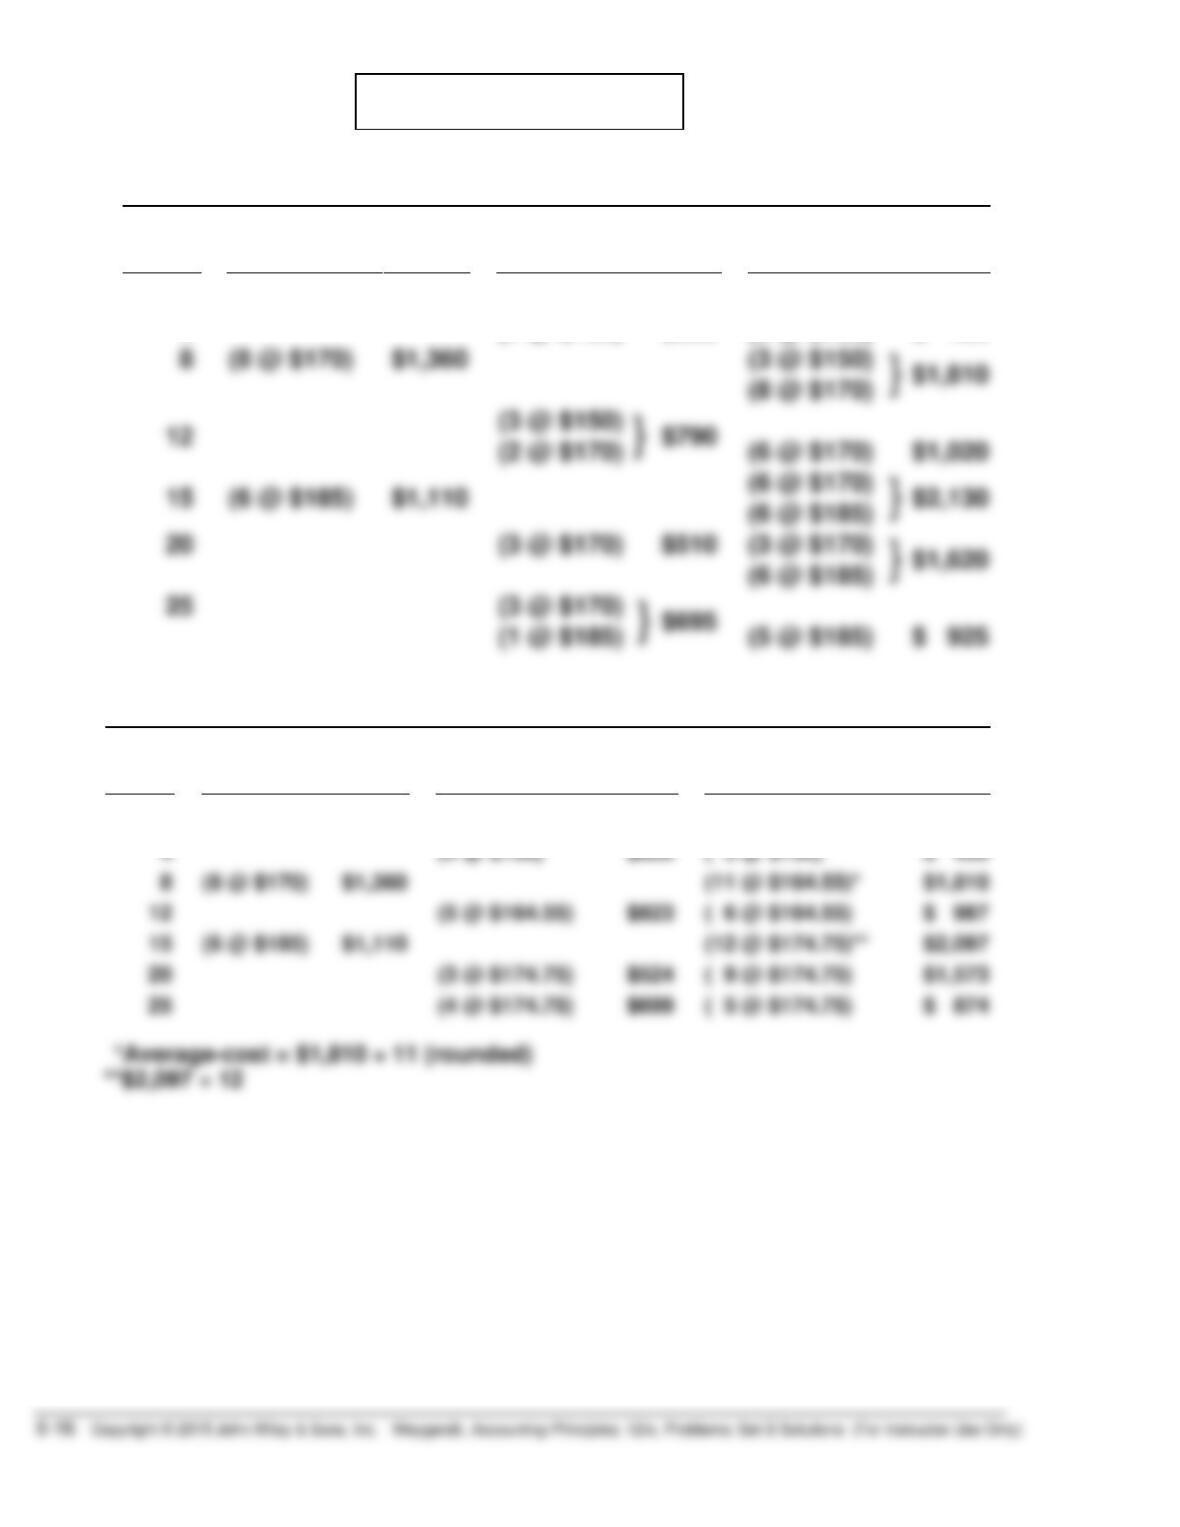
*PROBLEM 6-9B
(a)
(1)
FIFO
Date
Purchases
Cost of
Goods Sold
Balance
May 1
(7 @ $150)
$1,050
(7 @ $150)
$1,050
(4 @ $150)
(3 @ $150)
}
$1,810
(8 @ $170)
12
(3 @ $150)
15
(6 @ $185)
$1,110
(6 @ $170)
}
$2,130
(6 @ $185)
}
$1,620
(6 @ $185)
(3 @ $170)
(2)
MOVING-AVERAGE COST
Date
Purchases
Cost of
Goods Sold
Balance
May 1
(7 @ $150)
$1,050
( 7 @ $150)
$1,050
4
(4 @ $150)
$600
( 3 @ $150)
$ 450
(8 @ $170)
$1,360
(11 @ $164.55)*
$1,810
(5 @ $164.55)
( 6 @ $164.55)
$ 987
(6 @ $185)
$1,110
(12 @ $174.75)**
$2,097
(3 @ $174.75)
( 9 @ $174.75)
$1,573
(4 @ $174.75)
( 5 @ $174.75)
$ 874
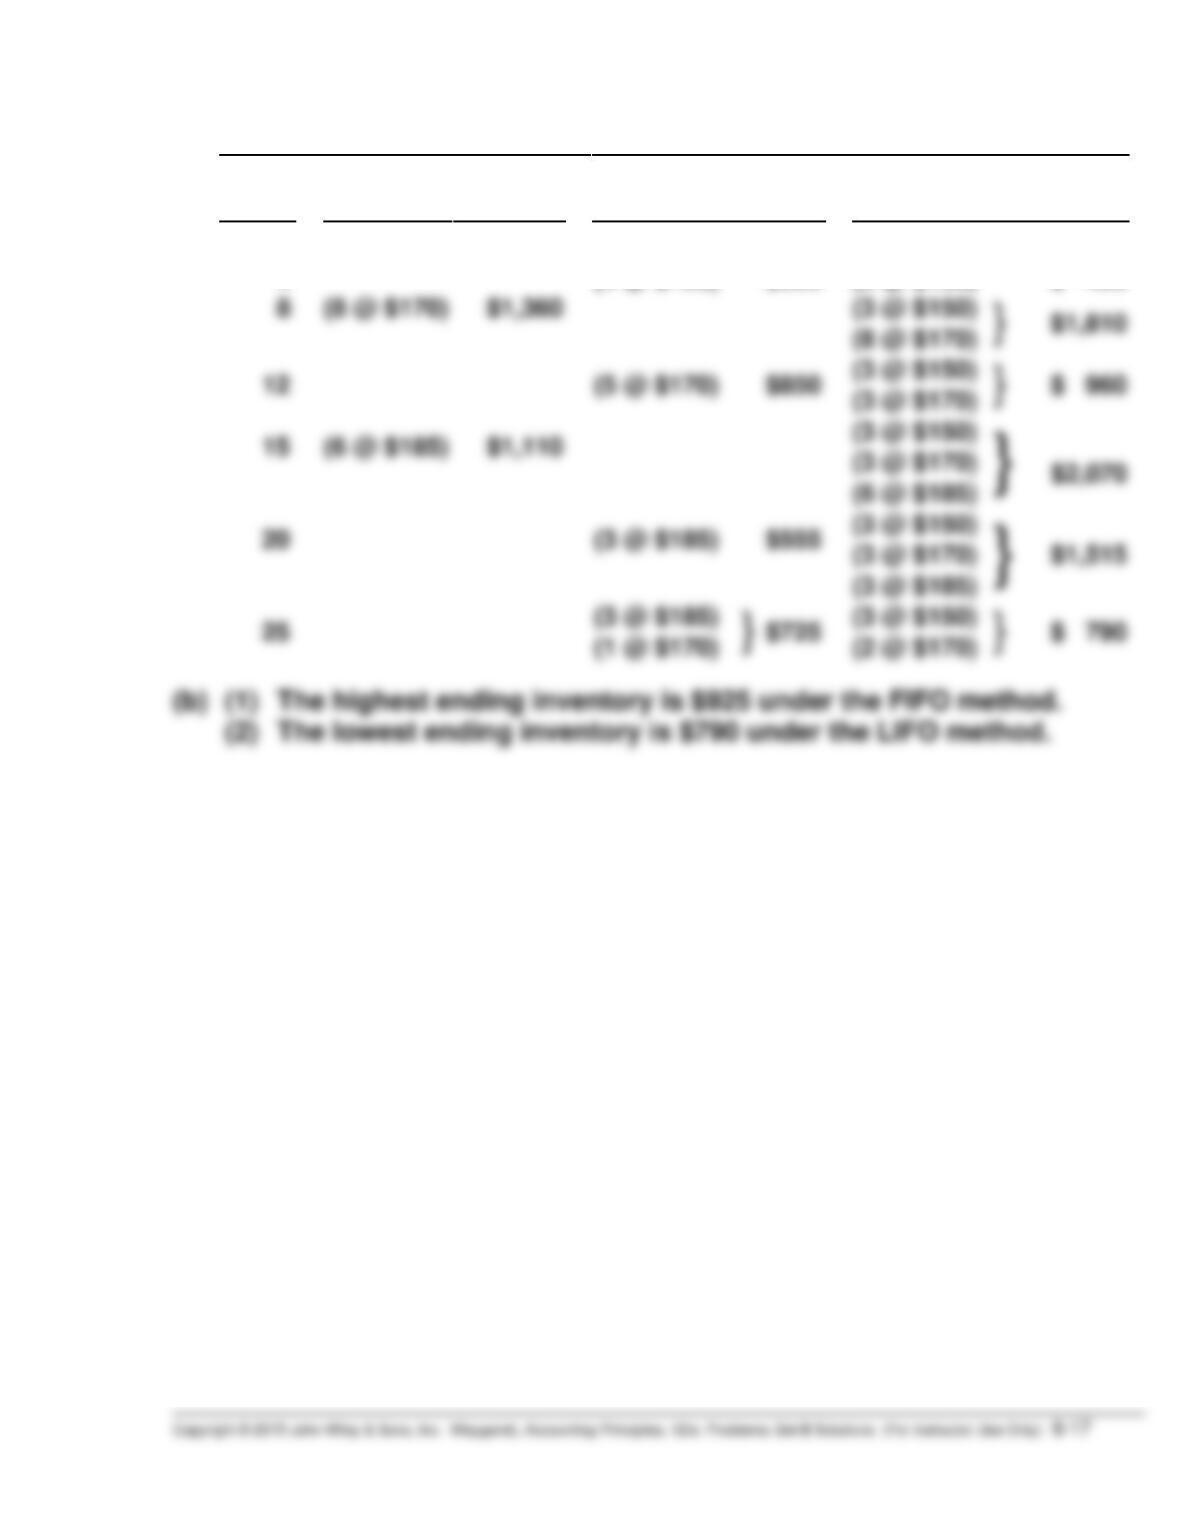
*PROBLEM 6-9B (Continued)
(3)
LIFO
Date
Purchases
Cost of
Goods Sold
Balance
May 1
(7 @ $150)
$1,050
(7 @ $150)
$1,050
4
(4 @ $150)
$600
(3 @ $150)
$ 450
8
(8 @ $170)
$1,360
(3 @ $150)
(8 @ $170)
12
(5 @ $170)
(3 @ $150)
(3 @ $170)
15
(6 @ $185)
$1,110
(3 @ $150)
}
$2,070
(3 @ $170)
(6 @ $185)
20
(3 @ $185)
(3 @ $150)
(3 @ $170)
(3 @ $185)
25
(3 @ $185)
(3 @ $150)
(1 @ $170)
(2 @ $170)
(b) (1) The highest ending inventory is $925 under the FIFO method.
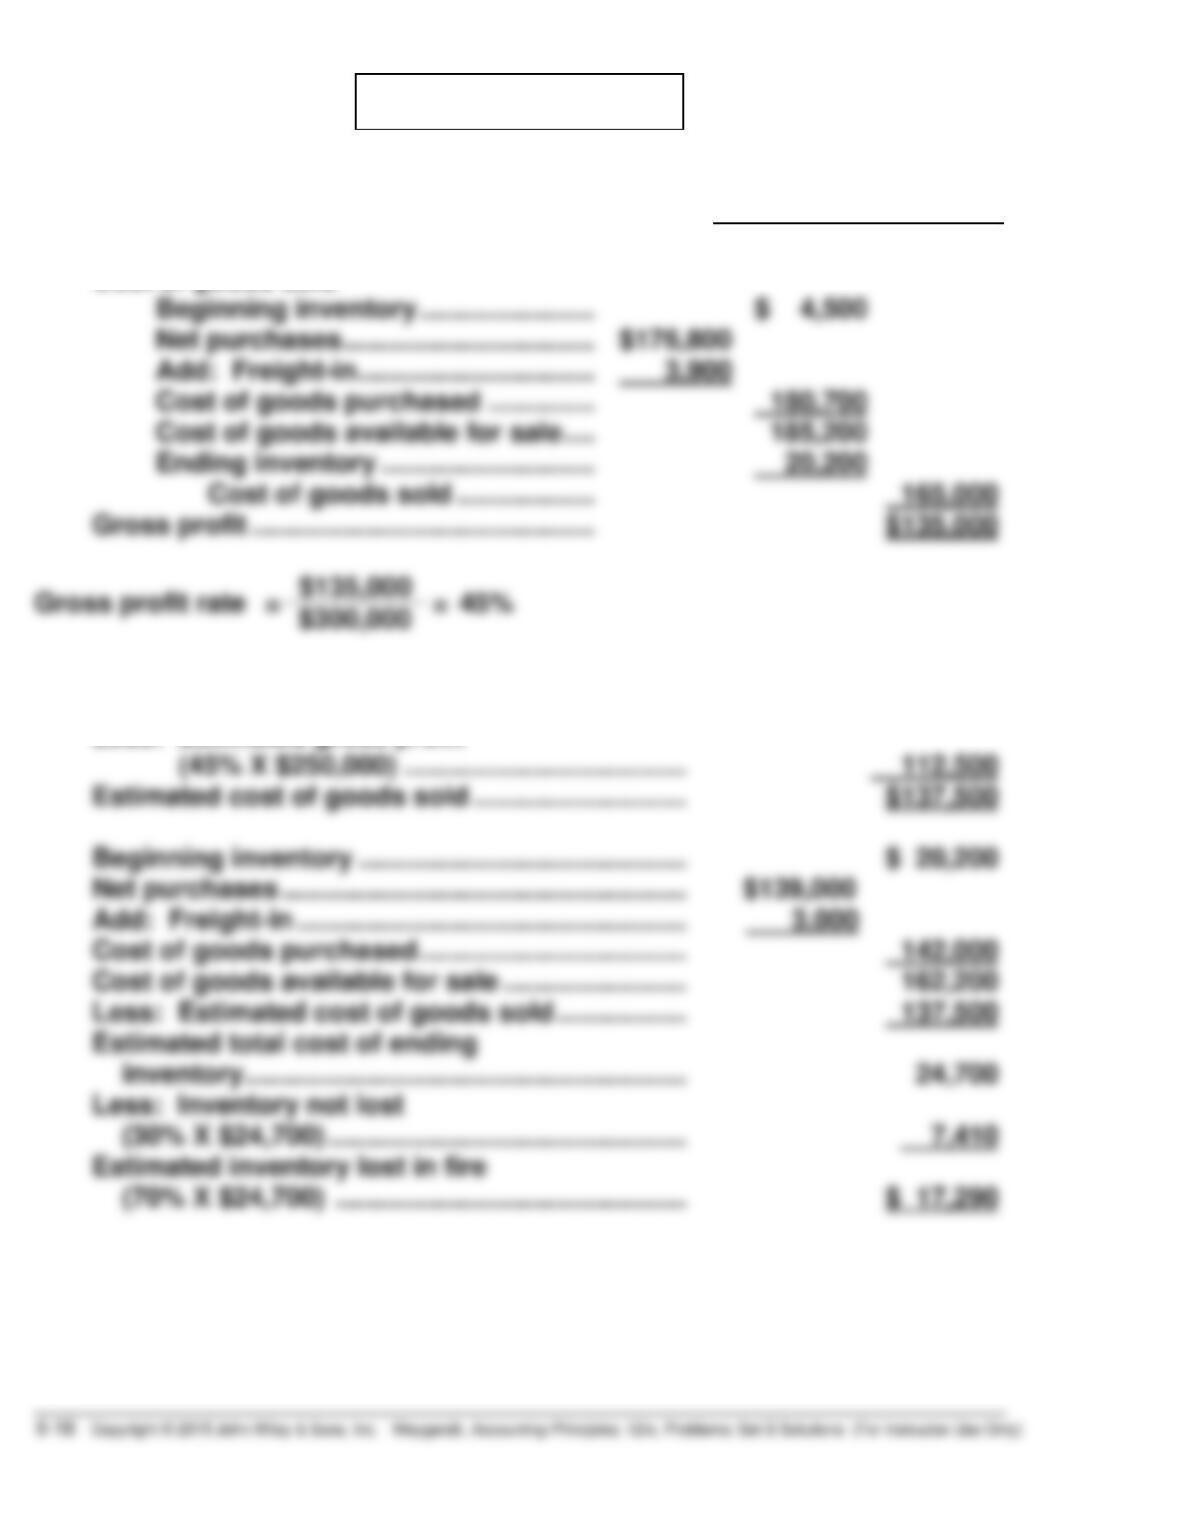
*PROBLEM 6-10B
(a)
February
Net sales ………………………………………….. $300,000
Cost of goods sold
Beginning inventory ………………….. $ 4,500
(b) Net sales …………………………………………………….. $250,000
Less: Estimated gross profit
(45% X $250,000) ………………………………. 112,500
Estimated cost of goods sold ………………………. $137,500
Beginning inventory ……………………………………. $ 20,200
Net purchases …………………………………………….. $139,000
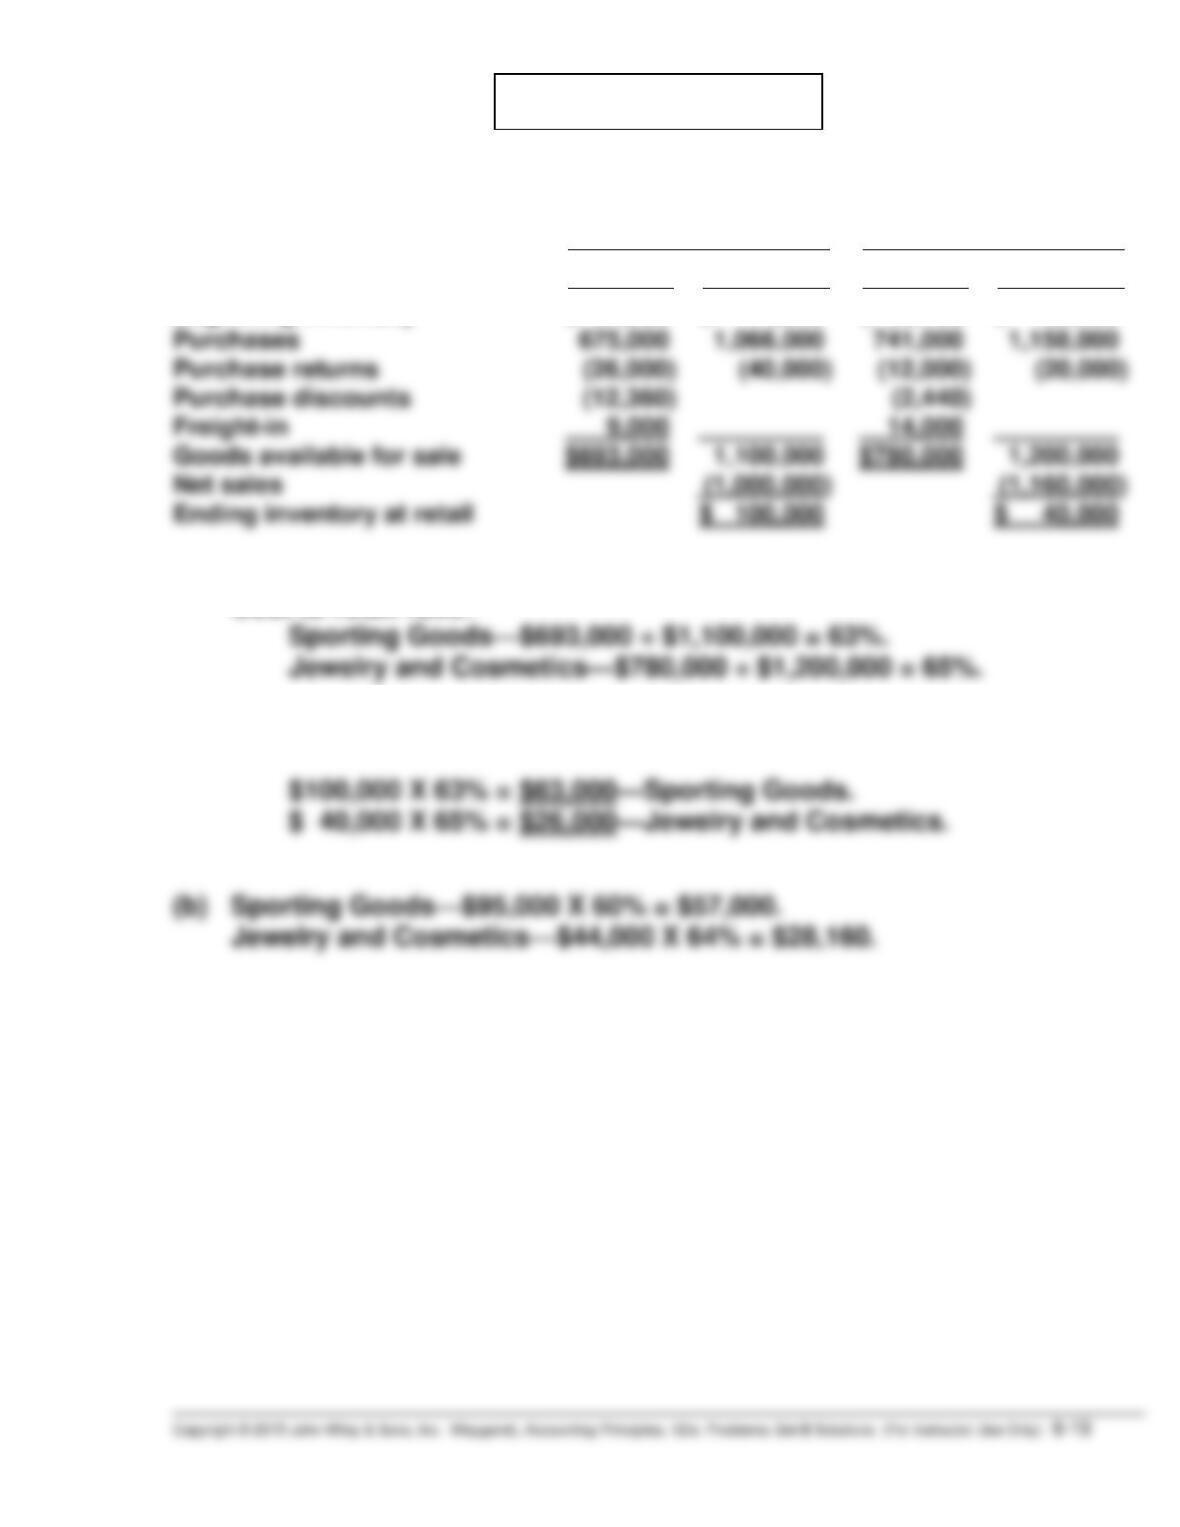
*PROBLEM 6-11B
(a)
Sporting
Goods
Jewelry
and Cosmetics
Cost
Retail
Cost
Retail
Beginning inventory $ 47,360 $ 74,000 $ 39,440 $ 62,000
Cost-to-retail ratio:
Sporting Goods—$693,000 ÷ $1,100,000 = 63%.
Estimated ending inventory at cost: