EXERCISE 6-11
(a) Inventory
turnover
$16,255
($3,042 + $2,397) ÷ 2 = $16,255
$2,719.5 = 5.98
(b) Based on data presented:
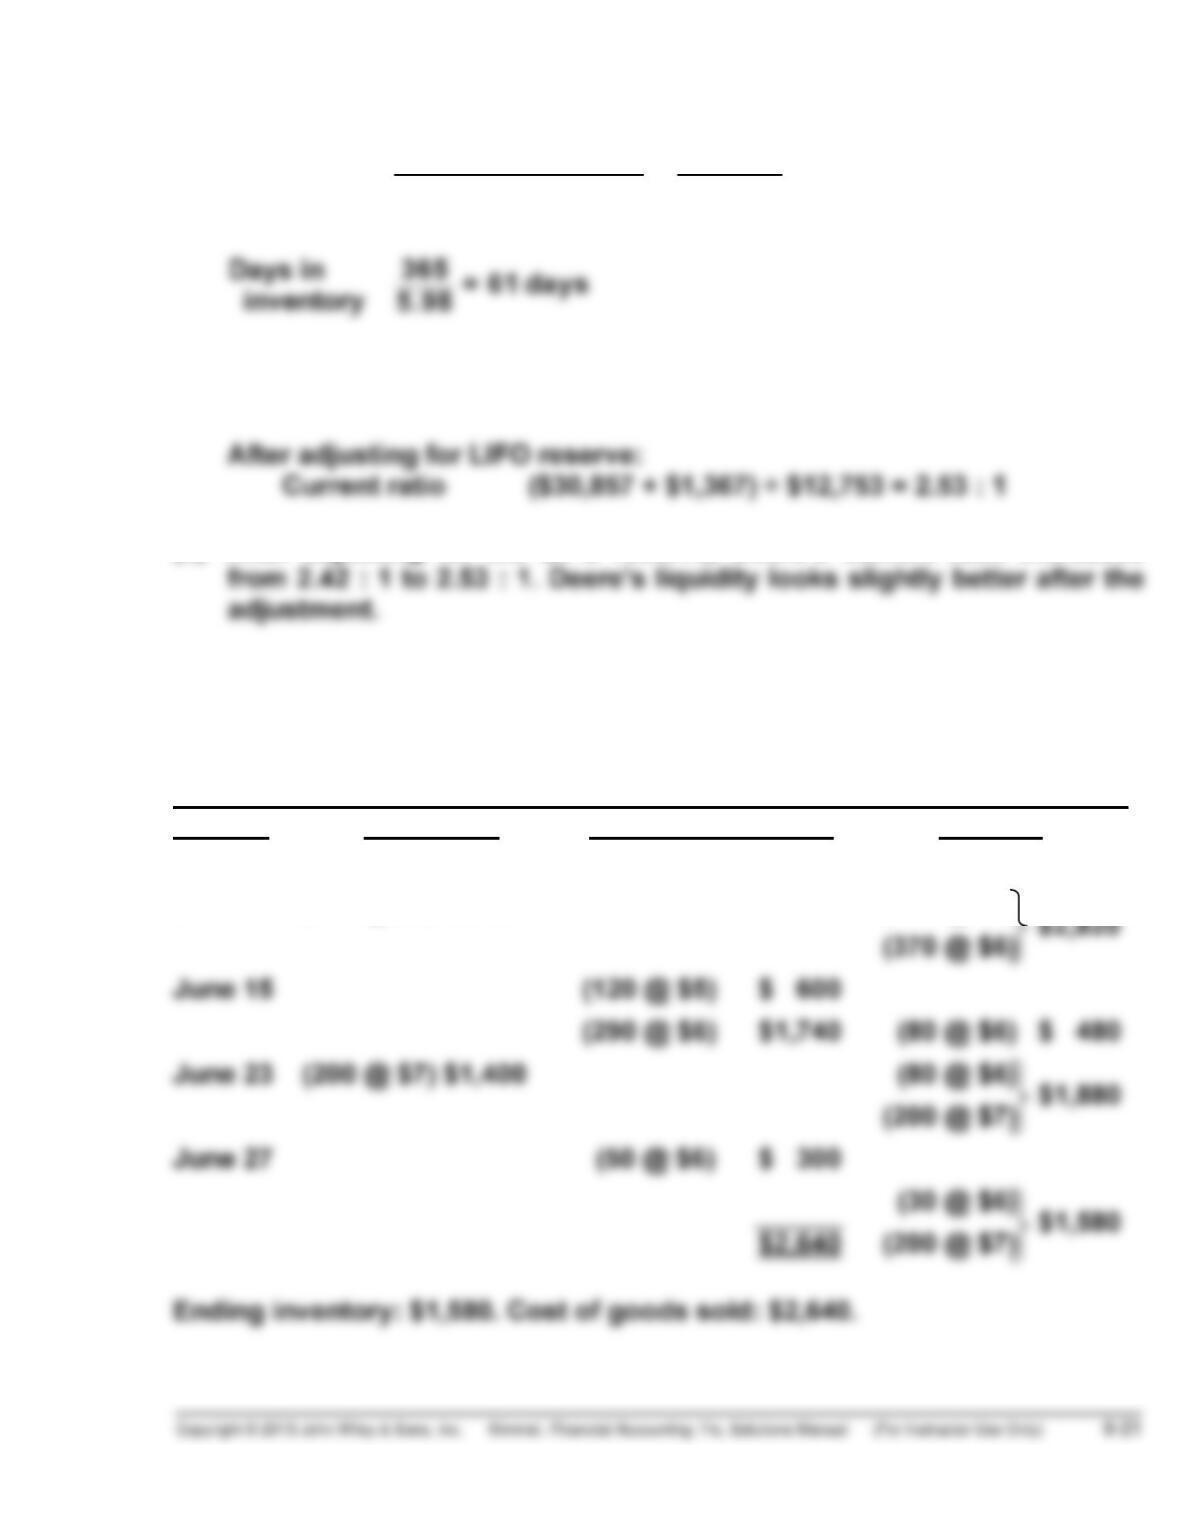
Current ratio $30,857 ÷ $12,753 = 2.42 : 1
(c) After adjusting for the LIFO reserve, Deere’s current ratio increases
*EXERCISE 6-12
(a)
FIFO
Date Purchases Cost of goods sold Balance
June 1 (120 @ $5) $ 600
June 12 (370 @ $6) $2,220 (120 @ $5) $2,820
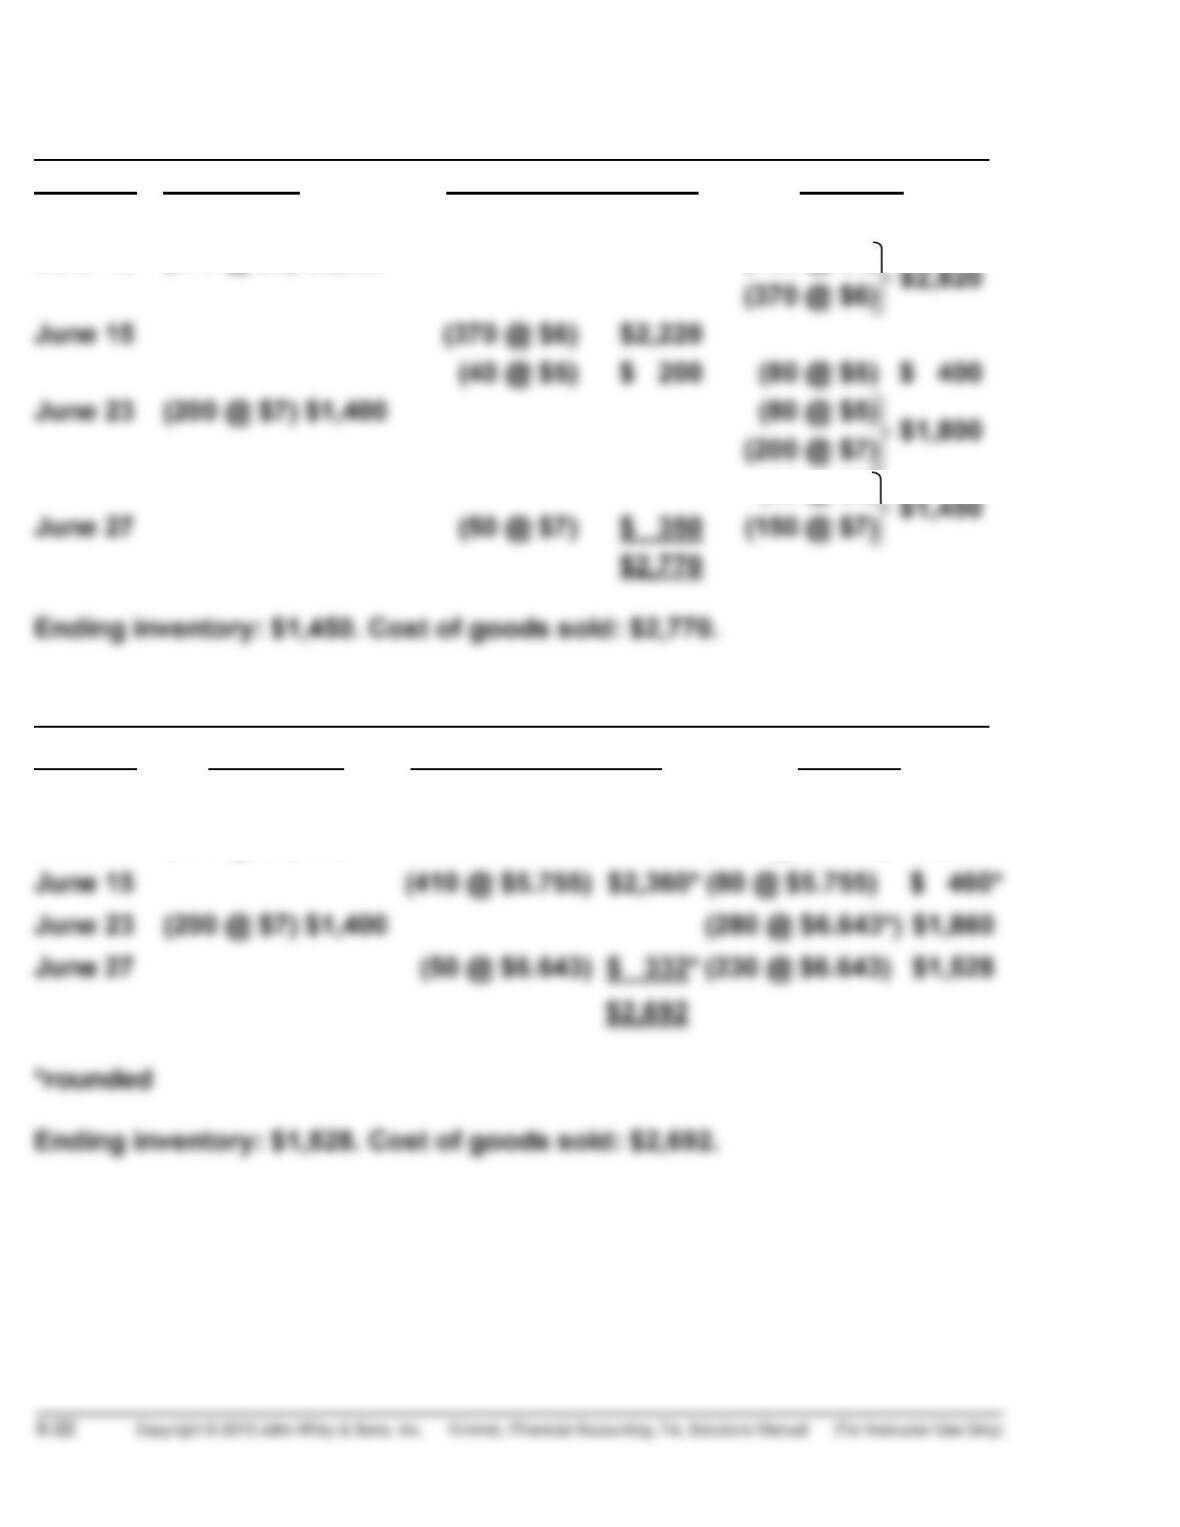
*EXERCISE 6-12 (Continued)
LIFO
Date Purchases Cost of Goods Sold Balance
June 1 (120 @ $5) $ 600
June 12 (370 @ $6) $2,220 (120 @ $5) $2,820
(80 @ $5) $1,450
Moving-Average
Date Purchases Cost of Goods Sold Balance
June 1 (120 @ $5) $ 600
June 12 (370 @ $6) $2,220 (490 @ $5.755) $2,820
*EXERCISE 6-12 (Continued)
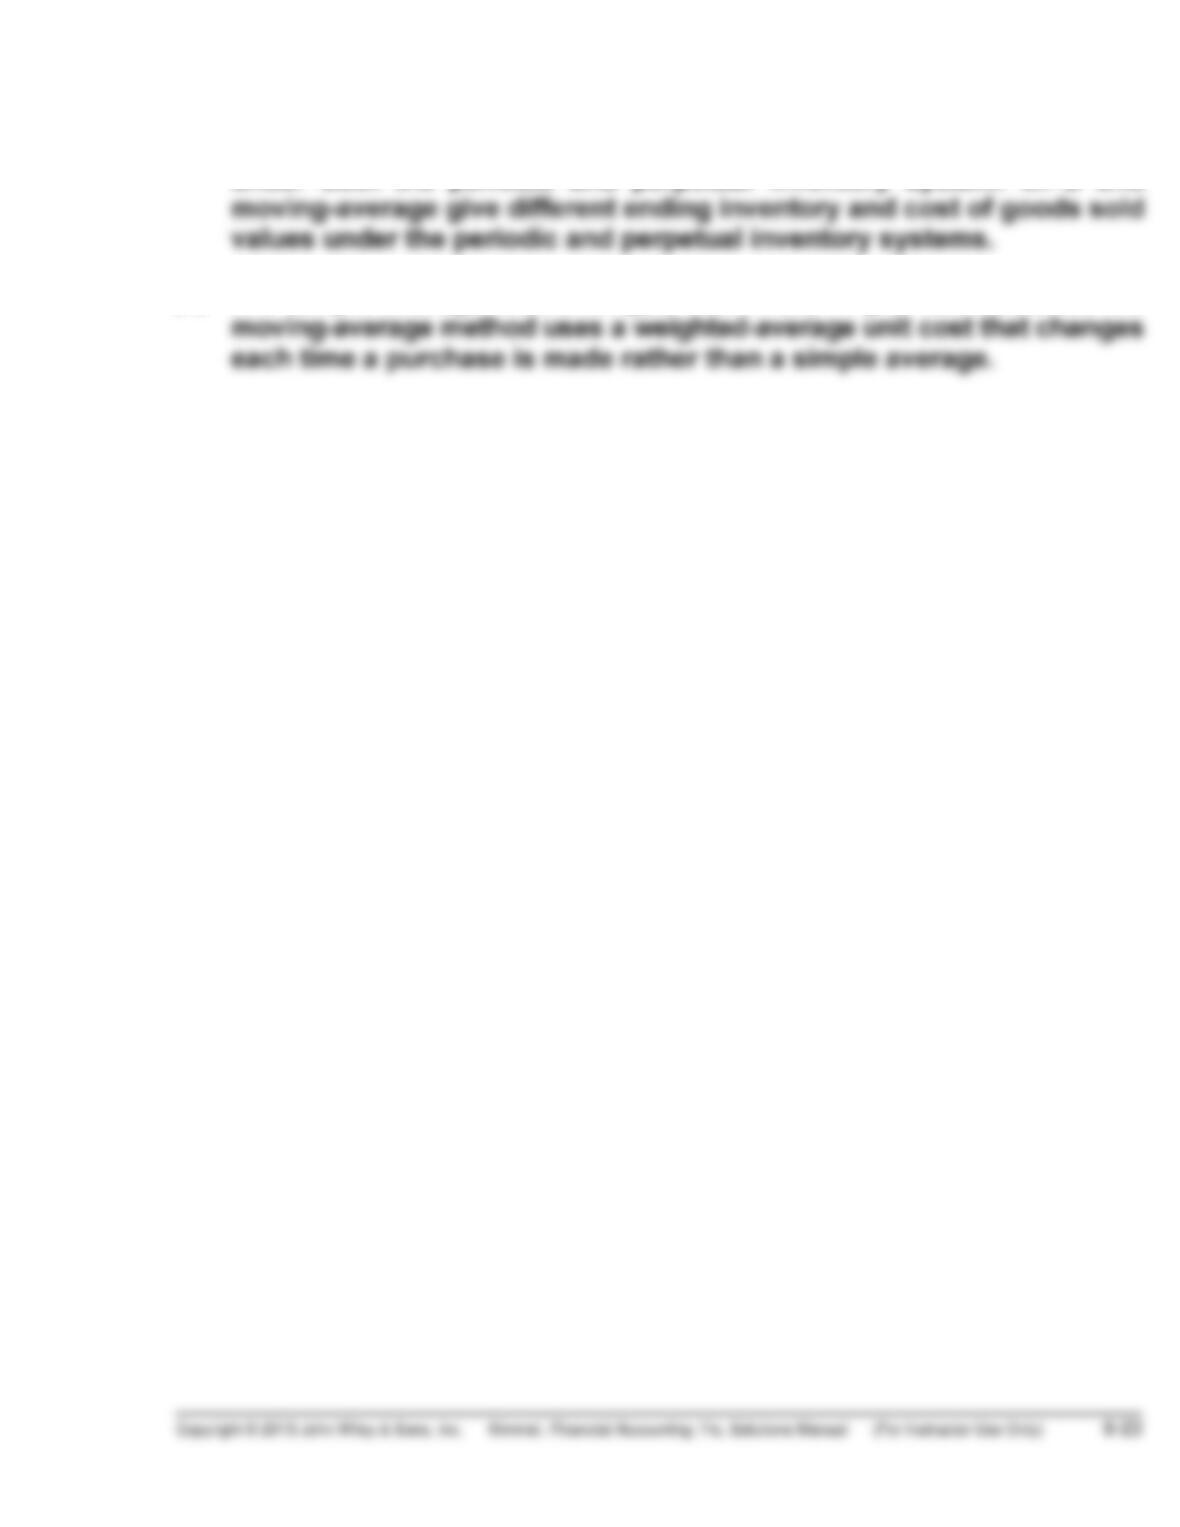
(b) FIFO gives the same ending inventory and cost of goods sold values
under both the periodic and perpetual inventory system. LIFO and
(c) The simple average would be [($5 + $6 + $7) ÷ 3] or $6. However, the
*EXERCISE 6-13
FIFO
Date Purchases Cost of Goods Sold Balance
9/1 (12 @ $100) $1,200
9/5 (8 @ $100) $ 800 (4 @ $100) $ 400
9/26 (20 @ $105) $2,100 (1 @ $103)
(50 @ $104) $7,403
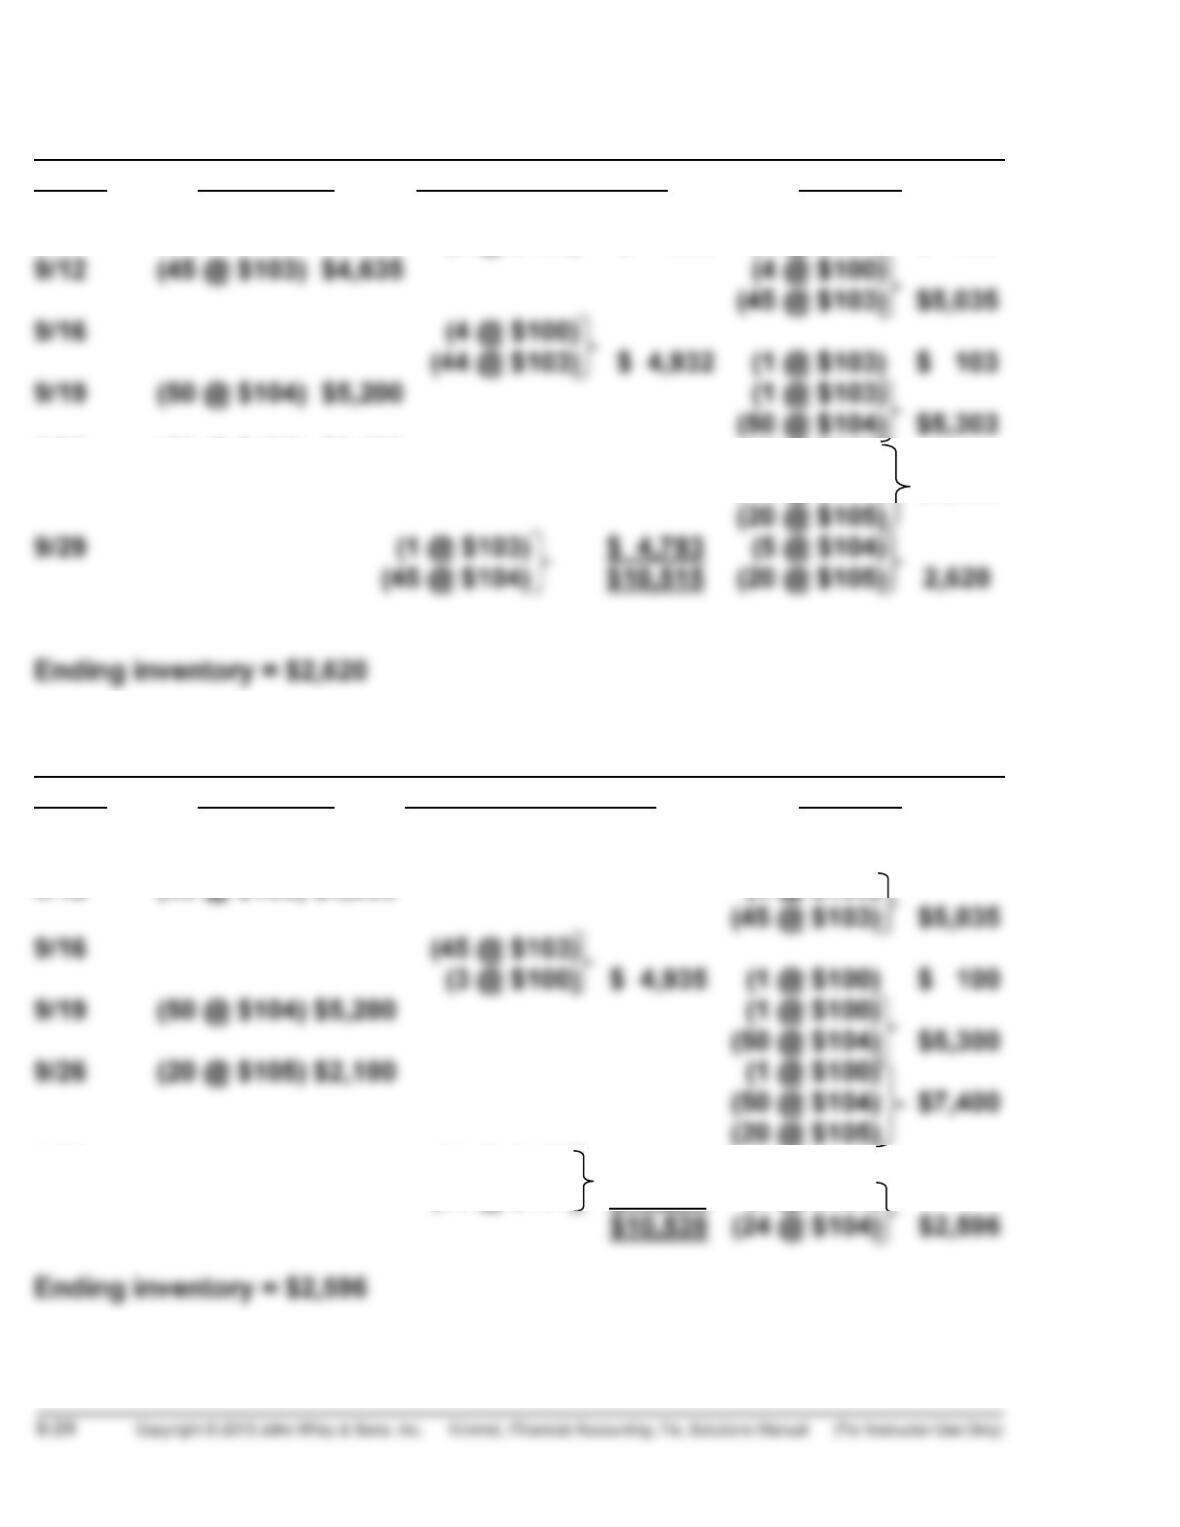
LIFO
Date Purchases Cost of Goods Sold Balance
9/1 (12 @ $100) $1,200
9/5 (8 @ $100) $ 800 (4 @ $100) $ 400
9/12 (45 @ $103) $4,635 (4 @ $100)
9/29 (20 @ $105)
(26 @ $104) $ 4,804 (1 @ $100)
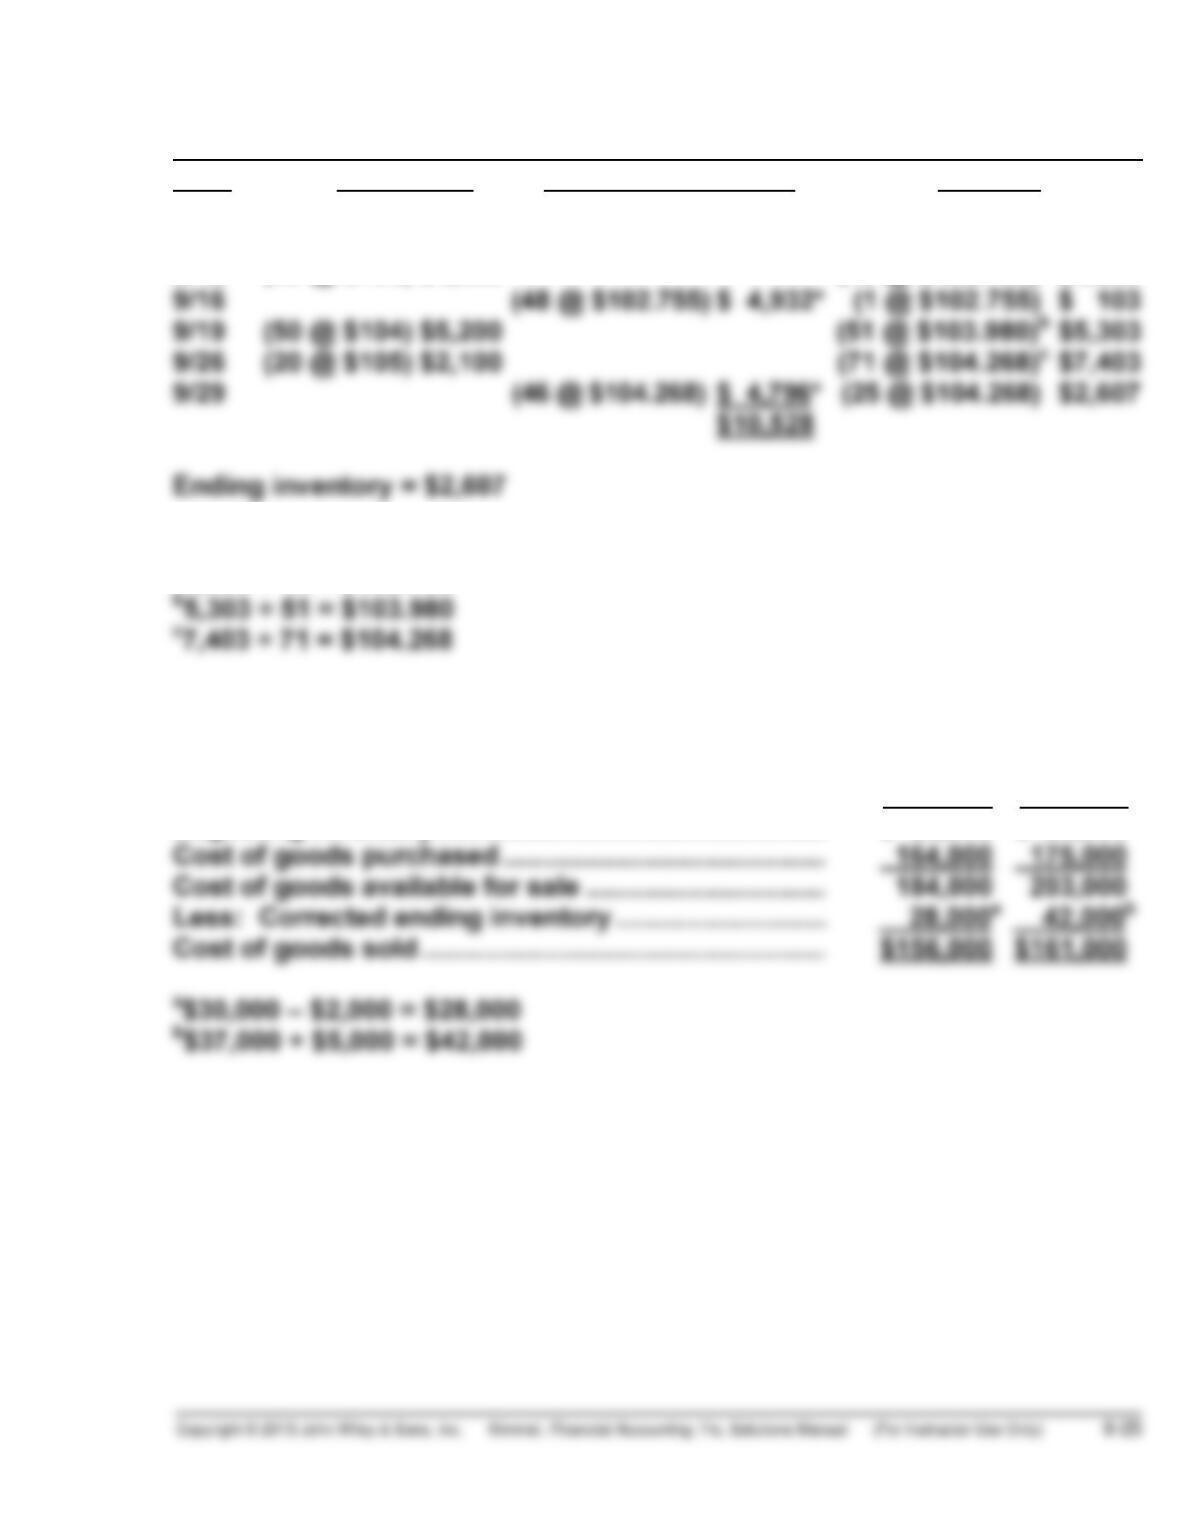
*EXERCISE 6-13 (Continued)
MOVING-AVERAGE
Date Purchases Cost of Goods Sold Balance
9/1 (12 @ $100) $1,200
9/5 (8 @ $100) $ 800 (4 @ $100) $ 400
9/12 (45 @ $103) $4,635 (49 @ $102.755)a $5,035
*Rounded
a5,035 ÷ 49 = $102.755
*EXERCISE 6-14
2013 2014
Beginning inventory ……………………………………………. $ 20,000 $ 28,000
*EXERCISE 6-15
(a)
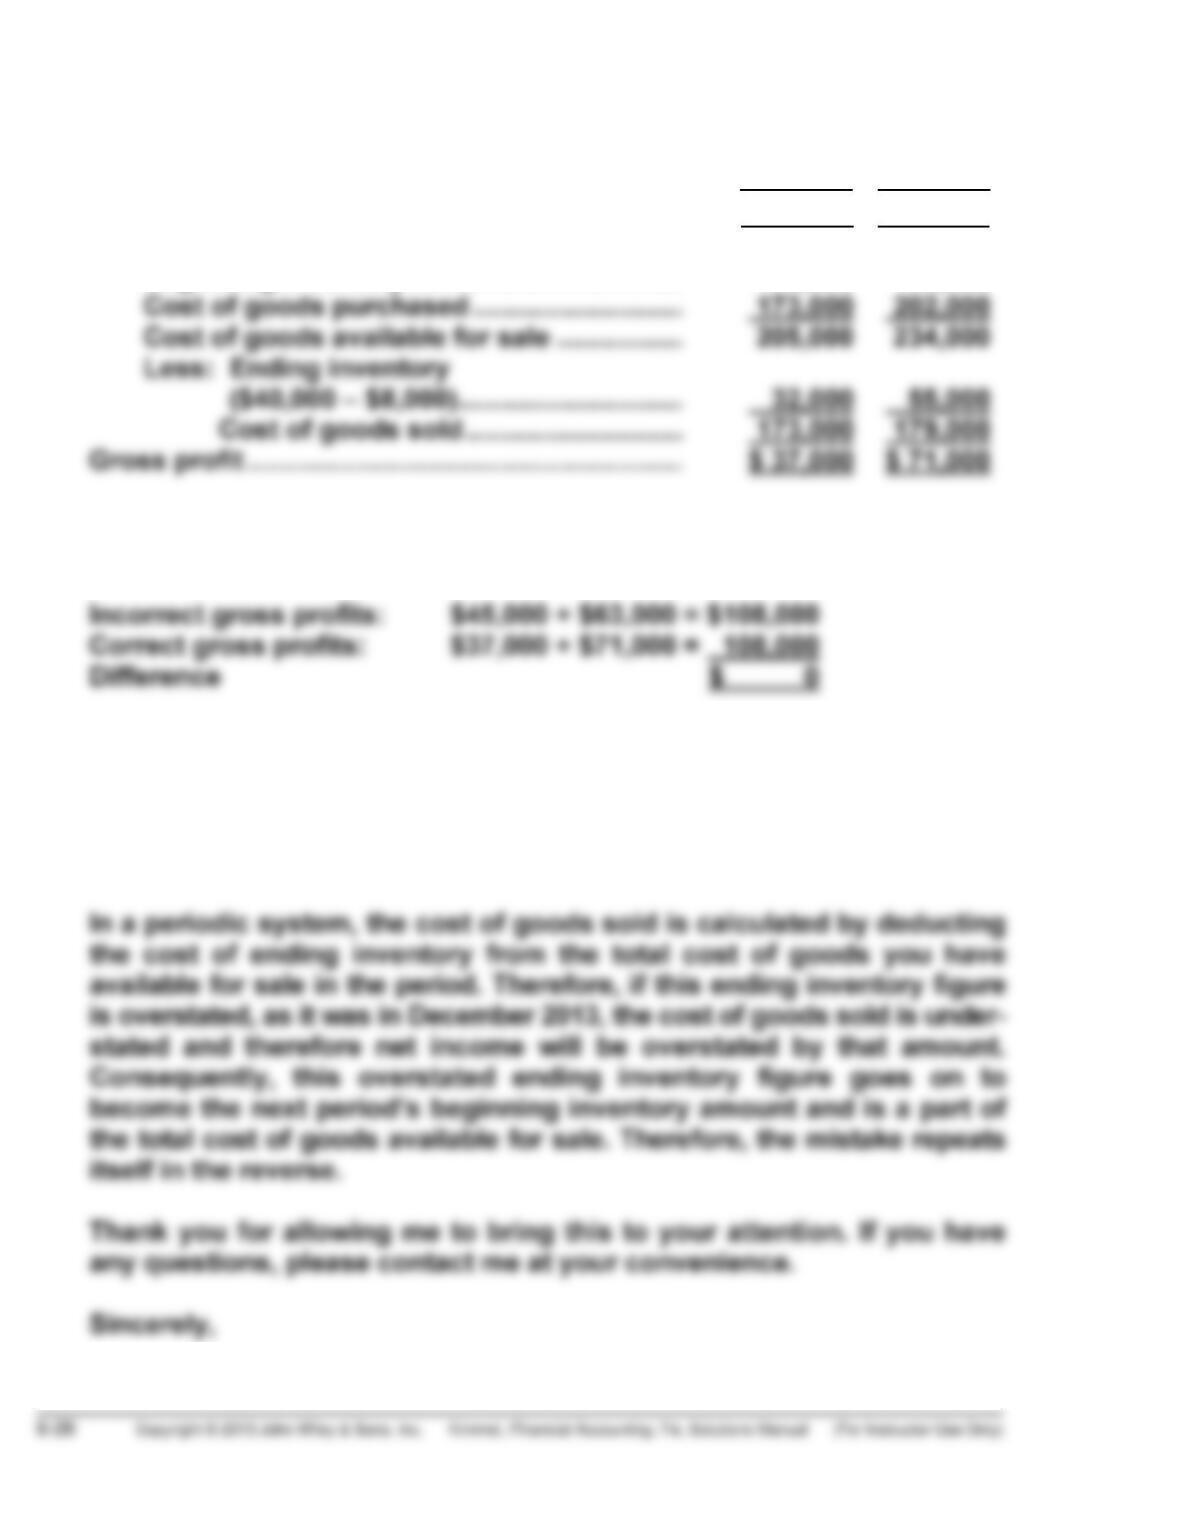
2013 2014
Sales …………………………………………………………… $210,000 $250,000
Cost of goods sold
Beginning inventory ………………………………. 32,000 32,000
(b) The cumulative effect on total gross profit for the two years is zero as
shown below:
(c) Dear Mr./Ms. President:
Because your ending inventory of December 31, 2013 was overstated
by $8,000, your net income for 2013 was overstated and net income for
2014 was understated by $8,000.
SOLUTIONS TO PROBLEMS
PROBLEM 6-1A
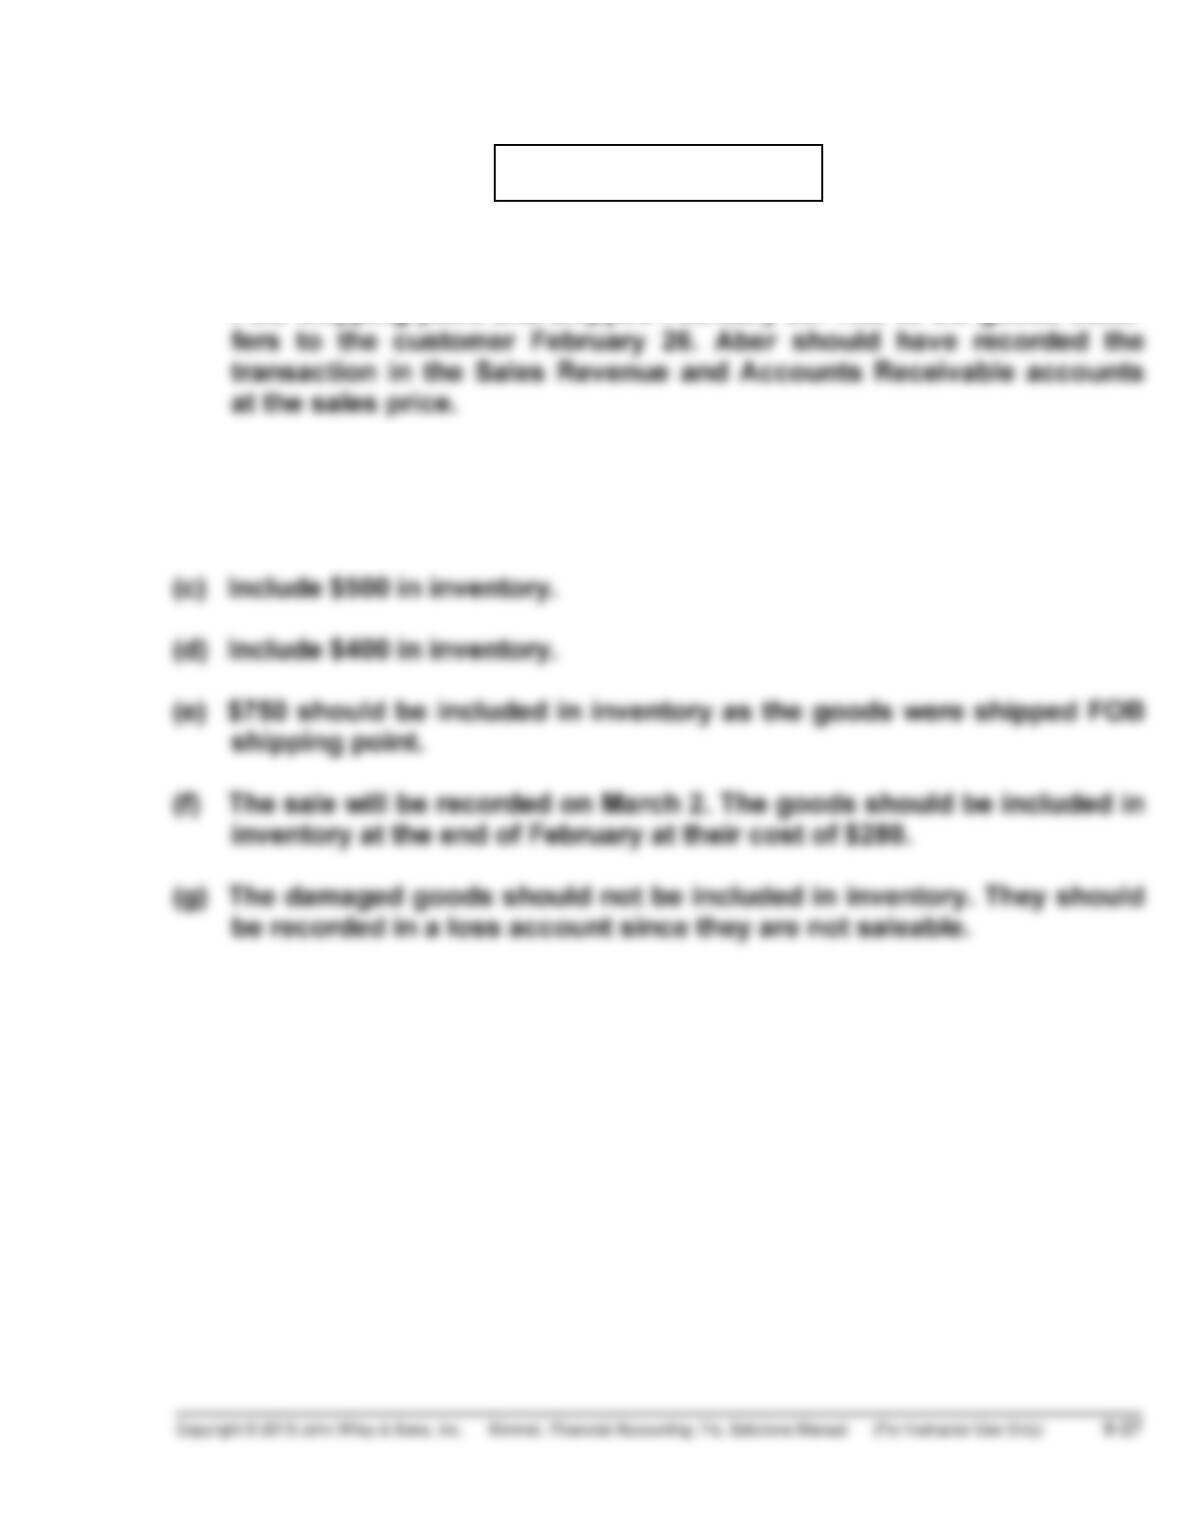
(a) The goods should not be included in inventory as they were shipped
FOB shipping point and shipped February 26. Title to the goods trans-
(b) The amount should not be included in inventory as they were shipped
FOB destination and not received until March 2. The seller still owns
the inventory. No entry is recorded.
PROBLEM 6-2A
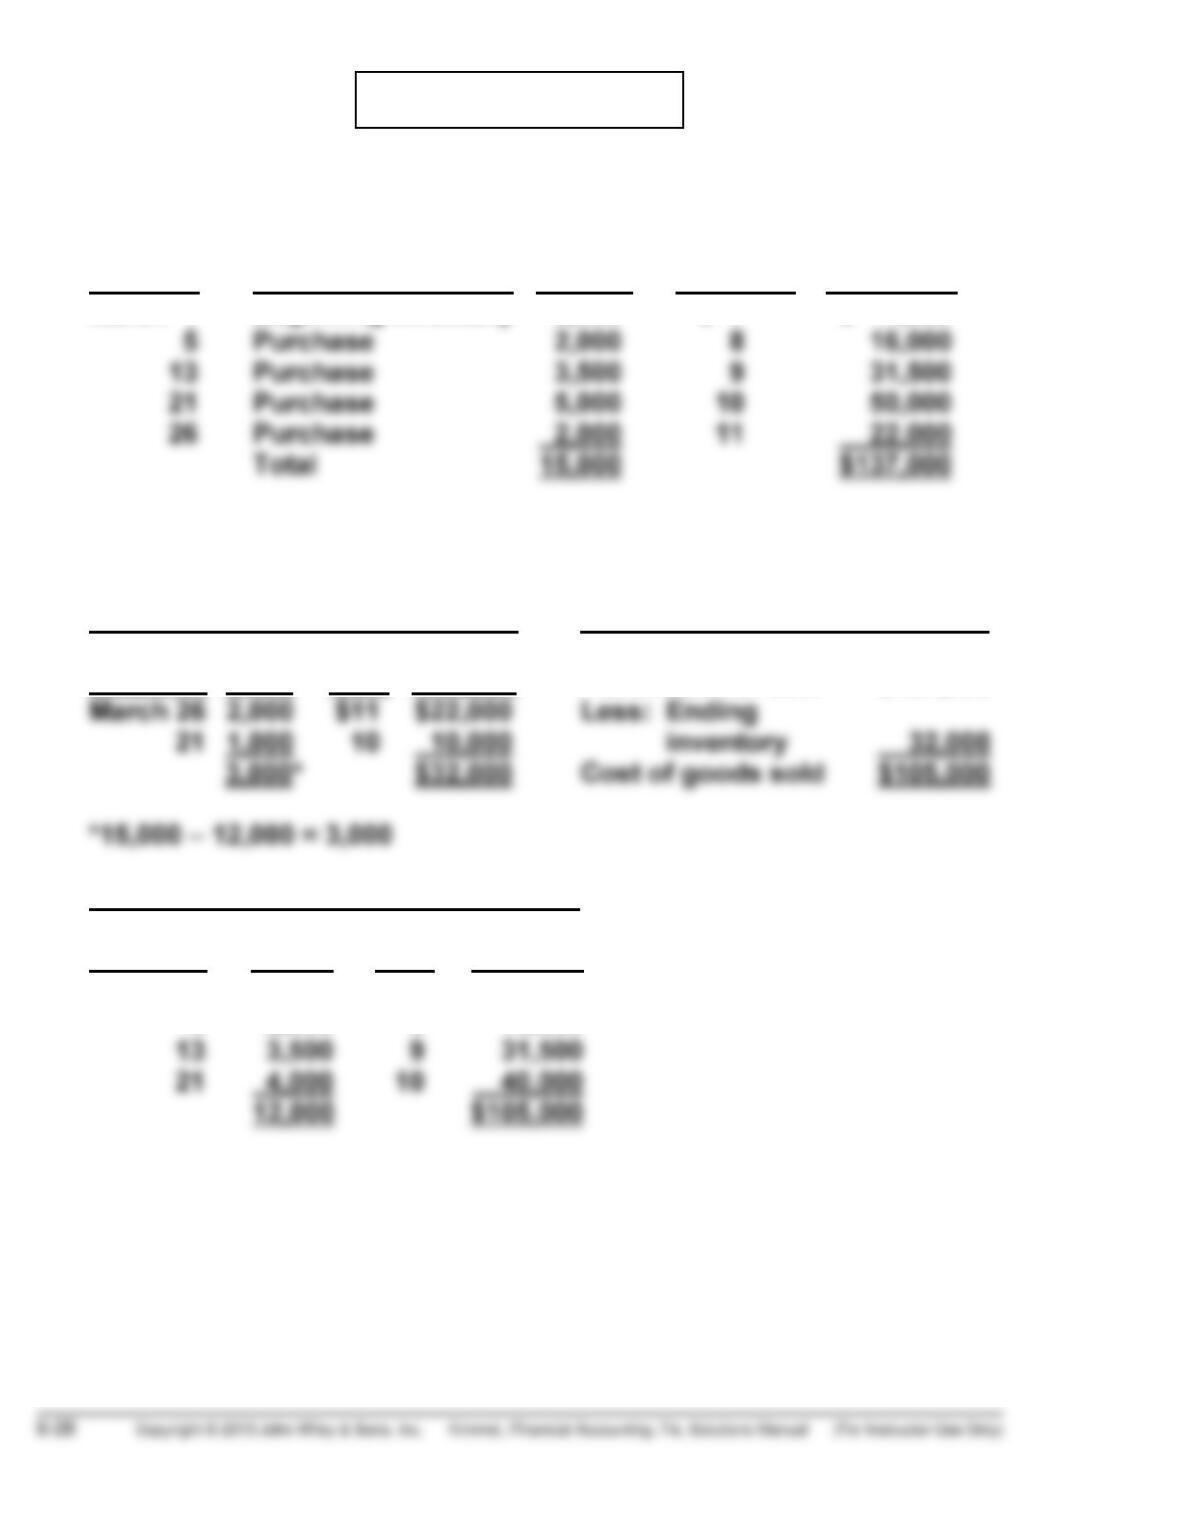
(a)
COST OF GOODS AVAILABLE FOR SALE
Date Explanation Units Unit Cost Total Cost
March 1 Beginning inventory 2,500 $ 7 $ 17,500
(b)
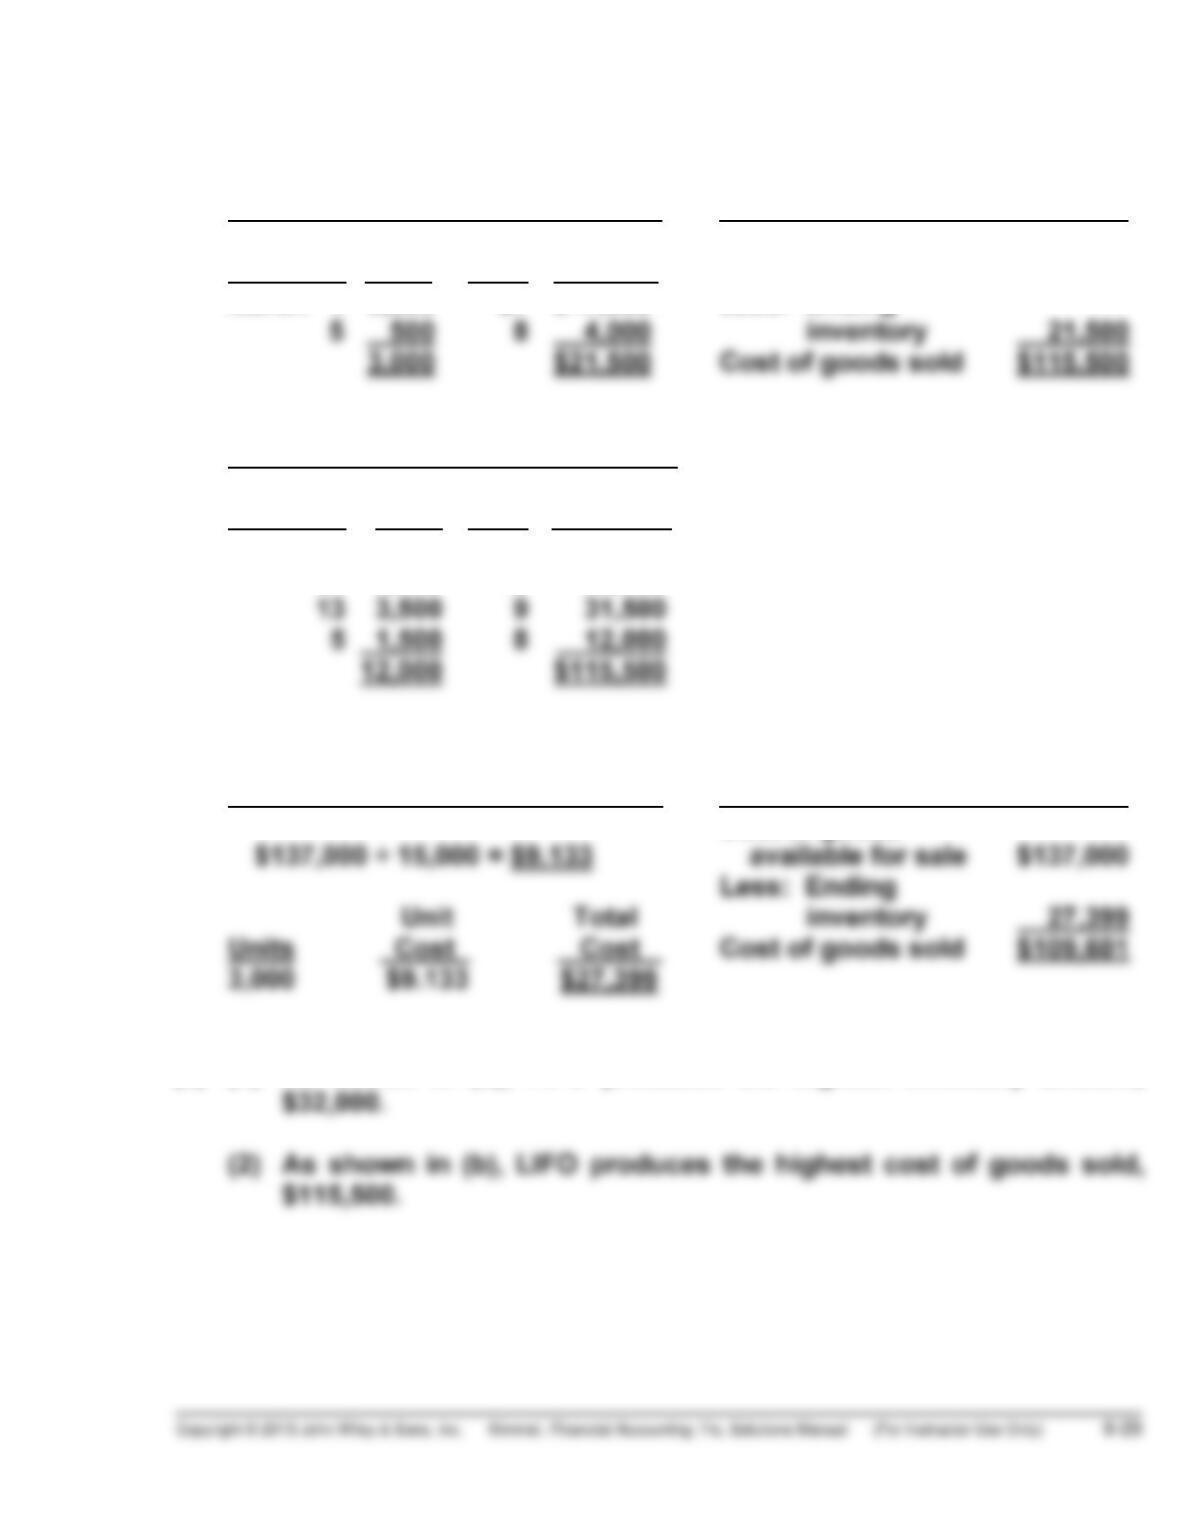
FIFO
(1) Ending Inventory (2) Cost of Goods Sold
Unit Total Cost of goods
Date Units Cost Cost available for sale $137,000
Proof of Cost of Goods Sold
Unit Total
Date Units Cost Cost
March 1 2,500 $ 7 $ 17,500
5 2,000 8 16,000
PROBLEM 6-2A (Continued)
LIFO
(1) Ending Inventory (2) Cost of Goods Sold
Unit Total Cost of goods
Date Units Cost Cost available for sale $137,000
March 1 2,500 $7 $17,500 Less: Ending
Proof of Cost of Goods Sold
Unit Total
Date Units Cost Cost
March 26 2,000 $ 11 $ 22,000
21 5,000 10 50,000
AVERAGE-COST
(1) Ending Inventory (2) Cost of Goods Sold
Cost of goods
(c) (1) As shown in (b), FIFO produces the highest inventory amount,
PROBLEM 6-3A
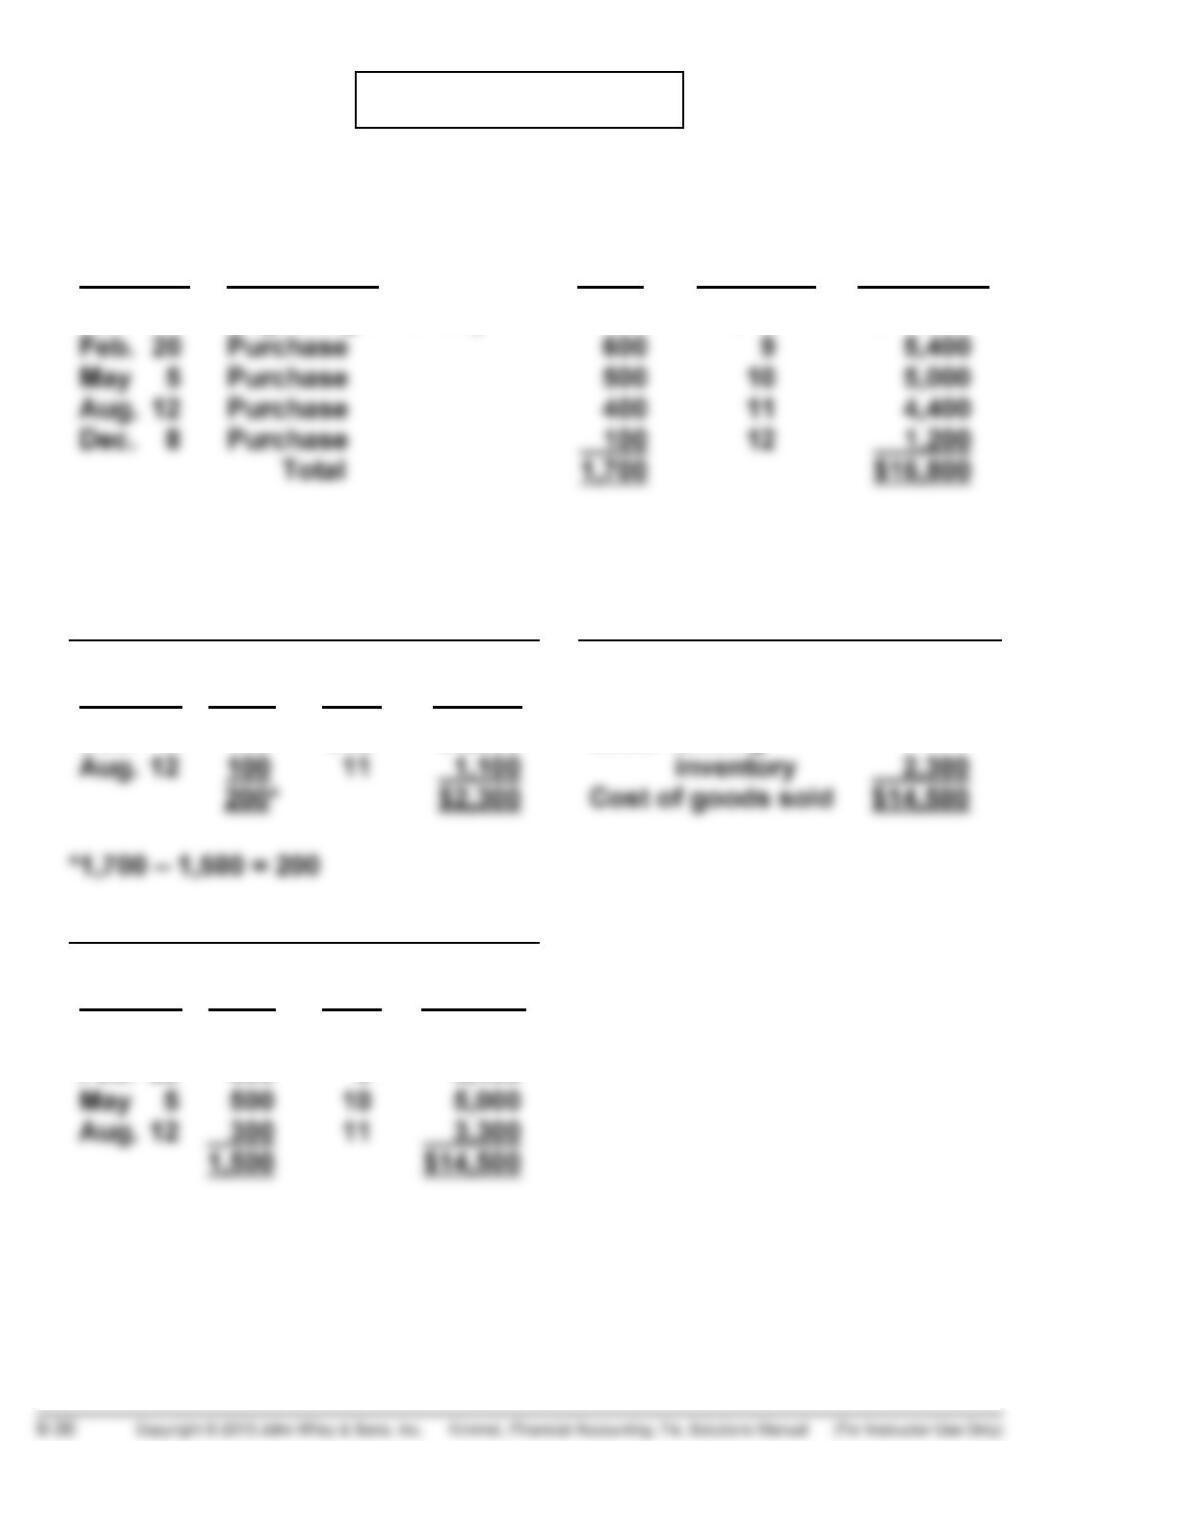
(a) COST OF GOODS AVAILABLE FOR SALE
Date Explanation Units Unit Cost Total Cost
Jan. 1 Beginning inventory 100 $ 8 $ 800
(b)
FIFO
(1) Ending Inventory (2) Cost of Goods Sold
Date Units
Unit
Cost
Total
Cost
Cost of goods
available for sale $16,800
Dec. 8 100 $12 $1,200 Less: Ending
Proof of Cost of Goods Sold
Date Units
Unit
Cost
Total
Cost
Jan. 1 100 $ 8 $ 800
Feb. 20 600 9 5,400
PROBLEM 6-3A (Continued)
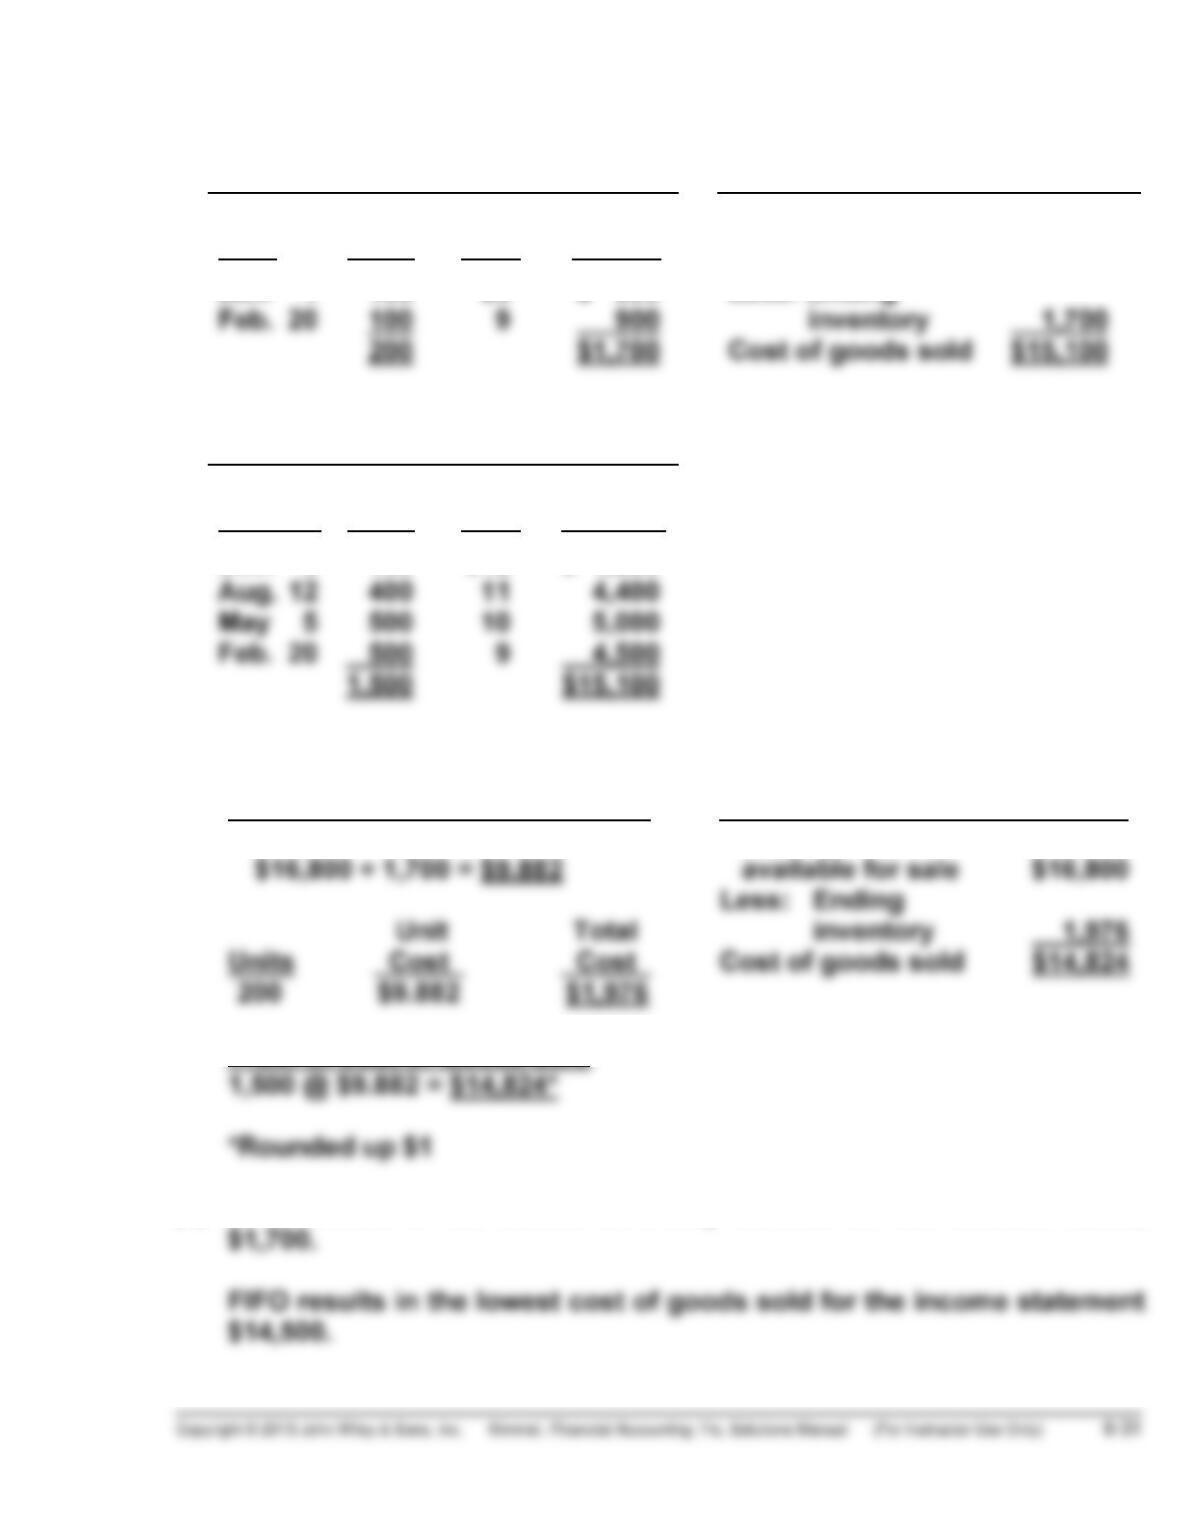
LIFO
(1) Ending Inventory (2) Cost of Goods Sold
Date Units
Unit
Cost
Total
Cost
Cost of goods
available for sale $16,800
Jan. 1 100 $8 $ 800 Less: Ending
Proof of Cost of Goods Sold
Date Units
Unit
Cost
Total
Cost
Dec. 8 100 $12 $ 1,200
AVERAGE-COST
(1) Ending Inventory (2) Cost of Goods Sold
Cost of goods
Proof of Cost of Goods Sold
(c) LIFO results in the lowest inventory amount for the balance sheet,
PROBLEM 6-4A
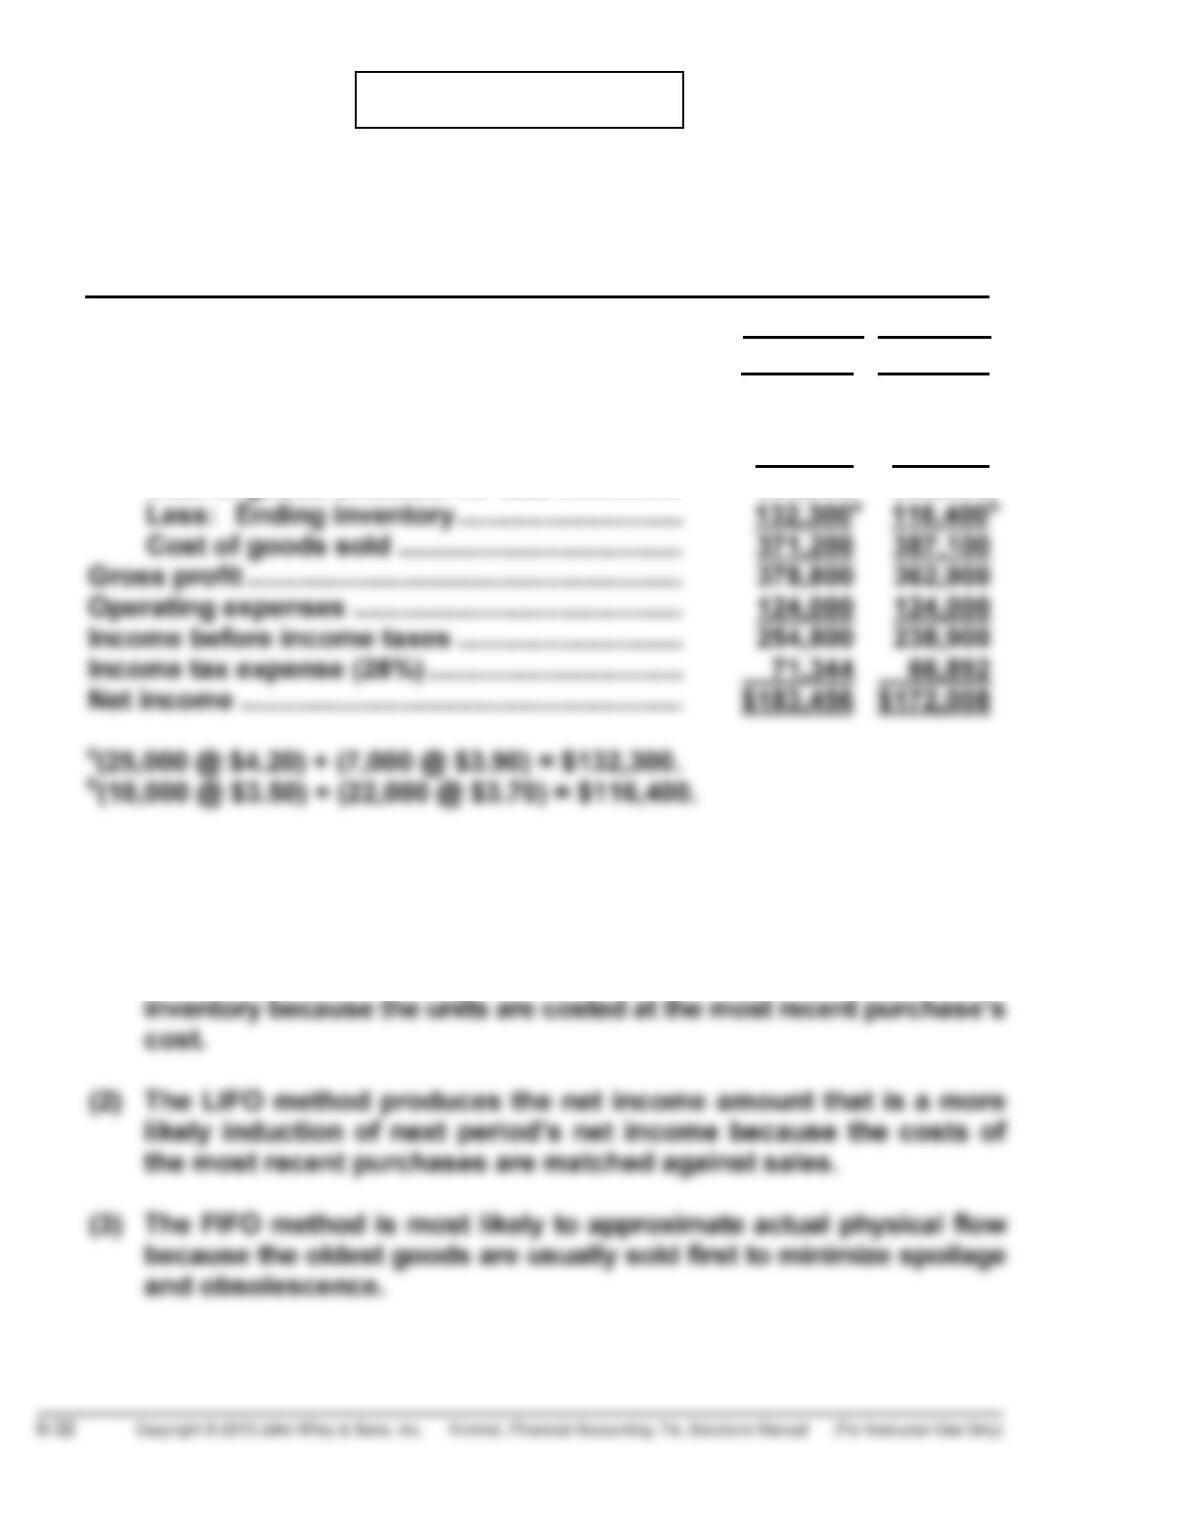
(a) TINKER, INC.
Condensed Income Statements
For the Year Ended December 31, 2014
FIFO LIFO
Sales …………………………………………………………… $750,000 $750,000
Cost of goods sold
Beginning inventory ……………………………… 35,000 35,000
Cost of goods purchased ………………………. 468,500 468,500
Cost of goods available for sale …………….. 503,500 503,500
(b) Answers to questions:
(1) The FIFO method produces the inventory amount that most closely
approximates the amount that would have to be paid to replace the
Copyright © 2013 John Wiley & Sons, Inc. Kimmel, Financial Accounting, 7/e, Solutions Manual (For Instructor Use Only) 6-33
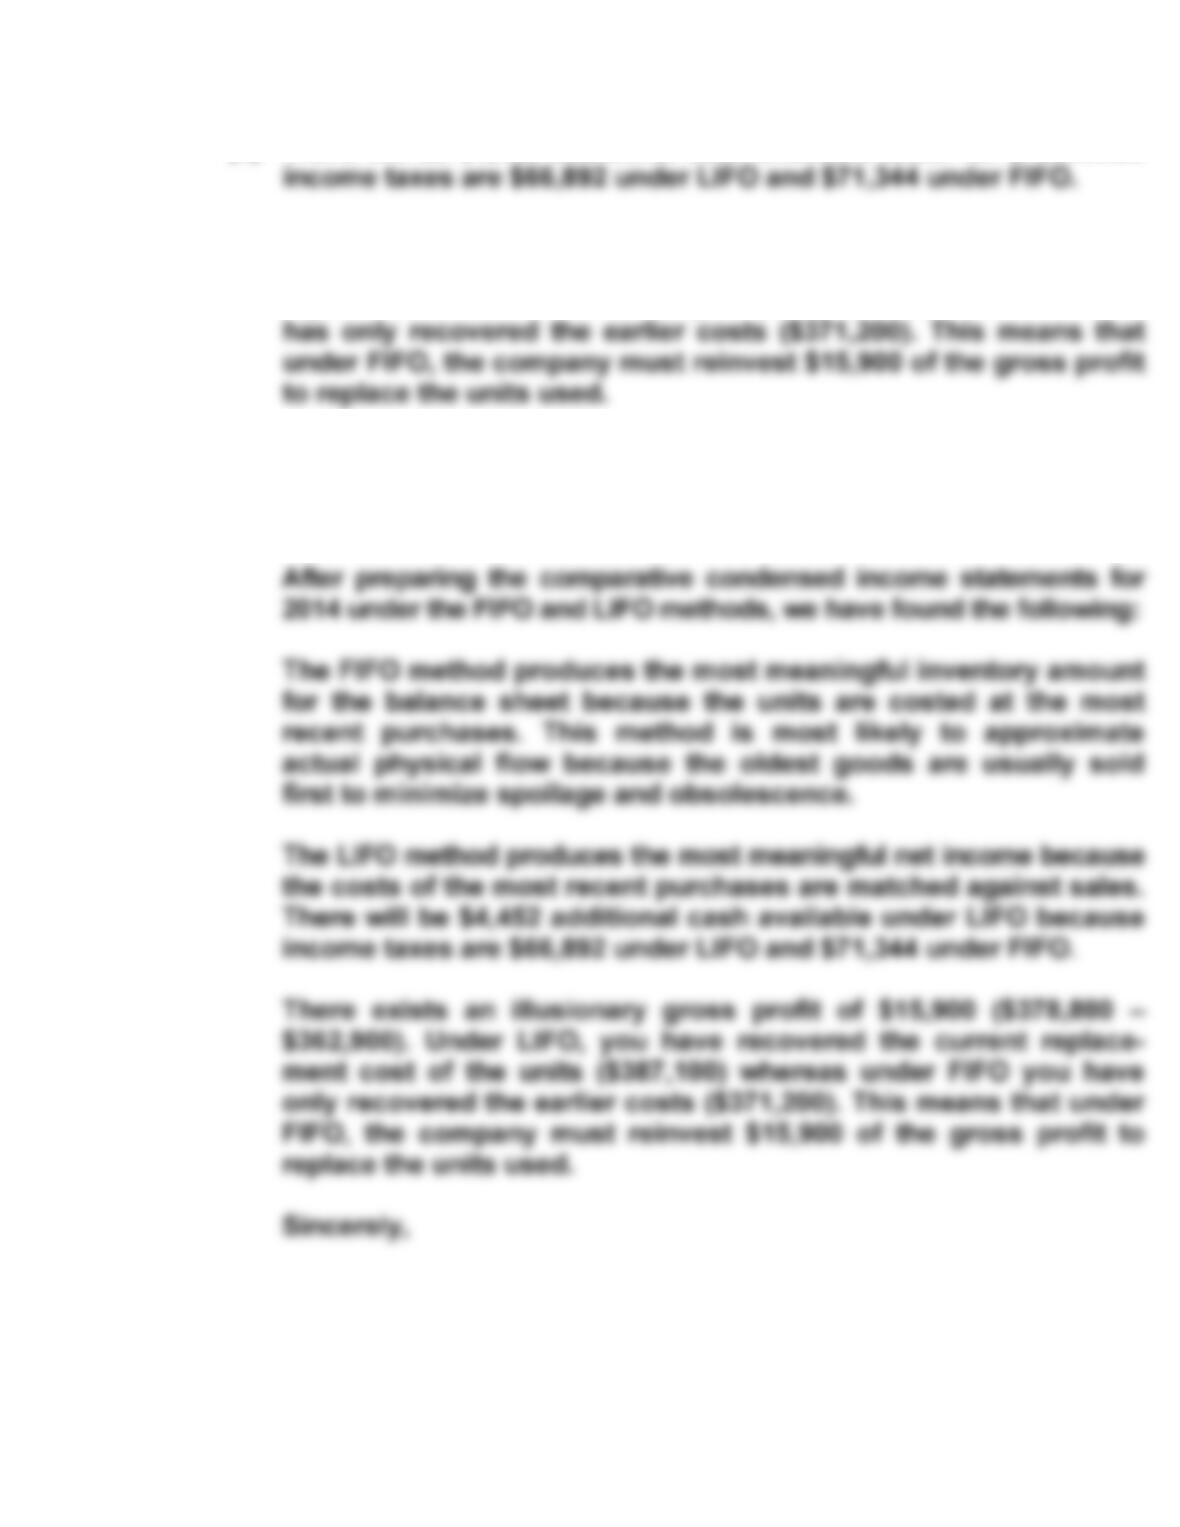
PROBLEM 6-4A (Continued)
(4) There will be $4,452 additional cash available under LIFO because
(5) The illusionary gross profit is $15,900 ($378,800 – $362,900) under
FIFO. Under LIFO, Tinker Inc. has recovered the current
replacement cost of the units ($387,100), whereas under FIFO, it
Answer in business-letter form:
Dear Tinker Inc.
PROBLEM 6-5A
Cost of Goods Available for Sale
Date Explanation Units Unit Cost Total Cost
October 1 Beginning inventory 60 $24 $1,440
9 Purchase 120 26 3,120
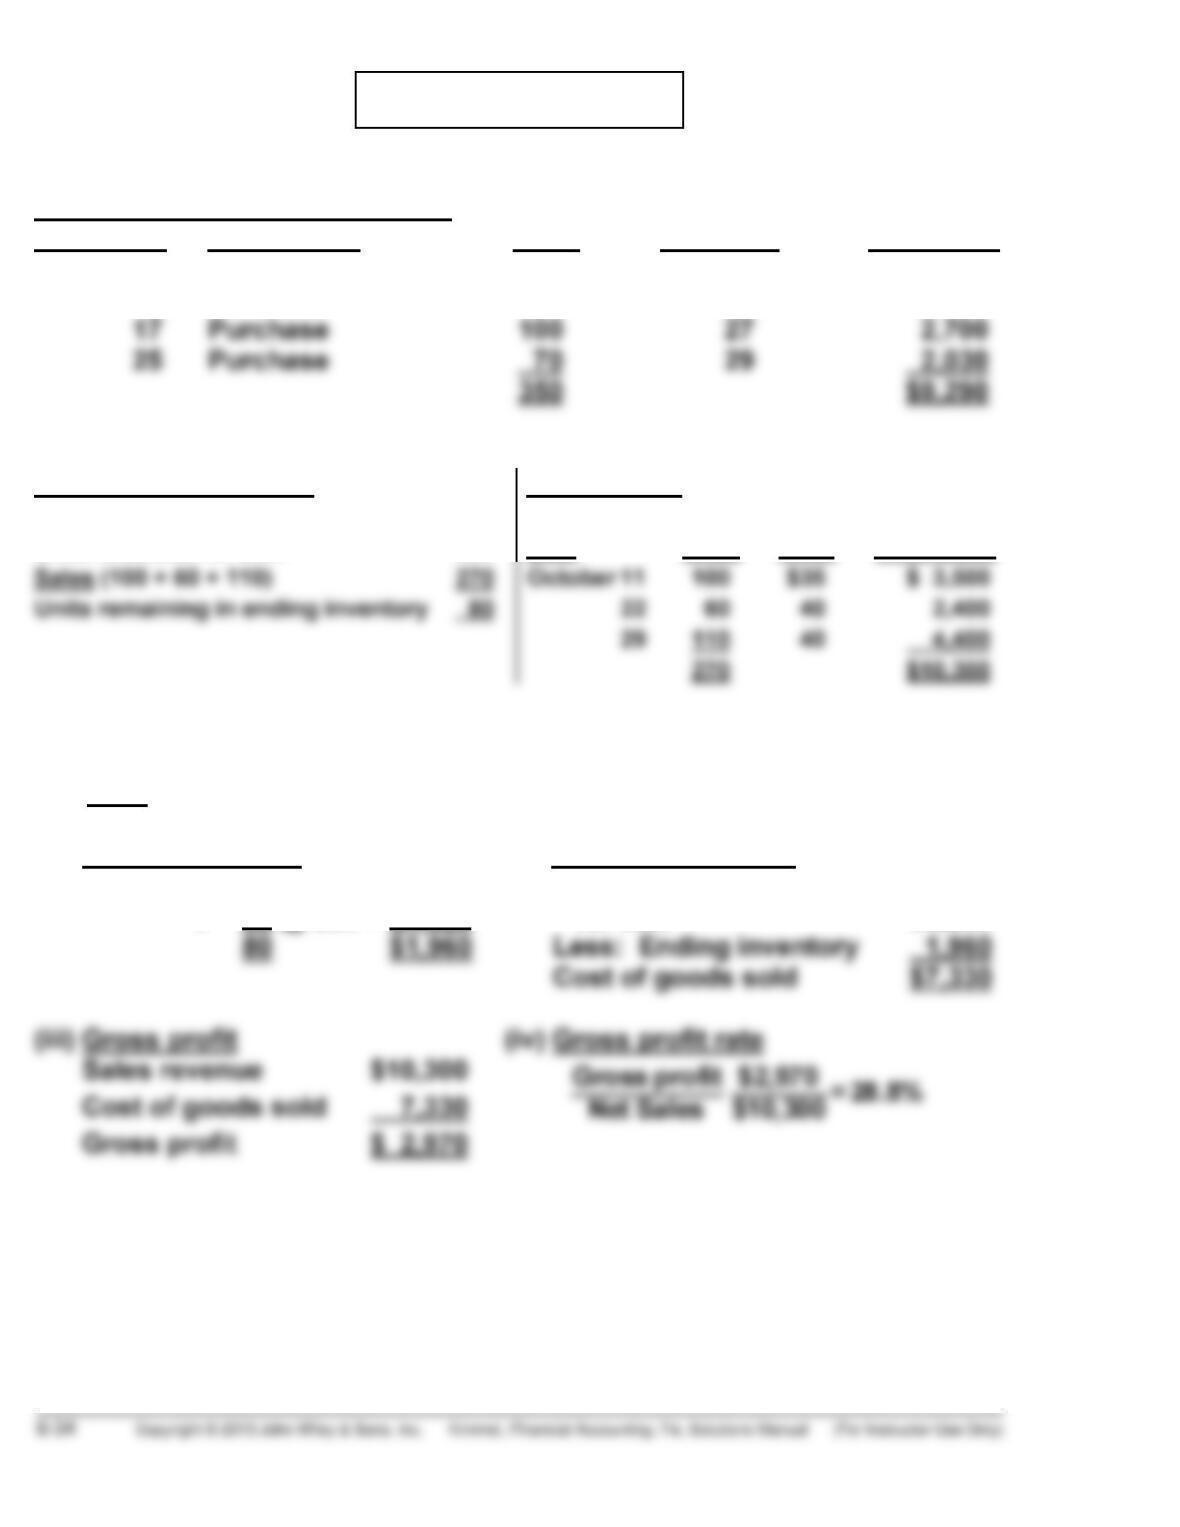
Ending Inventory in Units Sales revenue
Units available for sale 350 Date Units
Unit
Price Total Sales
(a)
(1) LIFO
(i) Ending inventory (ii) Cost of goods sold
October 1 60 @ $24 = $1,440
9 20 @ $26 = $ 520
Cost of goods available
for sale $9,290
PROBLEM 6-5A (Continued)
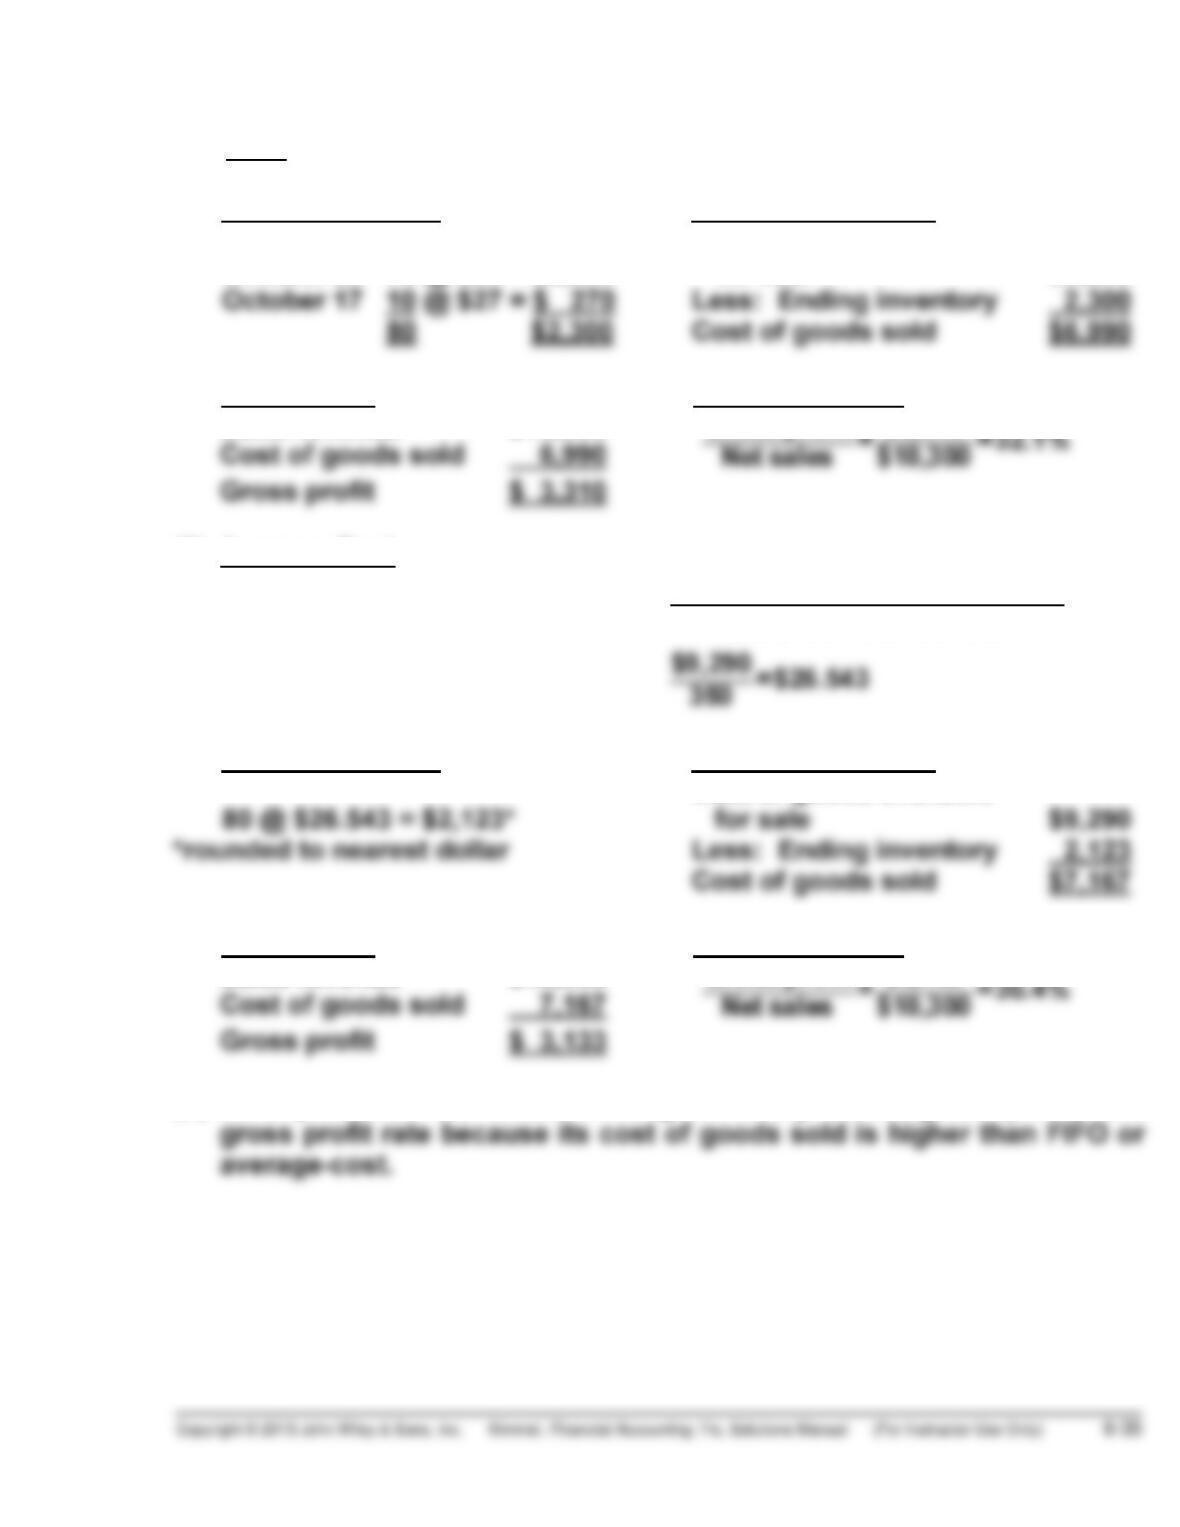
(2) FIFO
(i) Ending inventory (ii) Cost of goods sold
October 25 70 @ $29 = $2,030
Cost of goods available
for sale $9,290
(iii) Gross profit (iv) Gross profit rate
Sales revenue $10,300 Gross profit
(3) Average-Cost
Weighted-average cost per unit: Cost of goods available for sale
Units available for sale
(i) Ending inventory (ii) Cost of goods sold
Cost of goods available
(iii) Gross profit (iv) Gross profit rate
Sales revenue $10,300 Gross profit
(b) LIFO produces the lowest ending inventory value, gross profit, and
PROBLEM 6-6A
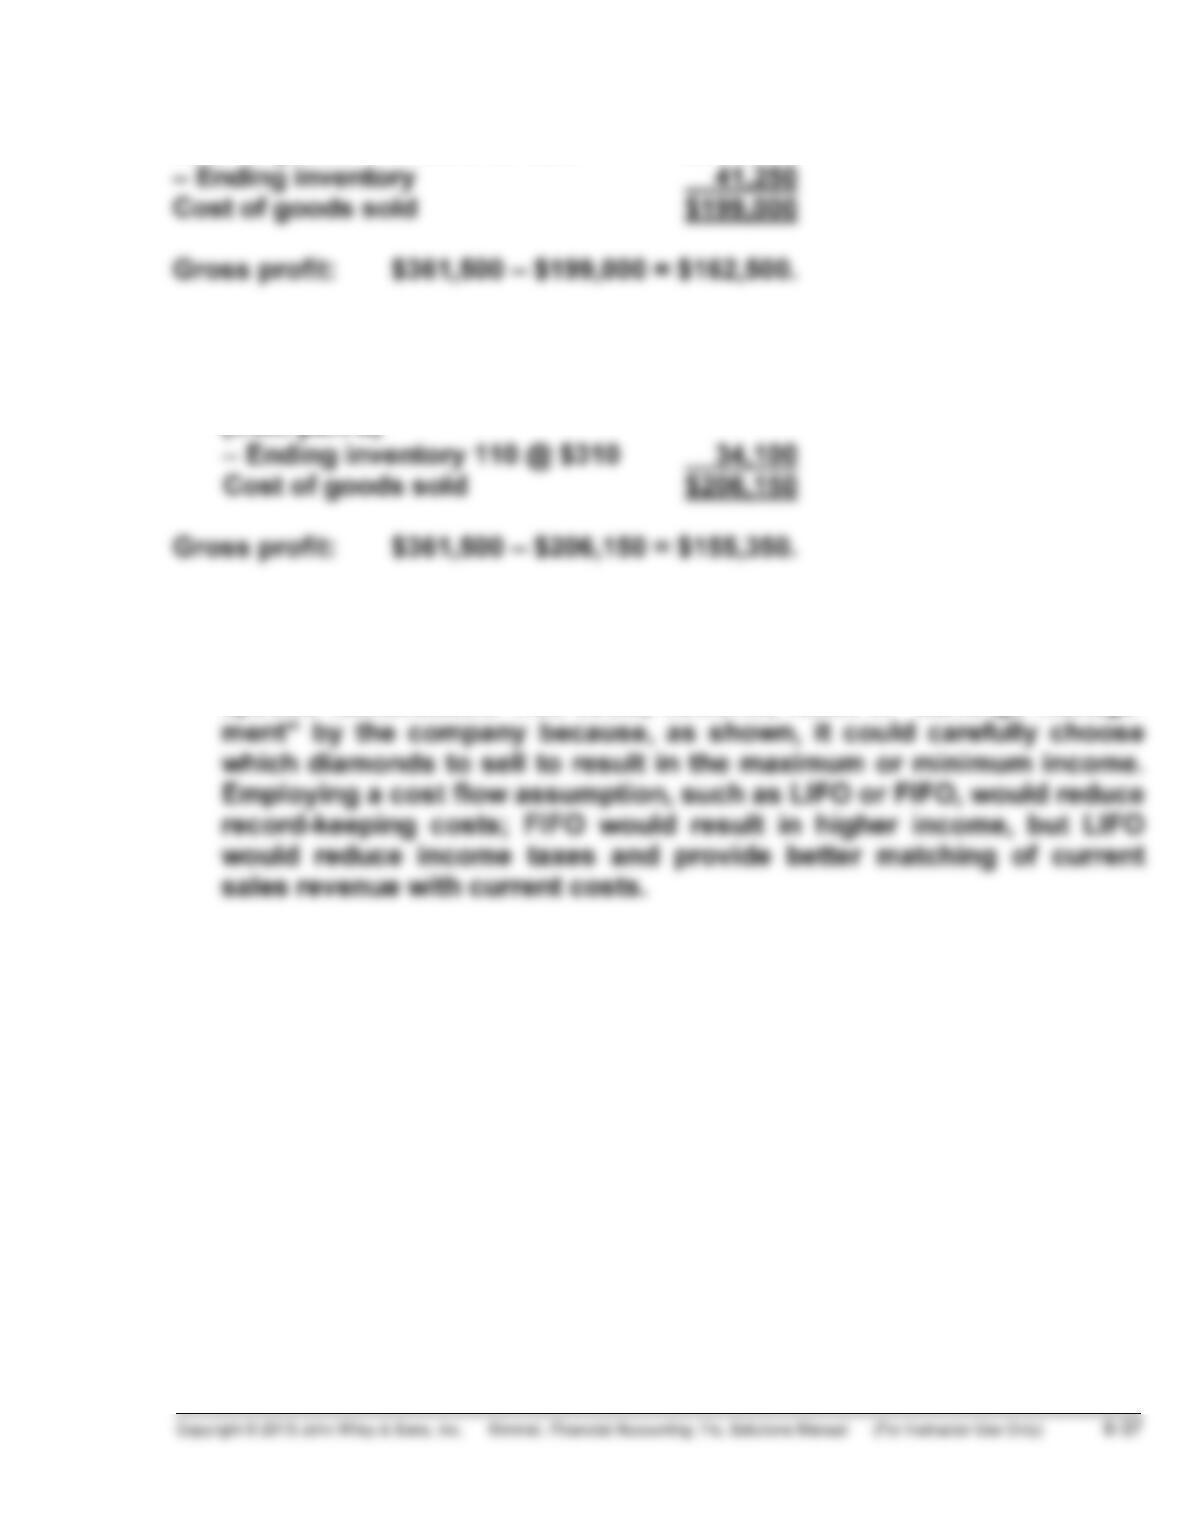
(a) (1) To maximize gross profit, Wooderson Gems should sell the dia-
monds with the lowest cost.
Sale Date Cost of goods sold Sales Revenue
March 5 150 @ $310 $ 46,500 180 @ $600 $108,000
30 @ $350 10,500
(2) To minimize gross profit, Wooderson Gems should sell the dia-
monds with the highest cost.
Sale Date Cost of goods sold Sales Revenue
March 5 180 @ $350 $ 63,000 180 @ $600 $108,000
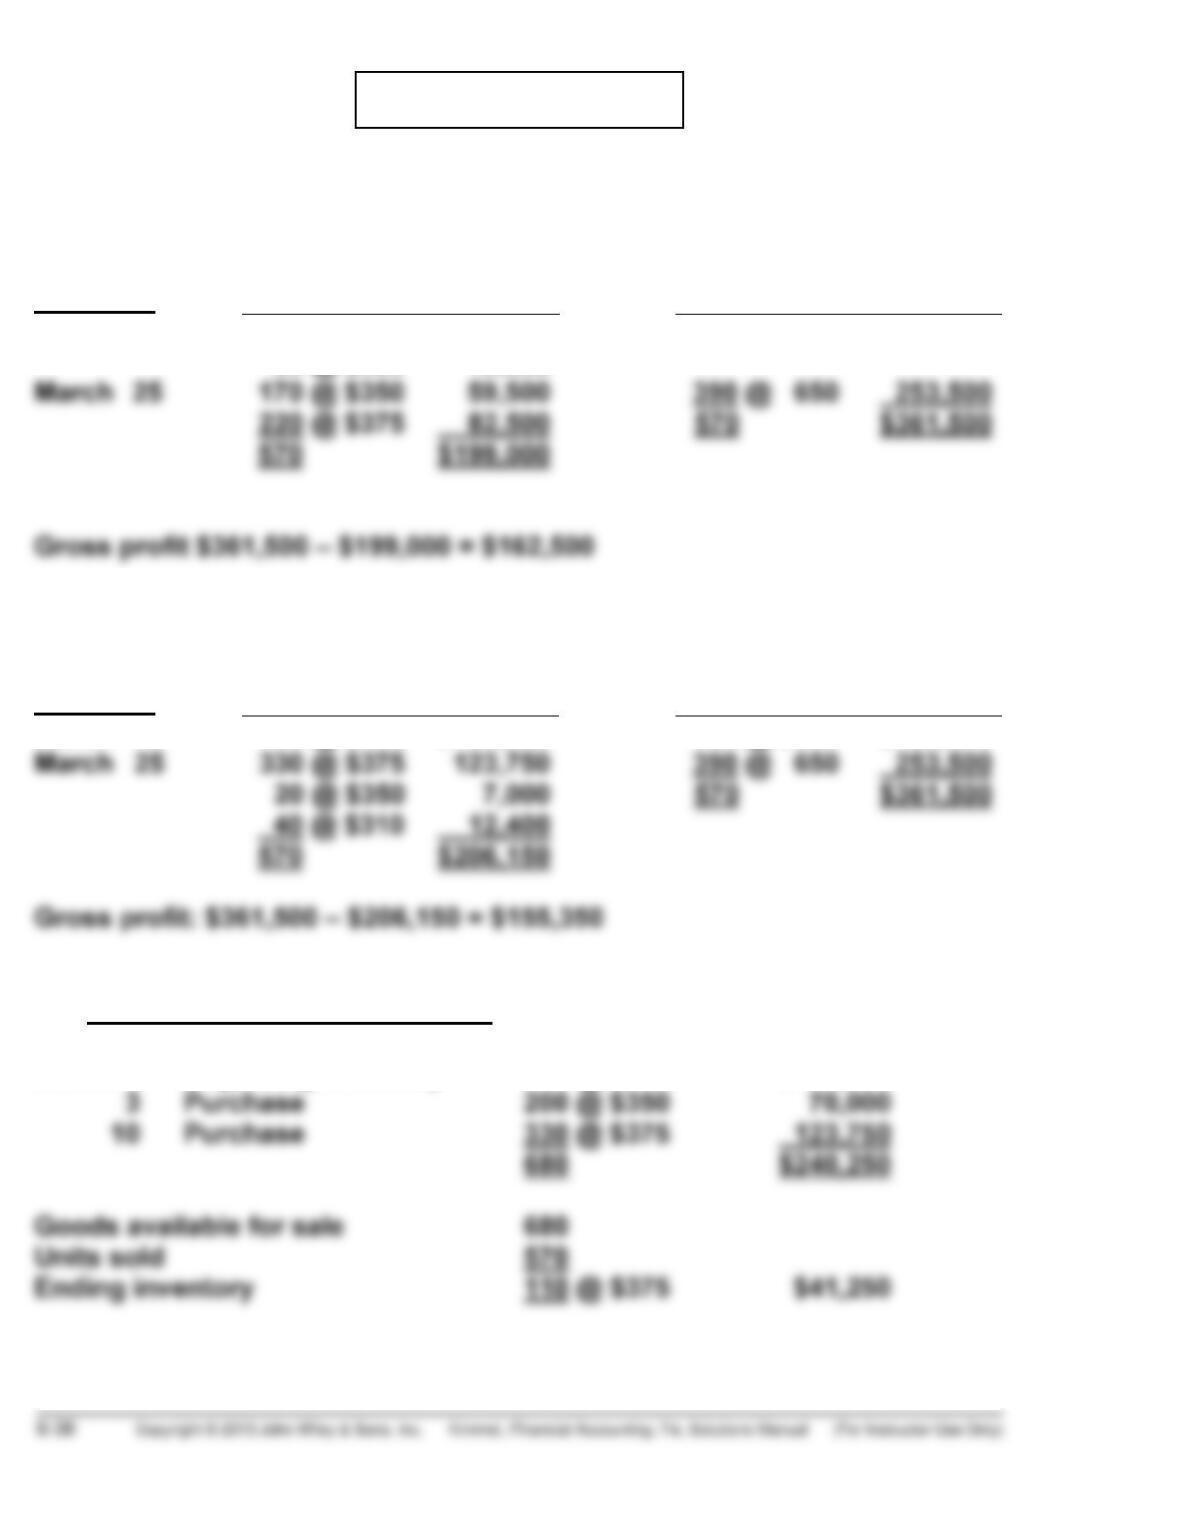
(b) FIFO
Cost of goods available for sale
March 1 Beginning inventory 150 @ $310 $ 46,500
PROBLEM 6-6A (Continued)
Cost of goods available for sale $240,250
(c) LIFO
Cost of goods available for sale $240,250
(from part b)
(d) The choice of inventory method depends on the company’s objectives.
Since the diamonds are marked and coded, the company could use
specific identification. This could, however, result in “earnings manage-
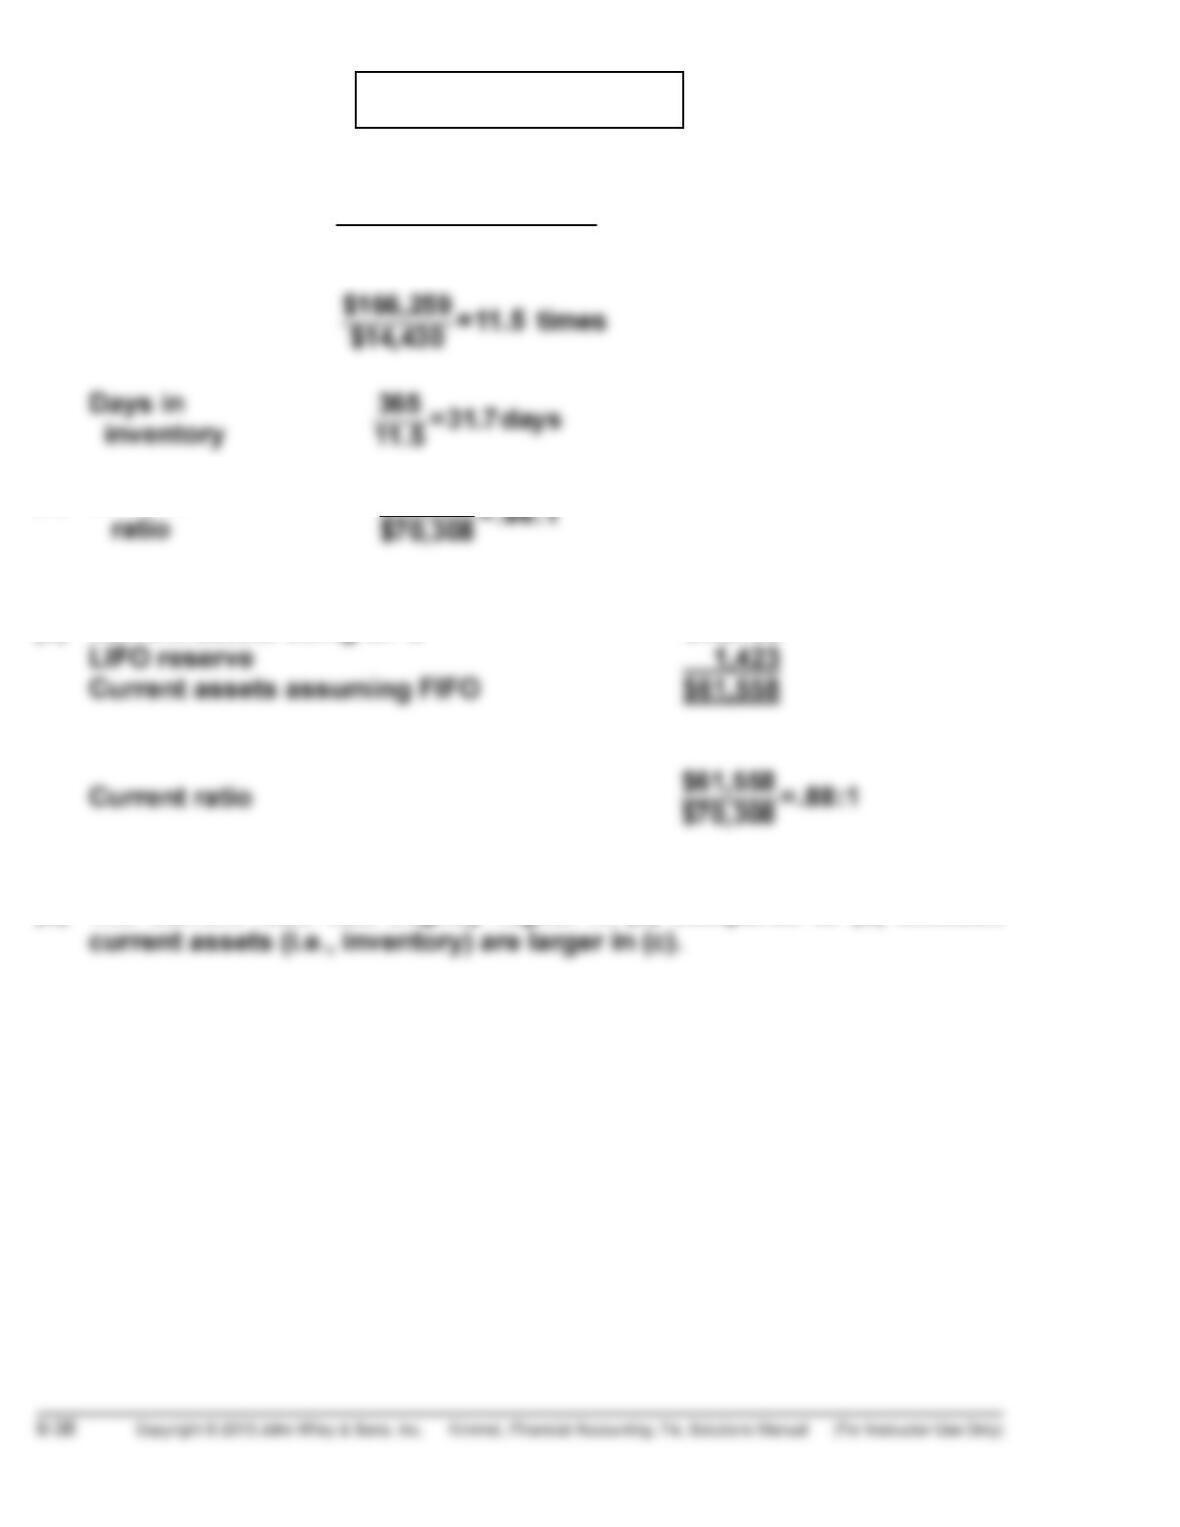
PROBLEM 6-7A
(a) Inventory
turnover
$166,259
($13,921+ $14,939)÷2
(b) Current
$60,135
(c) Current assets using LIFO $60,135
(d) The current ratio was slightly higher in (c) compared to (b) because
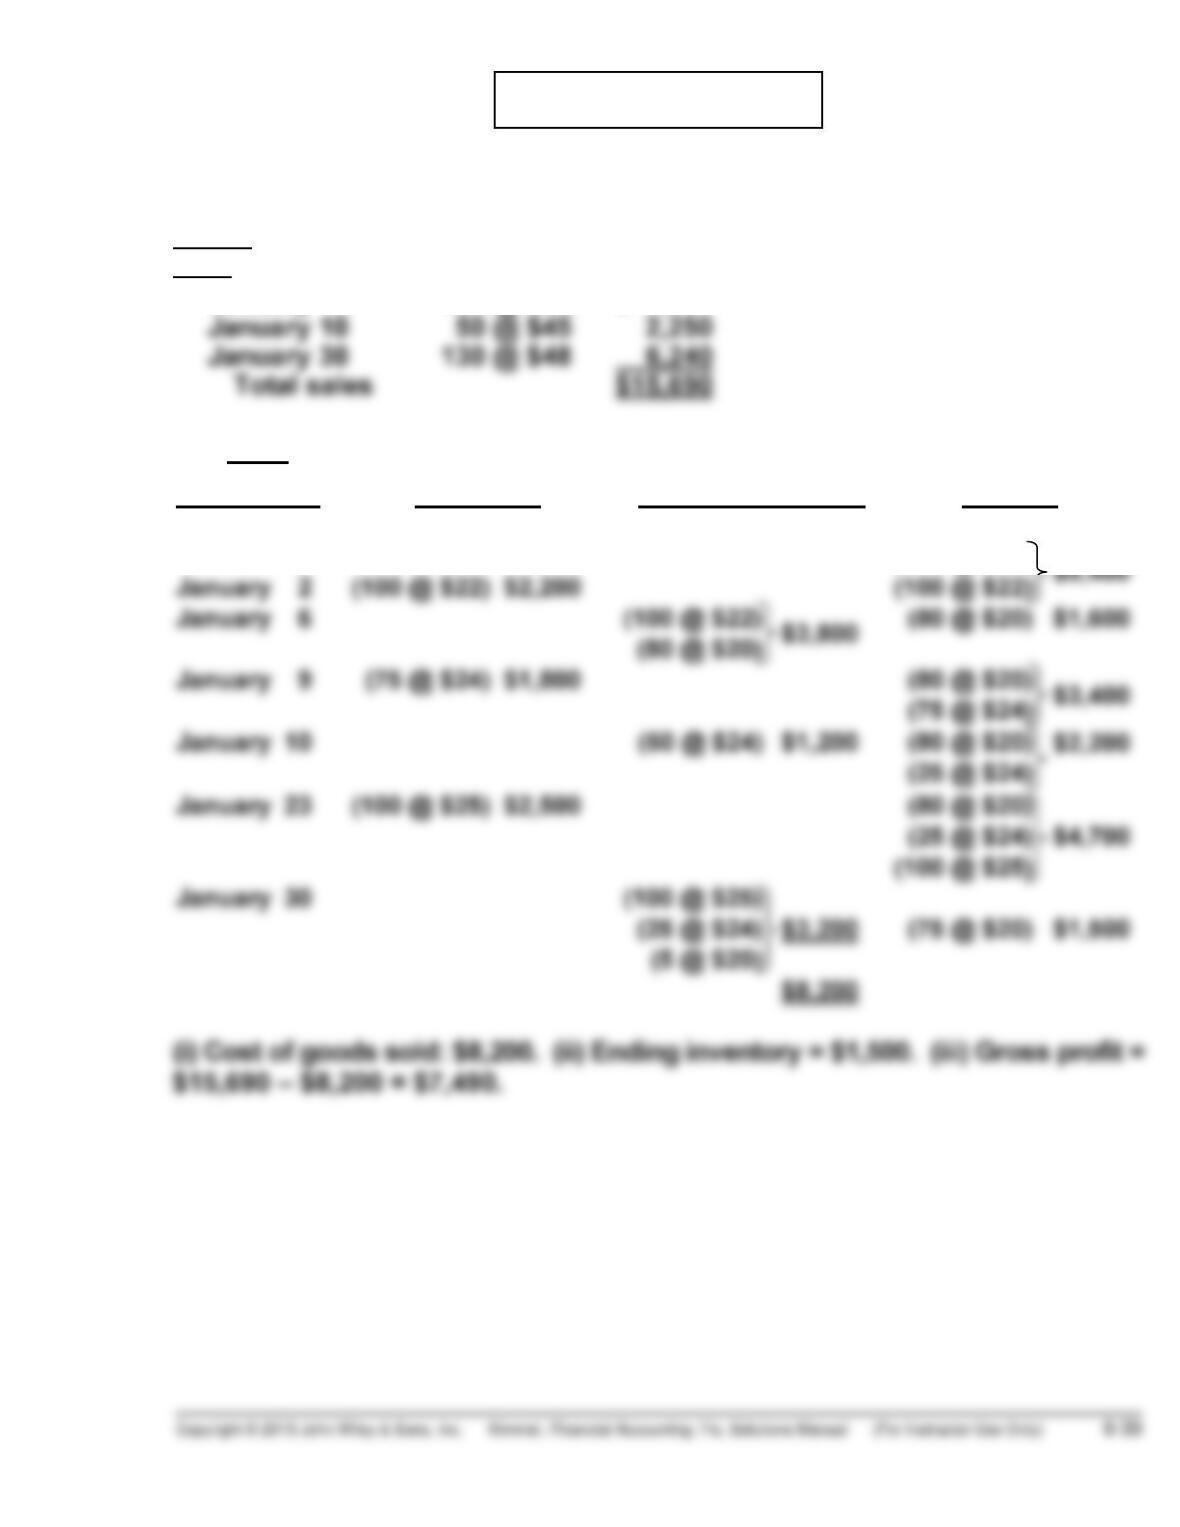
*PROBLEM 6-8A
(a)
Sales:
Date
January 6 180 @ $40 $ 7,200
(1) LIFO
Date Purchases Cost of goods sold Balance
January 1 (160 @ $20) $3,200
(160 @ $20)
*PROBLEM 6-8A (Continued)
(2) FIFO
Date Purchases Cost of goods sold Balance
January 1 (160 @ $20) $3,200
January 2 (100 @ $22) $2,200
(160 @ $20)
(i) Cost of goods sold: $7,825. (ii) Ending inventory = $1,875. (iii) Gross profit =
$15,690 – $7,825 = $7,865.
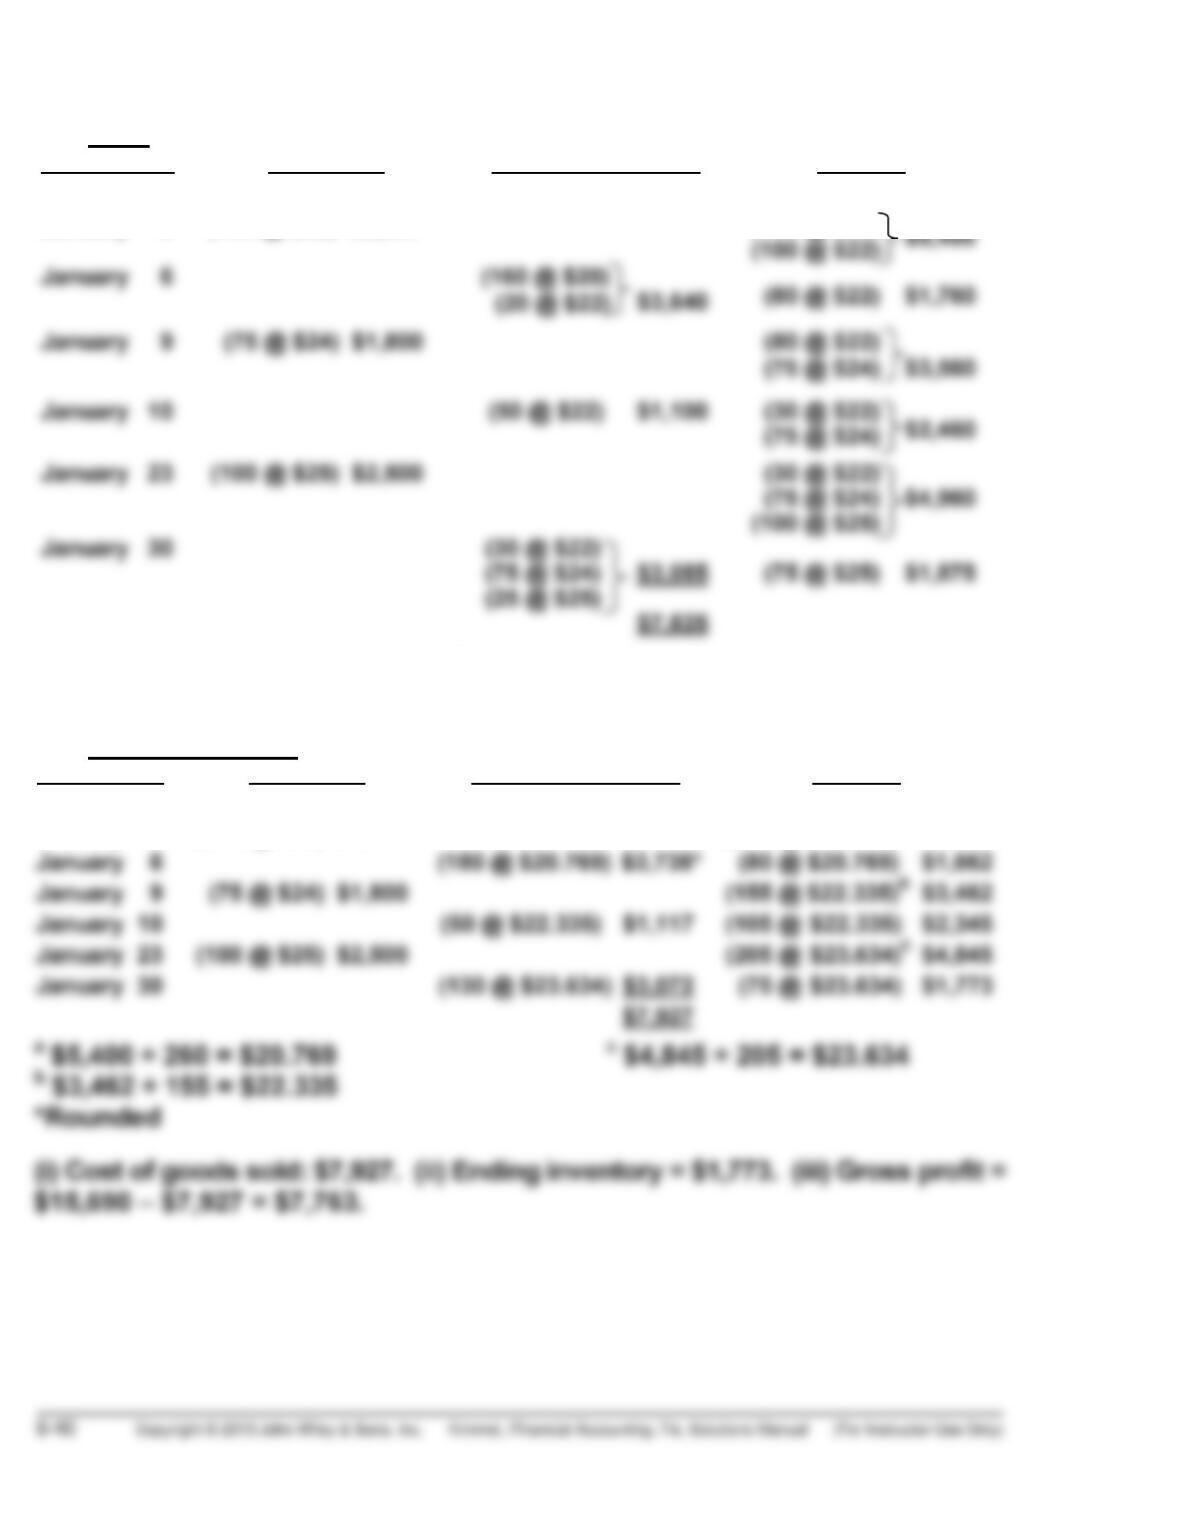
(3) Moving-Average:
Date Purchases Cost of goods sold Balance
January 1 (160 @ $20) $3,200
January 2 (100 @ $22) $2,200 (260 @ $20.769)a $5,400