
CHAPTER 6
Cost-Volume-Profit Analysis: Additional Issues
ASSIGNMENT CLASSIFICATION TABLE
Learning Objectives
Questions
Brief
Exercises
Do It!
Exercises
A
Problems
1. Apply basic CVP concepts.
1, 2, 3, 4, 5,
6
1, 2, 3, 4, 5,
6
1
1, 2, 3, 4, 5
1A, 2A, 6A
2. Explain the term sales mix and
its effects on break-even sales.
7, 8, 9
7, 8, 9, 10
2
6, 7, 8, 9, 10
3A
3. Determine sales mix when a
company has limited resources.
10, 11
11, 12
3
11, 12, 13
4A
4. Indicate how operating leverage
affects profitability.
12, 13, 14,
15, 16
13, 14, 15
4
14, 15, 16
5A, 6A
*5. Explain the difference between
absorption costing and variable
costing.
17, 18, 19,
20, 21, 22
16, 17, 18,
19
17, 18, 19
7A, 8A
ASSIGNMENT CHARACTERISTICS TABLE
Problem
Number
Description
Difficulty
Level
Time
Allotted (min.)
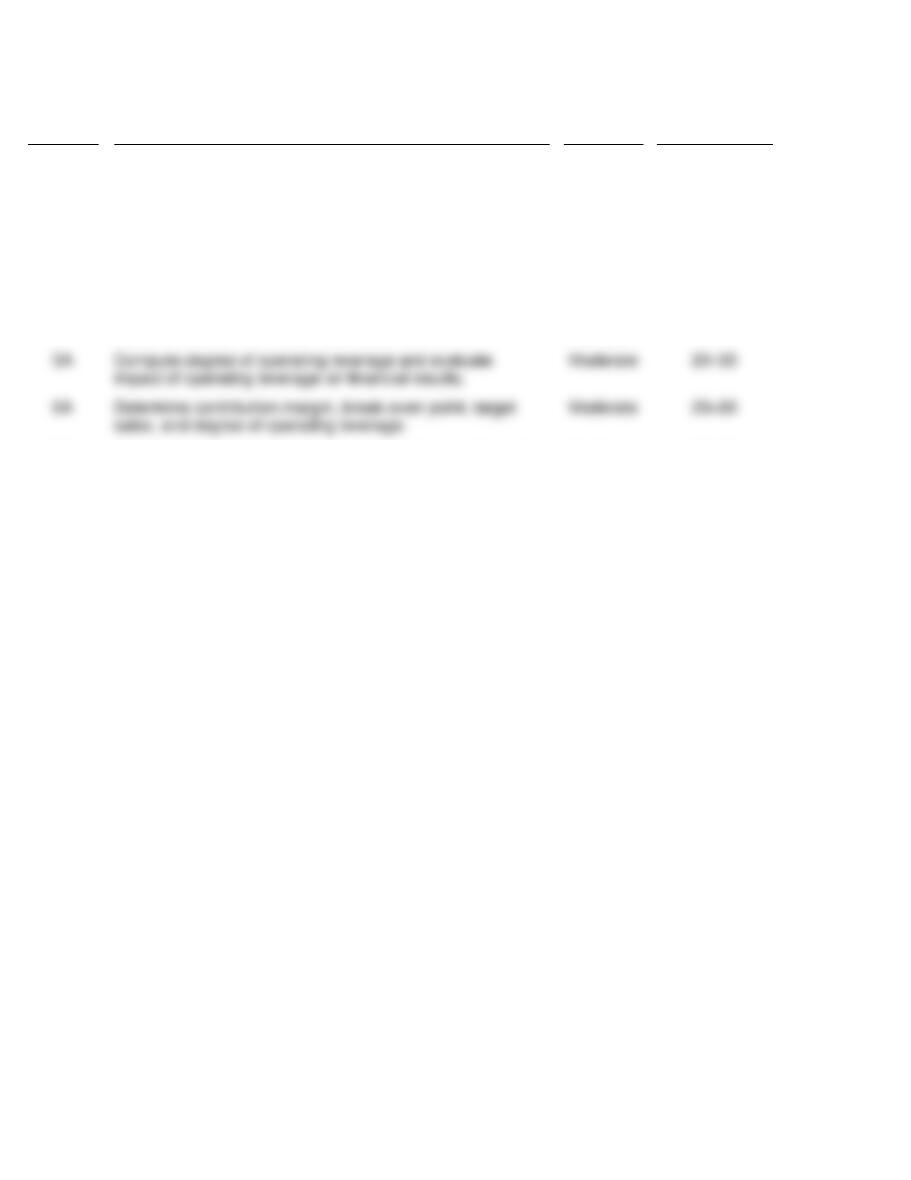
1A
Compute break-even point under alternative courses of
action.
Moderate
20–30
2A
Compute break-even point and margin of safety ratio, and
prepare a CVP income statement before and after changes
in business environment.
Moderate
20–30
3A
Determine break-even sales under alternative sales
strategies and evaluate results.
Moderate
20–30
4A
Determine sales mix with limited resources.
Simple
10–15
*7A
Prepare income statements under absorption costing and
variable costing for a company with beginning inventory,
and reconcile differences.
Moderate
20–30
*8A
Prepare absorption and variable costing income statements
and reconcile differences between absorption and variable
costing income statements when sales level and production
level change. Discuss relative usefulness of absorption
costing versus variable costing.
Moderate
20–30
impact of operating leverage on financial results.
6A
Determine contribution margin, break-even point, target
sales, and degree of operating leverage.
Moderate
20–30

BLOOM’ S TAXONOMY TABLE
Correlation Chart between Bloom’s Taxonomy, Learning Objectives and End–of-Chapter Exercises and Problems
Learning Objective
Knowledge
Comprehension
Application
Analysis
Synthesis
Evaluation
*1. Apply basic CVP concepts.
Q6-1
Q6-3
Q6-2
Q6-4
Q6-5
Q6-6
BE6-2
BE6-3
BE6-4
BE6-5
BE6-6
DI6-1
E6-1
E6-2
E6-3
E6-4
E6-5
P6–3A
P6–6A
BE6-1
P6–1A
P6–2A
P6–6A
*2. Explain the term sales mix and
its effects on break-even sales.
Q6-7
Q6-8
Q6-8
Q6-9
BE6-7
BE6-8
BE6-9
BE6-10
DI6-2
E6-6
E6-7
E6-8
E6-9
E6–10
P6–3A
E6-6
E6-7
E6-8
P6–3A
*3. Determine sales mix when a
company has limited resources.
Q6–11
Q6–10
BE6-11
BE6-12
DI6-3
E6–11
E6–12
E6–13
P6–4A
E6–11
E6–12
E6–13
P6–4A
*4. Understand how operating
leverage affects profitability.
Q6–12
Q6–13
Q6–15
Q6–14
Q6–16
BE6-13
BE6-14
BE6-15
E6–14
E6–15
E6–16
P6-5A
P6-6A
DI6-4
E6–14
E6–15
E6–16
P6-5A
P6–6A
**5. Explain the difference between
absorption costing and
variable costing.
Q6-17
Q6–18
Q6–19
Q6–20
Q6–21
Q6–22
Q6–19
BE6-16
BE6-17
BE6-18
BE6-19
E6–17
E6–18
E6–19
P6–7A
P6–8A
E6–18
E6–19
P6–7A
P6–8A
Broadening Your Perspective
BYP6-6
BYP6-3
BYP6-4
CD6
BYP6-1
BYP6-5
BYP6-8
BYP6-2
BYP6-7
BYP6-9

ANSWERS TO QUESTIONS
1. CVP or cost-volume-profit analysis is the study of the effects of changes in costs and volume on
a company’s profit.
2. Managers use CVP analysis to make decisions involving break-even point, sales required to
reach a target net income, margin of safety, the most profitable sales mix, allocation of limited
resources, and operating leverage.
3. Both types of income statements report the same amount of net income. But the format used to
reach net income differs.
A traditional income statement’s format consists of:
Sales revenue – cost of goods sold = gross profit; Gross profit – selling and administrative expenses =
net income.
A CVP income statement’s format consists of:
Sales revenue – variable expenses = contribution margin; Contribution margin – fixed expenses =
net income.
4. The CVP income statement isolates variable costs from fixed costs while the traditional income
statement does not. The CVP format indicates contribution margin in total and frequently on a per
unit basis as well. This format facilitates calculation of break-even point and target net income.
It also highlights how changes in sales volume or cost structure affect net income.
5. WHEAT COMPANY
CVP Income Statement
Sales ………………………………………………………………………………………….. $900,000
Variable costs ($500,000 X .75) + ($200,000 X .75) …………………………... 525,000
Contribution margin ………………………………………………………………………. $375,000
6. If the selling price is reduced but variable and fixed costs remain unchanged, the break-even point
will increase.
7. Sales mix is the relative percentage of each product sold when a company sells more than one
product. Sales mix changes the calculation of the break-even point because the fixed costs must
be divided by the weighted-average unit contribution margin.
8. The 150,000-mile tire has a higher unit contribution margin, that is, each tire sold covers a larger
amount of fixed costs. Therefore, if the sales mix shifts away from the 150,000-mile tire to the
50,000-mile tire, the company will have to sell more total tires in order to break-even.
9. If a company has many products, the break-even point is calculated using sales information for
divisions or product lines, rather than individual products. The weighted-average contribution
margin ratio is computed by multiplying the sales mix percentage of each product line by the
contribution margin ratio of each product line, and then summing the results. Total break-even
sales in dollars is then calculated by dividing the company’s total fixed costs by the weighted–
average contribution margin ratio. Finally, to determine the amount of sales generated by each
product line at the break-even point, multiply the total break-even sales by the sales mix percentage
of each product line.
Questions Chapter 6 (Continued)
10. Contribution margin per unit of limited resource is determined by dividing the unit contribution
margin of the product by the number of units of the limited resource required to produce the
product.
11. The theory of constraints is a specific approach used to identify and manage constraints to achieve
the company’s goals. According to this theory, a company must continually identify its constraints
and find ways to reduce or eliminate them, where appropriate. Examples of constraints would be
production bottlenecks or poorly trained workers.
12. Cost structure refers to the relative proportion of fixed costs versus variable costs that a company
incurs. Companies that rely heavily on fixed costs will have higher break-even points.
13. Operating leverage refers to the extent to which a company’s net income reacts to a given change
in sales. A company can increase its operating leverage by increasing its reliance on fixed costs.
14. Typically manual labor is considered a variable cost. Depreciation on factory equipment is a fixed
cost. Therefore, if a company replaces manual labor with automated factory equipment it will
increase its operating leverage, and increase its break-even point.
15. The degree of operating leverage is a measure of a company’s relative operating leverage. It is
calculated by dividing the contribution margin by net income at a particular level of sales.
16. Pine’s degree of operating leverage of 8 versus Fir’s measure of 4 tells us that Pine will
experience twice (8 ÷ 4) the increase (or decrease) in net income for a given increase
(decrease) in sales as Fir.
*17. Under absorption costing, both variable and fixed manufacturing costs are considered to be
product costs. Under variable costing, only variable manufacturing costs are product costs and
fixed manufacturing costs are expensed when incurred.
*18. (a) The rationale for variable costing centers on the purpose of fixed manufacturing costs, which
is to have productive facilities available for use. Since these costs are incurred whether a
company operates at zero or 100% capacity, it is argued that they should be expensed
when they are incurred. Variable costing is useful in product costing internally by management
and it is useful in controlling manufacturing costs.
(b) Variable costing cannot be used for financial reporting purposes because it does not follow
generally accepted accounting principles.
*19. One way to compute the difference is as follows:
Ending inventory X Fixed manufacturing overhead cost per unit
8,500 X $5 = $42,500
Absorption costing will report a $42,500 higher net income than variable costing because a
portion of the fixed manufacturing overhead costs are deferred in inventory.
Questions Chapter 6 (Continued)
*20. If production equals sales in any given period, the net incomes under both methods will be equal.
In this case, there is no increase in the ending inventory. So fixed manufacturing overhead costs
in the current period are not deferred to future periods through the ending inventory.
*21. If production is greater than sales, absorption costing net income will be greater than variable
costing net income. Absorption costing net income is higher because some of the fixed
manufacturing overhead costs will be deferred in the inventory account until the products are
sold.
*22. In the long run, neither method will produce a higher net income amount. Over a long period of
time, sales can never exceed production, nor production exceed sales by significant amounts.
For this reason, over the lifetime of a corporation, variable costing and absorption costing will
tend to yield the same net income amounts.
SOLUTIONS TO BRIEF EXERCISES
BRIEF EXERCISE 6-1
1. (a) $70 = ($250 – $180)
2. (c) $300 = ($500 – $200)
BRIEF EXERCISE 6-2
HAMBY INC.
Income Statement
For the Quarter Ended March 31, 2017
Sales ……………………………………………………………… $2,000,000
Variable expenses
Cost of goods sold ………………………………….. $760,000
Selling expenses……………………………………… 95,000
Administrative expenses ………………………….. 79,000
BRIEF EXERCISE 6-3
Contribution margin ratio = [($250,000 – $150,000) ÷ $250,000] = 40%
BRIEF EXERCISE 6-4
(a) $400Q = $250Q + $210,000 + $0
(b) Unit contribution margin $150, or ($400 – $250)
X = $210,000 ÷ $150
BRIEF EXERCISE 6-5
BRIEF EXERCISE 6-6
Margin of safety = $1,200,000 – $960,000 = $240,000
BRIEF EXERCISE 6-7
Model
Sales Mix
Percentage
Unit Contribution
Margin
Weighted-Average Unit
Contribution Margin
A12
60%
$15 ($50 – $35)
$ 9.00
BRIEF EXERCISE 6-8
Total break-even = ($269,500 ÷ $38.50*) = 7,000 units
Sales Units
Units of A12 = .60 X 7,000 = 4,200
BRIEF EXERCISE 6-9
(a) Weighted-average
(b) Total break-even
point = ($450,000 ÷ .30) = $1,500,000
in dollars
BRIEF EXERCISE 6-10
(a) Sales Mix
Bedroom Division $500,000 ÷ $1,250,000 = .40
(b)
Weight-average contribution
$575,000
OR
Contribution Margin Ratio
Bedroom Division ($275,000 ÷ $500,000) = .55
BRIEF EXERCISE 6-11
Product A
Product B
Unit contribution margin (a)
$10.0
$12
BRIEF EXERCISE 6-12
Product 1
Product 2
[(a) ÷ (b)]
Unit contribution margin (a)
$ 42
$ 32
Product 2 has a higher contribution margin per limited resource, even though
BRIEF EXERCISE 6-13
Degree of operating
leverage (old) = $200,000 ÷ $40,000 = 5
[(a) ÷ (b)]
BRIEF EXERCISE 6-14
Break-even point in dollars:
Diggs Co. Doggs Co.
$75,000 ÷ ($120,000 ÷ $200,000) $105,000 ÷ ($150,000 ÷ $200,000)
= $125,000 = $140,000
Doggs Company’s cost structure relies much more heavily on fixed costs
BRIEF EXERCISE 6-15
Degree of operating leverage = Contribution margin ÷ Net income
*BRIEF EXERCISE 6-16
Variable Costing
Direct materials
$14,400
Direct labor
25,600
Variable manufacturing overhead
Total product costs
*BRIEF EXERCISE 6-17
Absorption Costing
Direct materials
$14,400
Direct labor
25,600
Variable manufacturing overhead
Fixed manufacturing overhead
12,000
Total product costs
$81,400
*BRIEF EXERCISE 6-18
(a) Absorption Costing
……. Direct materials ………………………………………………………. $20
Direct labor …………………………………………………………….. 14
(b) Variable Costing
Direct materials ……………………………………….. $20
*BRIEF EXERCISE 6-19
MEMO
To: Chief financial officer
From: Student
Re: Absorption and variable costing
Under absorption costing, fixed manufacturing overhead is a product cost,
while under variable costing, fixed manufacturing overhead is a period cost
(expensed as incurred).
SOLUTIONS TO DO IT! REVIEW EXERCISES
DO IT! 6-1
(a) Break-even point in units is 7,500 units ($150,000 ÷ $20).
Break-even point in sales dollars is $375,000 ($150,000 ÷ .40*).
(b) Break-even point in units is 8,333 units (rounded) ($150,000 ÷ $18*).
Break-even point in sales dollars is $400,000 ($150,000 ÷ .375**).
The margin of safety in dollars is $118,400 ($518,400*** – $400,000).
*$50 – (.04 X $50) – 30 = $18.
DO IT! 6-2
(a) The sales mix percentages as a function of units sold is:
Basic
Basic Plus
Premium
750 ÷ 1,500 = 50%
450 ÷ 1,500 = 30%
300 ÷ 1,500 = 20%
DO IT! 6-2 (Continued)
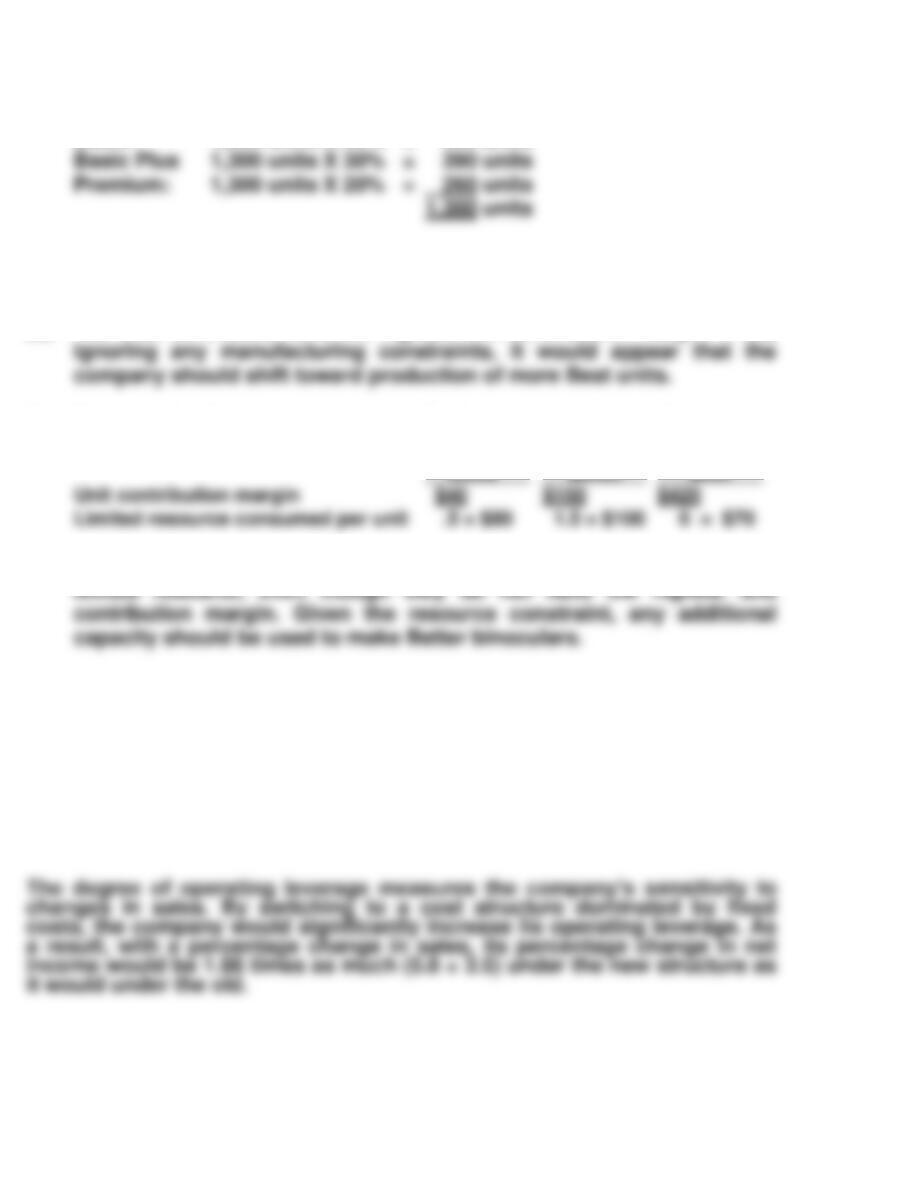
(d) The break-even units to produce for each product are:
Basic: 1,300 units X 50% = 650 units
DO IT! 6-3
(a) The Best binoculars have the highest unit contribution margin. Thus,
(b) The contribution margin per unit of limited resource is calculated as:
Good
Better
Best
(c) The Better binoculars have the highest contribution margin per unit of
DO IT! 6-4
(a)
Contribution
Margin
Net Income
=
Degree of operating
Leverage
Old
$1,400,000
$400,000
=
3.5
New
$2,300,000
$400,000
=
5.8
SOLUTIONS TO EXERCISES
EXERCISE 6-1
(a) 1. Contribution margin per room = $60 – ($8 + $34)
Contribution margin per room = $18
Contribution margin ratio = $18 ÷ $60 = 30%
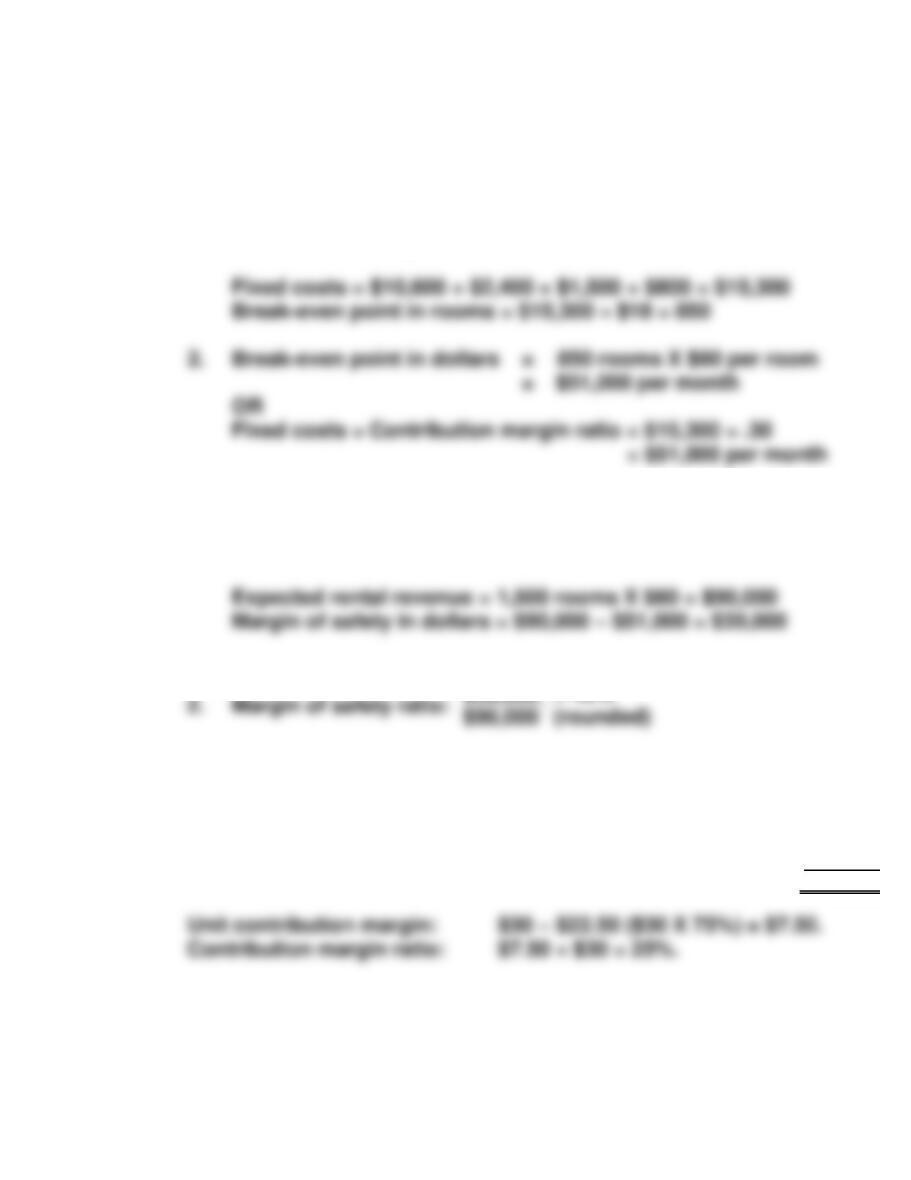
(b) 1. Margin of safety in dollars:
Planned activity = 50 rooms per day X 30 days
= 1,500 rooms per month
$39,000
= 43%
EXERCISE 6-2
(a) Contribution margin in dollars: Sales = 4,000 X $30 = $120,000
Variable costs = $120,000 X .75 = 90,000
Contribution margin $ 30,000
EXERCISE 6-2 (Continued)
(b) Break-even sales in dollars:
$16,800
25%
= $67,200.
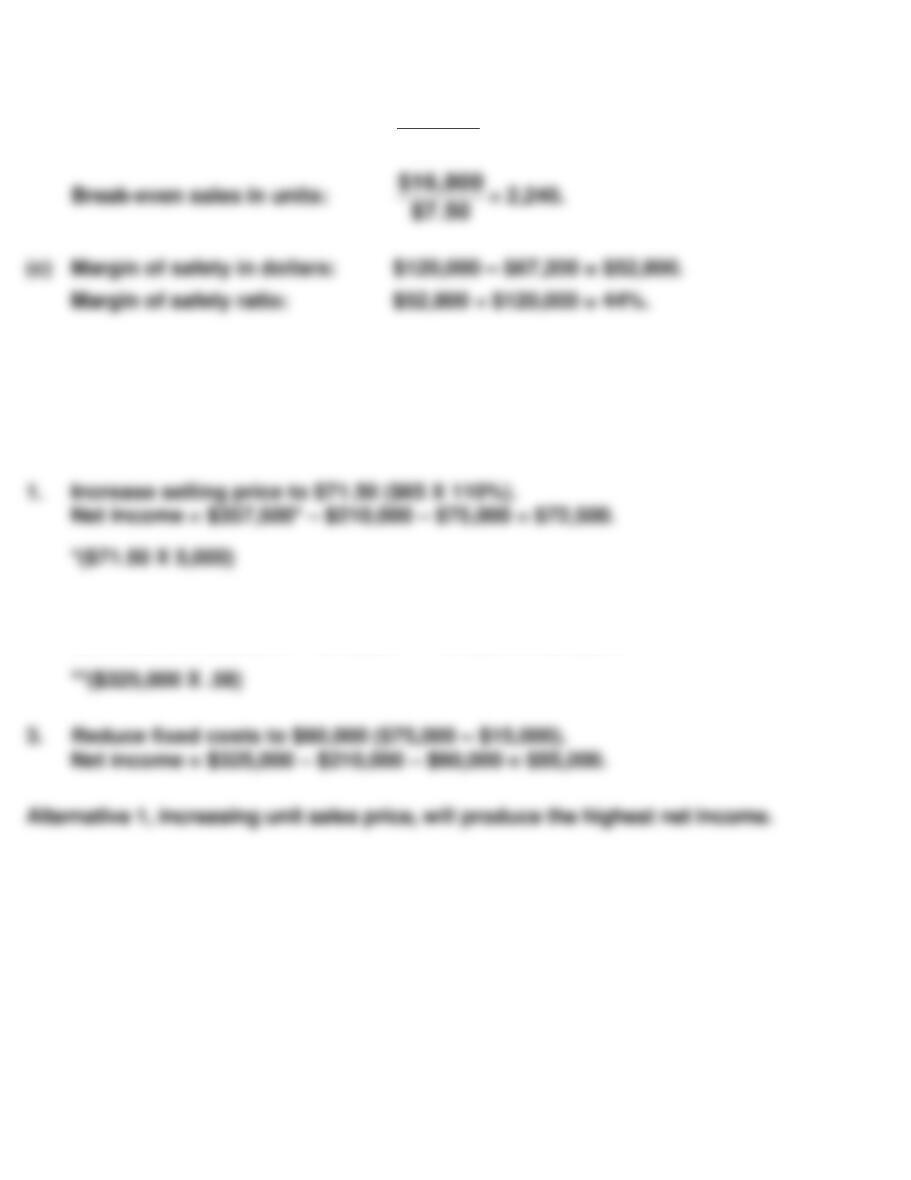
EXERCISE 6-3
Current selling price = $325,000 ÷ 5,000 units
Current selling price = $65
2. Reduce variable costs to 58% of sales.
Net income = $325,000 – $188,500** – $75,000 = $61,500.
EXERCISE 6-4
(a)
1. Contribution margin ratio is:
$30,000
= 62.5%
$48,000
Break-even point in dollars =
$20,250
= $32,400
62.5%
(b) At the break-even point fixed costs and contribution margin are equal.
Therefore, the contribution margin at the break-even point would be
$20,250.
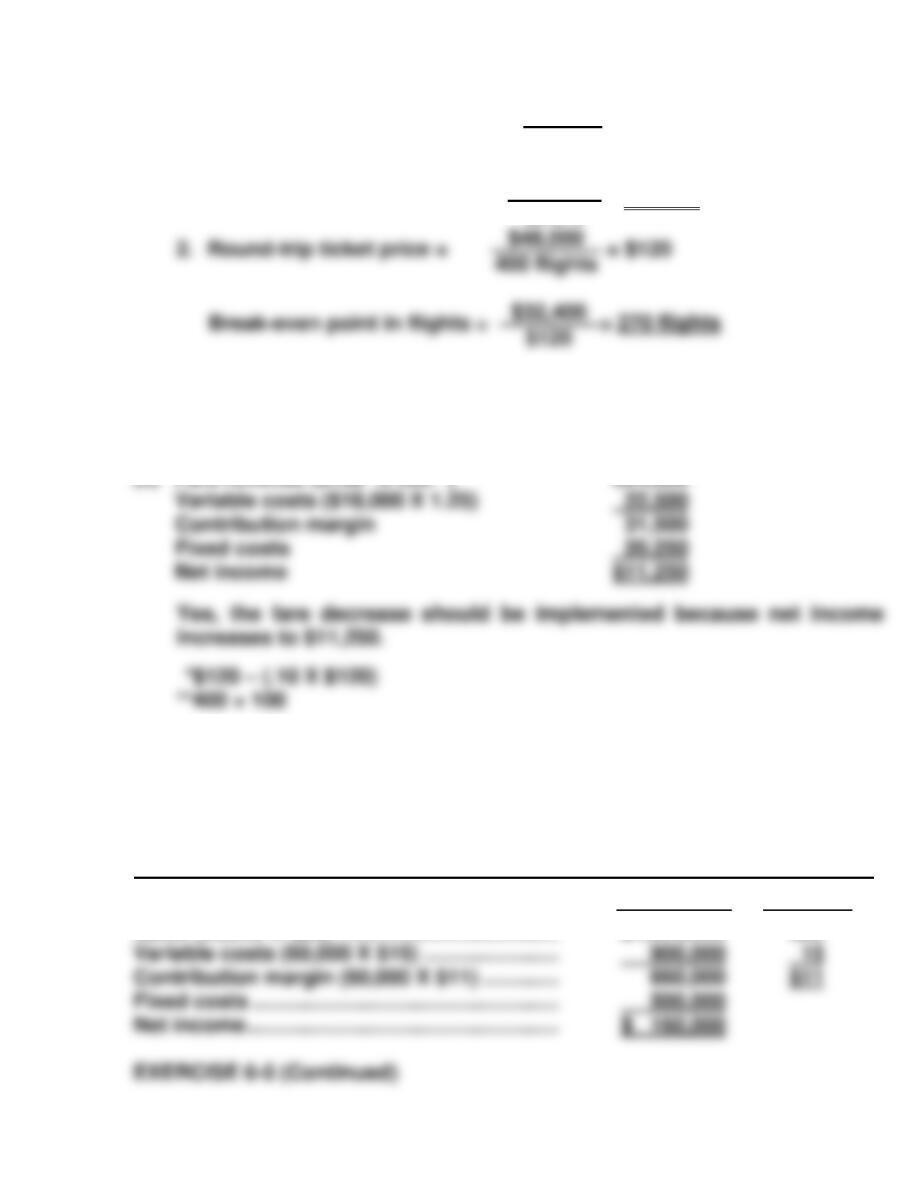
(c)
Fare revenue ($108* X 500**)
$54,000
Variable costs ($18,000 X 1.25)
Contribution margin
Fixed costs
Net income
EXERCISE 6-5
(a) CAREY COMPANY
CVP Income Statement
For the Year Ended December 31, 2017
Total
Per Unit
Sales (60,000 X $26) ………………………………..
$1,560,000
$26
$48,000
(b) CAREY COMPANY
CVP Income Statement
For the Year Ended December 31, 2017
Total
Per Unit
Sales [(60,000 X 105%) X $24.50*] …………….
$1,543,500
$24.50
EXERCISE 6-6
Sales Mix
Percentage
Unit contribution
Margin
Weighted-Average
Contribution Margin
Lawnmowers
20%
$30
$ 6
Sales Mix
Percentage
Total
Break-even Sales
in Units
Sales Units
Needed
Per Product
Weed-trimmers
Total units
X
=
Lawnmowers
20%
X
150,000
=
30,000 units
Net income ……………………………………………..
$ 187,500
EXERCISE 6-7
(a)
Sales Mix
Percentage
Contribution
Margin Ratio
Weighted-Average
Contribution
Margin Ratio
Oil changes
70%
20%
.14
Sales Mix
Percentage
Total
Break-even Sales
in Dollars
Sales Dollars
Needed
Per Product
Oil changes
Total sales
70%
X
=
(b)
Sales to achieve target net income = ($78,000 + $52,000) ÷ .26 = $500,000
Sales Mix
Percentage
Total
Sales Needed
Sales Dollars
Needed Per Product
Per Store
Total sales
Oil changes
70%
X
$500,000
=
$350,000
EXERCISE 6-8
(a)
Sales Mix
Percentage
Contribution
Margin Ratio
Weighted-Average
Contribution
Margin Ratio
Mail pouches
and small boxes
80%
20%
.16
EXERCISE 6-8 (Continued)
Sales Mix
Percentage
Total Break-
even Sales
in Dollars
Sales Dollars
Needed
Per Product
Mail pouches
and small boxes
80%
X
$40,000,000
=
$32,000,000
(b)
Sales Mix
Percentage
Contribution
Margin Ratio
Weighted-Average
Contribution
Margin Ratio
Mail pouches
and small boxes
40%
20%
.08
Sales Mix
Percentage
Total Break-
even Sales
in Dollars
Sales Dollars
Per Product
Total sales
Mail pouches
and small boxes
40%
X
$24,000,000
=
$ 9,600,000
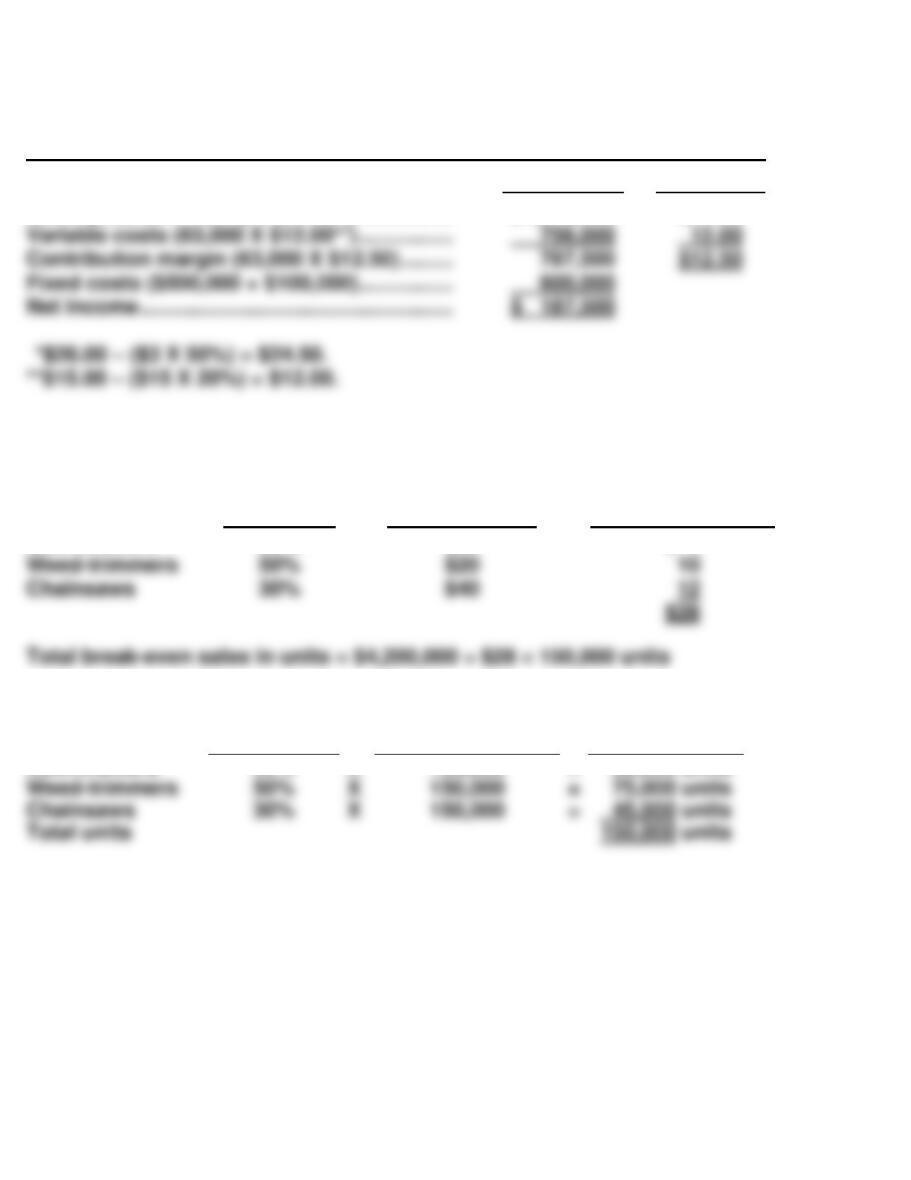
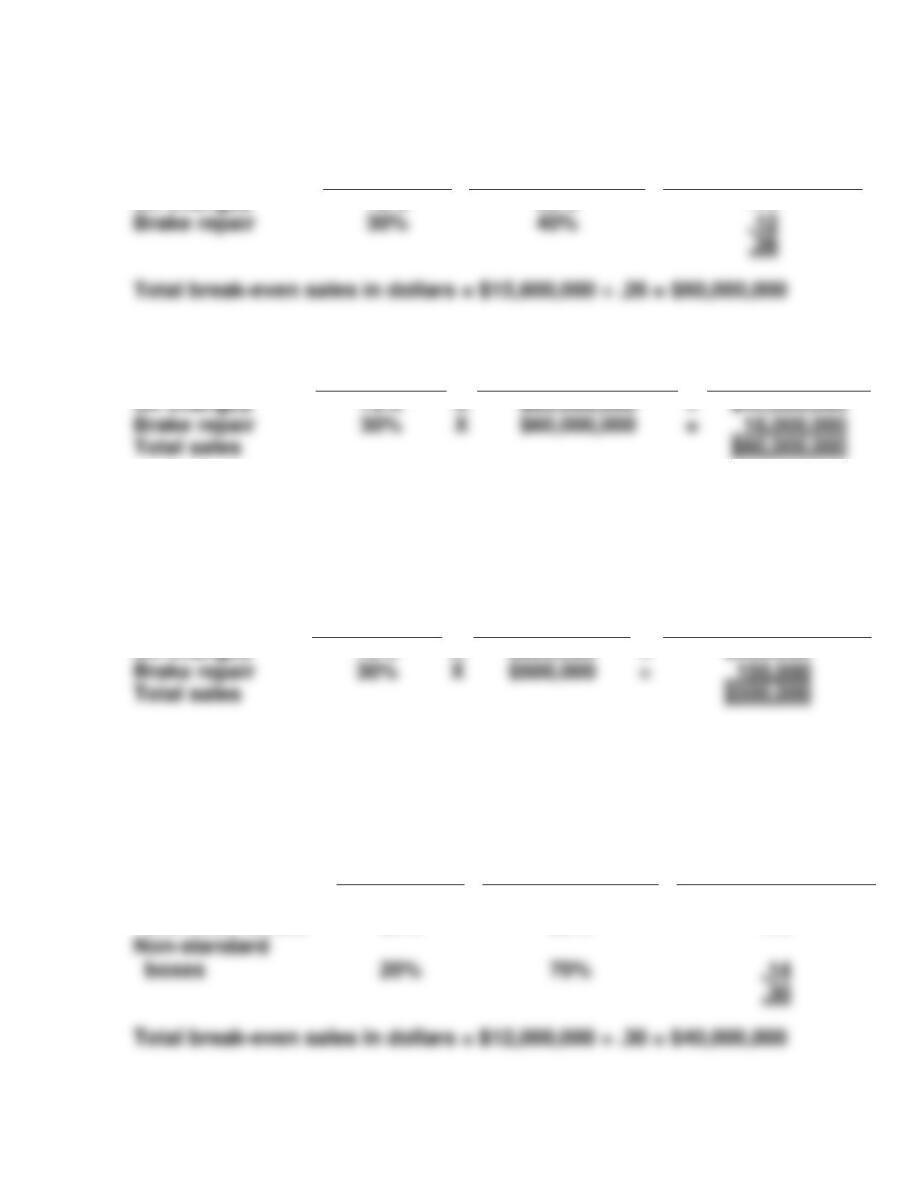
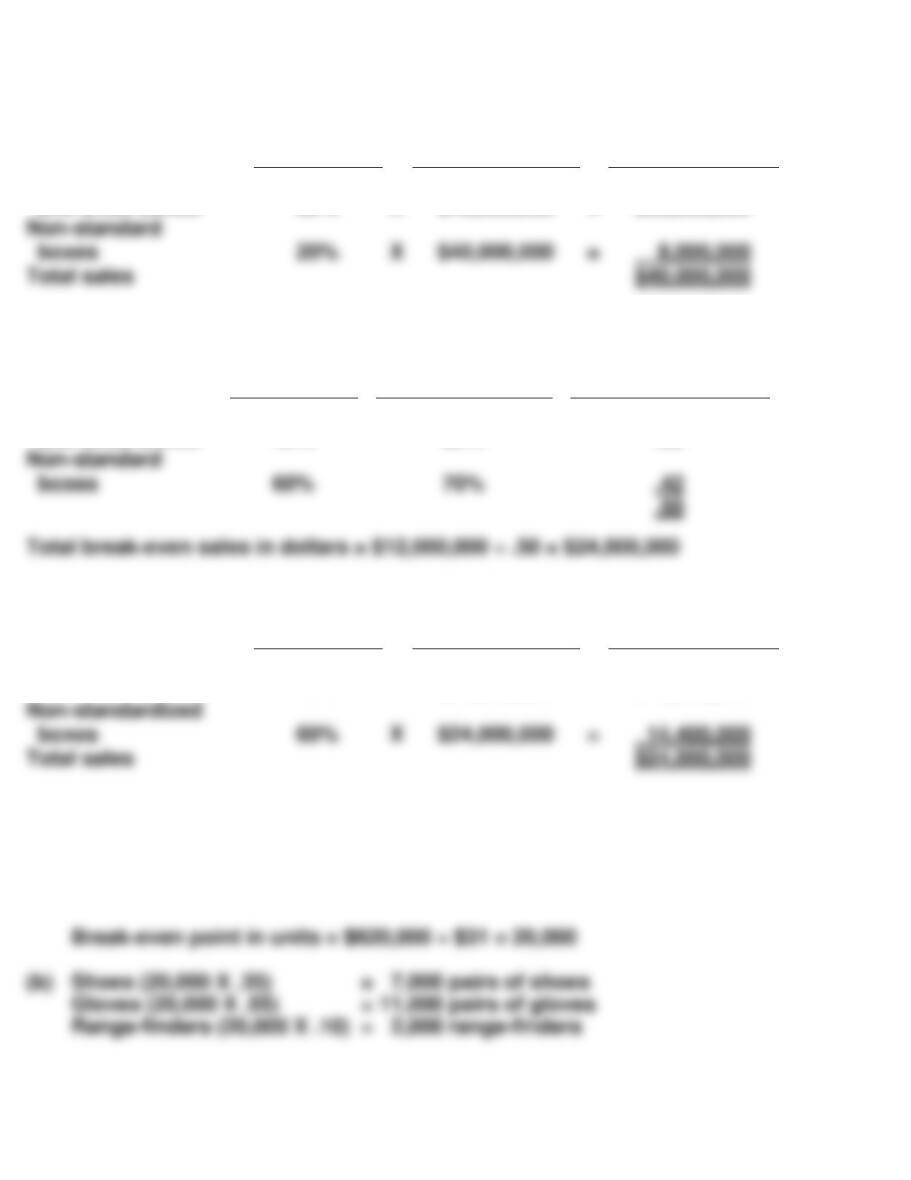
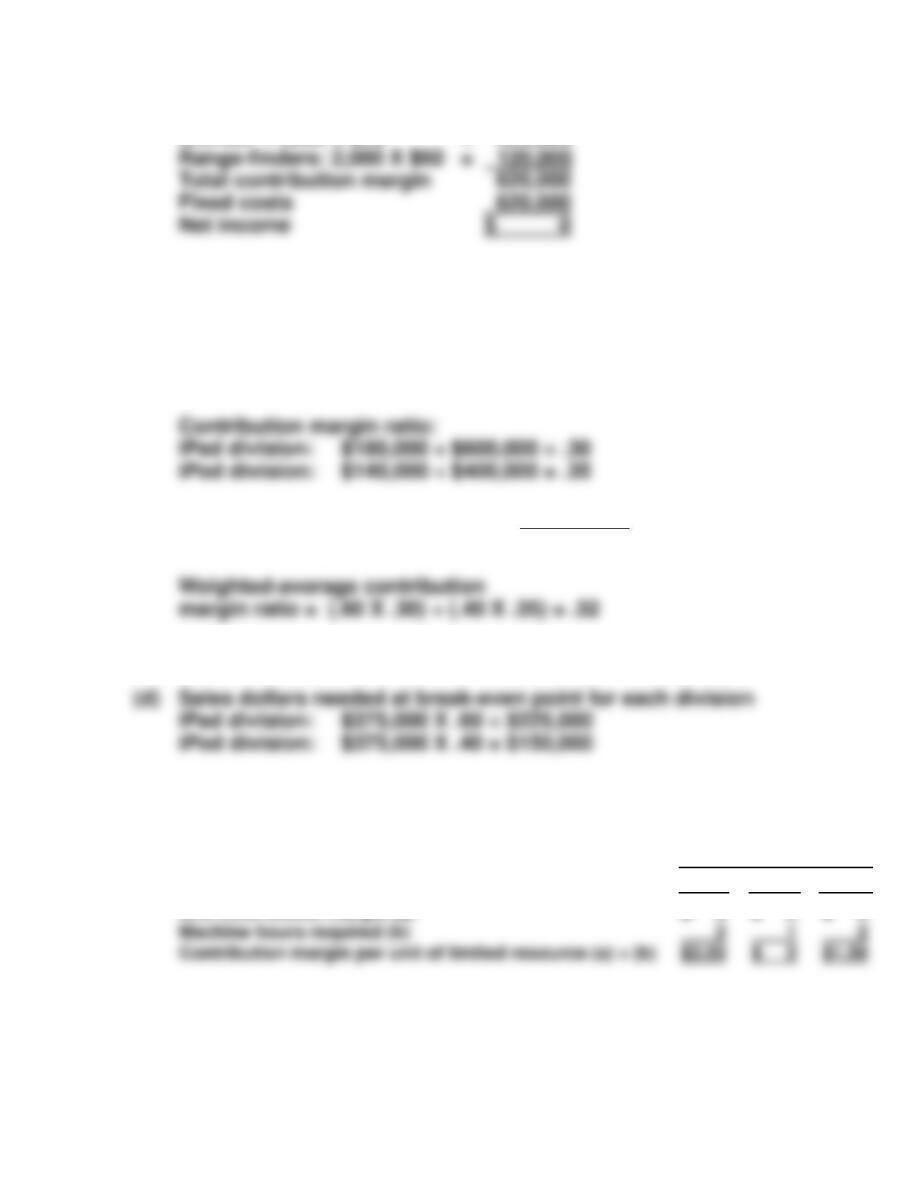
EXERCISE 6-9
(a) Weighted-average unit
contribution margin = ($40 X .35) + ($20 X .55) + ($60 X .10) = $31
Total sales
EXERCISE 6-9 (Continued)
(c) Shoes: 7,000 X $40 = $280,000
Gloves: 11,000 X $20 = 220,000
EXERCISE 6-10
(a) Sales mix percentage
iPad division: $600,000 ÷ ($600,000 + $400,000) = .60
iPod division: $400,000 ÷ ($600,000 + $400,000) = .40
(b)
Weighted-average contribution
=
$320,000
= .32 OR
margin ratio
$1,000,000
(c) Break-even point in dollars = $120,000 ÷ .32 = $375,000
EXERCISE 6-11
(a)
Product
A
B
C
Contribution margin per unit of limited resource (a) ÷ (b)
Unit contribution margin (a)
$ 6
$ 2
$ 3
(b) Product A should be manufactured because it results in the highest
contribution margin per machine hour.
EXERCISE 6-11 (Continued)
(c)
1.
Product
A
B
C
Machine hours (a) (3,000 ÷ 3)
1,000
1,000
1,000
2.
Product A
Total contribution margin [(a) X (b)]
Machine hours (a)
3,000
EXERCISE 6-12
(a)
Product D: $30 ÷ $10 = 3.0 hours per unit
Product E: $80 ÷ $10 = 8.0 hours per unit
Product F: $35 ÷ $10 = 3.5 hours per unit
(b)
Product
D
E
F
Selling price
$200
$ 300
$250
Variable costs
160
Contribution margin
Direct labor hours per unit
÷ 8.0
Contribution margin per
direct labor hour
$17.50
(c) Product D should be produced because it generates the highest contri-
bution margin per direct labor hour.
Product D
Total direct labor hours available
Contribution margin per direct labor hour
Total contribution margin
Contribution margin per unit of limited
Total contribution margin [(a) X (b)]
$2,000
$1,500
EXERCISE 6-13
(a)
Product
Basic
Deluxe
Selling price per unit
$40
$ 52
(b) The Basic product should be manufactured because it results in the
higher contribution margin per machine hour.
(c)
1.
Basic
Deluxe
Total
Machine hours allocated
500
500
1,000
$36
Machine hours allocated
1,000
X Contribution margin
per machine hour
–0–
X Contribution margin
EXERCISE 6-14
(a)
Contribution
Margin
÷
Net
Income
=
Degree of Operating
Leverage
Contador
÷
=
Armstrong
$260,000
÷
$100,000
=
2.60
Variable costs per unit
Unit contribution margin (a)
Machine hours required (b)
Contribution margin per
machine hour (a) ÷ (b)
EXERCISE 6-14 (Continued)
(b)
Armstrong Company
Contador Company
Sales
Variable costs
$550,000**
264,000**
$550,000***
55,000***
(c) Each company experienced a $50,000 increase in sales. However, be–
cause of Contador’s higher operating leverage, it experienced a $45,000
EXERCISE 6-15
(a)
Contribution
Margin
÷
Net Income
=
Degree of
Operating Leverage
÷
=
Manual system
$300,000
÷
$200,000
=
1.50
(b) The computerized system would produce profits that are 3.0 times
(4.50 ÷ 1.50) as much as the manual system. With a $150,000 increase in
Net income
EXERCISE 6-15 (Continued)
Manual
System
Computerized
System
Sales
$1,650,000
$1,650,000
(c)
(Actual Sales
–
Break-even Sales)
÷
Actual Sales
=
Margin of Safety Ratio
–
÷
=
Manual system
Computerized
($1,500,000
–
$500,000*)
÷
$1,500,000
=
.67
EXERCISE 6-16
(a)
Contribution
Margin
÷
Net
Income
=
Degree of Operating
Leverage
Traditional Yams
Auto-Yams
$ 80,000
$240,000
÷
÷
$50,000
$50,000
=
=
1.60
4.80
Auto-Yams, which relies more heavily on fixed costs, has the higher
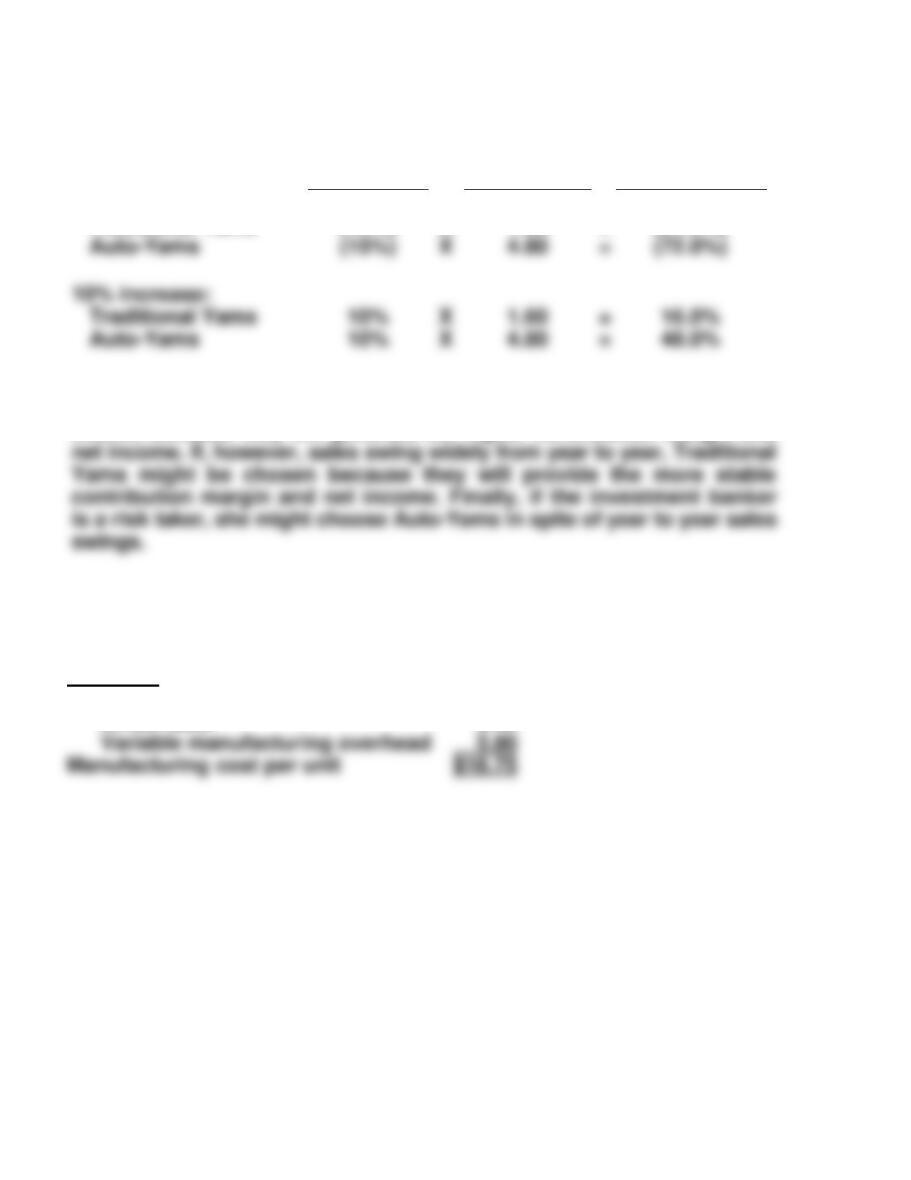
EXERCISE 6-16 (Continued)
(b)
% Change
in Sales
X
Degree of
Operating
Leverage
=
% Change in
Net Income
15% decrease:
Traditional Yams
(15%)
X
1.60
=
(24.0%)
(c) There are several possible answers that could be given. For example,
if the candied Yams business is fairly stable, Auto-Yams might be the
choice, because they will generate the higher contribution margin and
EXERCISE 6-17
(a)
Unit Cost
Direct materials
$ 7.50
Direct labor
3.45
Variable manufacturing overhead
5.80
Manufacturing cost per unit
$16.75
Auto-Yams
X
=
Traditional Yams
Auto-Yams
X
X
1.60
=
=
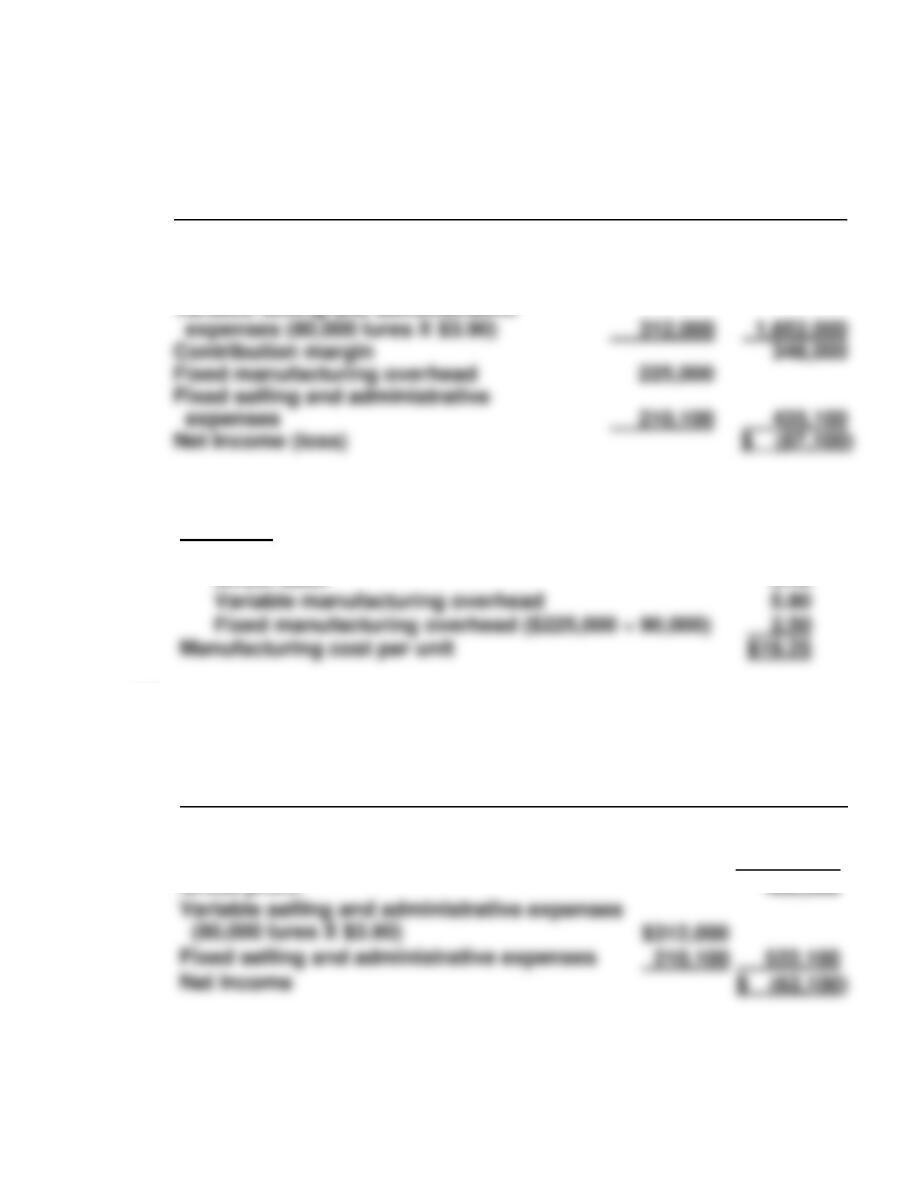
EXERCISE 6-17 (Continued)
(b)
SIREN COMPANY
Income Statement
For the Year Ended December 31, 2017
Variable Costing
Sales (80,000 lures X $25)
$2,000,000
Variable cost of goods sold
(80,000 lures X $16.75)
$1,340,000
(c)
Unit Cost
Direct materials
$ 7.50
Direct labor
3.45
Variable manufacturing overhead
Fixed manufacturing overhead ($225,000 ÷ 90,000)
2.50
Manufacturing cost per unit
(d)
SIREN COMPANY
Income Statement
For the Year Ended December 31, 2017
Absorption Costing
Sales (80,000 lures X $25)
$2,000,000
Cost of goods sold (80,000 lures X $19.25)
1,540,000
Gross profit
Fixed selling and administrative expenses
522,100
Net Income
$ (62,100)
Variable selling and administrative
expenses (80,000 lures X $3.90)
312,000
Contribution margin
Fixed manufacturing overhead
Fixed selling and administrative
expenses
435,100
Net Income (loss)
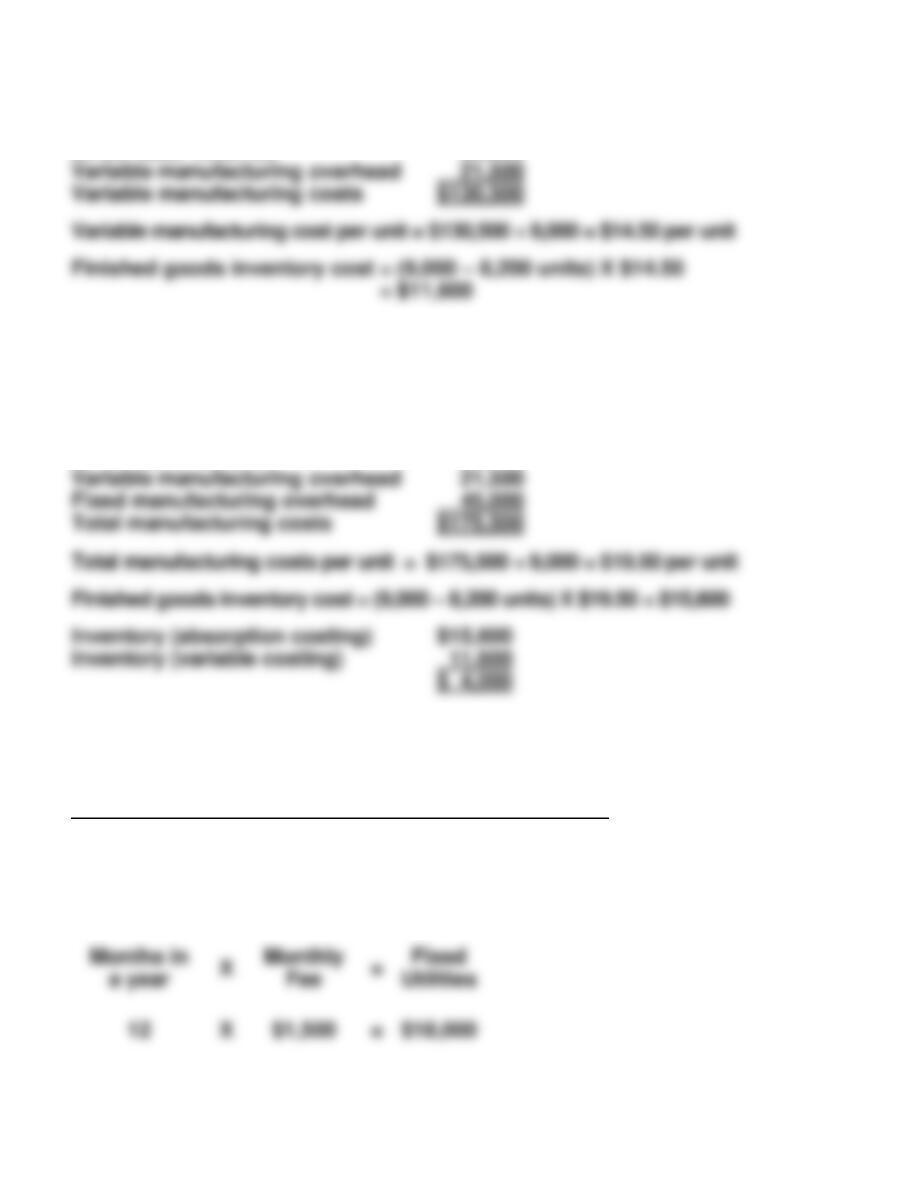
*EXERCISE 6-18
(a) Direct materials used $ 79,000
Direct labor incurred 30,000
(b) Absorption costing would show a higher net income because a portion
of the fixed costs are deferred to future periods. The following computa–
tion indicates that finished goods inventory will be $4,000 higher under
absorption costing which will cause its net income to be $4,000 higher.
Direct materials used $ 79,000
Direct labor incurred 30,000
*EXERCISE 6-19
(a)
Utility Expense
Months in
a year
X
Kilowatt
hours
X
Hourly
Charge
=
Variable
Utilities
12
X
500
X
$0.50
=
$3,000
*EXERCISE 6-19 (Continued)
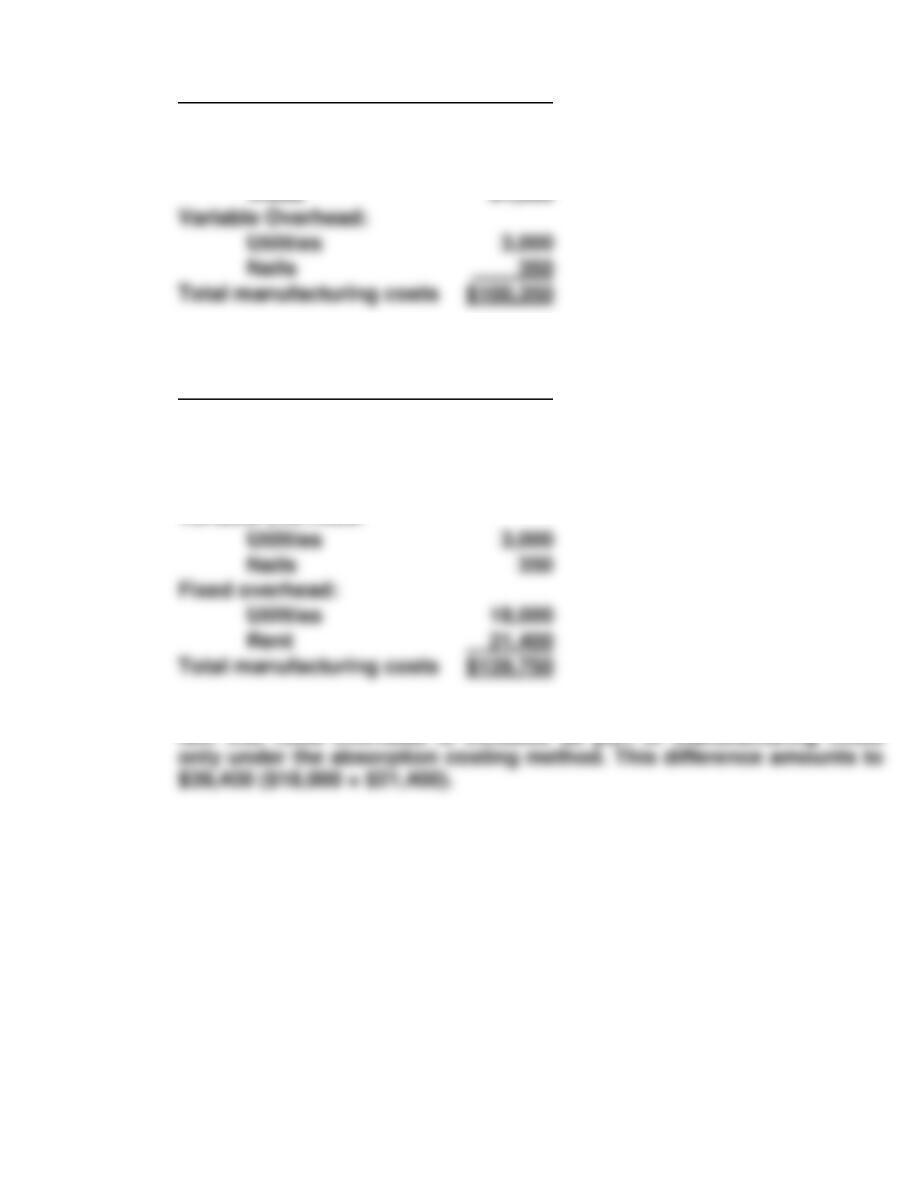
Variable Costing
Labor:
Crate builders
$43,000
Material:
(b)
Absorption Costing
Labor:
Crate builders
$ 43,000
Material:
Wood
54,000
Variable overhead:
Utilities
Nails
Fixed overhead:
Rent
Total manufacturing costs
(c) The entire difference in costs between the two methods is due to the
fact that fixed overhead is included as part of manufacturing costs
Wood
Variable Overhead:
Nails
Total manufacturing costs
SOLUTIONS TO PROBLEMS
PROBLEM 6-1A
(a) Sales were $2,000,000 and variable expenses were $1,200,000, which
means contribution margin was $800,000 and CM ratio was .40. Fixed ex-
(b) 1. The effect of this alternative is to increase the selling price per unit
to $31.25 ($25 X 125%). Total sales become $2,500,000 (80,000 X
$31.25). Thus, contribution margin ratio changes to 52%
2. The effects of this alternative are: (1) fixed costs decrease by
$160,000, (2) variable costs increase by $100,000 ($2,000,000 X 5%),
(3) total fixed costs become $875,000 ($1,035,000 – $160,000), and
3. The effects of this alternative are: (1) variable and fixed cost of
goods sold become $784,000 each, (2) total variable costs become
PROBLEM 6-2A
(a)
(1)
Current Year
Sales
Variable costs
Direct materials
Direct labor
$1,500,000
511,000
290,000
Current Year
Projected Year
Contribution margin
Sales
Variable costs
Direct materials
$1,500,000
511,000
X 1.1
X 1.1
$1,650,000
562,100
(2)
Fixed Costs
Current Year
Projected year
Total fixed costs
Manufacturing overhead ($350,000 X .30)
$105,000
$105,000
Contribution margin
PROBLEM 6-2A (Continued)
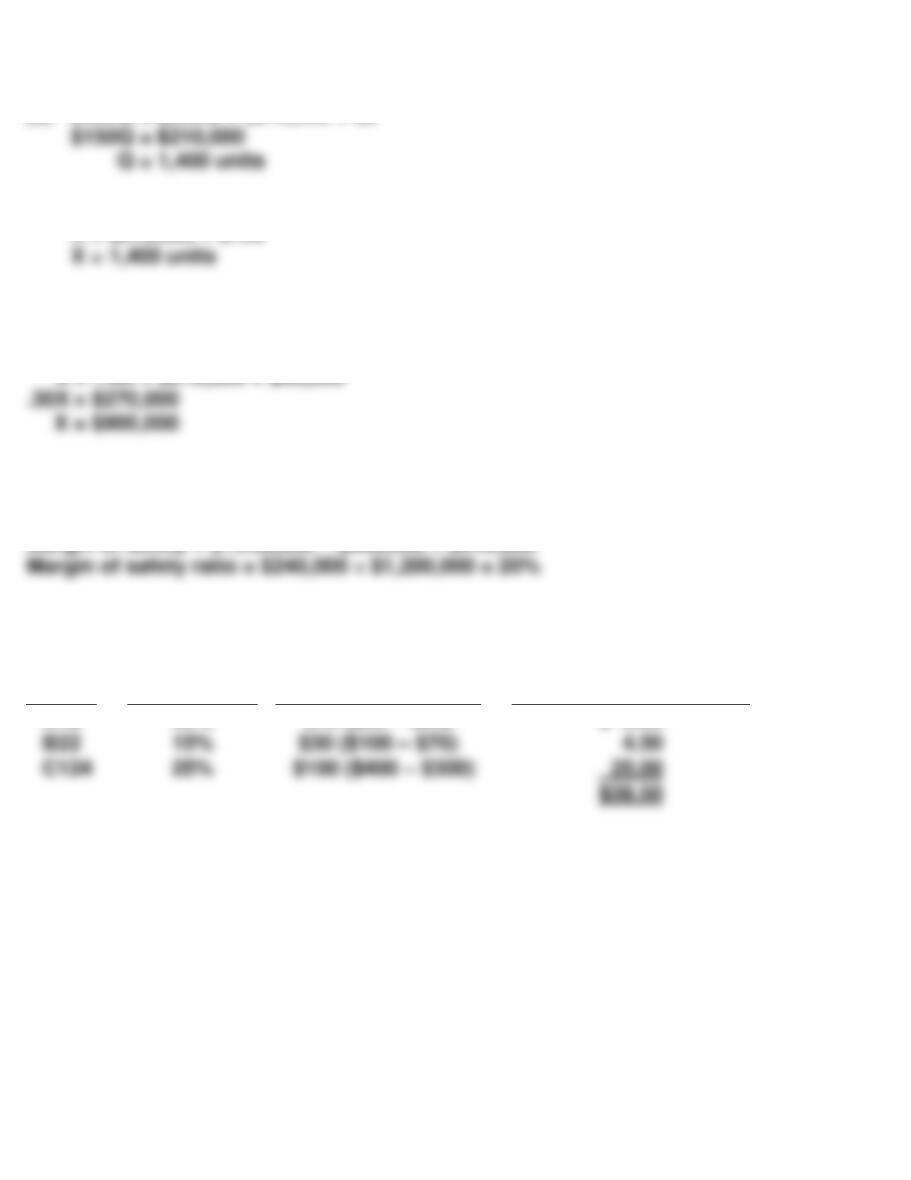
(b) Unit selling price = $1,500,000 ÷ 100,000 = $15
Break-even point in units
=
Fixed costs
÷
Unit contribution margin
=
÷
Break-even point in dollars
=
Fixed costs
÷
Contribution margin ratio
=
÷
(c) Sales dollars
required for
=
(Fixed costs
+
Target net income)
÷
Contribution margin ratio
target net income
=
+
÷
ratio
=
÷
(e)
(1)
Current Year
Sales
Variable costs
Direct materials
Direct labor ($290,000 – $104,000)
$1,500,000
511,000
186,000
PROBLEM 6-2A (Continued)
Fixed cost
Manufacturing overhead ($350,000 X .70)
Selling expenses ($250,000 X .10)
$245,000
25,000
(3) Break-even point in dollars = $486,000 ÷ .28 = $1,735,714 (rounded)
The break-even point in dollars declined from $2,355,000 to $1,735,714.
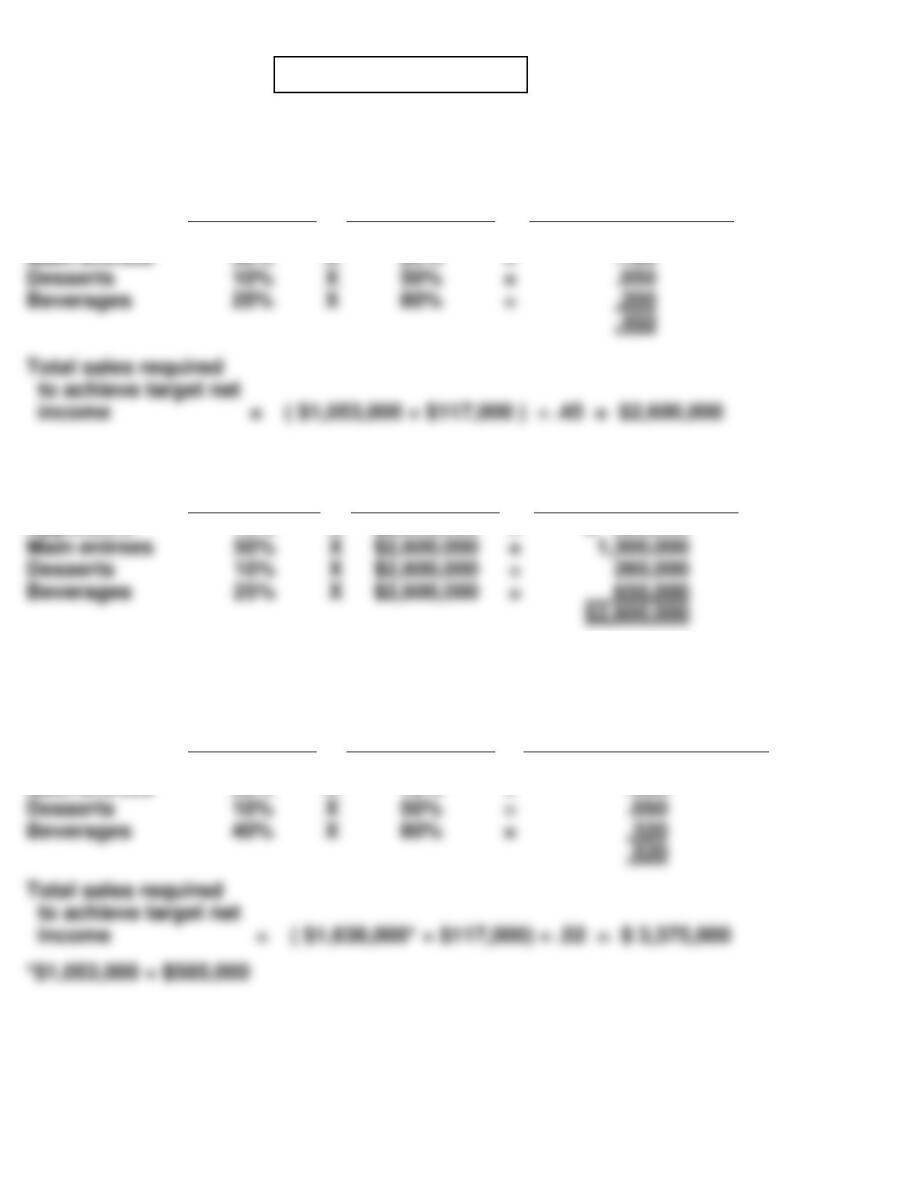
PROBLEM 6-3A
(a)
Sales Mix
Percentage
X
Contribution
Margin Ratio
=
Weighted-Average
Contribution
Margin Ratio
Appetizers
15%
X
50%
=
.075
Sales Mix
Percentage
X
Total Sales
Needed
=
Sales from
Each Product
Main entrees
Desserts
Beverages
X
X
X
=
=
=
Appetizers
15%
X
$2,600,000
=
$ 390,000
(b)
Sales Mix
Percentage
X
Contribution
Margin Ratio
=
Weighted-Average
Contribution
Margin Ratio
Desserts
Beverages
X
X
=
=
Appetizers
Main entrees
25%
25%
X
X
50%
10%
=
=
.125
.025
Main entrees
Desserts
Beverages
50%
X
X
X
25%
=
=
=
PROBLEM 6-3A (Continued)
Thus, sales would have to increase by $775,000 ($3,375,000 – $2,600,000) to
achieve the target net income. This increase in sales is driven by the
increase in fixed costs. The sales of each product line would be:
Sales Mix
Percentage
X
Total Sales
Needed
=
Sales from
Each Product
Appetizers
25%
X
$3,375,000
=
$ 843,750
(c)
Sales Mix
Percentage
X
Contribution
Margin Ratio
=
Weighted-Average
Contribution
Margin Ratio
Desserts
Beverages
X
X
=
=
Appetizers
15%
X
50%
=
.075
The weighted-average contribution margin ratio computed in part (a) was
45%. With the contribution margin ratio on entrees falling to 10%, that
Total sales required
to achieve target net
income = ($1,638,000 + $117,000) ÷ .375 = $ 4,680,000
Sales Mix
Percentage
X
Total Sales
Needed
=
Sales from
Each Product
Beverages
X
=
Appetizers
15%
X
$4,680,000
=
$ 702,000
Relative to parts (a) and (b), the total required sales for (c) would increase.
It appears that the least risky approach would be for Paul to switch to the
new sales mix, but not to incur the additional fixed costs of expanding
Desserts
Beverages
X
X
=
=
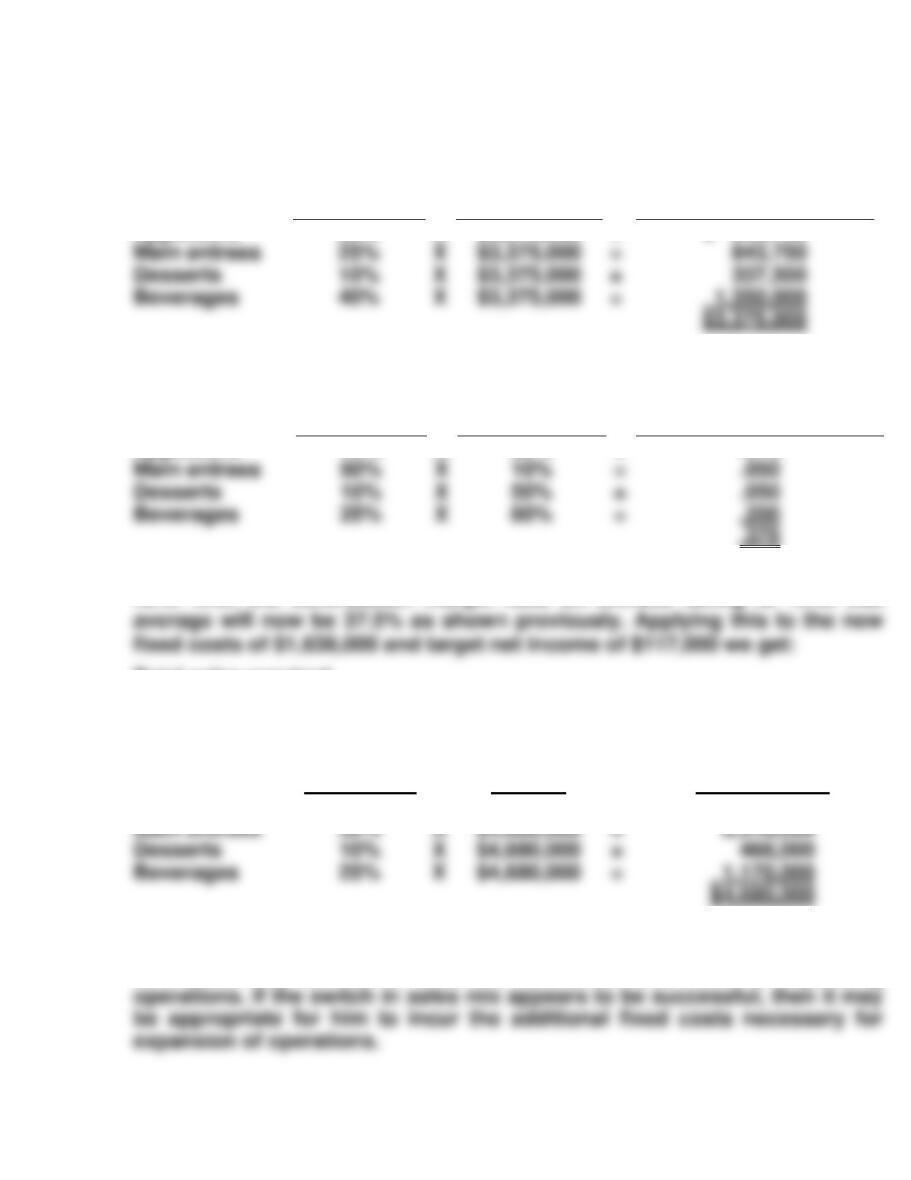
PROBLEM 6-4A
(a)
Product
Economy
Standard
Deluxe
Selling price
$30
$50
$100
(b)
Product
Economy
Standard
Deluxe
Unit contribution margin (a)
$14
$ 30
$ 54
(c) If additional machine hours become available, the additional time should
Less: Variable costs
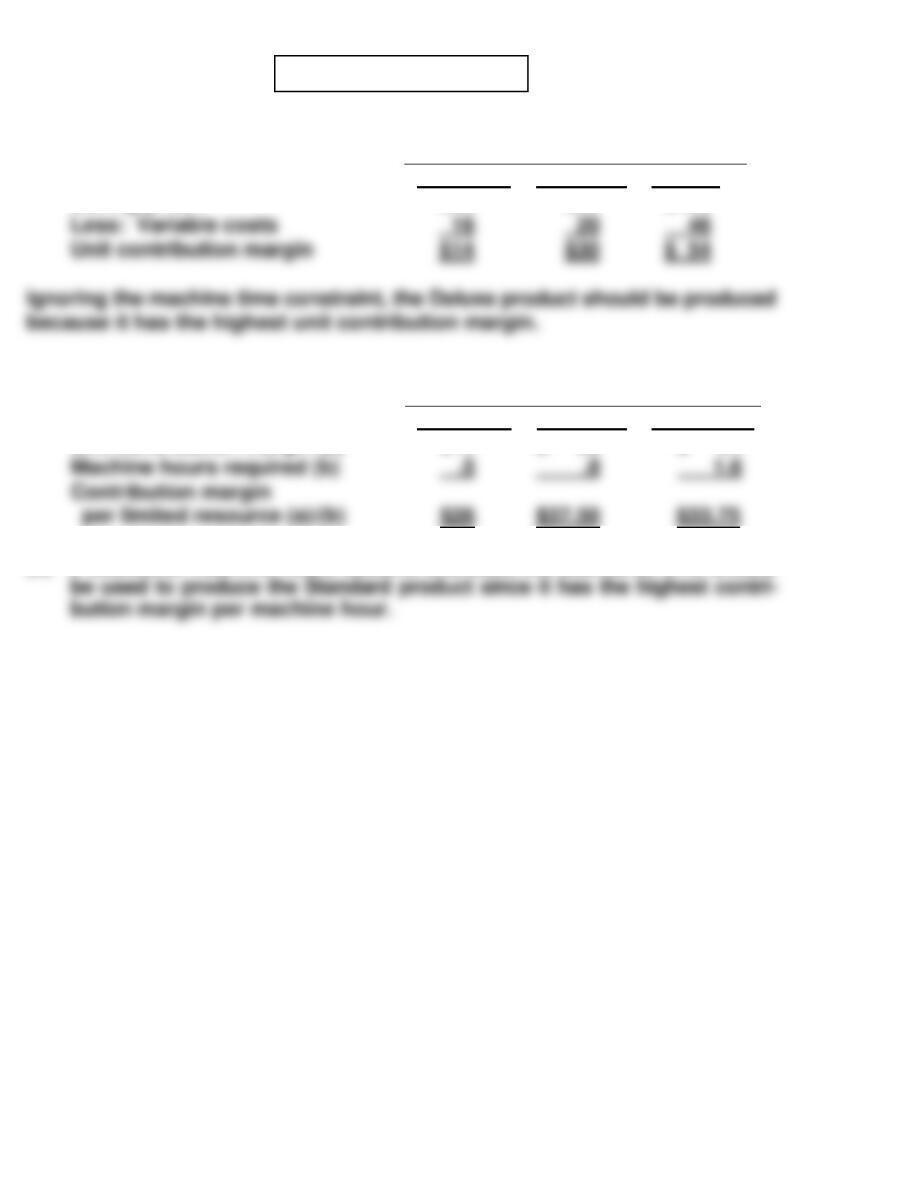
PROBLEM 6-5A
(a) To determine the break-even point in dollars we must first calculate
the contribution margin ratio for each company.
Contribution
Margin
÷
Sales
=
Contribution Margin
Ratio
Blanc Company
$220,000
÷
$500,000
=
.44
(Actual Sales
–
Break-even Sales)
÷
Actual Sales
=
Margin of Safety
Ratio
Noir Company
–
÷
=
(b)
Contribution
Margin
÷
Net
Income
=
Degree of Operating
Leverage
Noir Company
÷
Blanc Company
$220,000
÷
$50,000
=
4.4
(c)
Blanc Company Noir Company
Sales $600,000* $600,000
Variable costs 336,000** 216,000***
$320,000
Costs
$270,000
PROBLEM 6-5A (Continued)
(d)
Blanc Company Noir Company
Sales $400,000* $400,000
Variable costs 224,000** 144,000***
Contribution margin 176,000 256,000
(e) In part (b) the degree of operating leverage of Noir Company was
higher than that of Blanc Company, telling us that the net income of
Noir Company was more sensitive to changes in sales than that of
Blanc Company. In part (c) we see that a 20% increase in sales
increased the net income of Noir Company by $64,000 ($114,000 –
PROBLEM 6-6A
(a) Reformat the income statement to CVP format.
All amount are in $000s.
Sales ………………………………………………… $75,000
Variable costs ($31,500 + $13,500) ………. 45,000
(b) If a hired workforce replaces sales agents, commissions will be reduced
to 8% of sales, or $6,000; but fixed costs will increase by $7,500.
Sales ………………………………………………… $75,000
Variable costs ($31,500 + $6,000) ………… 37,500
(c) Operating leverage = contribution margin ÷ operating income
(1) Current situation: from part (a)
$30,000 ÷ $11,130 = 2.70
PROBLEM 6-6A (Continued)
The calculations indicate that at a sales level of $75 million, a percentage
change in sales and contribution margin will result in 2.70 times that
percentage change in operating income if Bonita continues to use sales
(d) The sales level at which operating incomes will be identical is called
the point of indifference. This would be when the cost of the network of
agents (18% of sales) is exactly equal to the cost of paying employees
8% commission along with additional fixed costs of $7.5 million. None
of the other costs is relevant, because they will not change between
alternatives.
*PROBLEM 6-7A
(a) JACKSON COMPANY
Income Statement
For the Year Ended December 31, 2016
Variable Costing
Sales (3,500 tons X $2,000) …………………….
Variable cost of goods sold
Inventory, January 1 ……………………….
Variable cost of goods manufactured
[4,000 tons X ($2,000 X .15)] …………
$ –0–
1,200,000
$7,000,000
*PROBLEM 6-7A (Continued)
JACKSON COMPANY
Income Statement
For the Year Ended December 31, 2017
Variable Costing
Sales (4,000 tons X $2,000) ………………………
Variable cost of goods sold
Inventory, January 1 …………………………
Variable cost of goods manufactured
[3,500 tons X ($2,000 X .15)] …………..
$ 150,000
1,050,000
$8,000,000
(b) JACKSON COMPANY
Income Statement
For the Year Ended December 31, 2016
Absorption Costing
Sales (3,500 tons X $2,000) ………………….
Cost of goods sold
Inventory, January 1 …………………….
Cost of goods manufactured …………
$ –0–
4,000,000
(1)
$7,000,000
Variable cost of goods available
*PROBLEM 6-7A (Continued)
JACKSON COMPANY
Income Statement
For the Year Ended December 31, 2017
Absorption Costing
Sales (4,000 tons X $2,000) ………………
Cost of goods sold
Inventory, January 1 …………………
Cost of goods manufactured………
Cost of goods available for sale …
$ 500,000
3,850,000
4,350,000
(1)
$8,000,000
(c) The variable costing and the absorption costing net income can be
reconciled as follows:
2016
2017
Absorption costing net income
Variable costing net income
Fixed manufacturing overhead
expensed with variable costing
$2,800,000
$1,950,000
$2,800,000
$2,700,000
(1)In 2016, with absorption costing $2,450,000
3,500 units sold
$2,800,000 X 4,000 units produced
of the
fixed manufacturing overhead is expensed as part of cost of goods sold, and $350,000
$2,800,000 X 4,000 units produced

*PROBLEM 6-7A (Continued)
(d) Income parallels sales under variable costing as seen in the increase
*PROBLEM 6-8A
(a)
DILITHIUM BATTERIES DIVISION
Income Statement
For the Year Ended December 31, 2017
Absorption Costing
_______________________________________________________________
60,000 90,000
Produced Produced
Sales (60,000 units X $30) $1,800,000 $1,800,000
Cost of goods sold
(60,000 units X $21) 1,260,000 (60,000 X $18) 1,080,000
Gross profit 540,000 720,000
(b)
DILITHIUM BATTERIES DIVISION
Income Statement
For the Year Ended December 31, 2017
Variable Costing
_______________________________________________________________
60,000 90,000
Produced Produced
Sales (60,000 units X $30) $1,800,000 $1,800,000
Variable cost of goods sold
(60,000 units X $12) 720,000 720,000
*PROBLEM 6-8A (Continued)
(c) If the company produces 90,000 units, but only sells 60,000 units,
then 30,000 units will remain in ending inventory. Under absorption
costing these 30,000 units will each include $6 of fixed manufacturing
overhead—a total of $180,000. However, under variable costing, fixed
(d) Variable costing has a number of advantages over absorption costing
for decision making and evaluation purposes. (1) The use of variable
costing is consistent with cost-volume-profit and incremental analysis.
(2) Net income computed under variable costing is unaffected by
changes in production levels. Note that, under variable costing the
company’s net income is $370,000 no matter what the level of production
CD 6 CURRENT DESIGNS
(a)
Weighted
Average Unit
Contribution
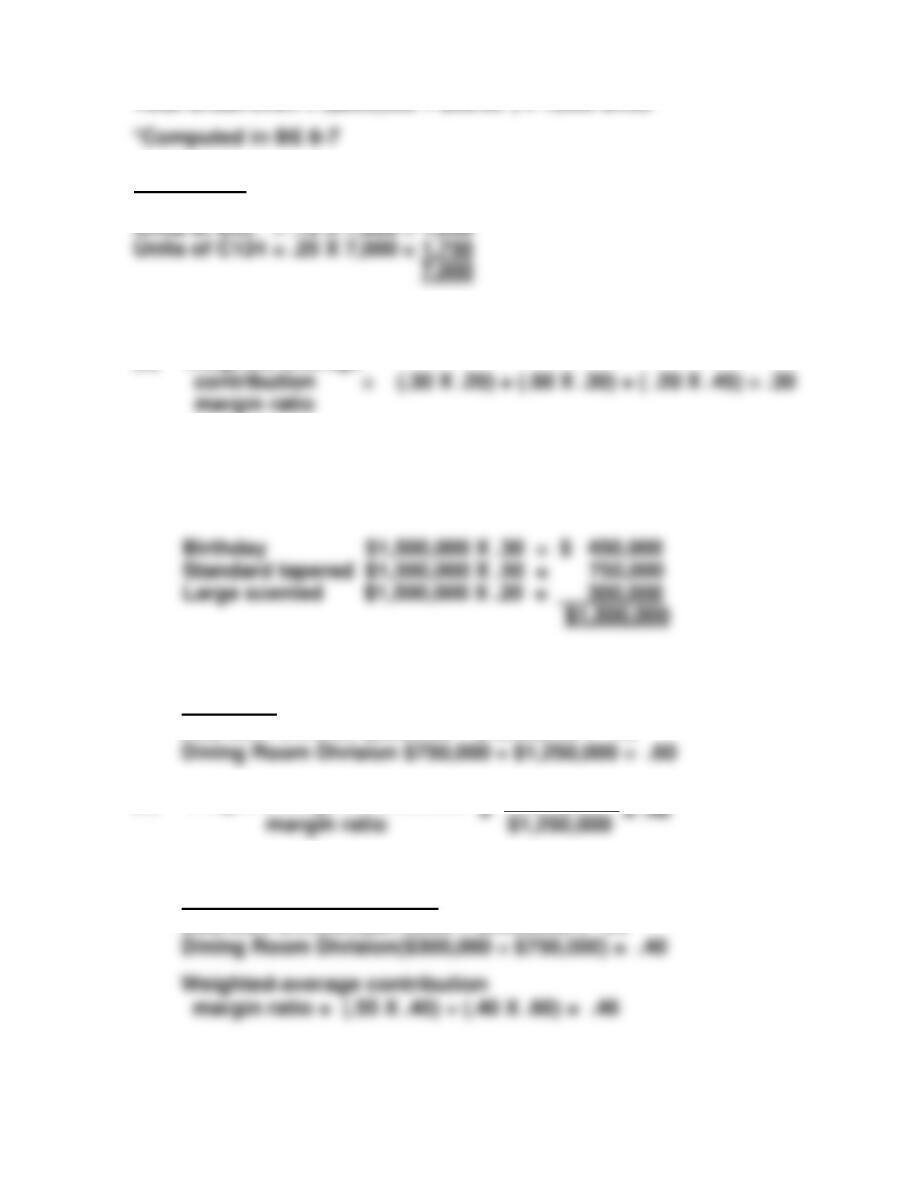
(b) Break-even Sales = $820,000 ÷ $436 = 1,881 units
(c) Target Net Income in Units:
Rotomolded Kayaks
+
Composite Kayaks
=
Weighted-Average
CM/Unit
($380 X .70)
($660 X .30)
$464
(d) CVP Income Statement
Rotomolded
Composite
Sales
$2,000,000
$1,000,000
Variable Costs
Contribution Margin
Fixed Costs
660,000
Net Income
Rotomolded Kayaks
(e) Degree of Operating Leverage
Rotomolded Kayaks = $800,000 ÷ $140,000 = 5.71
Composite Kayaks = $330,000 ÷ $170,000 = 1.94
BYP 6-1 DECISION-MAKING ACROSS THE ORGANIZATION
(a) Sales (10,000 seats X $500) $5,000,000
Variable costs (10,000 seats X $200) 2,000,000
(b) Contribution margin ratio = $3,000,000 ÷ $5,000,000 = .60
(c) Sales (10,000 seats X $500) $5,000,000
(d) Contribution margin ratio = $4,000,000 ÷ $5,000,000 = .80
(e) By automating its manufacturing process the company will replace some
of its variable costs with fixed costs. This shift toward more fixed costs
will increase its break-even point from $3,333,333 to $3,750,000 and
reduce its margin of safety from 33.3% to 25%. This means that under
BYP 6-2 MANAGERIAL ANALYSIS
(a) The contribution margin ratios under each approach are:
(b) The break-even points in sales dollars under each approach are:
(c) At the current level of sales, the margin of safety ratio under each
approach is:
Current approach ($2,000,000 – $1,520,000)/$2,000,000 = .24
(d) The degree of operating leverage under each approach at the current
level of sales is:
BYP 6-2 (Continued)
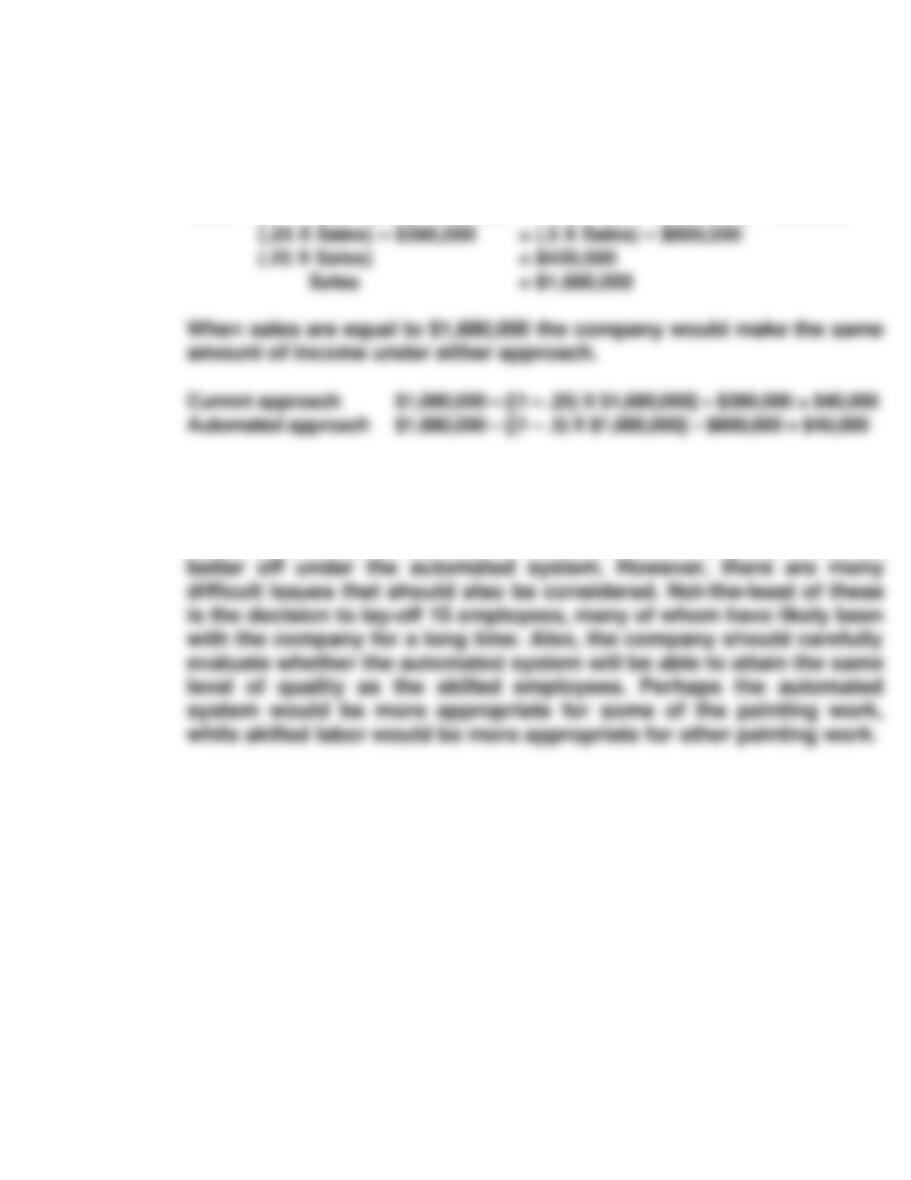
(e) In order to solve for the sales level where net income would be equal
under either approach, set the two CVP equations equal to each other
and solve for sales:
Sales – ((1 – .75) X Sales) – $380,000 = Sales – ((1 – .5) X Sales) – $800,000
(f) Based upon this numeric analysis it would appear that the decision to
purchase the automated system would be a good decision. The
current level of sales far exceeds the break-even point, and, unless
sales were to fall all the way to $1,680,000, the company would be
BYP 6-3 REAL-WORLD FOCUS
(a)
($ in millions)
Consumer
Products
Pet
Products
Soup and
Infant-Feeding
Products
Sales
Variable costs
$1,031.8
610.0
$ 837.3
350.0
$ 302.0
100.0
(b)
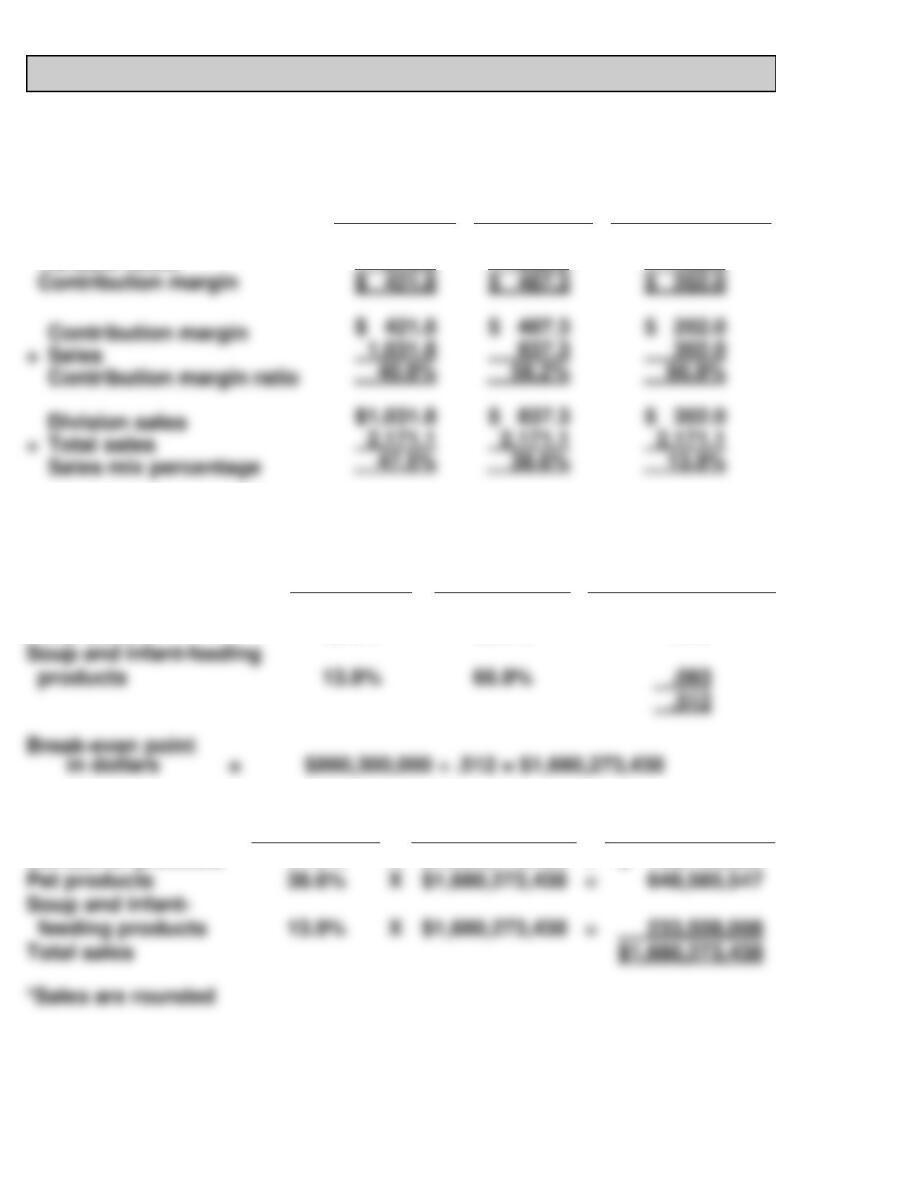
Sales Mix
Percentage
X
Contribution
Margin Ratio
=
Weighted–Average
Contribution
Margin Ratio
13.9%
Consumer products
Pet products
47.5%
38.6%
40.9%
58.2%
.194
.225
Sales Mix
Percentage
X
Total Sales
=
Sales from
Each Product*
Soup and infant-
Total sales
X
$1,680,273,438
=
Consumer products
47.5%
X
$1,680,273,438
=
$ 798,129,883
÷ Total sales
BYP 6-4 REAL-WORLD FOCUS
(a) The four primary product lines are FedEx Express (provides express
transportation); FedEx Ground (small package ground delivery); FedEx
Freight (regional, less-than-truckload freight service); and FedEx
Services (Sales, information technology, communications). The key
(b)
FEDEX GROUND
Income Statement
For the Year Ended May 31, 2013
Variable Costing
(In Millions)
____________________________________________________________
Revenues ……………………………………………… $10,578
Variable costs:
Salaries and employee benefits …………. $1,586
Purchased transportation …………………. 4,191
Fixed costs:
Fixed Costs
÷
Contribution
Margin Ratio
=
Break-even Point
in Dollars
(c)
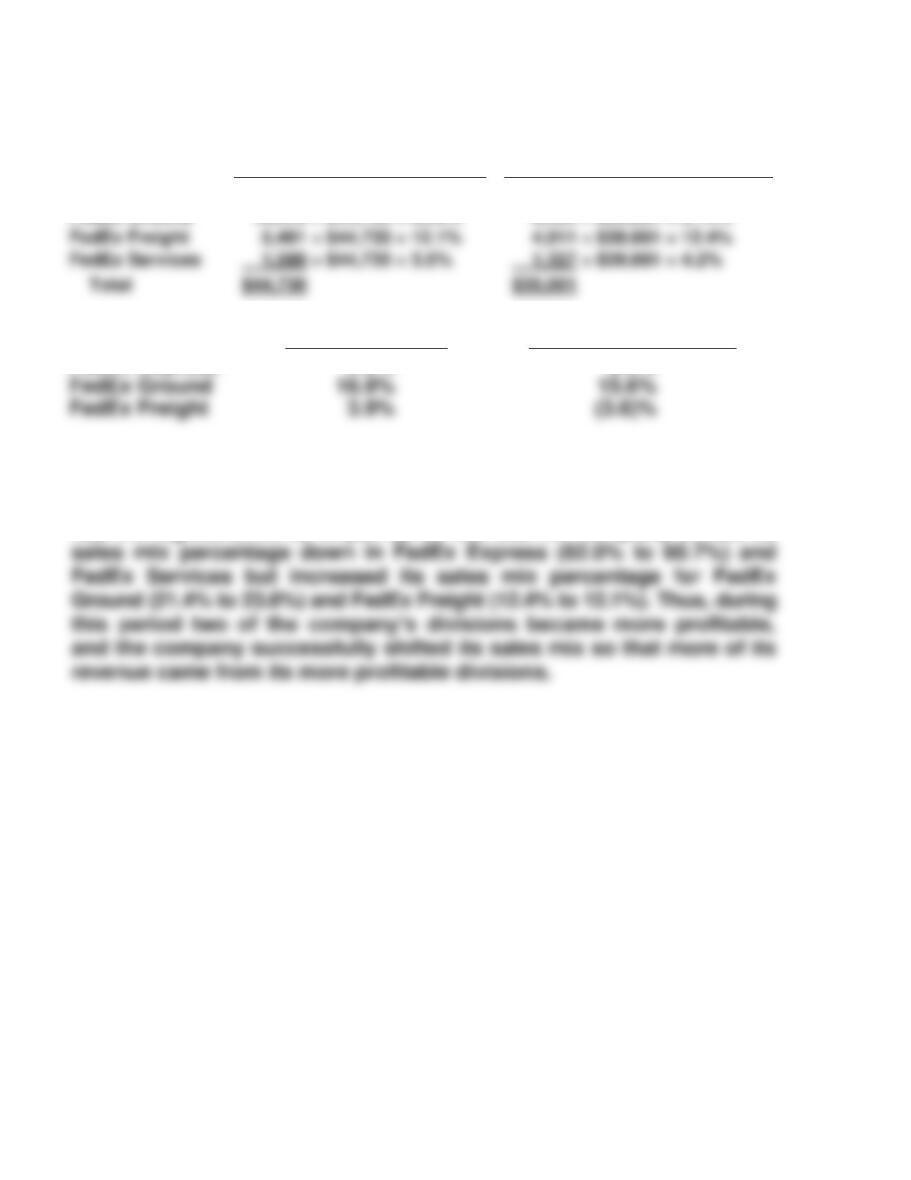
(i)
2013
2011
FedEx Express
FedEx Ground
$27,171 ÷ $44,730 = 60.7%
10,578 ÷ $44,730 = 23.6%
$24,581 ÷ $39,661 = 62.0%
8,485 ÷ $39,661 = 21.4%
(ii)
2013
2011
FedEx Express
2.0%
5.0%
(iii) In part (ii) we see that the FedEx Express’s operating margin declined,
but the other two increased. We also see in part (ii) that FedEx Express
had the lowest operating margin in 2013 (2.0%) while FedEx Ground
had the highest (16.9%). In part (i) we see that the company shifted its
Total
BYP 6-5 REAL-WORLD FOCUS
(a) Smart Balance relies very heavily on outsourcing. It keeps it employees
and investments in fixed assets to a minimum. As a consequence it
has very low fixed costs.
BYP 6-6 COMMUNICATION ACTIVITY
MEMO
To: Bjorn Borg—CEO
From: Student
Re: Best use of limited resources
I share your concern, that, since we are operating at full capacity, we need
to ensure that our product mix maximizes our profitability. The decision of
how to best utilize our limited productive resources is one of the most
important decisions we face. We currently make two different anchors, a
*BYP 6-7 ETHICS CASE
(a) The division’s net income increased by $225,000 ($525,000 – $300,000).
(b) In 2016 the number of units produced and sold were equal. When this
occurs variable costing and absorption costing provide the same
results. Thus, in 2016, net income under variable costing would have
(c) In part (b) it was determined that the division’s net income would have
been $300,000 in 2017 under variable costing. Since this is the same as
2016 net income, Brett would not receive a bonus.
(d) If Brett intentionally overproduced inventory in order to increase his
bonus, then his actions were unethical. Overproduction of inventory
increases the company’s costs related to inventory, such as storage,
BYP 6-8 ALL ABOUT YOU
Target Net Income)
(a) Using a common equation for CVP analysis,
Sales = Variable Costs + Fixed Costs + Net Income, and substituting the
information provided, and knowing that at break-even, net income = $0,
(b) To find the sales required to reach a target net income, contribution
margin must be calculated.
Contribution Margin = Sales – Variable Costs
Using the contribution margin ratio,
Required Sales in Dollars
=
(Fixed Costs +
Target Net Income)
/Contribution Margin
Ratio
(c) Answers will vary. Suggested examples include franchise fees, employee
wages, utilities, supplies, and maintenance.
(d) Answers will vary.
BYP 6-9 CONSIDERING CORPORATE SOCIAL RESPONSIBILITY
Discussion Guide: If reduction of greenhouse gas emissions is a goal, then
one step toward attainment of that goal is to assign a cost to greenhouse–
gas emissions. One approach that is currently being used is the buying and
selling of carbon-emission rights. As companies buy and sell emission rights,
the price of polluting becomes a tangible factor in the formulations that will