d.
$8,000
$6,300
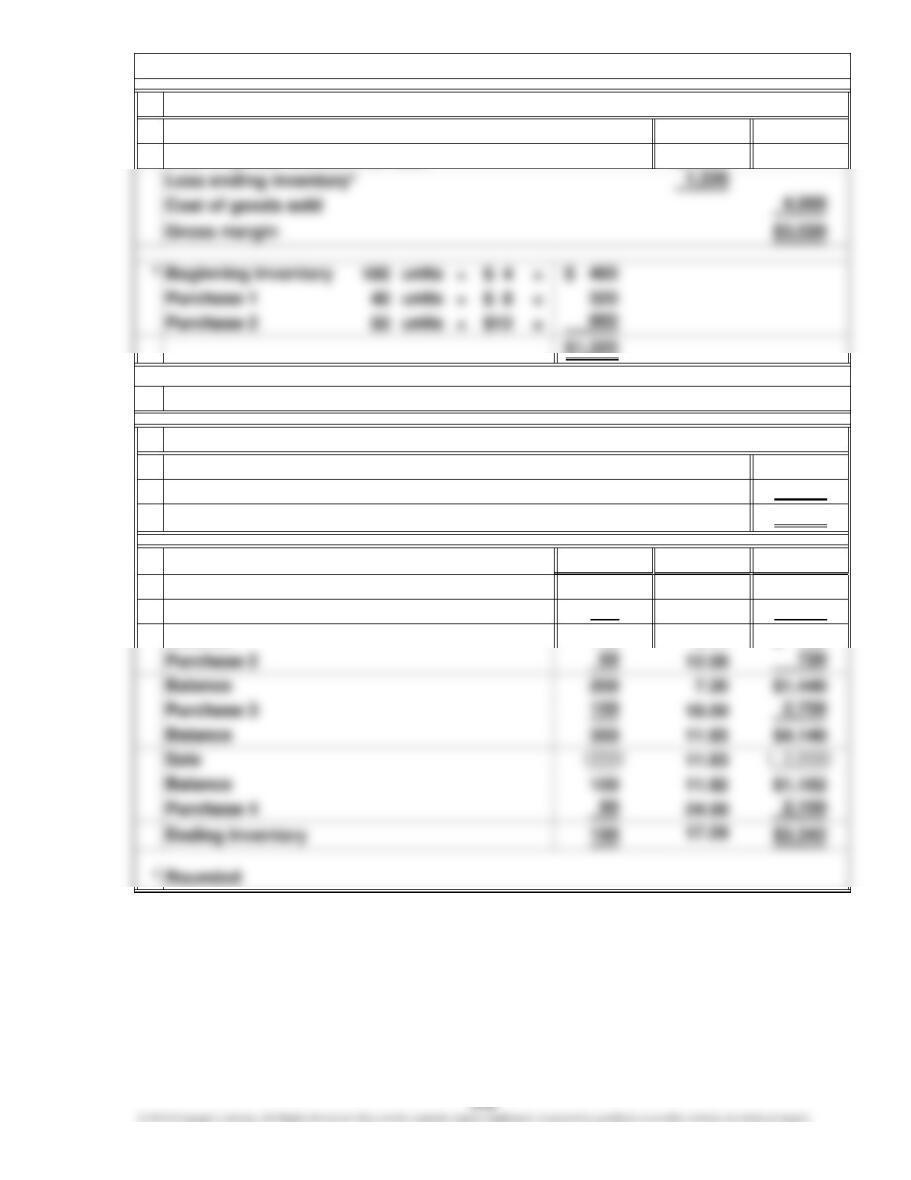
a.
$8,000
2,958
$5,042
Units Cost* Amount*
100 $ 4.00 $ 400
40 8.00 320
140 5.14 $ 720
Cost of goods sold
Gross margin
2.
Perpetual inventory system
Sales
Average-cost method:
Beginning inventory
Purchase 1
Balance
LIFO method:
Sales
Chapter 6, E 12. (Continued)
Cost of goods available for sale
b.
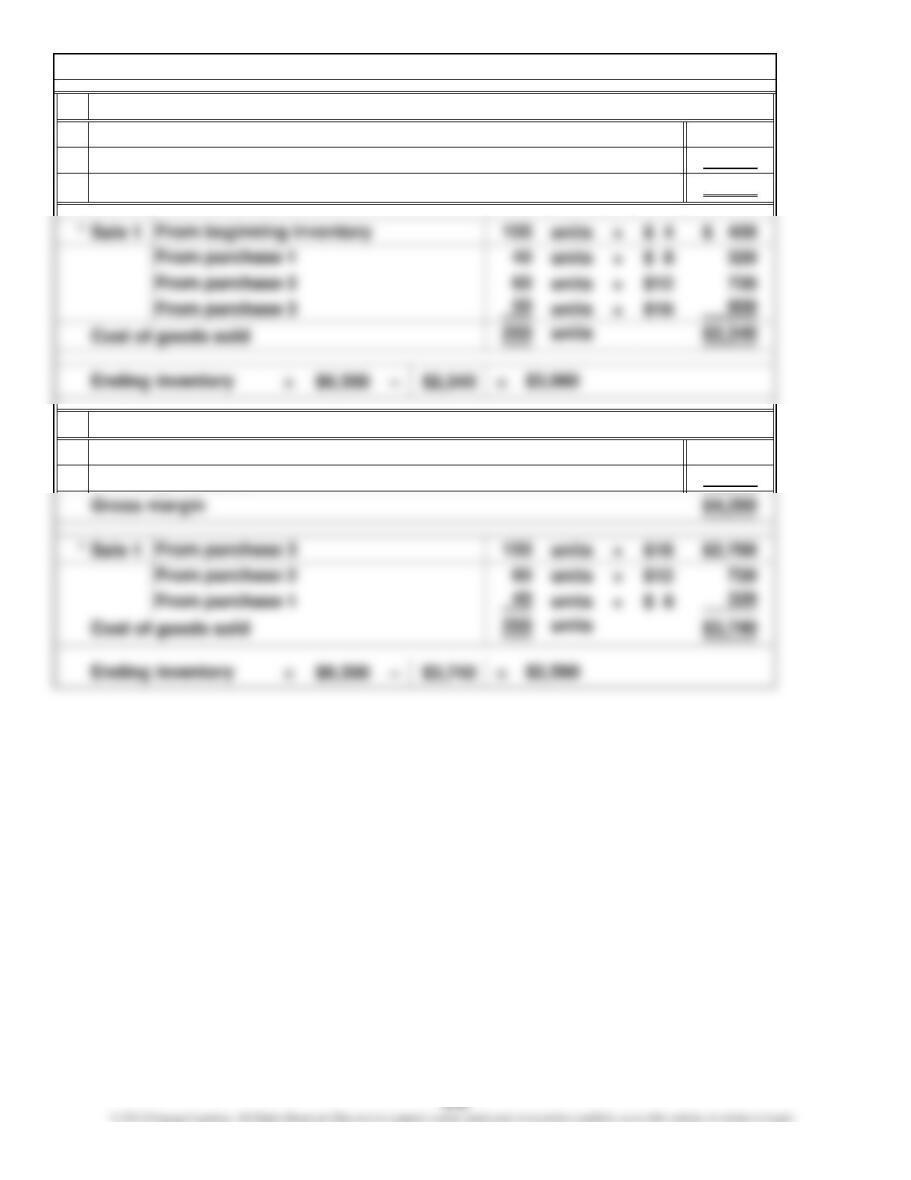
$8,000
2,340
$5,660
c.
$8,000
3,740
Cost of goods sold*
LIFO method:
Cost of goods sold*
Chapter 6, E 12. (Continued)
Sales
Gross margin
FIFO method:
Sales
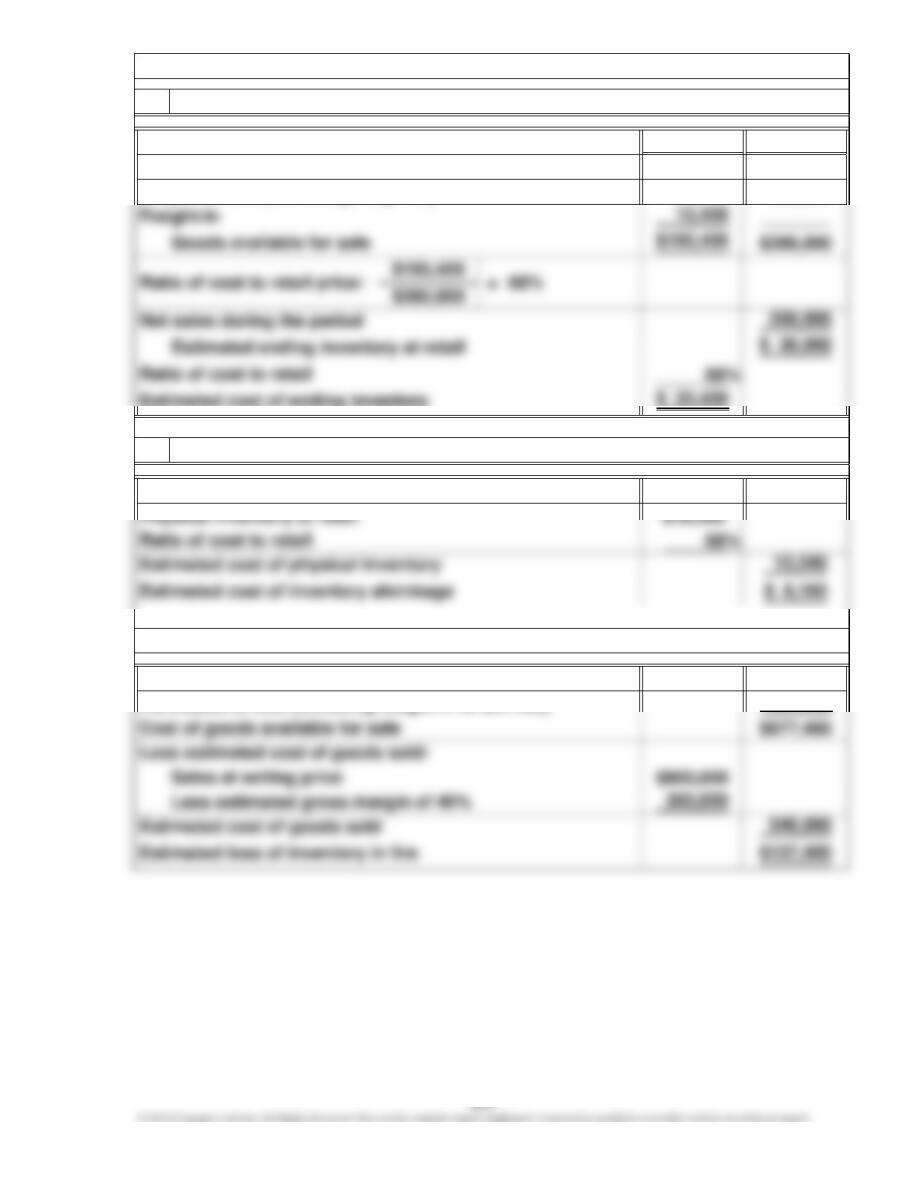
Cost Retail
$ 40,000 $ 60,000
140,000 220,000
$20,400
$ 90,000
587,400
Chapter 6, E 13.
1. Ending inventory estimated by retail method
Beginning inventory at cost
Purchases at cost (including freight-in of $27,400)
Loss estimated
Chapter 6, E 14.
Estimated cost of ending inventory
2.
Beginning inventory
Net purchases (excluding freight-in)
Total
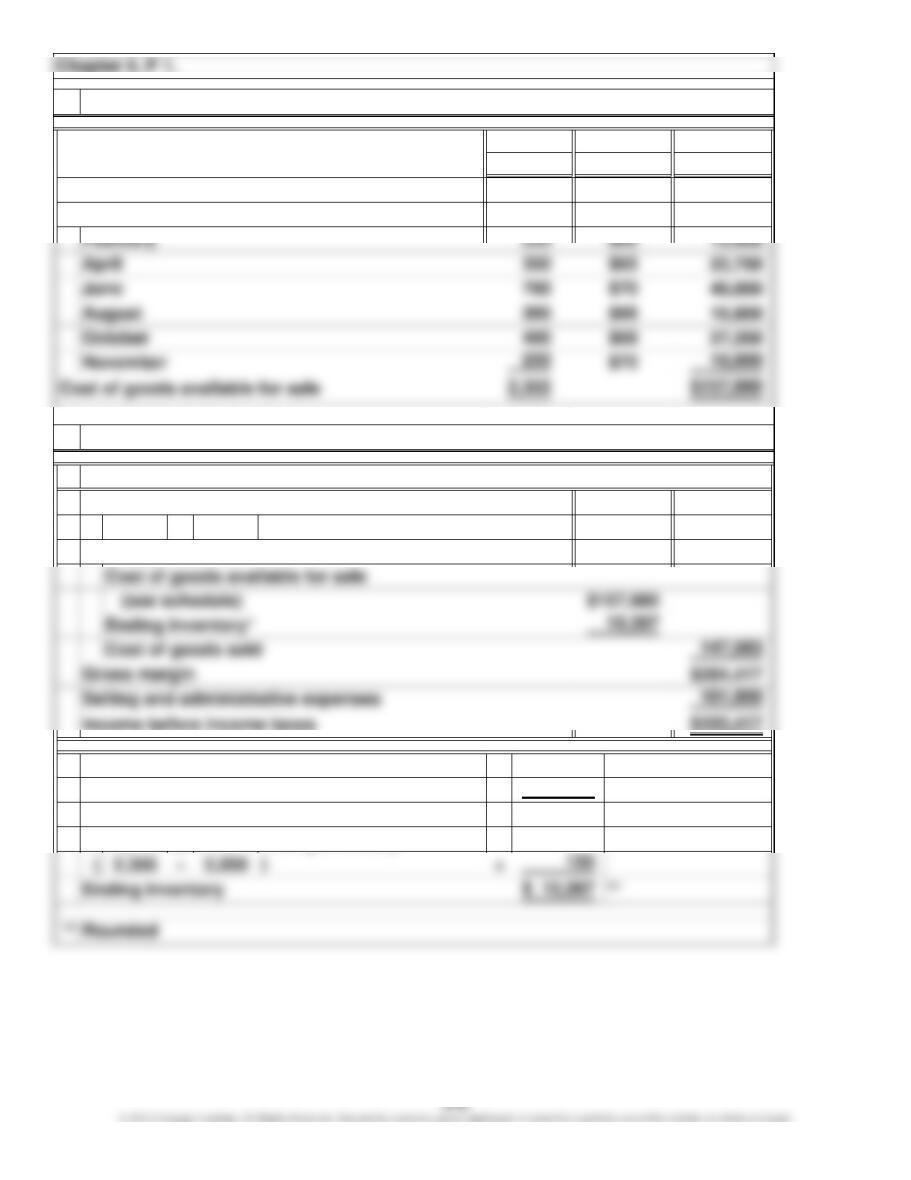
Cost
$ 7,280
a.
( 2,200 × $160 $352,000
*
÷
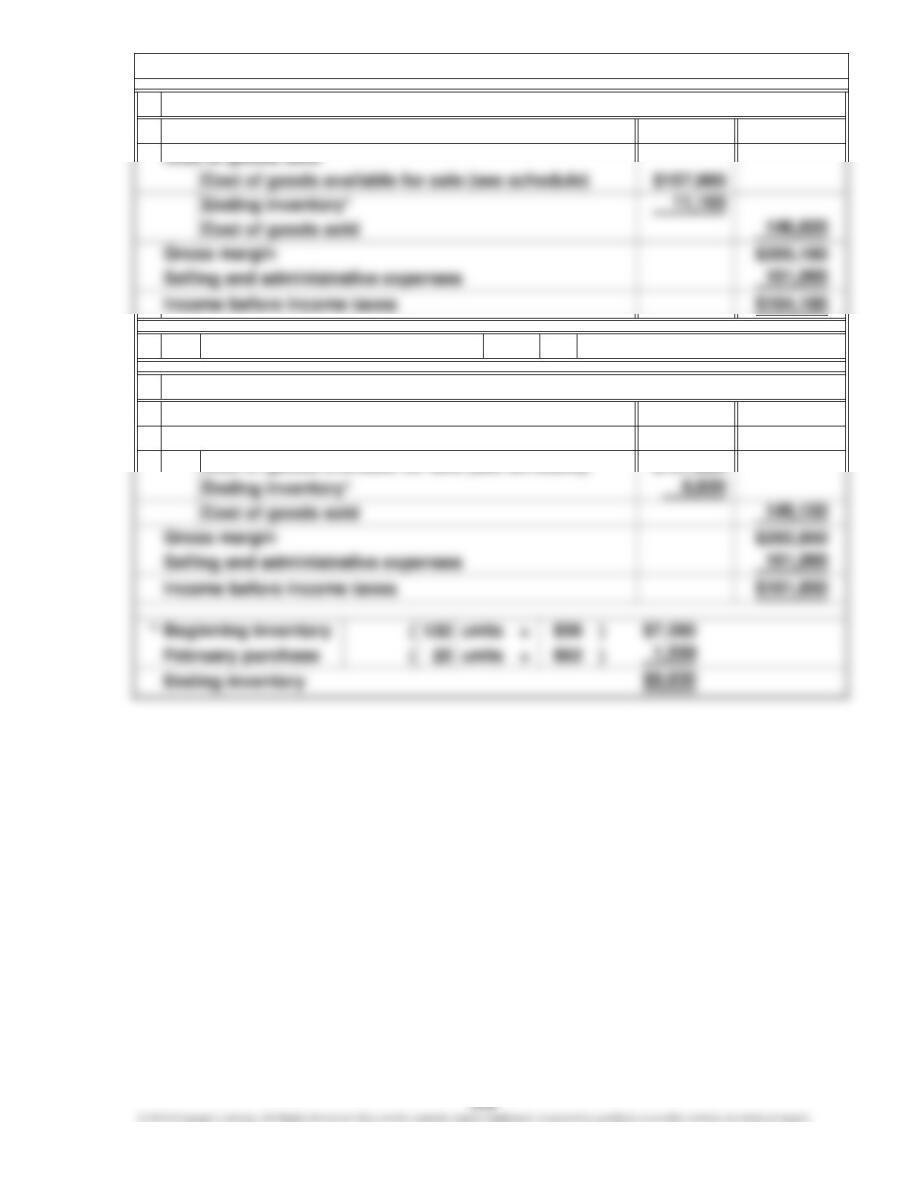
2. Income before income taxes computed
Divided by total units available
$157,980
2,355
Beginning inventory
Cost per unit
1. Schedule of cost of goods available for sale prepared
Purchases
$56
PriceUnits
130
Cost of goods available for sale
Cost of goods sold
Average-cost method:
Sales
)
$ 67.08
**
Multiplied by units in ending inventory
b.
$352,000
* 155 =
c.
$352,000
$157,980
Chapter 6, P 1. (Continued)
FIFO method:
Cost of goods sold
Sales
Cost of goods sold
Cost of goods available for sale (see schedule)
LIFO method:
$72 $11,160units from November purchase ×
Sales
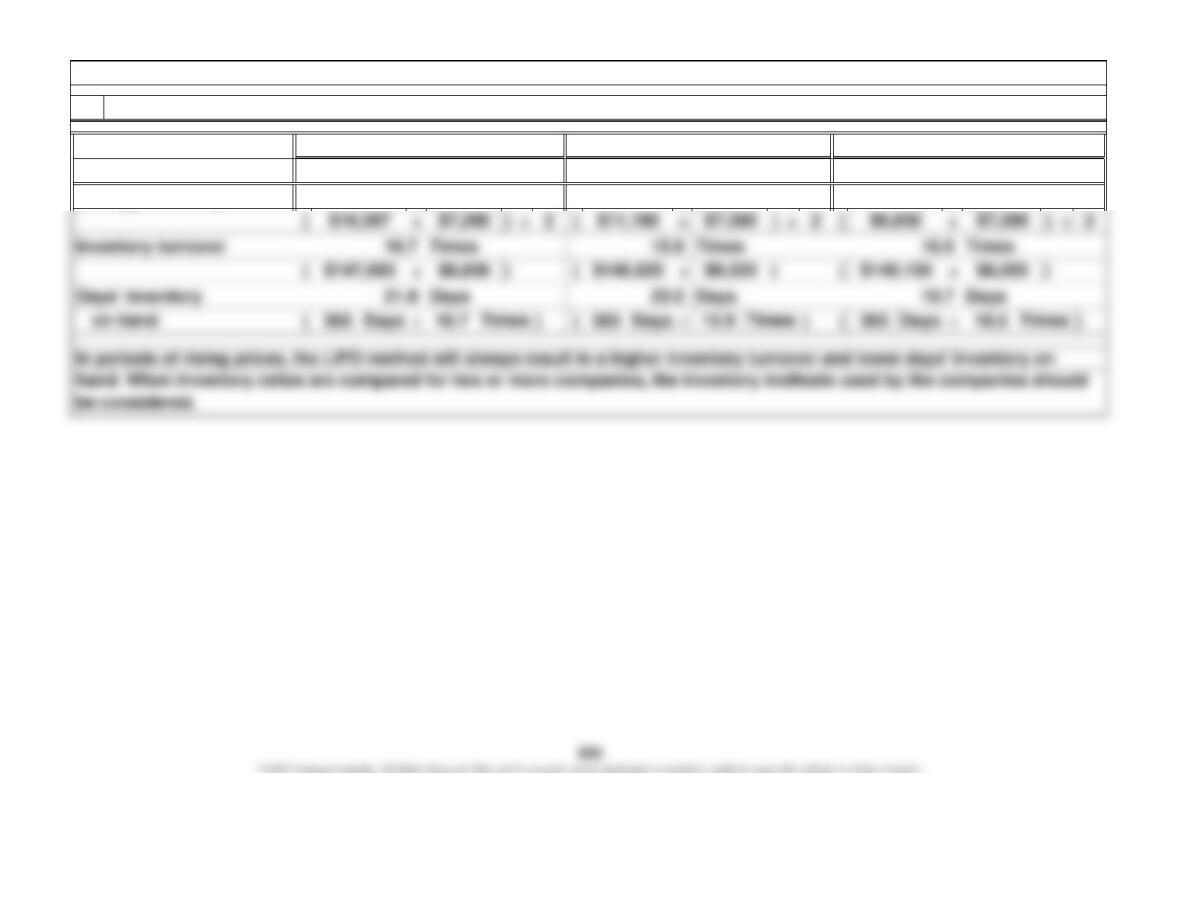
Average-Cost
$9,220
$8,839
$149,150$146,820
$8,055
Cost of goods sold $147,583
Average inventory
LIFO
Chapter 6, P 1. (Continued)
3. User Insight: Financial ratios computed and discussed
FIFO
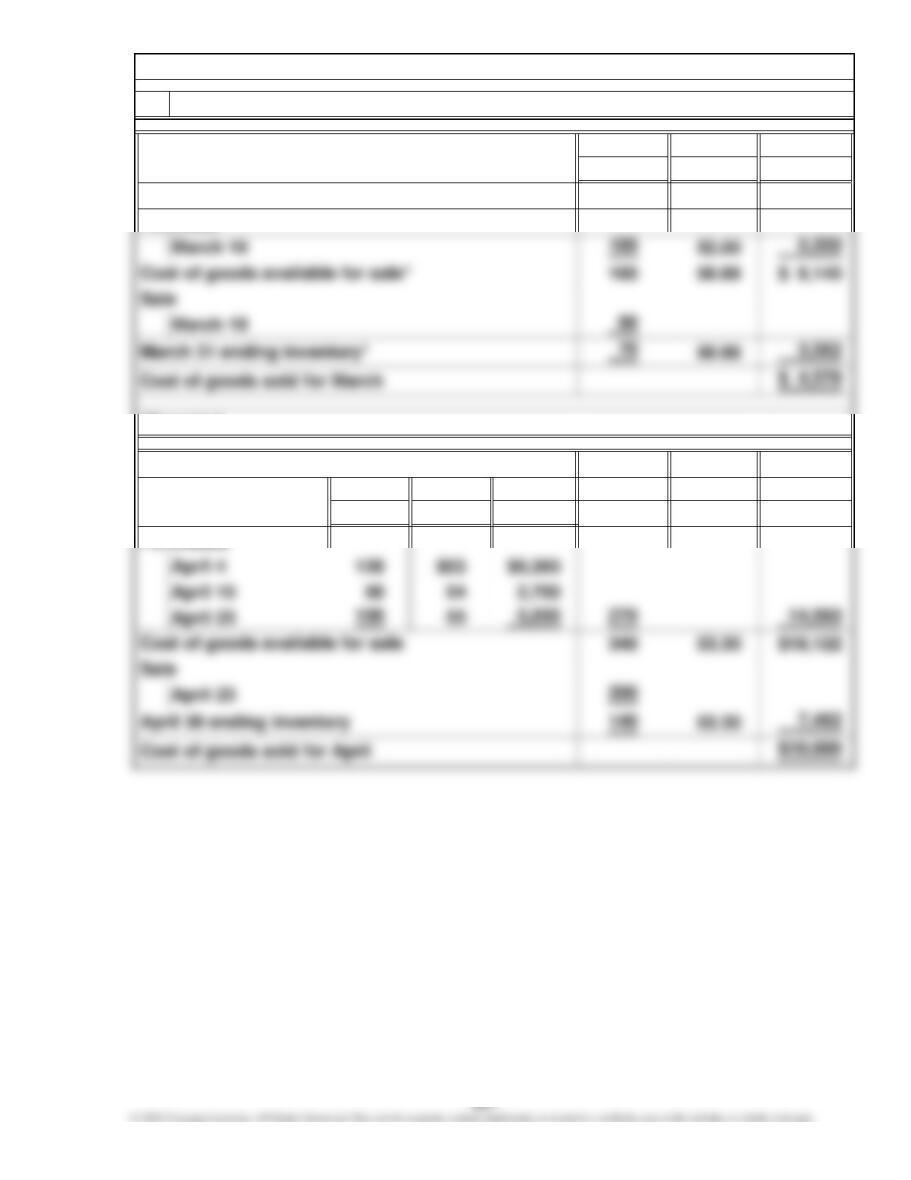
1.
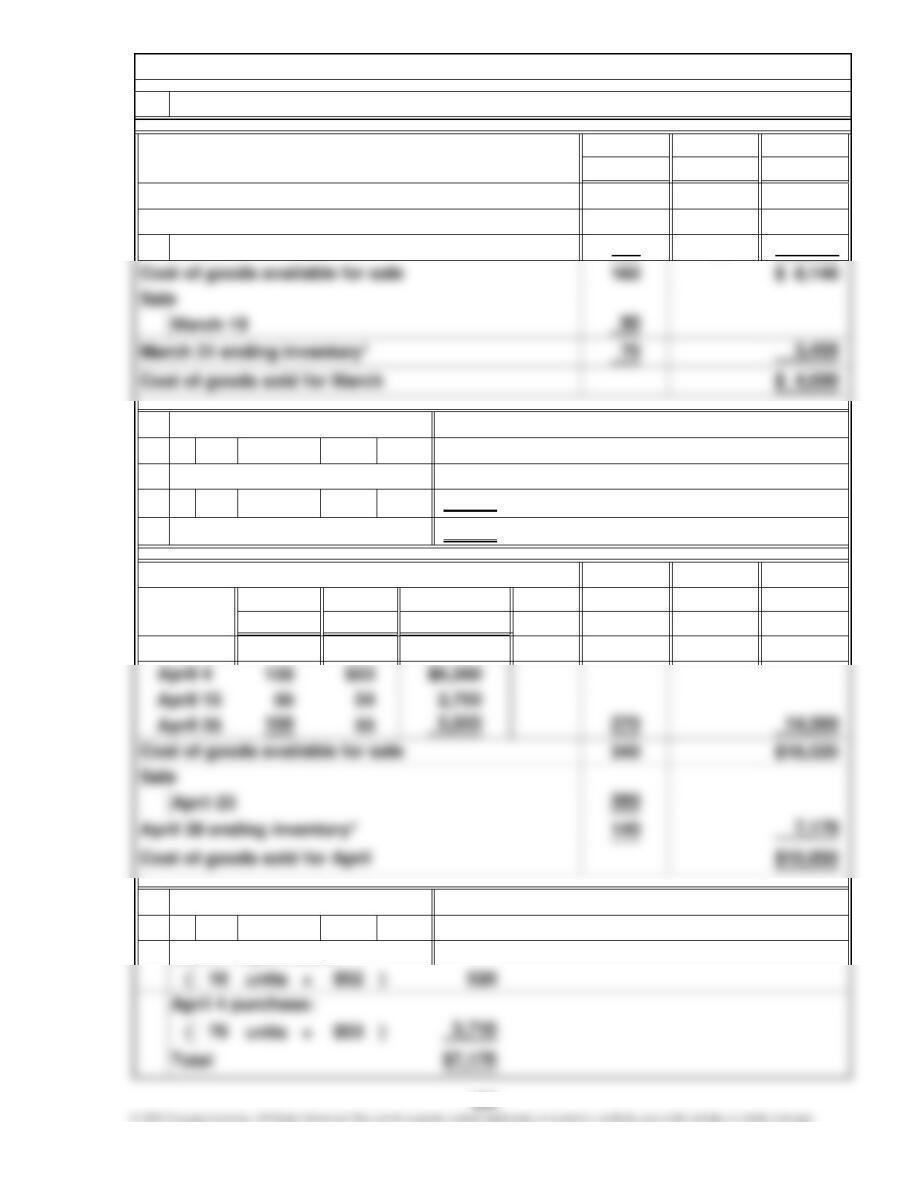
Unit
Units Price Amount
60 $49.00 $ 2,940
70 $50.88 $ 3,562
Unit
Units Price Amount
March 1 beginning inventory
Purchase
Chapter 6, P 2.
Purchases
April 1 beginning inventory
*Rounded
Periodic inventory system—average-cost method
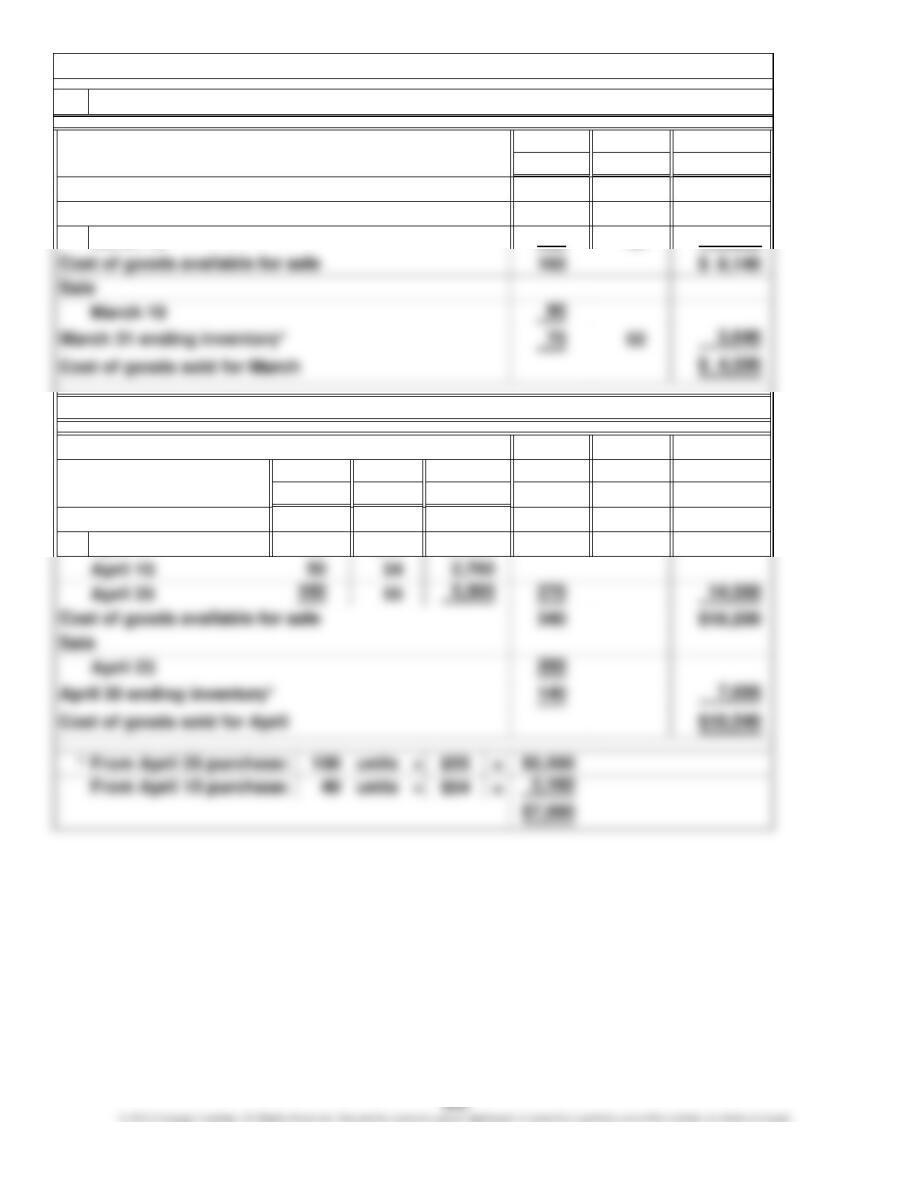
Unit
Units Price Amount
60 $49 $ 2,940
100 52 5,200
70 $52 $ 3,640
Unit
Price
April 4 $53
120
March 10
$6,360
Amount
April 1 beginning inventory
March 1 beginning inventory
Purchase
Chapter 6, P 2. (Continued)
Units
*From purchase on March 10
Purchases
2. Periodic inventory system—FIFO method
Unit
Units Price Amount
60 $49 $ 2,940
100 52 5,200
*
( units ×
( units ×
70 $ 3,460
Units
*
( units ×
Total
March 10 purchase:
March 1 beginning inventory:
Chapter 6, P 2. (Continued)
$49
$52
60
10
Periodic inventory system—LIFO method
$3,460
Purchases
Amount
Unit
520
March 1 beginning inventory
$2,940)
March 10 purchase
) $2,940
$49
Price
3.
March 1 beginning inventory
Purchase
)
60
April 1 beginning inventory
March 10
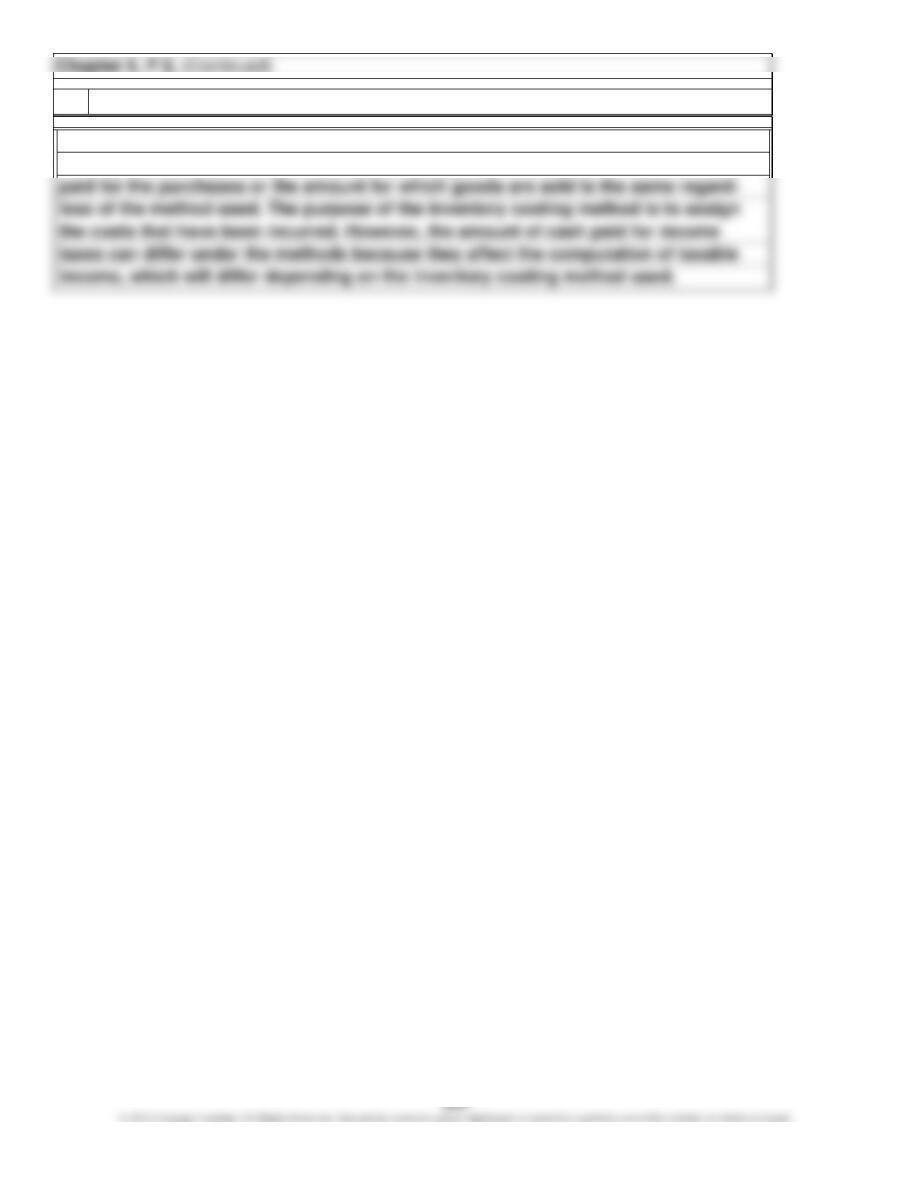
The inventory costing method chosen by a company does not affect cash flows
from operations from the purchase and sale of goods because the amount actually
4.
User Insight: Effects on cash flows discussed
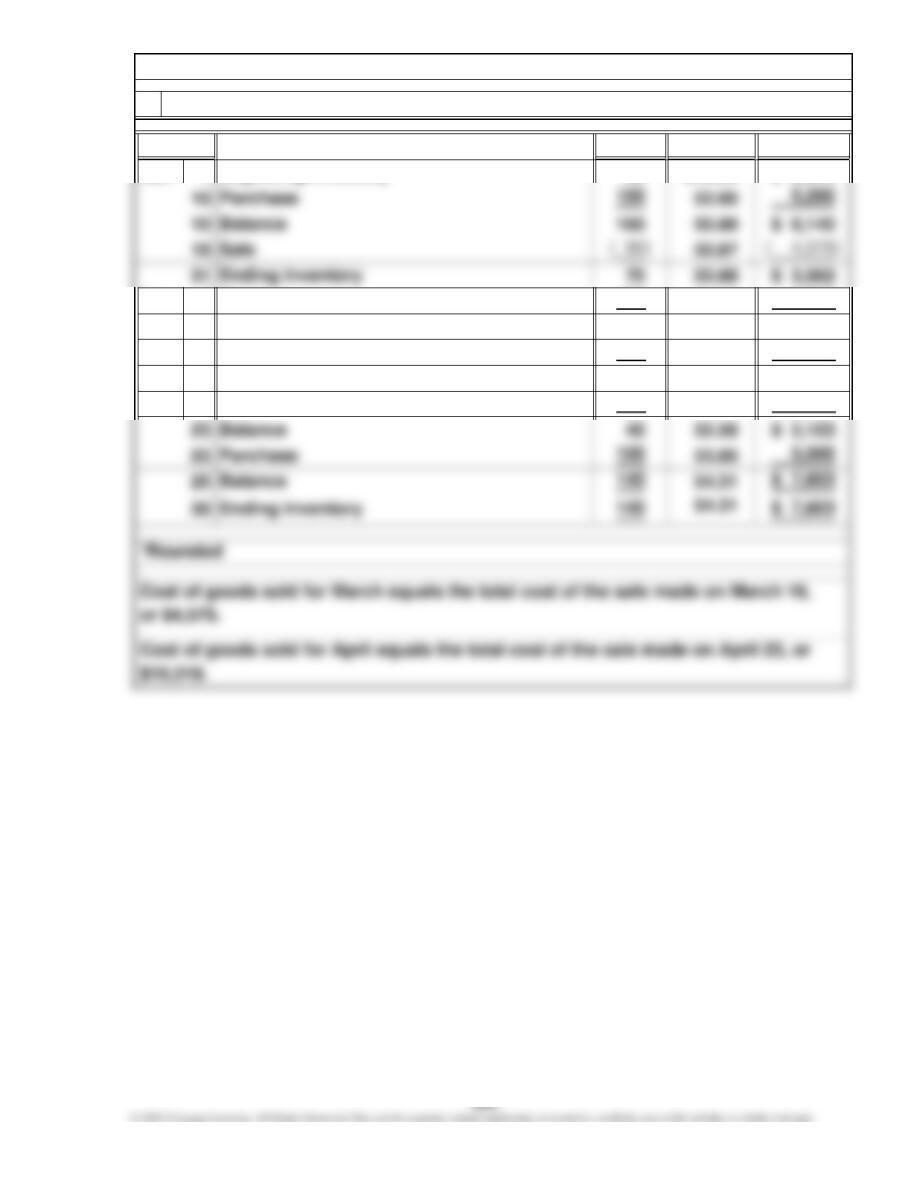
1.
Units Cost* Amount*
1 60 $49.00 $ 2,940
4120 53.00 6,360
4 190 52.22 $ 9,922
15 50 54.00 2,700
15 240 52.59 $12,622
23 (200) 52.59 ( 10,518)
Date
Balance
Purchase
Beginning inventory
Balance
Sale
PurchaseApr.
Perpetual inventory system—average-cost method
Mar.
Chapter 6, P 3.
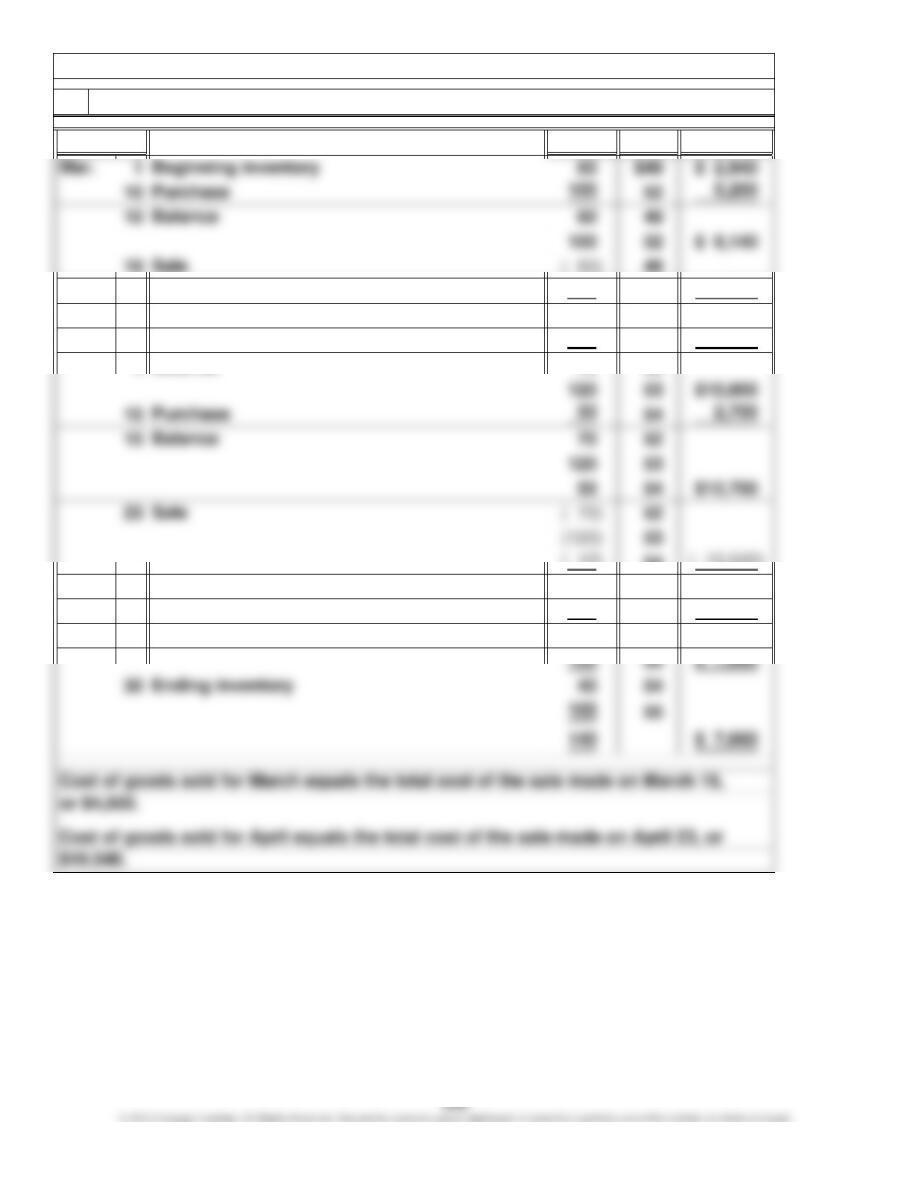
Units Cost Amount
( 30) 52 ( 4,500)
31 70 52 $ 3,640
4120 53 6,360
47052
( 10) 54 ( 10,540)
23 40 54 $ 2,160
25 100 55 5,500
25 40 54
Apr.
Chapter 6, P 3. (Continued)
Perpetual inventory system—FIFO method
2.
Balance
Balance
Date
Ending inventory
Purchase
Purchase
Balance
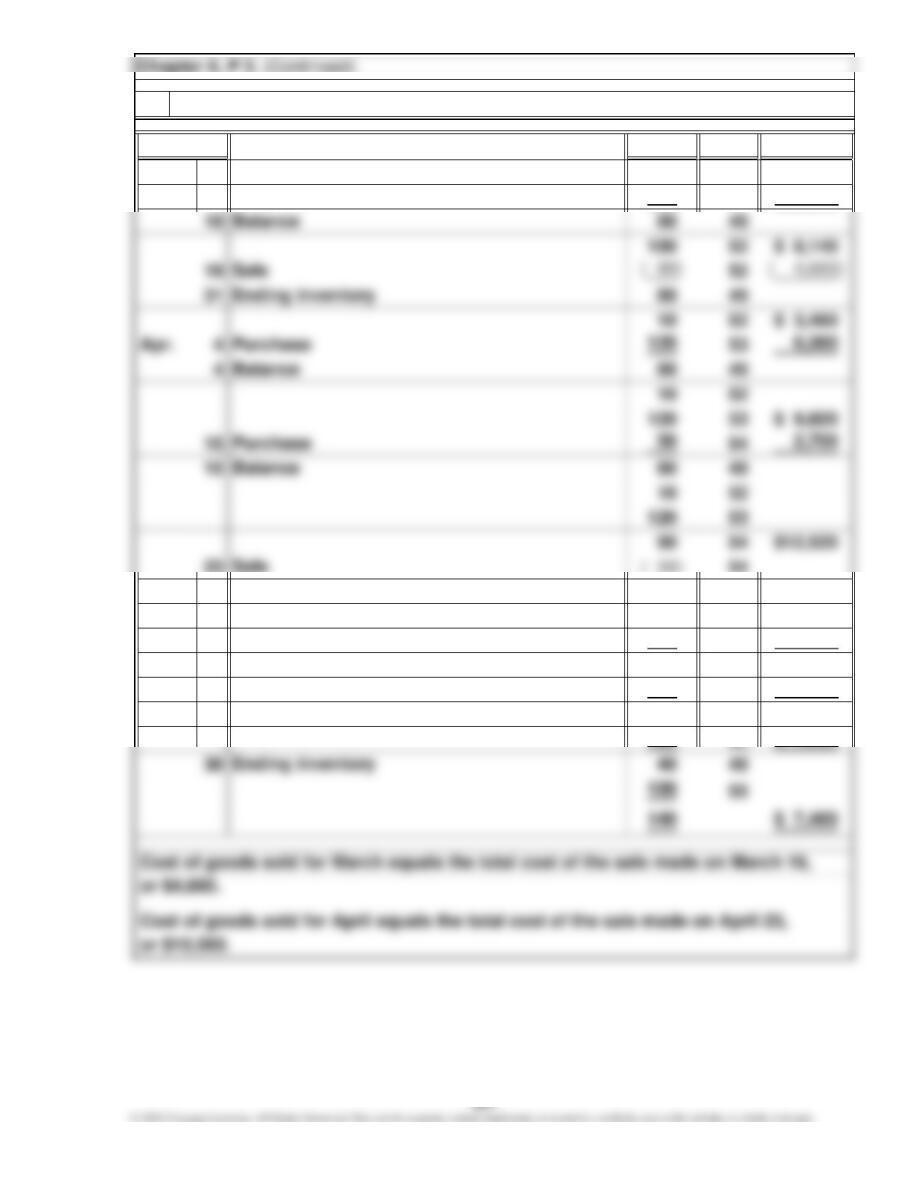
Units Cost Amount
1 60 $49 $ 2,940
10 100 52 5,200
(120) 53
( 10) 52
( 20) 49 ( 10,560)
23 40 49 $ 1,960
25 100 55 5,500
25 40 49
100 55 $ 7,460
Perpetual inventory system—LIFO method
Mar. Beginning inventory
Date
Purchase
3.
Balance
Purchase
Balance
Chapter 6, P 3. (Continued)
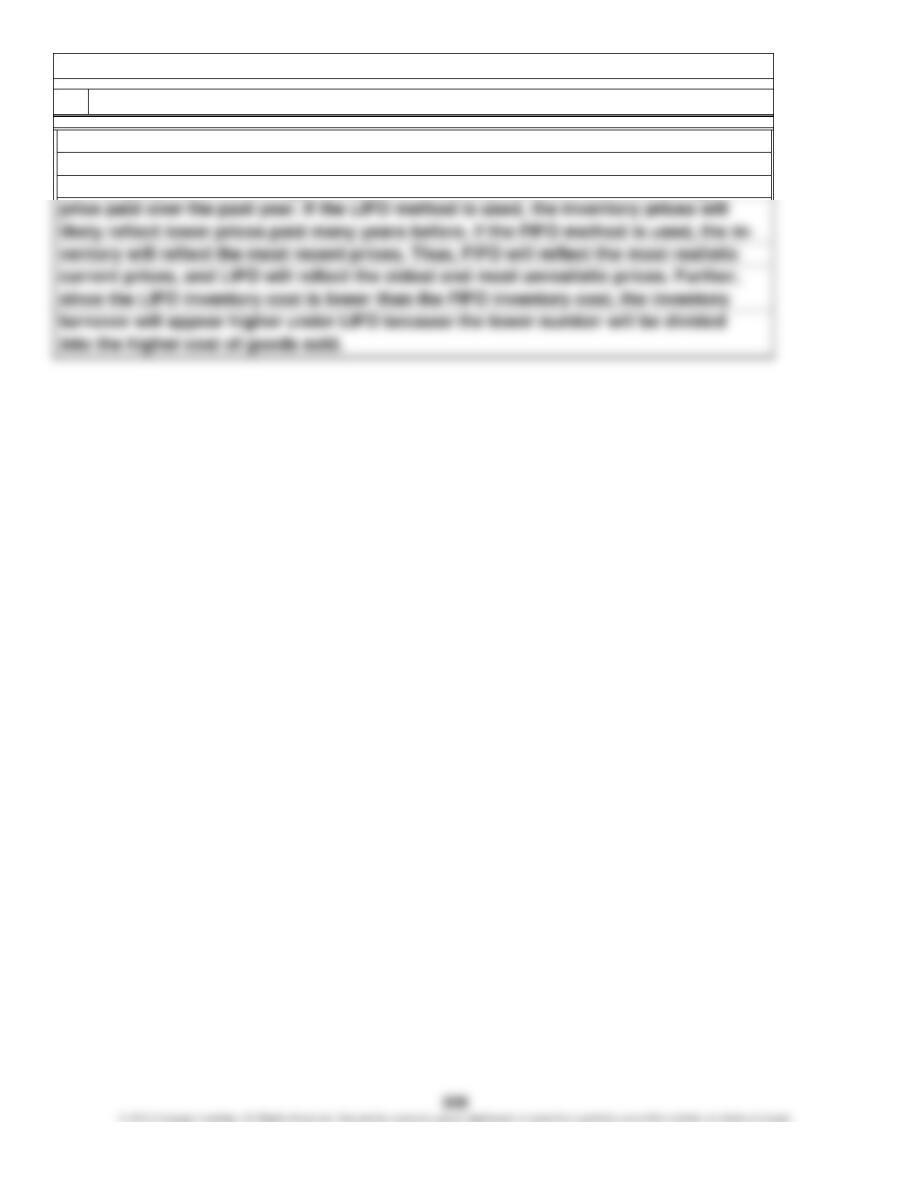
In a long period of rising prices, how realistic the inventory value of the balance
sheet is will depend on the inventory method used by the company. For instance, if
the company uses the average method, the inventory should reflect the average
4. User Insight: Inventory valuation discussed
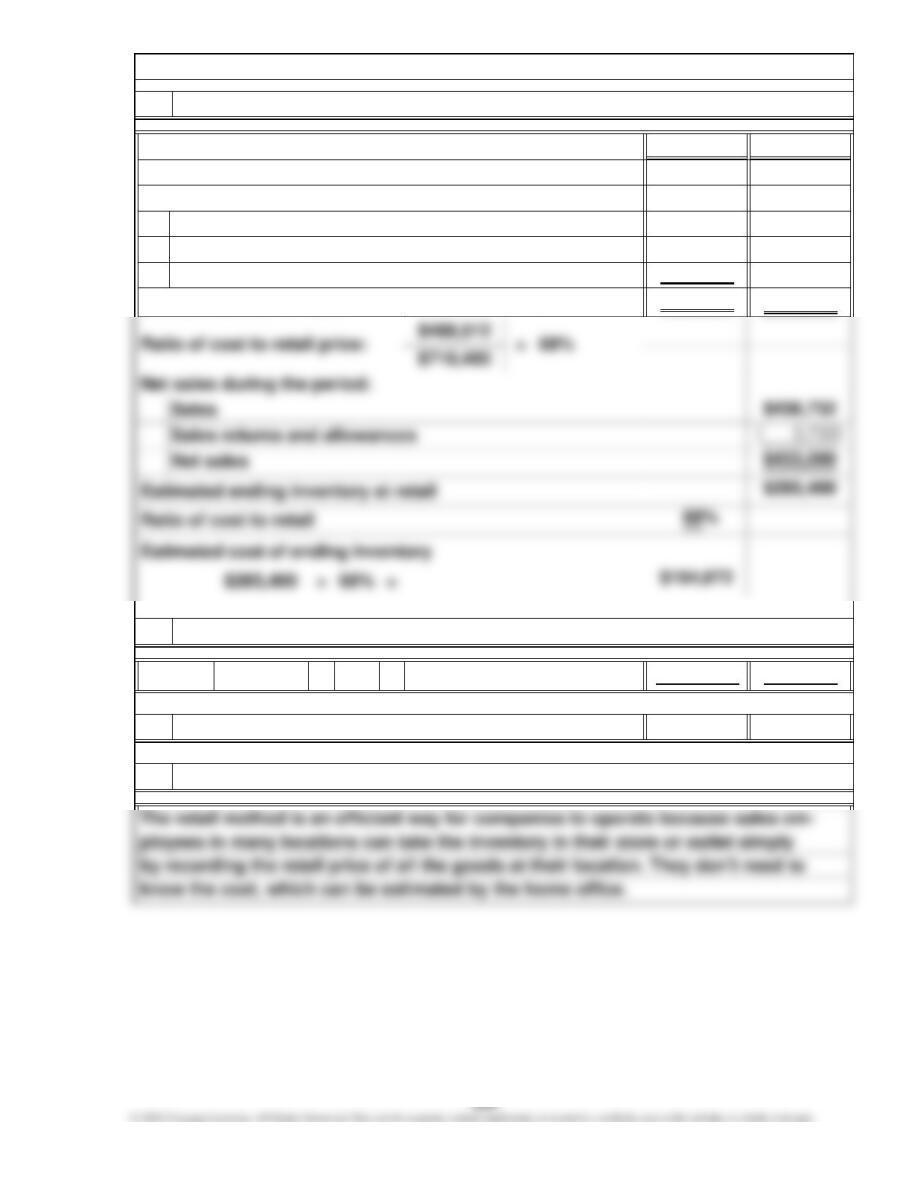
Cost Retail
$205,952 $297,200
286,932 434,000
( 8,172) ( 12,800)
3,800 _______
$488,512 $718,400
$249,800 × 68% = 169,864 249,800
$ 24,208 $ 35,600
3. Estimated inventory shortage at cost and retail
Month-end inventory at cost estimated
Purchases
2. October 31 physical inventory
Chapter 6, P 4.
Beginning inventory
Net purchases for the period:
Goods available for sale
User Insight: Retail method discussed 4.
1.
Purchases returns and allowances
Freight-in
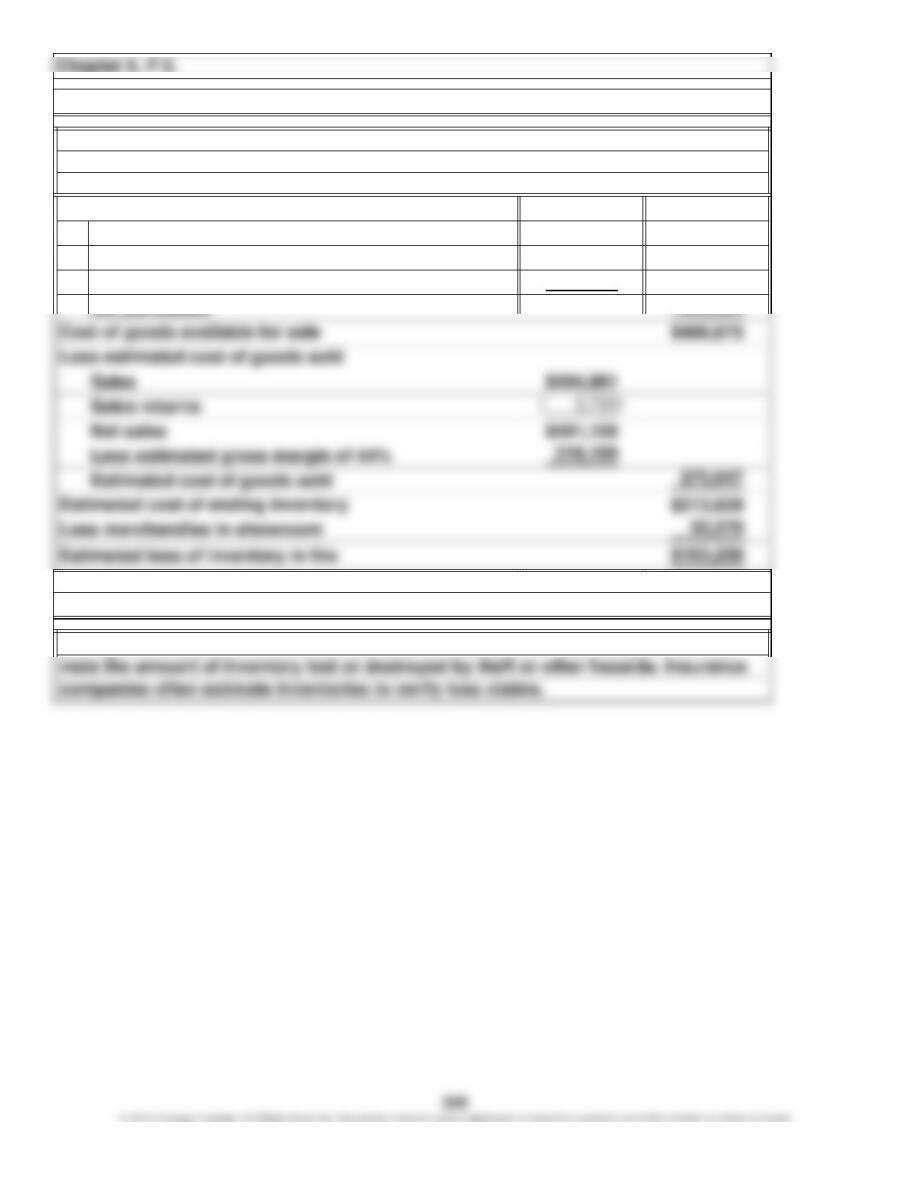
$181,850
Purchases at cost $301,525
Purchases returns ( 1,338)
Freight-in 6,638
1. Inventory loss estimated
Beginning inventory at cost
Schedule to Estimate Inventory Destroyed
April 22, 2011
Gonzo Furniture
Management may want to estimate the cost of inventory for interim reports or esti-
2. User Insight: Reasons for estimating inventory
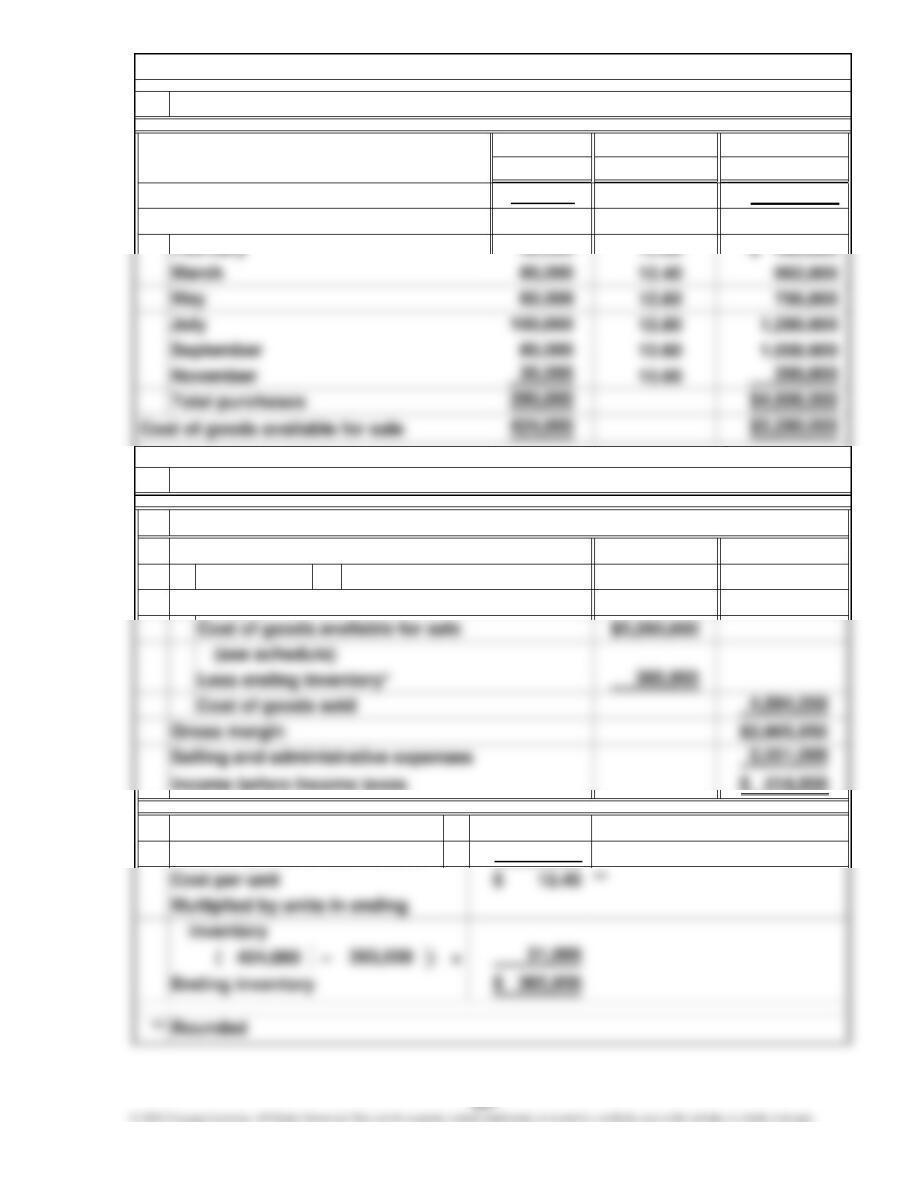
Total
Price Cost
$11.00 $ 374,000
a.
$7,860,000
×
*
÷
393,000 $20
Sales
Units
Purchases
Average-cost method:
2.
424,000
1. Schedule of cost of goods available for sale prepared
Beginning inventory
Income before income taxes computed
Chapter 6, P 6.
34,000
$5,280,000
Cost of goods available for sale
Divided by total units available
Cost of goods sold
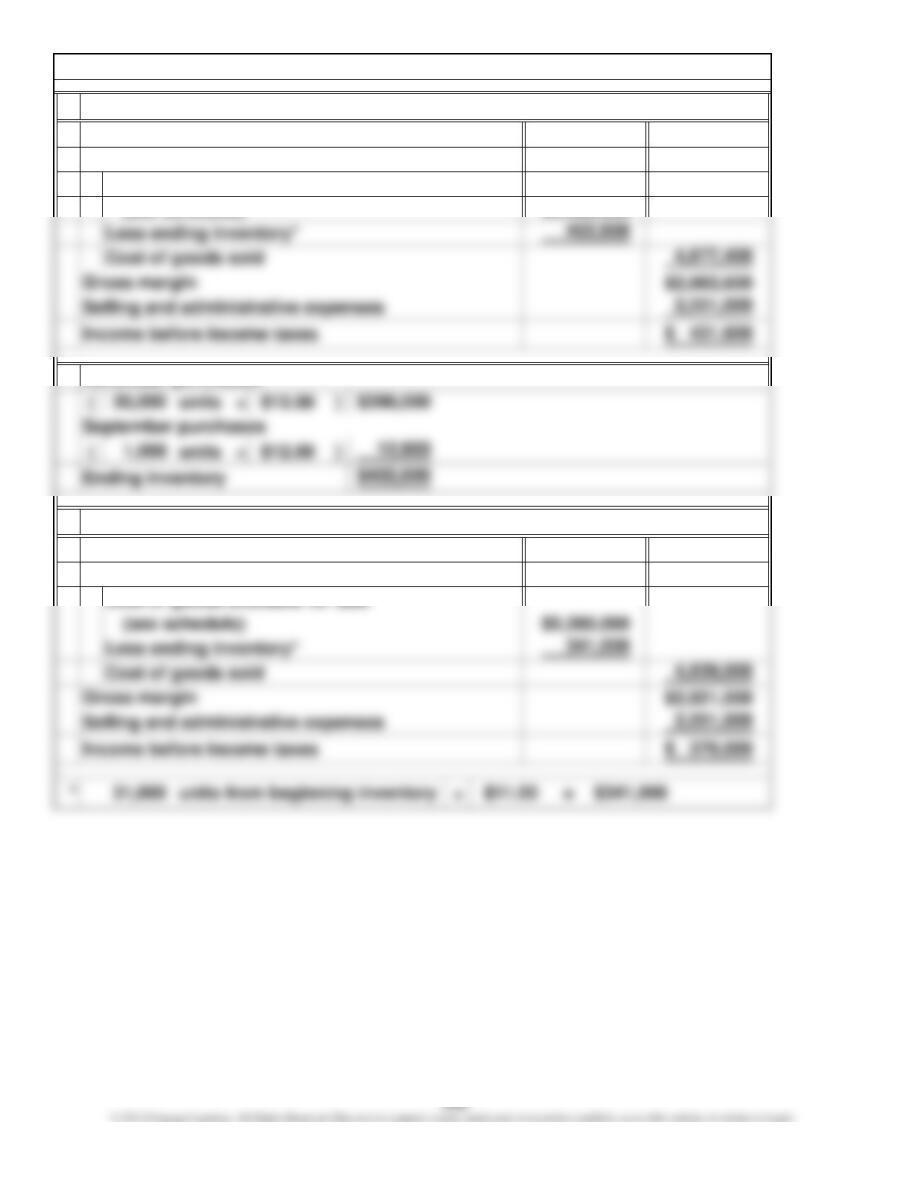
b.
$7,860,000
*
c.
$7,860,000
FIFO method:
Chapter 6, P 6. (Continued)
LIFO method:
November purchases
$5,280,000
Sales
Cost of goods sold
Cost of goods available for sale
(see schedule)
Sales
Cost of goods sold
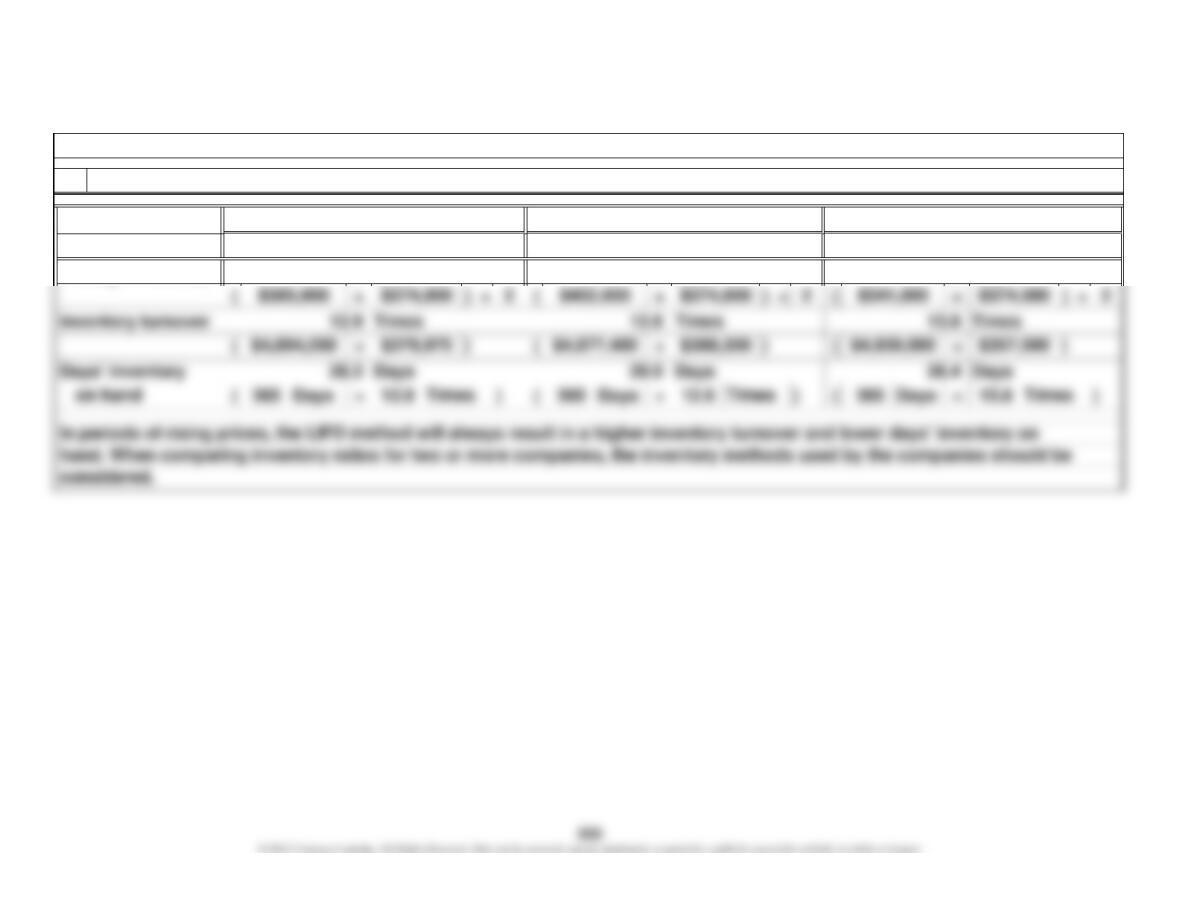
Average-Cost
$357,500
$4,939,000Cost of goods sold $4,894,050
$379,975 $388,300
LIFO
Chapter 6, P 6. (Continued)
3. User Insight: Financial ratios computed and discussed
Average inventory
$4,877,400
FIFO