Wild and Shaw Financial and Managerial Accounting 9e Solutions Manual: Chapter 5
Chapter 5
Inventories and Cost of Sales
QUICK STUDIES
Quick Study 5-1 (10 minutes)
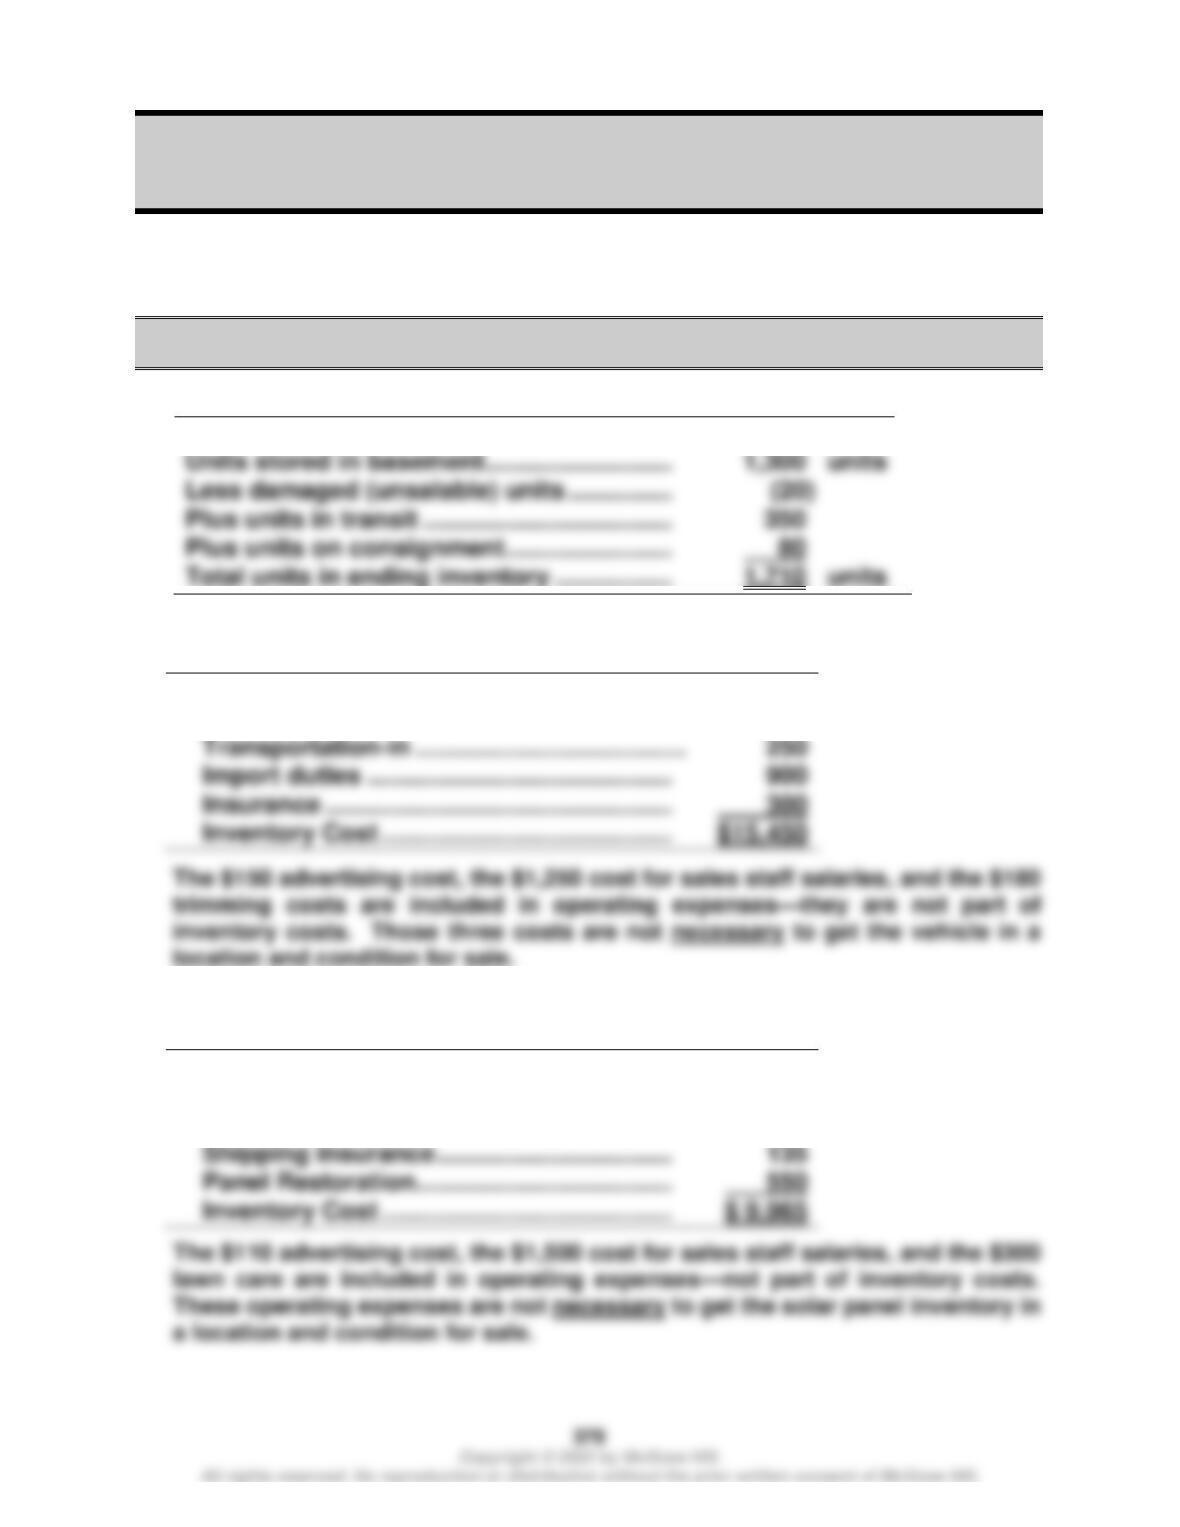
Units in ending inventory
Less damaged (unsalable) units ……………
350
Quick Study 5-2 (10 minutes)
Cost ……………………………………………………….
$14,000
Plus
Transportation–in …………………………………
250
900
Insurance …………………………………………..
Quick Study 5-3 (10 minutes)
Cost ………………………………………………………..
$ 9,000
Plus
Transportation–in …………………………………
280
135
Panel Restoration ……………………………….
Wild and Shaw Financial and Managerial Accounting 9e Solutions Manual: Chapter 5
380
Quick Study 5-4 (10 minutes)
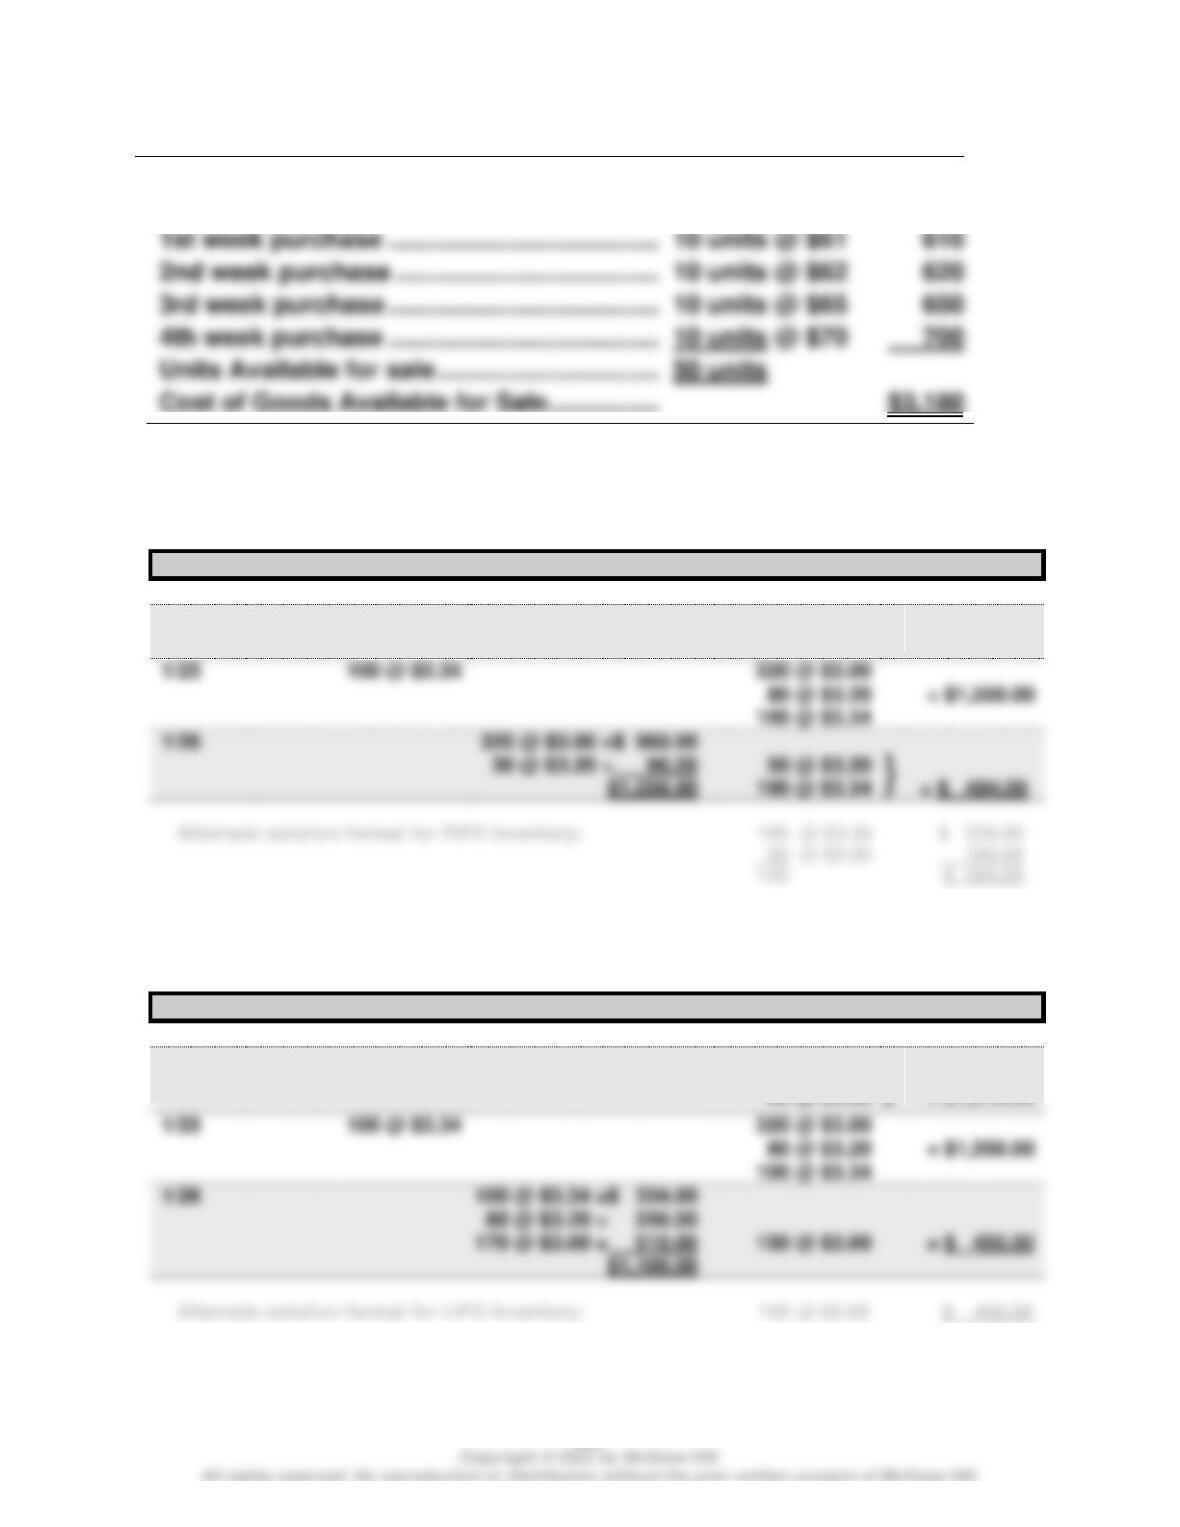
Beginning inventory ……………………………….
10 units @ $60
$ 600
Plus
1st week purchase …………………………………
10 units @ $61
2nd week purchase ………………………………..
10 units @ $62
3rd week purchase …………………………………
10 units @ $65
4th week purchase …………………………………
10 units @ $70
50 units
Quick Study 5-5 (10 minutes)
FIFO—Perpetual
Date
Goods Purchased
Cost of Goods Sold
Inventory Balance
1/1
320 @ $3.00
= $ 960.00
1/9
80 @ $3.20
320 @ $3.00
80 @ $3.20
= $1,216.00
1/25
320 @ $3.00
80 @ $3.20
= $1,550.00
100 @ $3.34
1/26
30 @ $3.20 = 96.00
50 @ $3.20
Quick Study 5-6 (10 minutes)
LIFO—Perpetual
Date
Goods Purchased
Cost of Goods Sold
Inventory Balance
1/1
320 @ $3.00
= $ 960.00
1/9
80 @ $3.20
320 @ $3.00
80 @ $3.20
= $1,216.00
1/25
320 @ $3.00
80 @ $3.20
= $1,550.00
100 @ $3.34
1/26
80 @ $3.20 = 256.00
150 @ $3.00
}
}
Wild and Shaw Financial and Managerial Accounting 9e Solutions Manual: Chapter 5
381
Quick Study 5-7 (10 minutes)
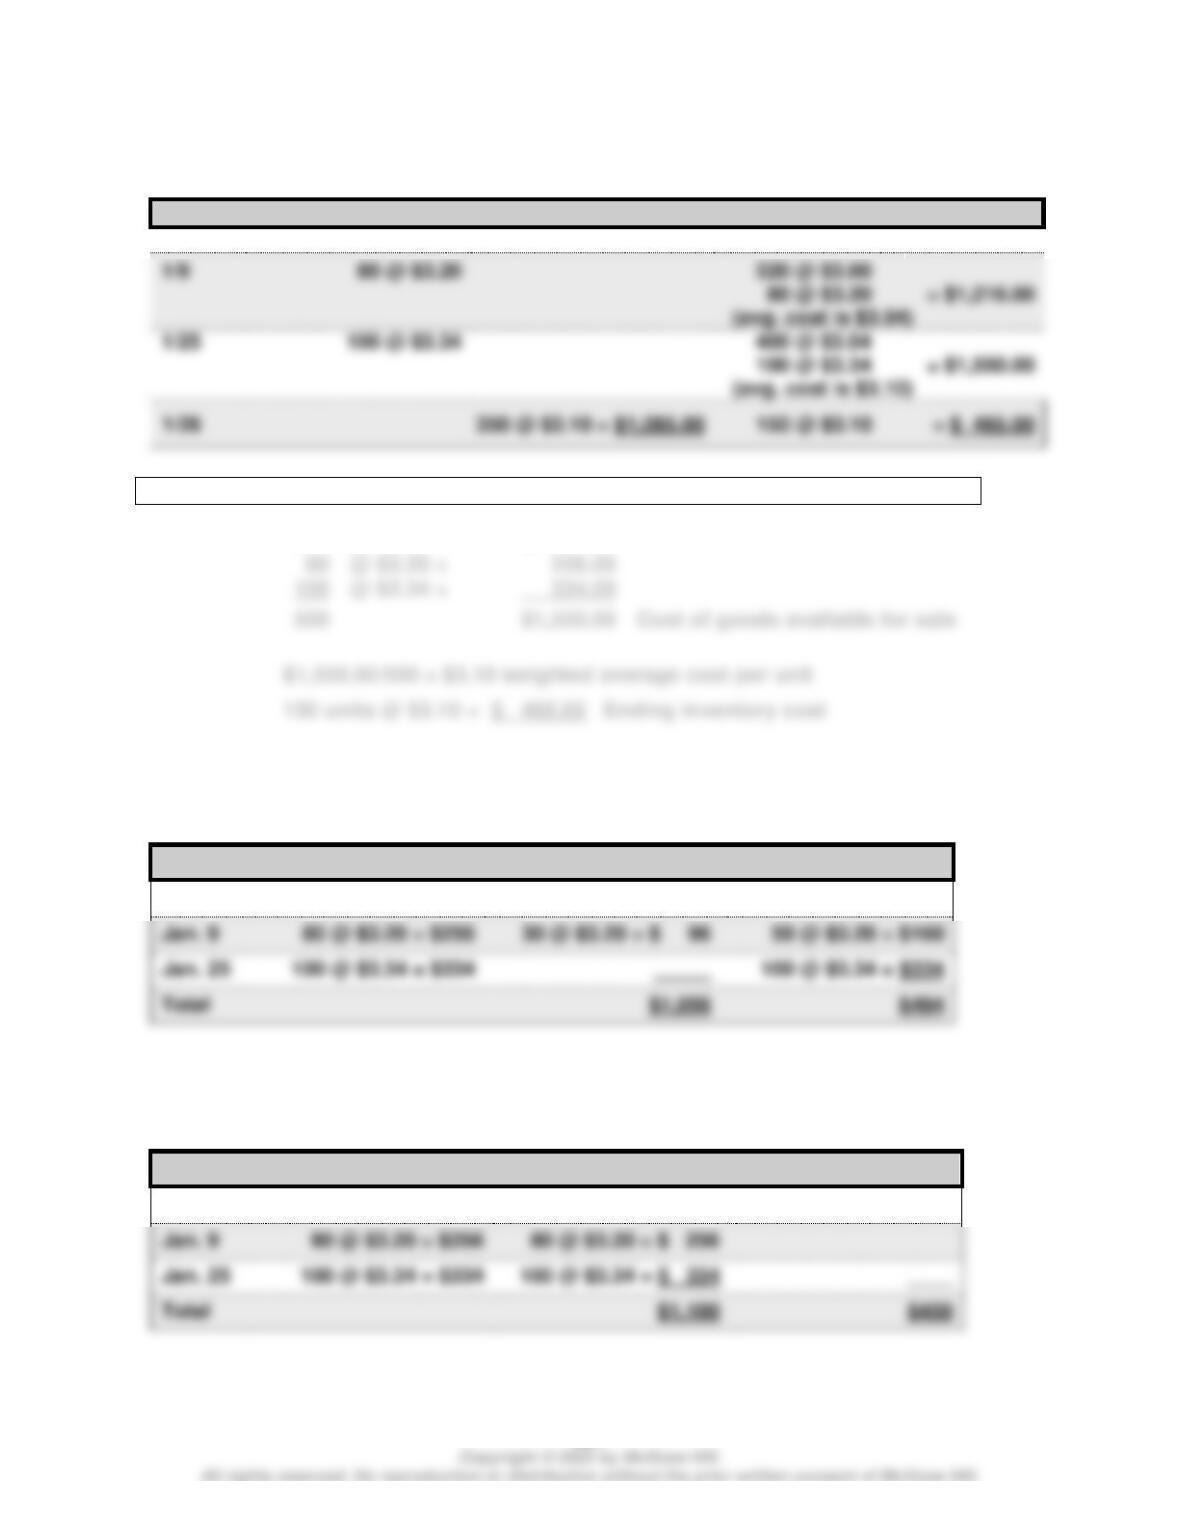
Weighted Average—Perpetual
Date
Goods Purchased
Cost of Goods Sold
Inventory Balance
1/1
320 @ $3.00
= $ 960.00
1/9
320 @ $3.00
(avg. cost is $3.04)
1/25
(avg. cost is $3.10)
Alternate solution format
Weighted average:
320
@ $3.00 =
$ 960.00
@ $3.20 =
Quick Study 5-8A (10 minutes)
FIFO—Periodic
Date
Goods Available for Sale
Cost of Goods Sold
Ending Inventory
Jan. 1
320 @ $3.00 = $960
320 @ $3.00 = $ 960
Jan. 9
Jan. 25
100 @ $3.34 = $334
Total
Quick Study 5-9A (10 minutes)
LIFO—Periodic
Date
Goods Available for Sale
Cost of Goods Sold
Ending Inventory
Jan. 1
320 @ $3.00 = $960
170 @ $3.00 = $ 510
150 @ $3.00 = $450
Jan. 9
Jan. 25
100 @ $3.34 = $ 334
Total
Wild and Shaw Financial and Managerial Accounting 9e Solutions Manual: Chapter 5
Quick Study 5-10A (10 minutes)
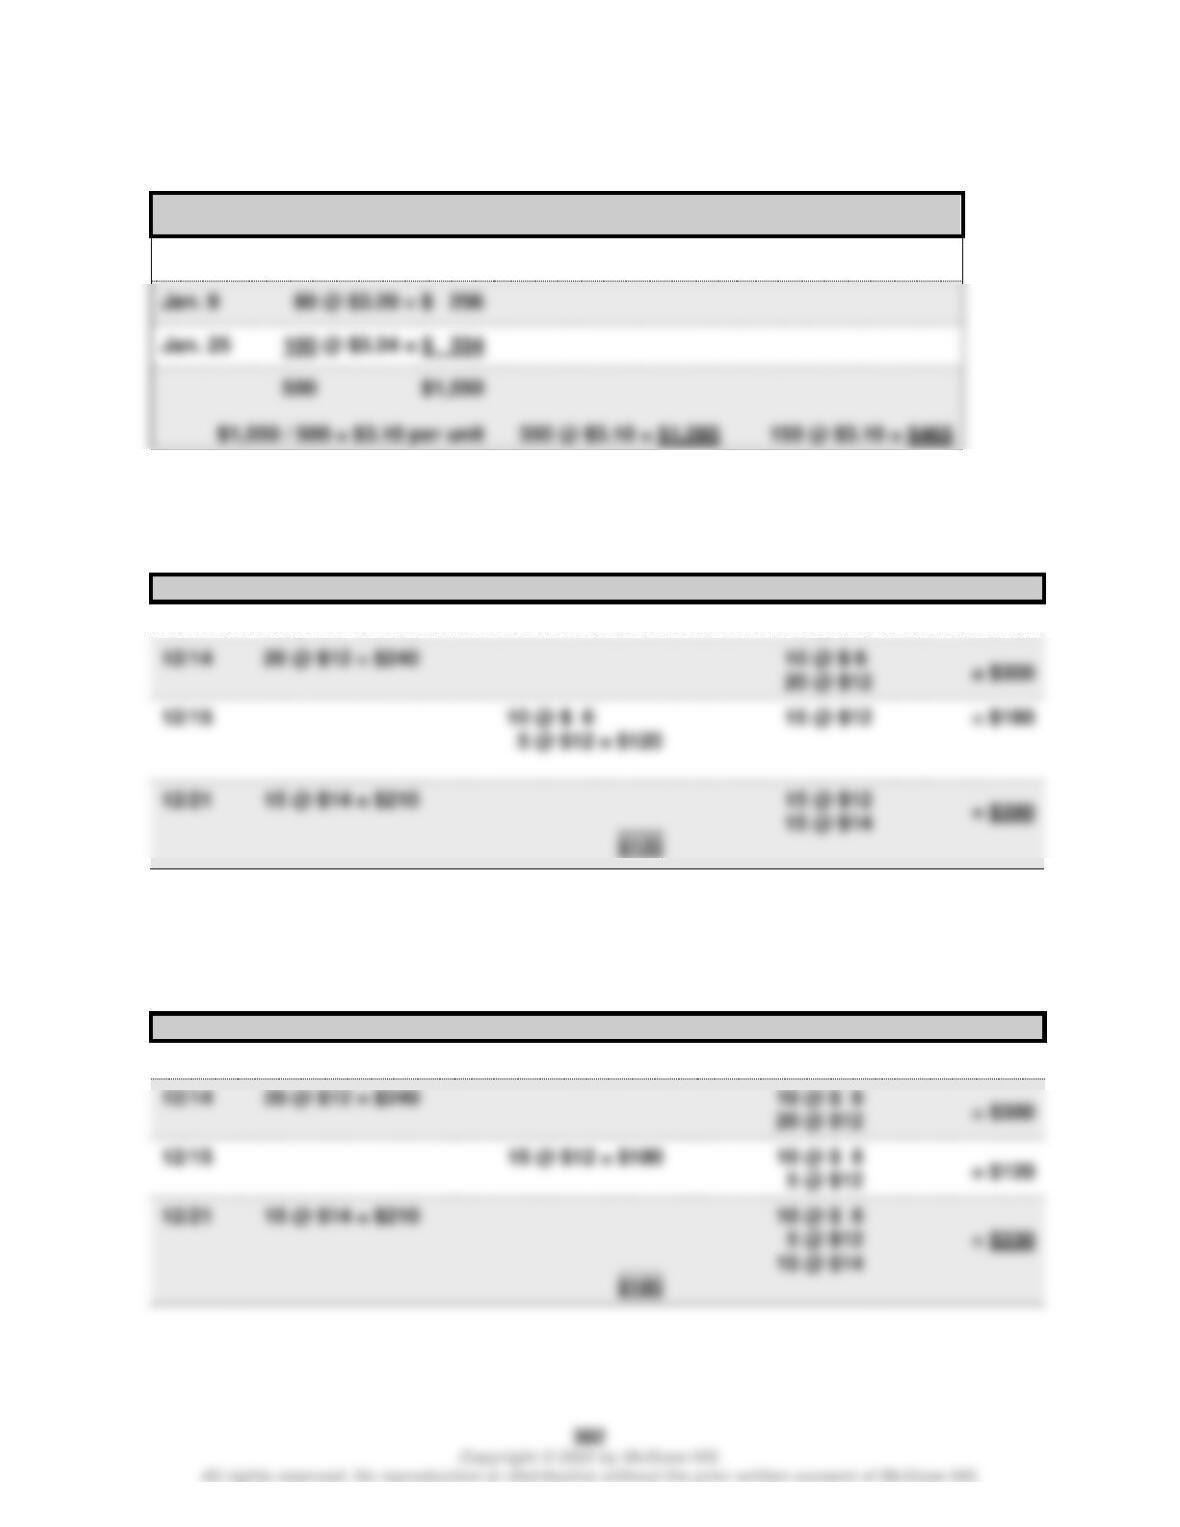
Weighted Average—Periodic
Date
Goods Available for Sale
Cost of Goods Sold
Ending Inventory
Jan. 1
320 @ $3.00 = $ 960
Jan. 25
100 @ $3.34 = $ 334
Quick Study 5-11 (10 minutes)
FIFO—Perpetual
Date
Goods Purchased
Cost of Goods Sold
Inventory Balance
12/ 7
10 @ $ 6 = $ 60
10 @ $ 6
= $ 60
10 @ $ 6
Quick Study 5-12 (10 minutes)
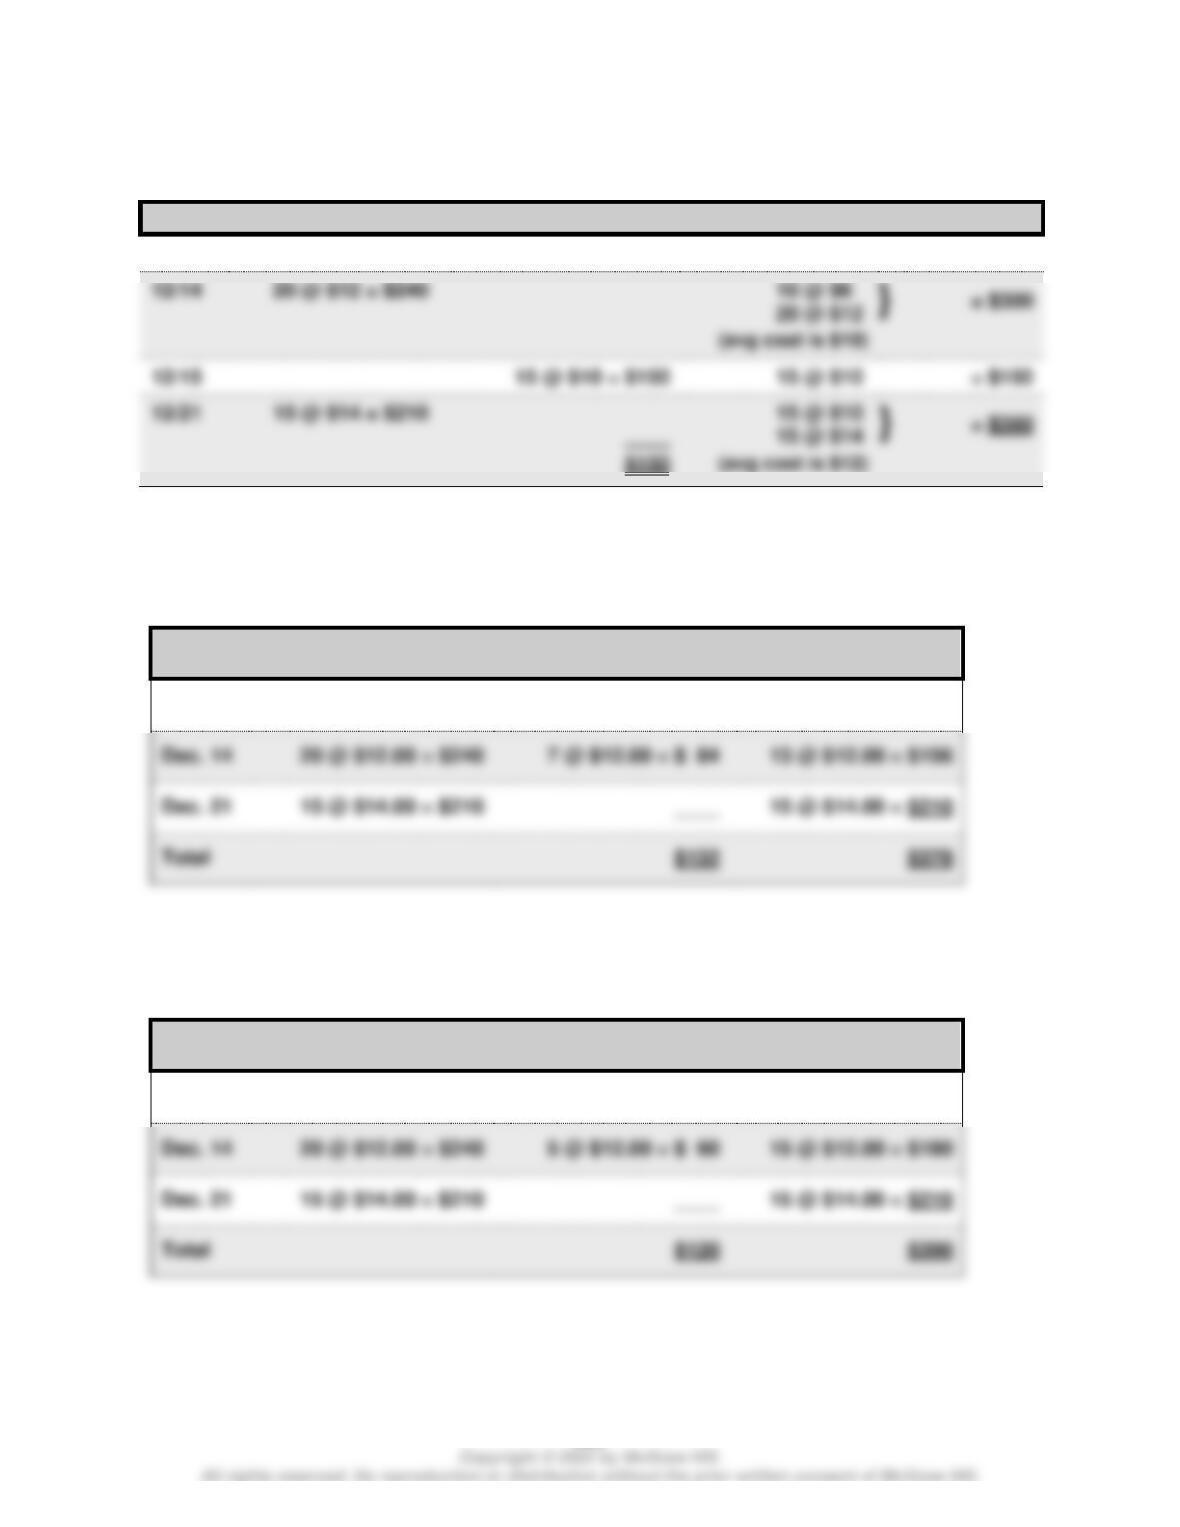
LIFO—Perpetual
Date
Goods Purchased
Cost of Goods Sold
Inventory Balance
12/7
10 @ $ 6 = $ 60
10 @ $ 6
= $ 60
20 @ $12
Wild and Shaw Financial and Managerial Accounting 9e Solutions Manual: Chapter 5
383
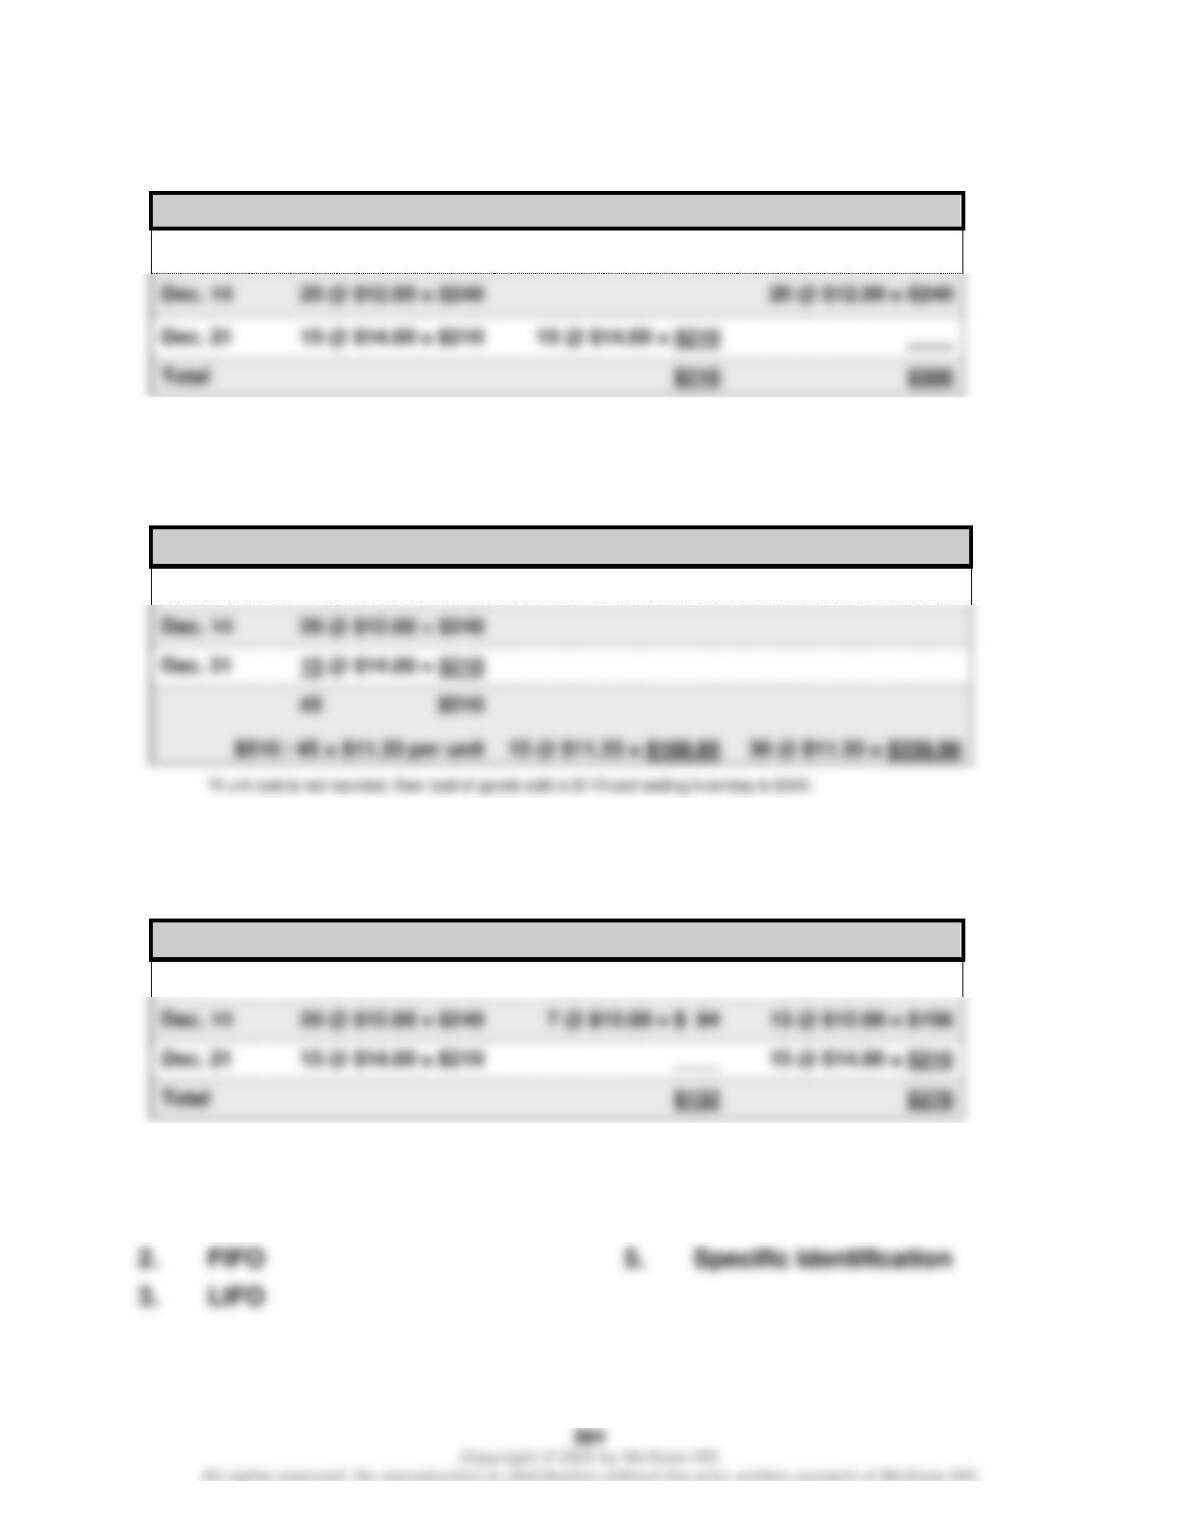
Quick Study 5-13 (25 minutes)
Weighted Average—Perpetual
Quick Study 5-14 (10 minutes)
Specific Identification
Date
Goods Available for Sale
Cost of Goods Sold
Ending Inventory
Dec. 7
10 @ $ 6.00 = $ 60
8 @ $ 6.00 = $ 48
2 @ $ 6.00 = $ 12
Dec. 14
7 @ $12.00 = $ 84
Dec. 21
15 @ $14.00 = $210
Total
Quick Study 5-15A (10 minutes)
FIFO—Periodic
Date
Goods Available for Sale
Cost of Goods Sold
Ending Inventory
Dec. 7
10 @ $ 6.00 = $ 60
10 @ $ 6.00 = $ 60
Total
Date
Goods Purchased
Cost of Goods Sold
Inventory Balance
12/7
10 @ $6 = $60
10 @ $6
= $ 60
12/15
15 @ $10
Wild and Shaw Financial and Managerial Accounting 9e Solutions Manual: Chapter 5
Quick Study 5-16A (10 minutes)
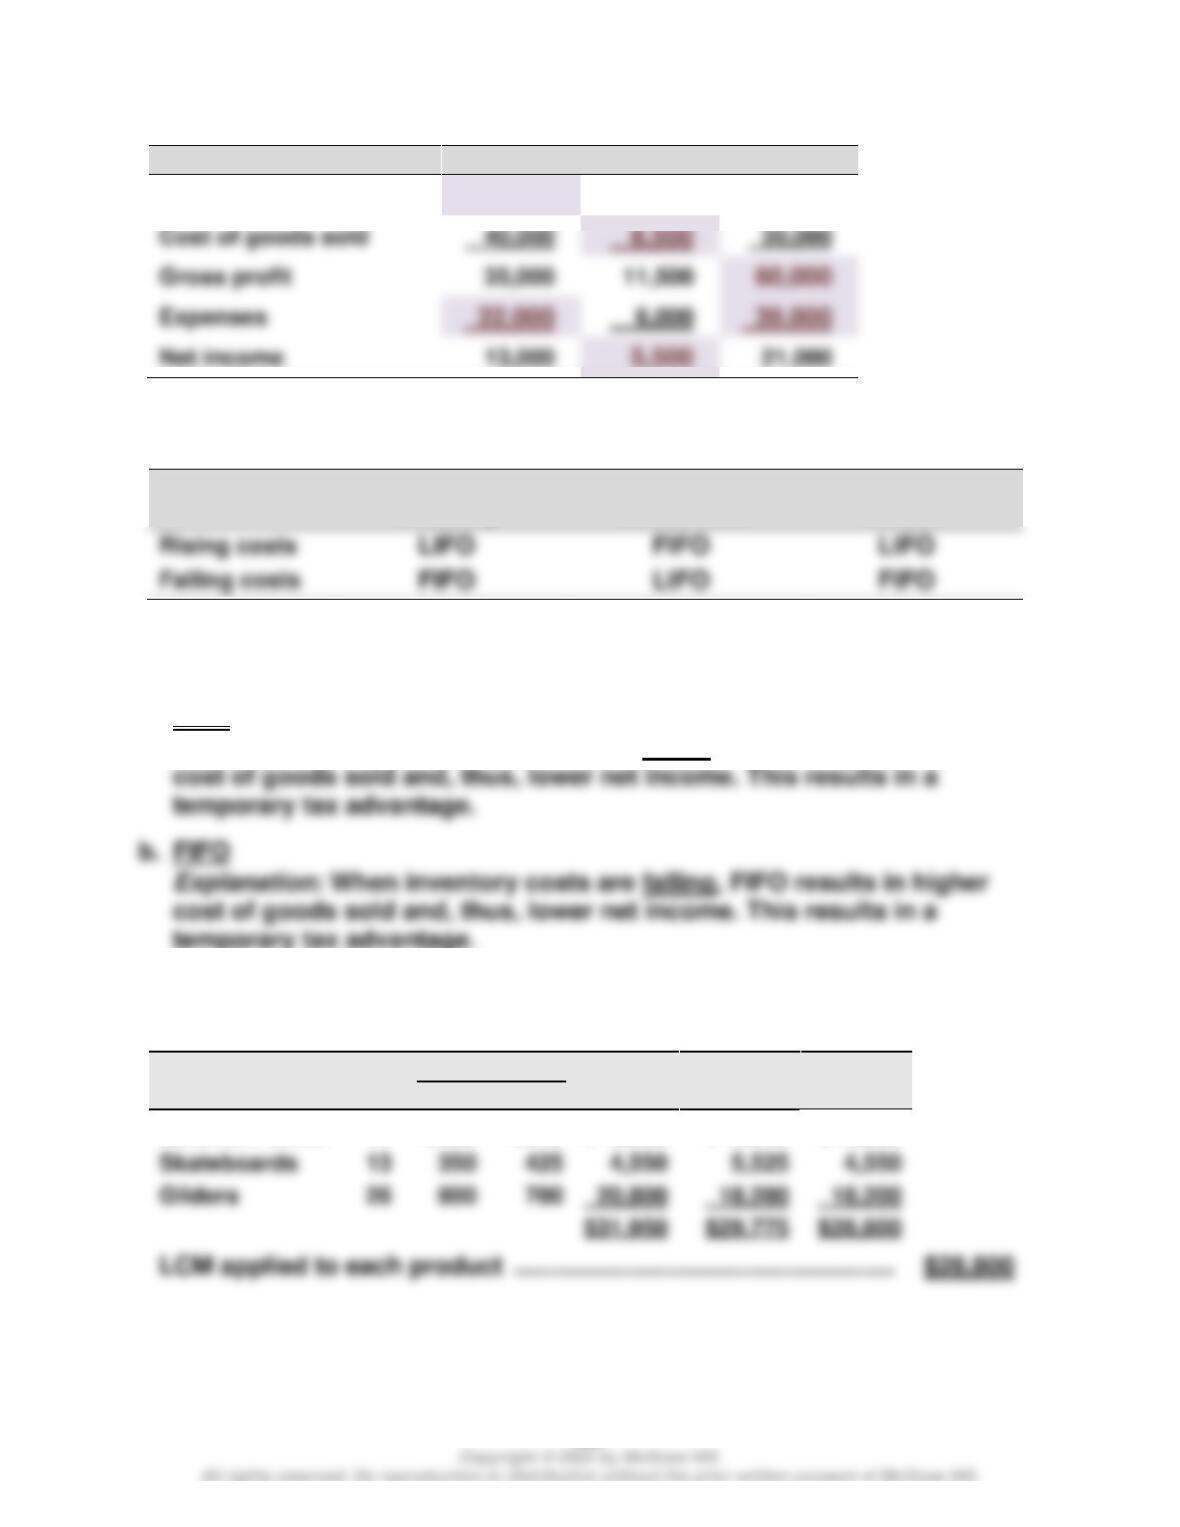
LIFO—Periodic
Date
Goods Available for Sale
Cost of Goods Sold
Ending Inventory
Dec. 7
10 @ $ 6.00 = $ 60
10 @ $ 6.00 = $ 60
Dec. 21
15 @ $14.00 = $210
Quick Study 5-17A (10 minutes)
Weighted Average—Periodic
Date
Goods Available for Sale
Cost of Goods Sold*
Ending Inventory*
Dec. 7
10 @ $ 6.00 = $ 60
Quick Study 5-18A (10 minutes)
Specific Identification
Date
Goods Available for Sale
Cost of Goods Sold
Ending Inventory
Dec. 7
10 @ $ 6.00 = $ 60
8 @ $ 6.00 = $ 48
2 @ $ 6.00 = $ 12
Dec. 14
7 @ $12.00 = $ 84
Dec. 21
15 @ $14.00 = $210
Total
Quick Study 5-19 (10 minutes)
1. LIFO
4. LIFO
Wild and Shaw Financial and Managerial Accounting 9e Solutions Manual: Chapter 5
385
Quick Study 5-20 (10 minutes)
A
B
C
Sales
$75,000
$20,000
$90,000
Gross profit
Quick Study 5-21 (10 minutes)
Lowest Ending
Inventory
Lowest Cost of
Goods Sold
Lowest Net
Income
Quick Study 5-22 (10 minutes)
a. LIFO
Explanation: When inventory costs are rising, LIFO results in higher
Quick Study 5-23 (20 minutes)
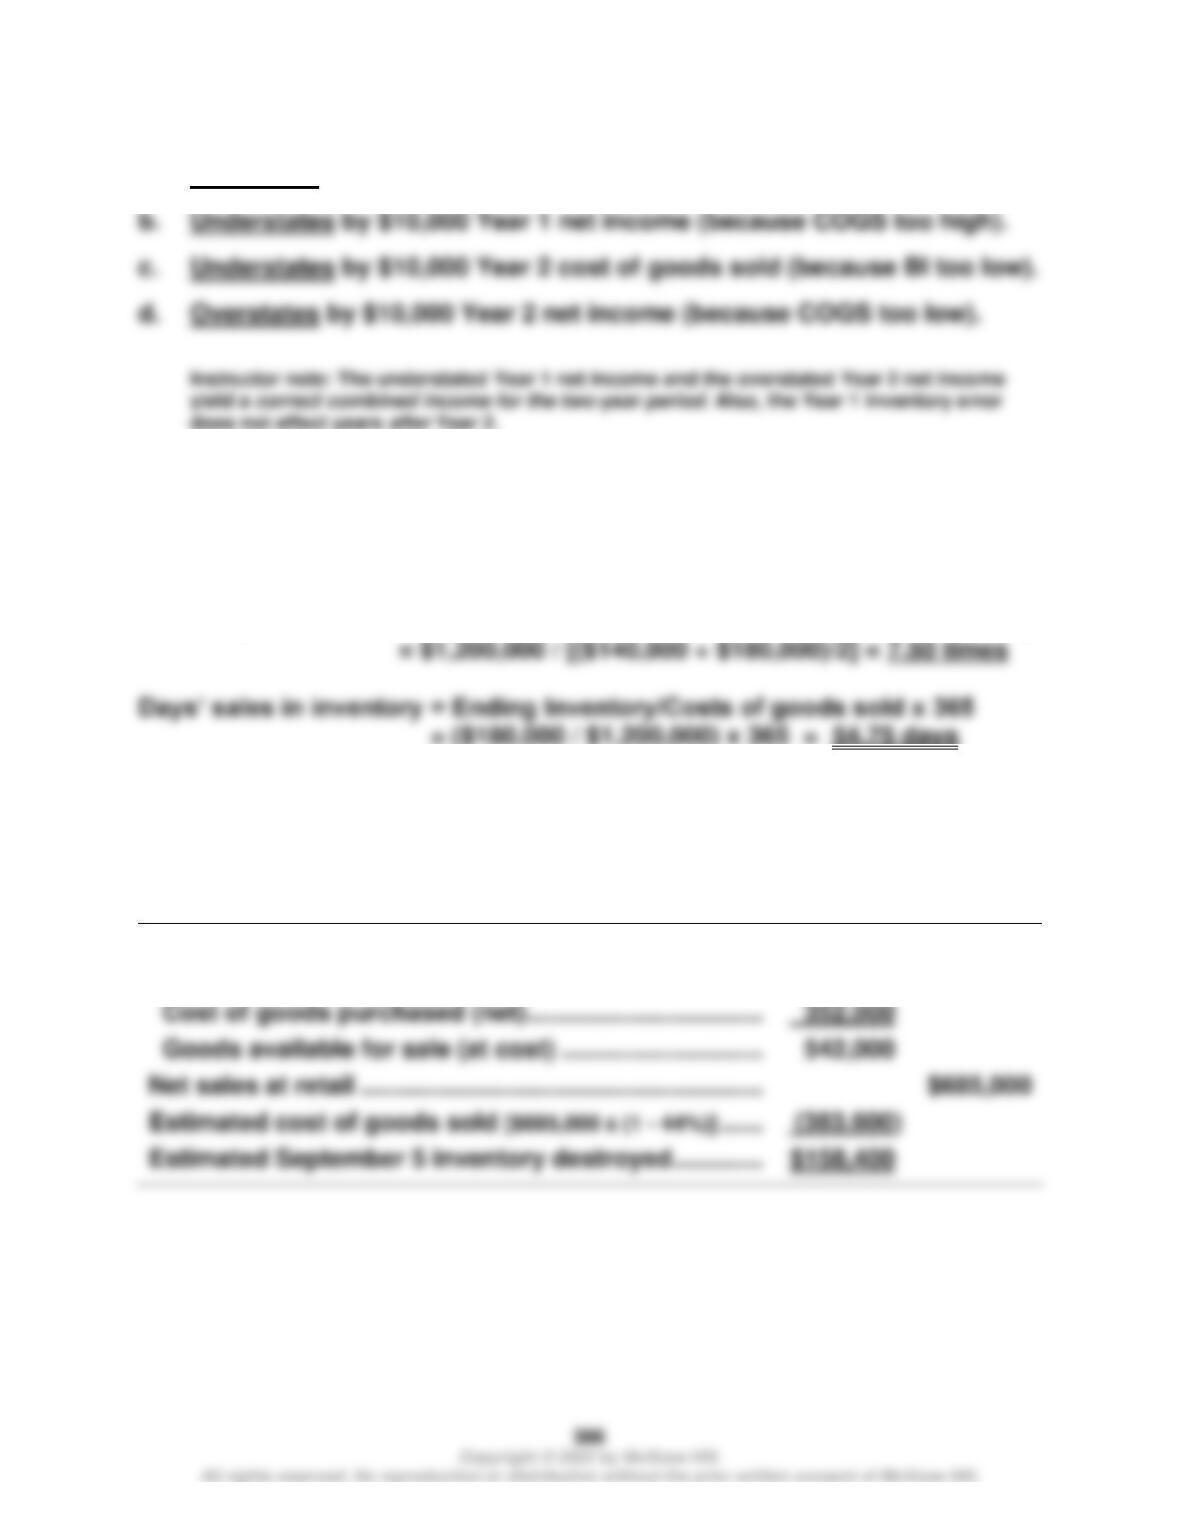
Per Unit
Total
Total
LCM –
Items
Inventory Items
Units
Cost
Market
Cost
Market
Mountain bikes
11
$600
$550
$ 6,600
$ 6,050
$ 6,050
Skateboards
Gliders
Wild and Shaw Financial and Managerial Accounting 9e Solutions Manual: Chapter 5
Quick Study 5-24 (15 minutes)
a. Overstates by $10,000 Year 1 cost of goods sold (because EI too low).
Quick Study 5-25 (10 minutes)
Inventory turnover = Cost of goods sold/Average merchandise inventory
Quick Study 5-26B (15 minutes)
Goods available for sale
Inventory, January 1 ……………………………………………
$190,000
Cost of goods purchased (net) …………………………….
Goods available for sale (at cost) ………………………..
Net sales at retail ………………………………………………….
Estimated cost of goods sold [$685,000 x (1 – 44%)] ……
Wild and Shaw Financial and Managerial Accounting 9e Solutions Manual: Chapter 5
EXERCISES
Exercise 5-1 (10 minutes)
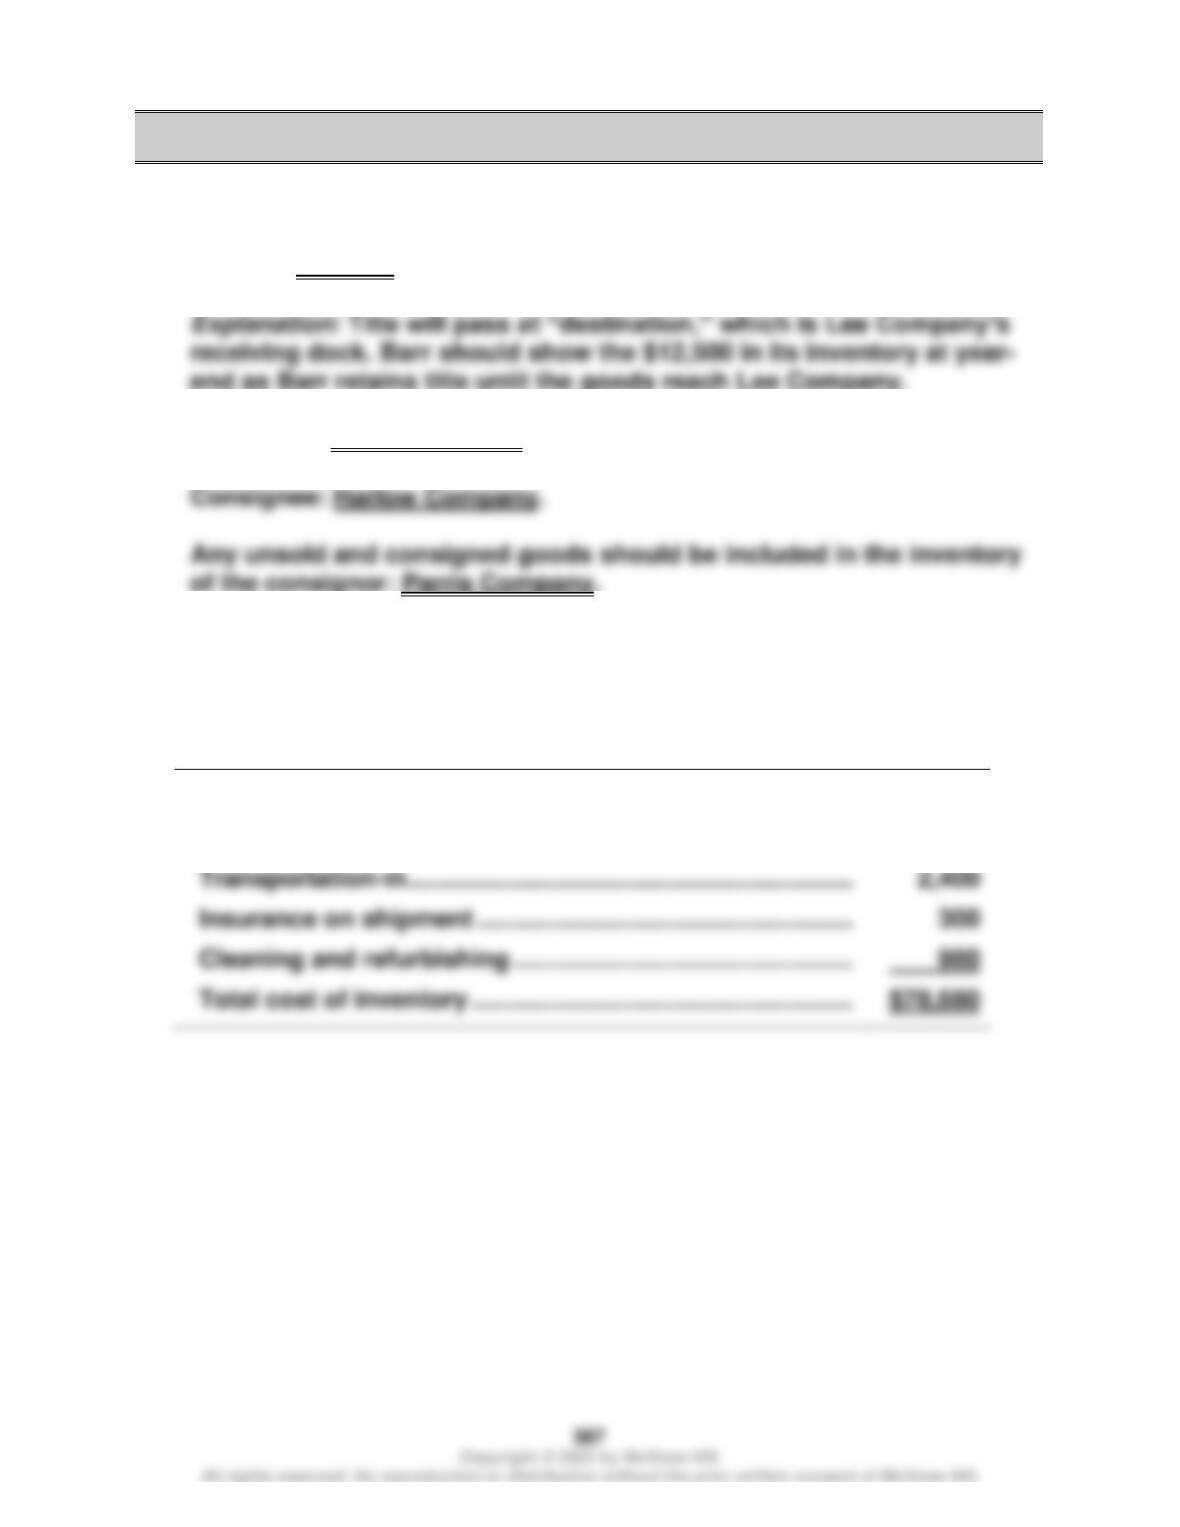
1. Answer: Barr Co.
2. Consignor: Parris Company.
Exercise 5-2 (10 minutes)
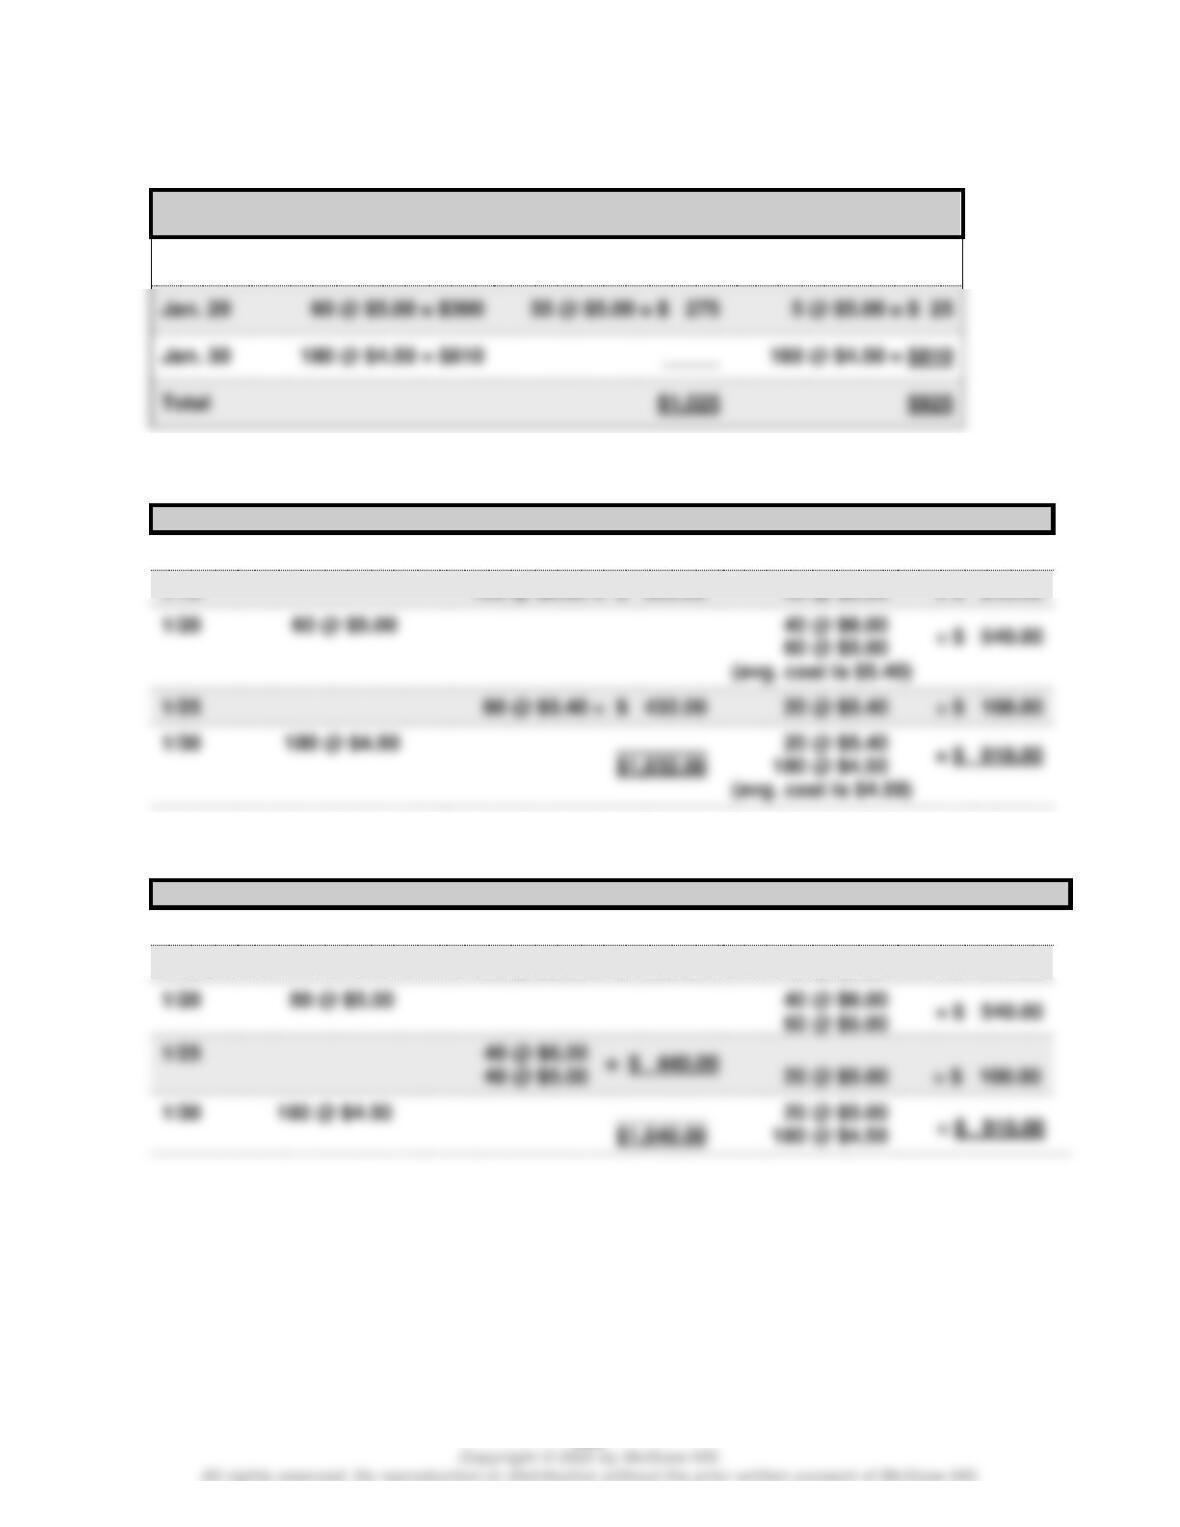
Cost of inventory
Price ………………………………………………………………………….
$75,000
Transportation–in ……………………………………………………….
Insurance on shipment ………………………………………………
Cleaning and refurbishing ………………………………………….
Wild and Shaw Financial and Managerial Accounting 9e Solutions Manual: Chapter 5
388
Exercise 5-3 (30 minutes)
a. Specific Identification
Date
Goods Available for Sale
Cost of Goods Sold
Ending Inventory
Jan. 1
140 @ $6.00 = $840
125 @ $6.00 = $ 750
15 @ $6.00 = $ 90
Jan. 20
Jan. 30
180 @ $4.50 = $810
Total
b. Weighted Average—Perpetual
Date
Goods Purchased
Cost of Goods Sold
Inventory Balance
1/1
140 @ $6.00
= $ 840.00
1/10
100 @ $6.00 = $ 600.00
40 @ $6.00
= $ 240.00
1/20
(avg. cost is $5.40)
1/25
80 @ $5.40 = $ 432.00
20 @ $5.40
= $ 108.00
1/30
(avg. cost is $4.59)
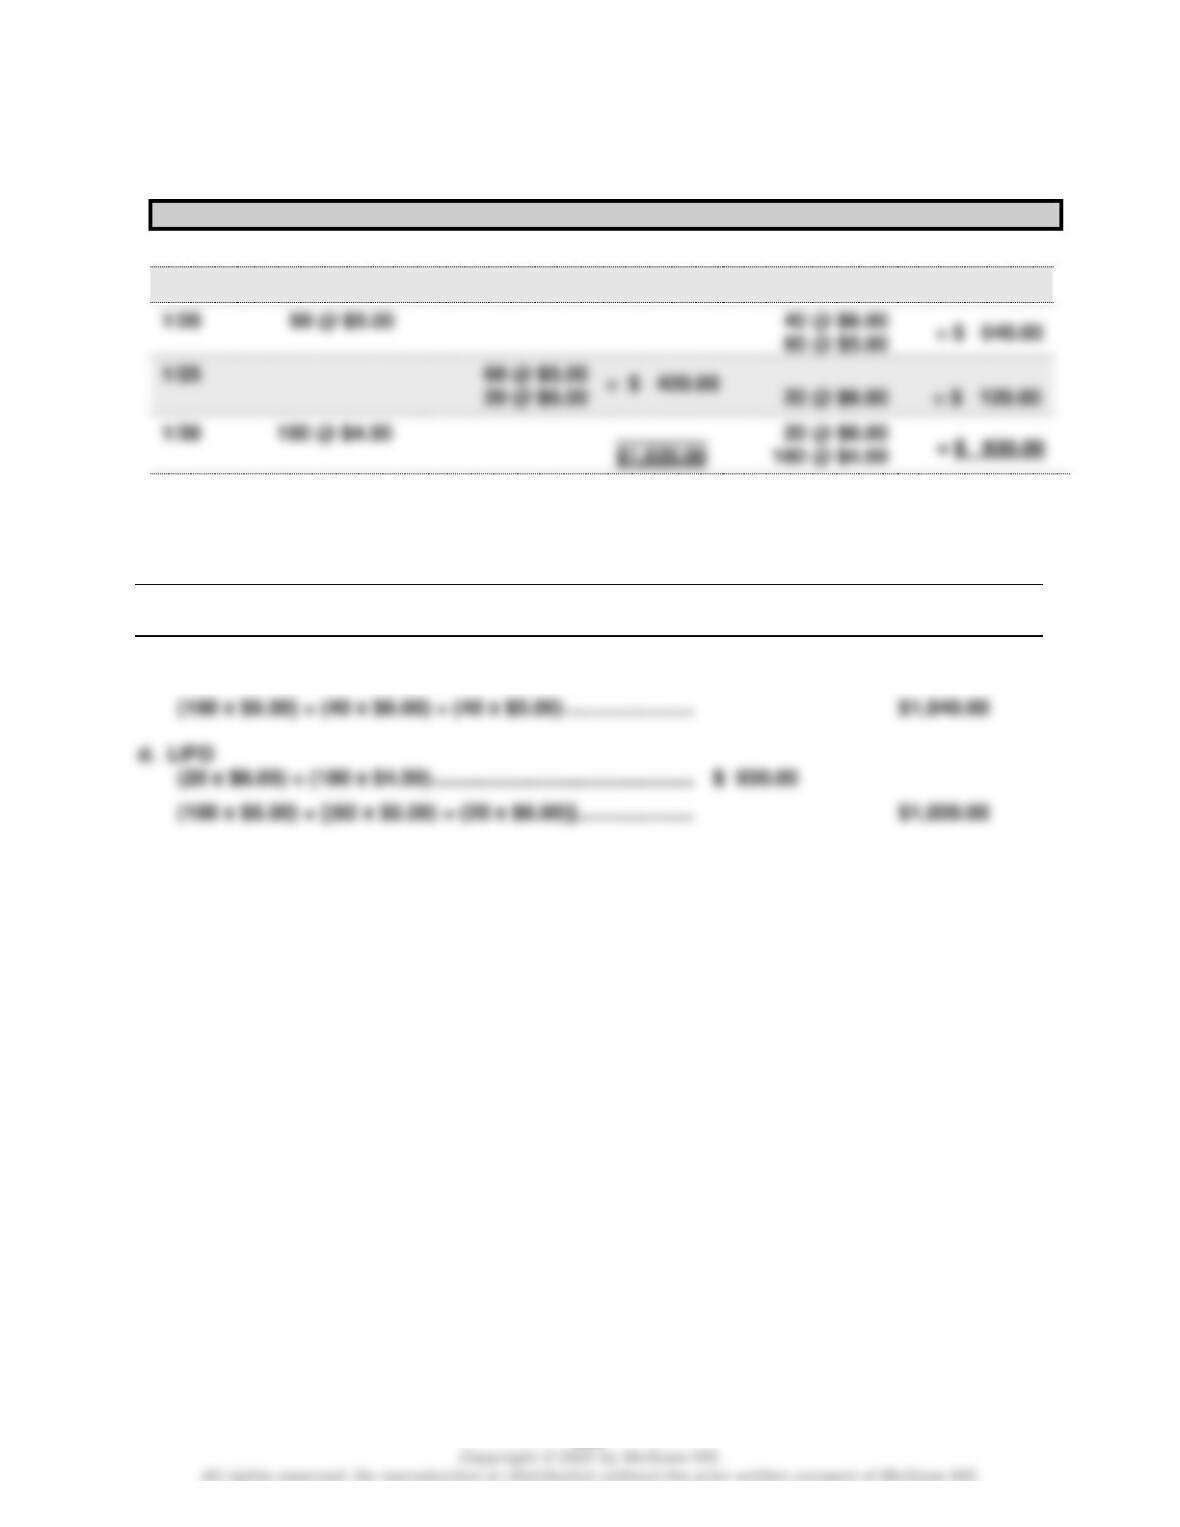
c. FIFO—Perpetual
Date
Goods Purchased
Cost of Goods Sold
Inventory Balance
1/1
140 @ $6.00
= $ 840.00
1/10
100 @ $6.00 = $ 600.00
40 @ $6.00
= $ 240.00
1/20
1/25
40 @ $6.00
40 @ $5.00
20 @ $5.00
1/30
180 @ $4.50
Wild and Shaw Financial and Managerial Accounting 9e Solutions Manual: Chapter 5
389
Exercise 5-3 (continued)
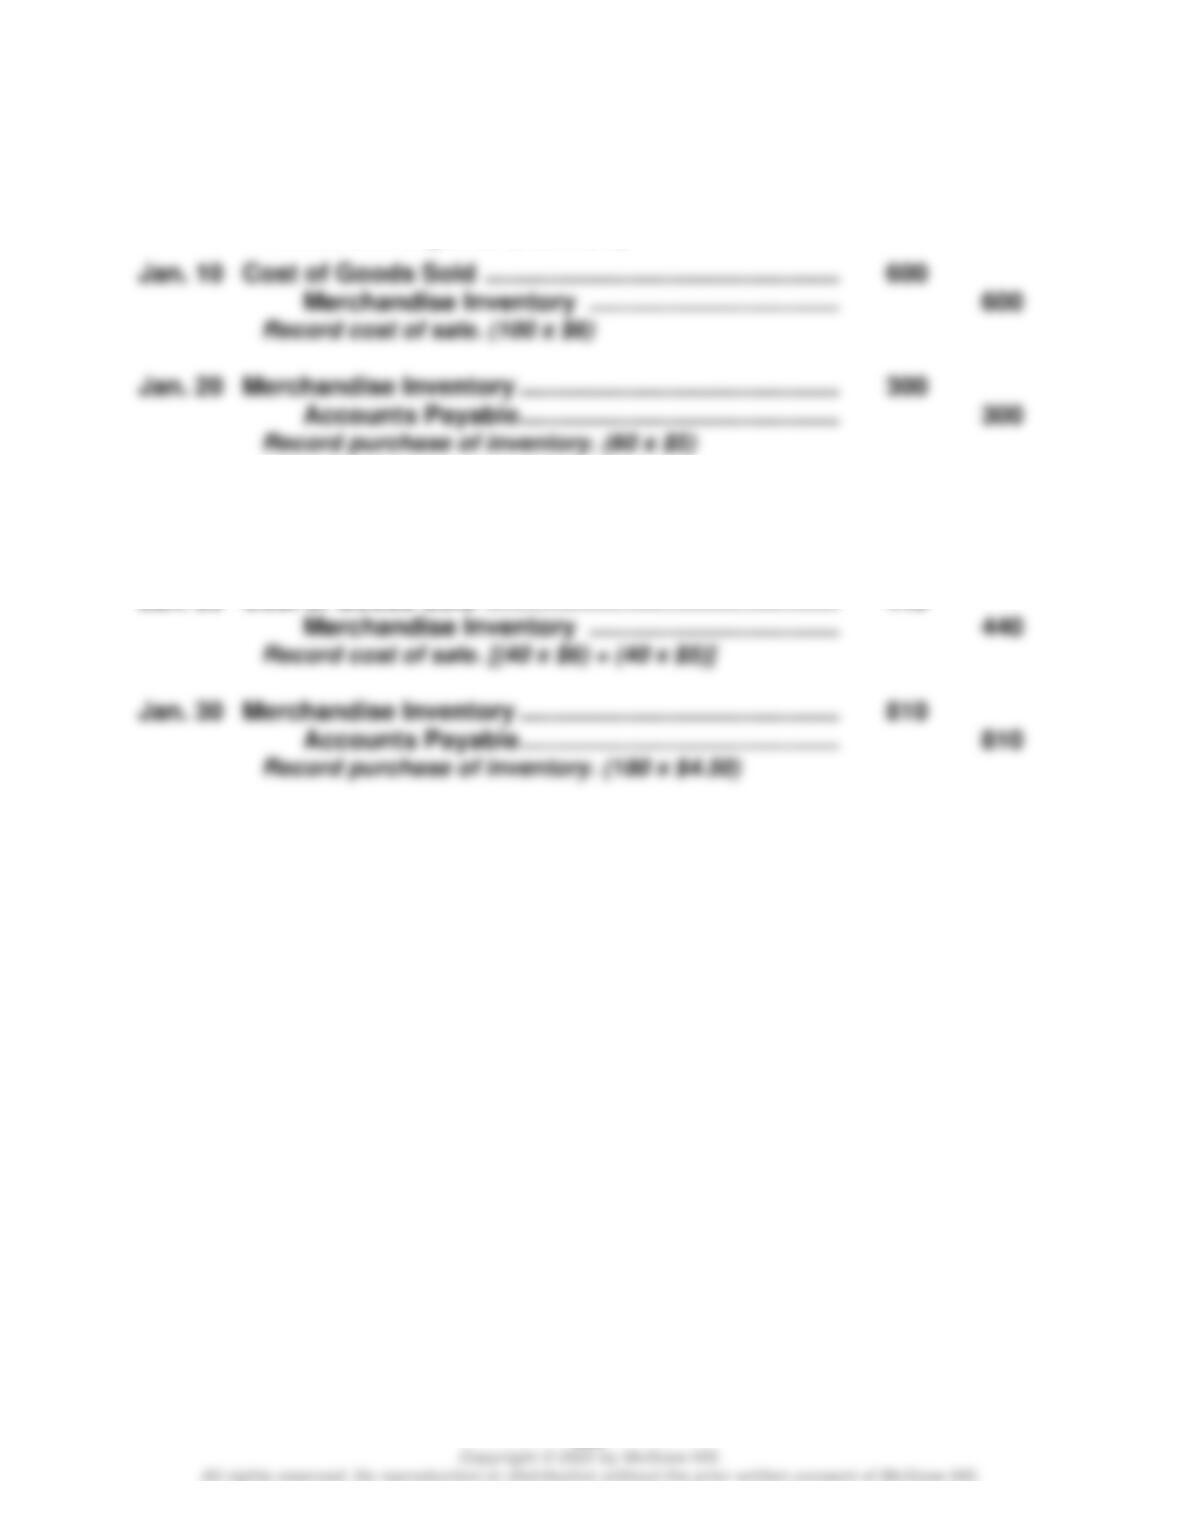
d. LIFO—Perpetual
Date
Goods Purchased
Cost of Goods Sold
Inventory Balance
1/1
140 @ $6.00
= $ 840.00
1/10
100 @ $6.00 = $ 600.00
40 @ $6.00
= $ 240.00
20 @ $6.00
20 @ $6.00
180 @ $4.50
Alternate Solution Format for FIFO and LIFO Perpetual
Ending Cost of
Computations Inventory Goods Sold
c. FIFO
(180 x $4.50) + (20 x $5.00) ……………………………………….. $ 910.00
Wild and Shaw Financial and Managerial Accounting 9e Solutions Manual: Chapter 5
390
Exercise 5-4 (20 minutes)
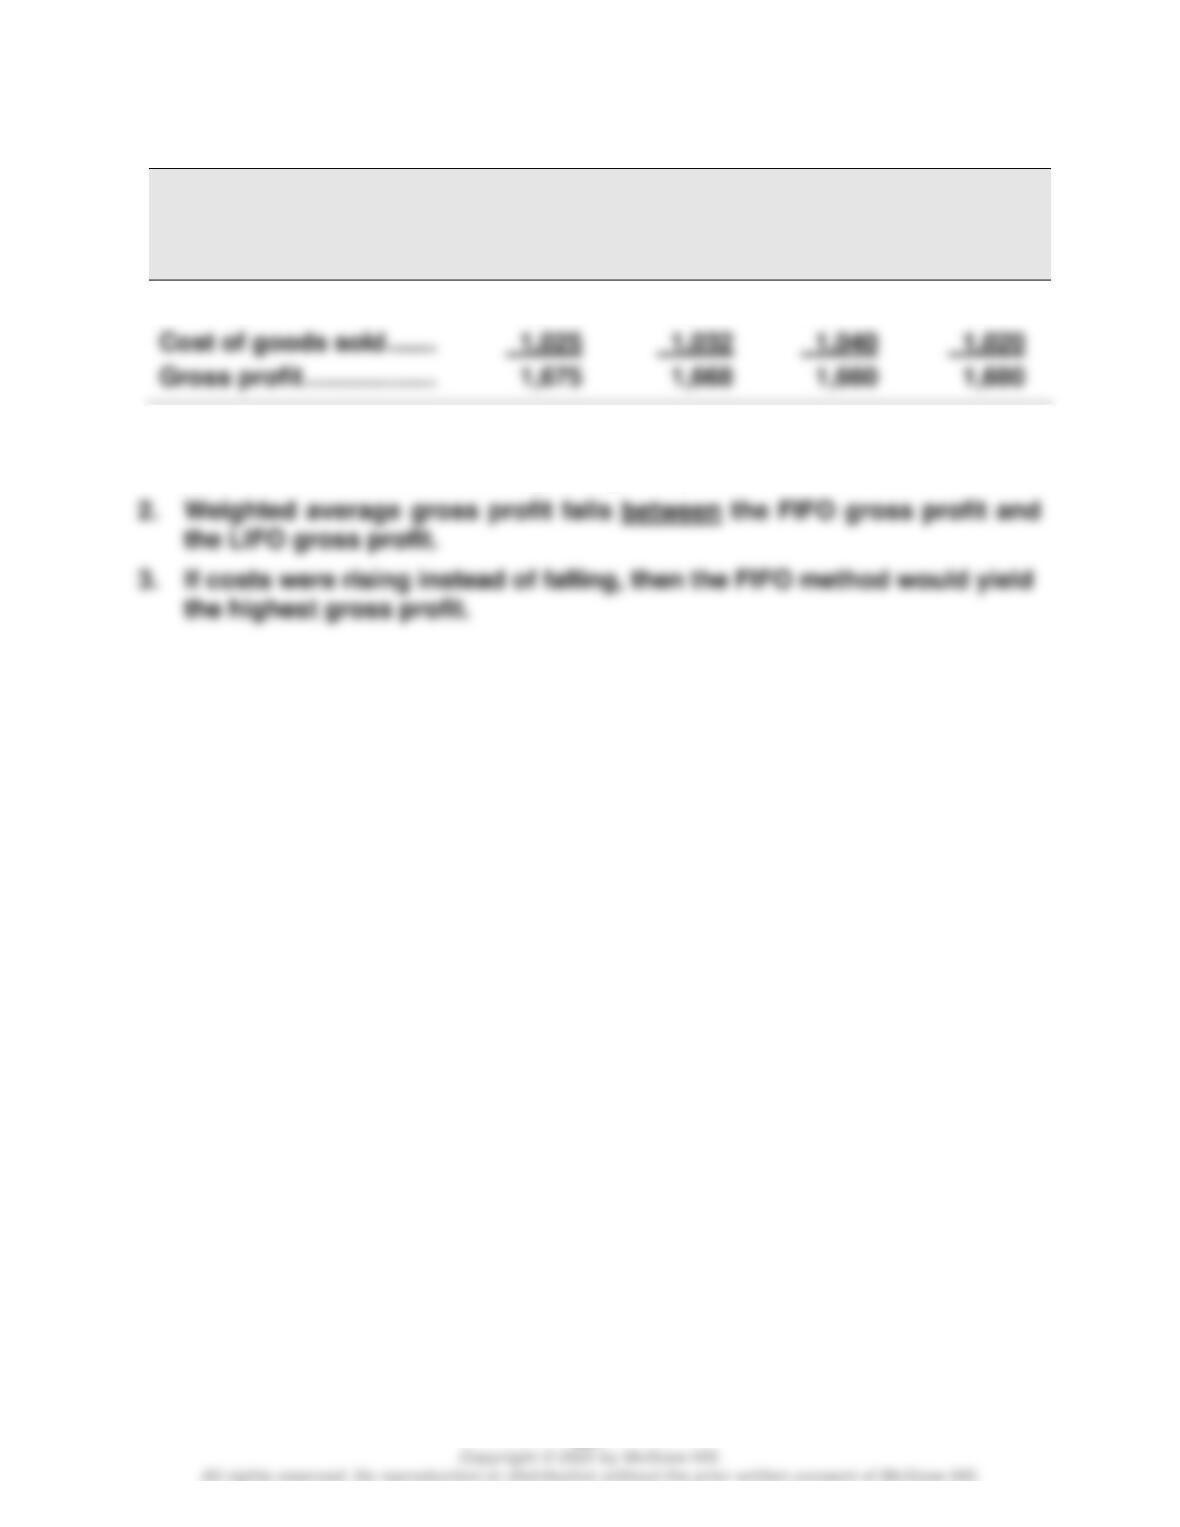
Jan. 10 Accounts Receivable ………………………………………… 1,500
Sales …………………………………………………………. 1,500
Record sale of goods. (100 x $15)
Jan. 25 Accounts Receivable ………………………………………… 1,200
Sales …………………………………………………………. 1,200
Record sale of goods. (80 x $15)
Jan. 25 Cost of Goods Sold …………………………………………… 440
Wild and Shaw Financial and Managerial Accounting 9e Solutions Manual: Chapter 5
391
Exercise 5-5 (20 minutes)
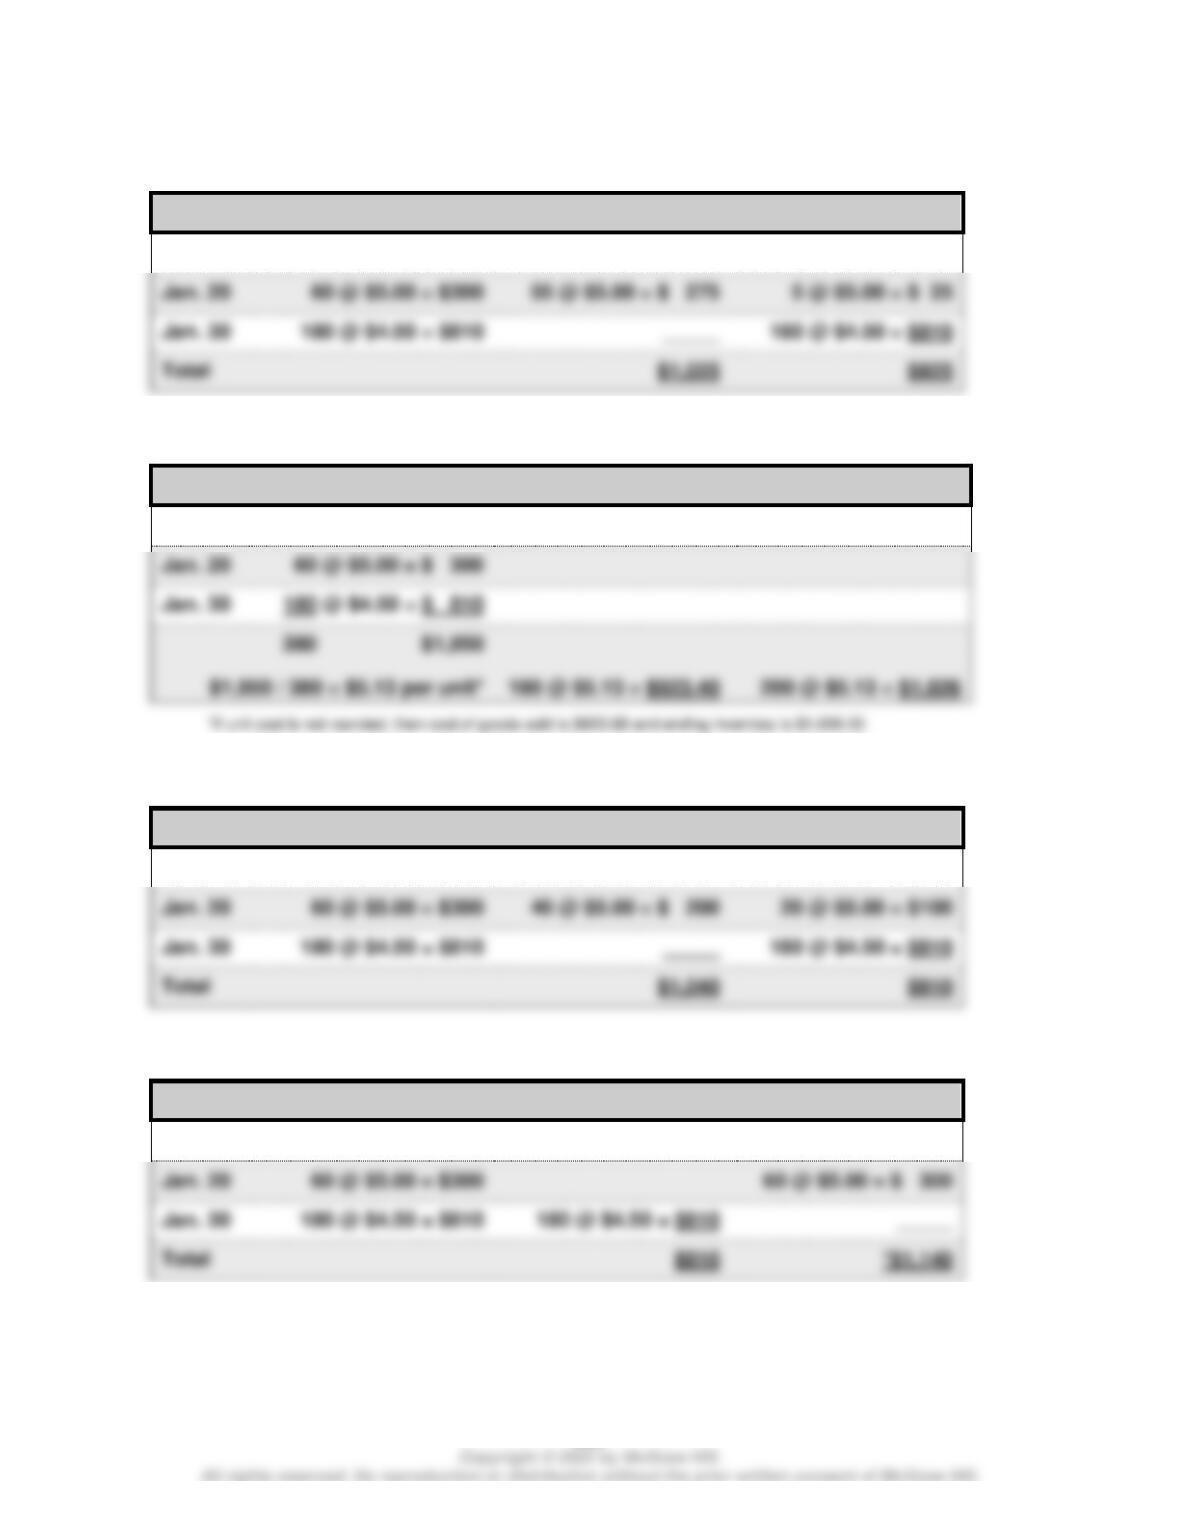
LAKER COMPANY
For Month Ended January 31
Specific
Identification
Weighted
Average
FIFO
LIFO
Sales (180 units x $15 price)
$2,700
$2,700
$2,700
$2,700
1. LIFO method results in the highest gross profit.
Wild and Shaw Financial and Managerial Accounting 9e Solutions Manual: Chapter 5
392
Exercise 5-6A (35 minutes)
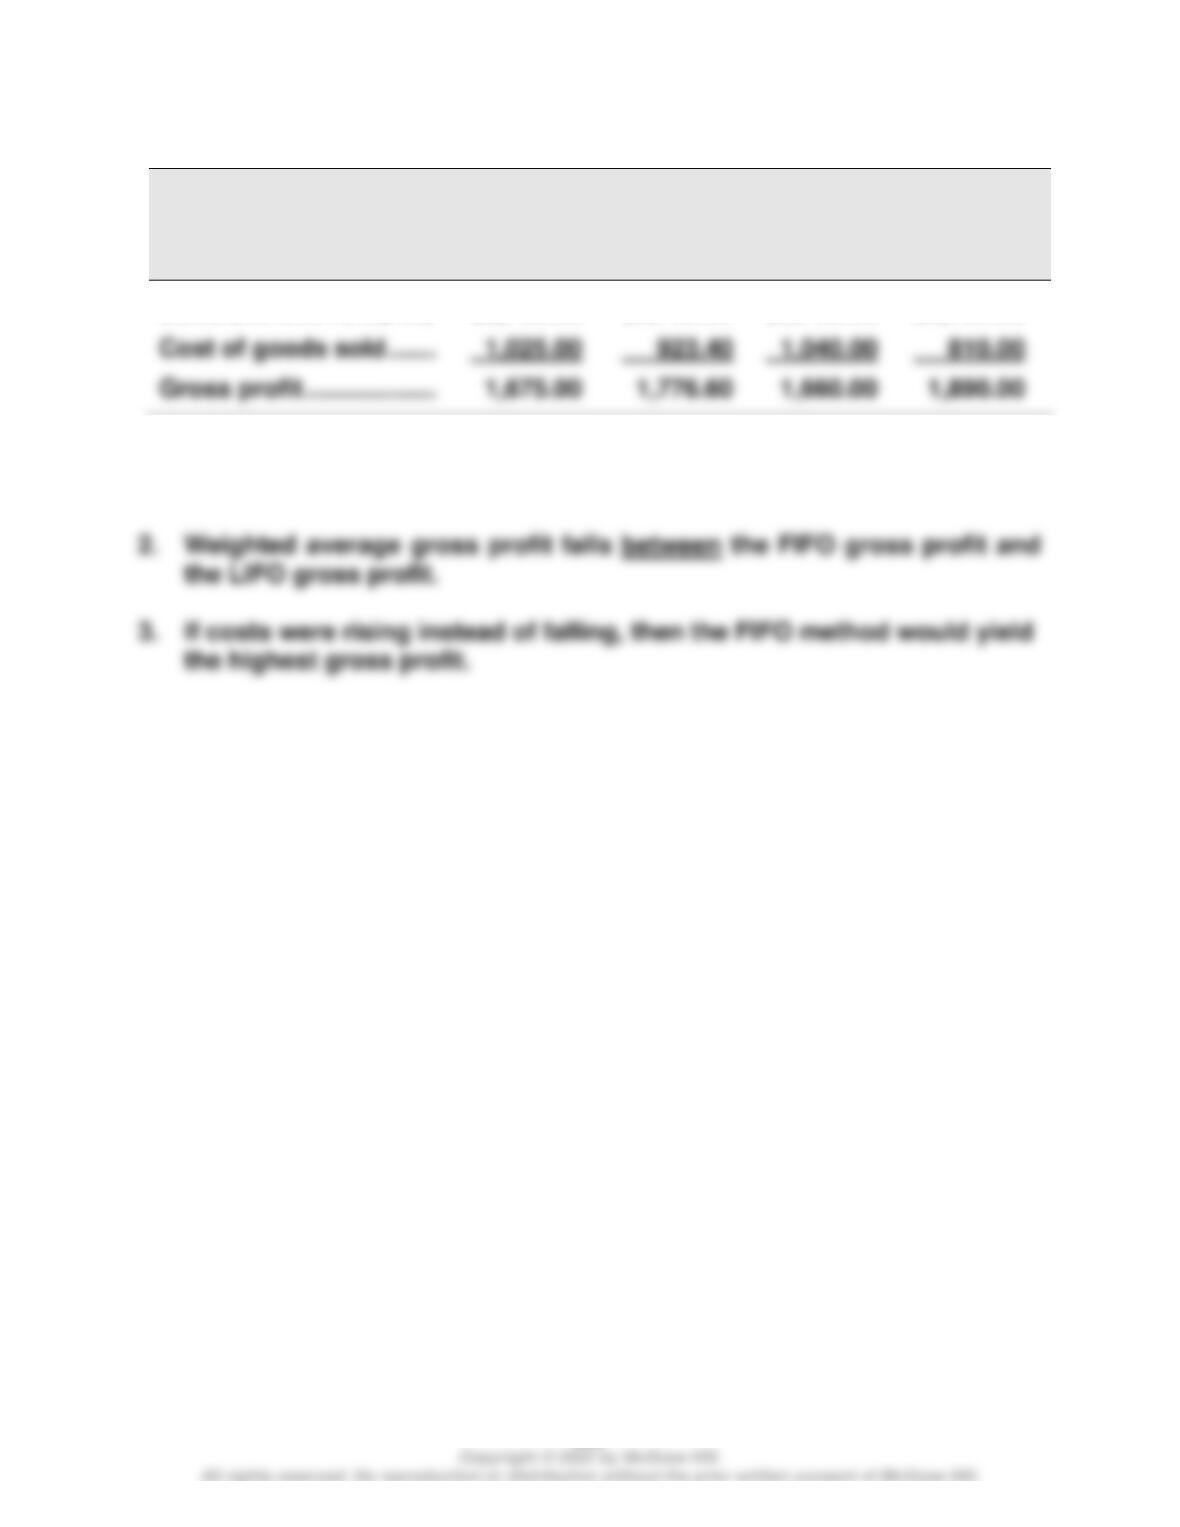
a. Specific Identification
Date
Goods Available for Sale
Cost of Goods Sold
Ending Inventory
Jan. 1
140 @ $6.00 = $840
125 @ $6.00 = $ 750
15 @ $6.00 = $ 90
Jan. 20
b. Weighted Average—Periodic
Date
Goods Available for Sale
Cost of Goods Sold
Ending Inventory
Jan. 1
140 @ $6.00 = $ 840
Jan. 20
60 @ $5.00 = $ 300
c. FIFO—Periodic
Date
Goods Available for Sale
Cost of Goods Sold
Ending Inventory
Jan. 1
140 @ $6.00 = $840
140 @ $6.00 = $ 840
Jan. 20
20 @ $5.00 = $100
d. LIFO—Periodic
Date
Goods Available for Sale
Cost of Goods Sold
Ending Inventory
Jan. 1
140 @ $6.00 = $840
140 @ $6.00 = $ 840
Jan. 20
60 @ $5.00 = $ 300
Wild and Shaw Financial and Managerial Accounting 9e Solutions Manual: Chapter 5
393
Exercise 5-7A (20 minutes)
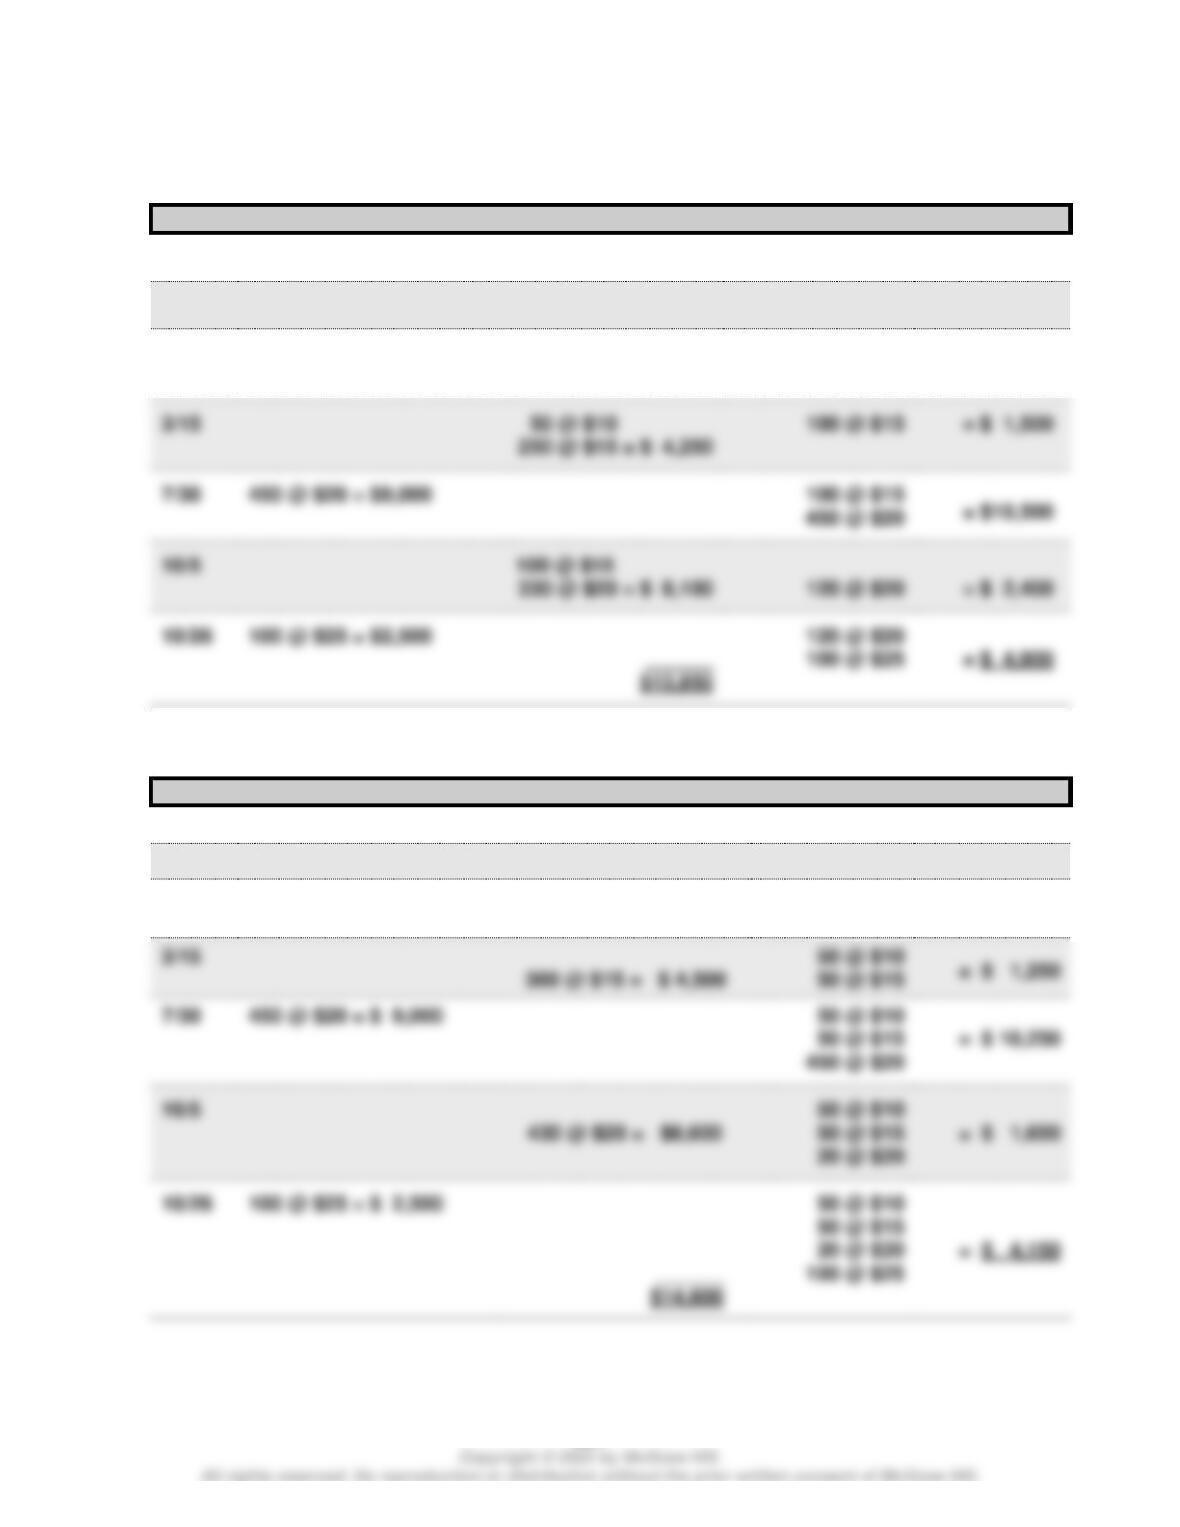
LAKER COMPANY
For Month Ended January 31
Specific
Identification
Weighted
Average
FIFO
LIFO
Sales (180 units x $15 price)
$2,700.00
$2,700.00
$2,700.00
$2,700.00
1. LIFO method results in the highest gross profit.
Wild and Shaw Financial and Managerial Accounting 9e Solutions Manual: Chapter 5
394
Exercise 5-8 (20 minutes)
a. FIFO—Perpetual
Date
Goods Purchased
Cost of Goods Sold
Inventory Balance
1/1
200 @ $10
= $ 2,000
1/10
150 @ $10 = $ 1,500
50 @ $10
= $ 500
3/14
350 @ $15 = $5,250
50 @ $10
= $ 5,750
350 @ $15
3/15
7/30
450 @ $20 = $9,000
450 @ $20
10/5
120 @ $20
10/26
100 @ $25 = $2,500
b. LIFO—Perpetual
Date
Goods Purchased
Cost of Goods Sold
Inventory Balance
1/1
200 @ $10
= $ 2,000
1/10
150 @ $10 = $ 1,500
50 @ $10
= $ 500
3/14
350 @ $15 = $ 5,250
50 @ $10
= $ 5,750
350 @ $15
3/15
50 @ $10
= $ 1,250
7/30
450 @ $20 = $ 9,000
50 @ $10
50 @ $15
50 @ $15
10/26
100 @ $25 = $ 2,500
50 @ $10
50 @ $15
20 @ $20
Wild and Shaw Financial and Managerial Accounting 9e Solutions Manual: Chapter 5
395
Exercise 5-8 (Concluded)
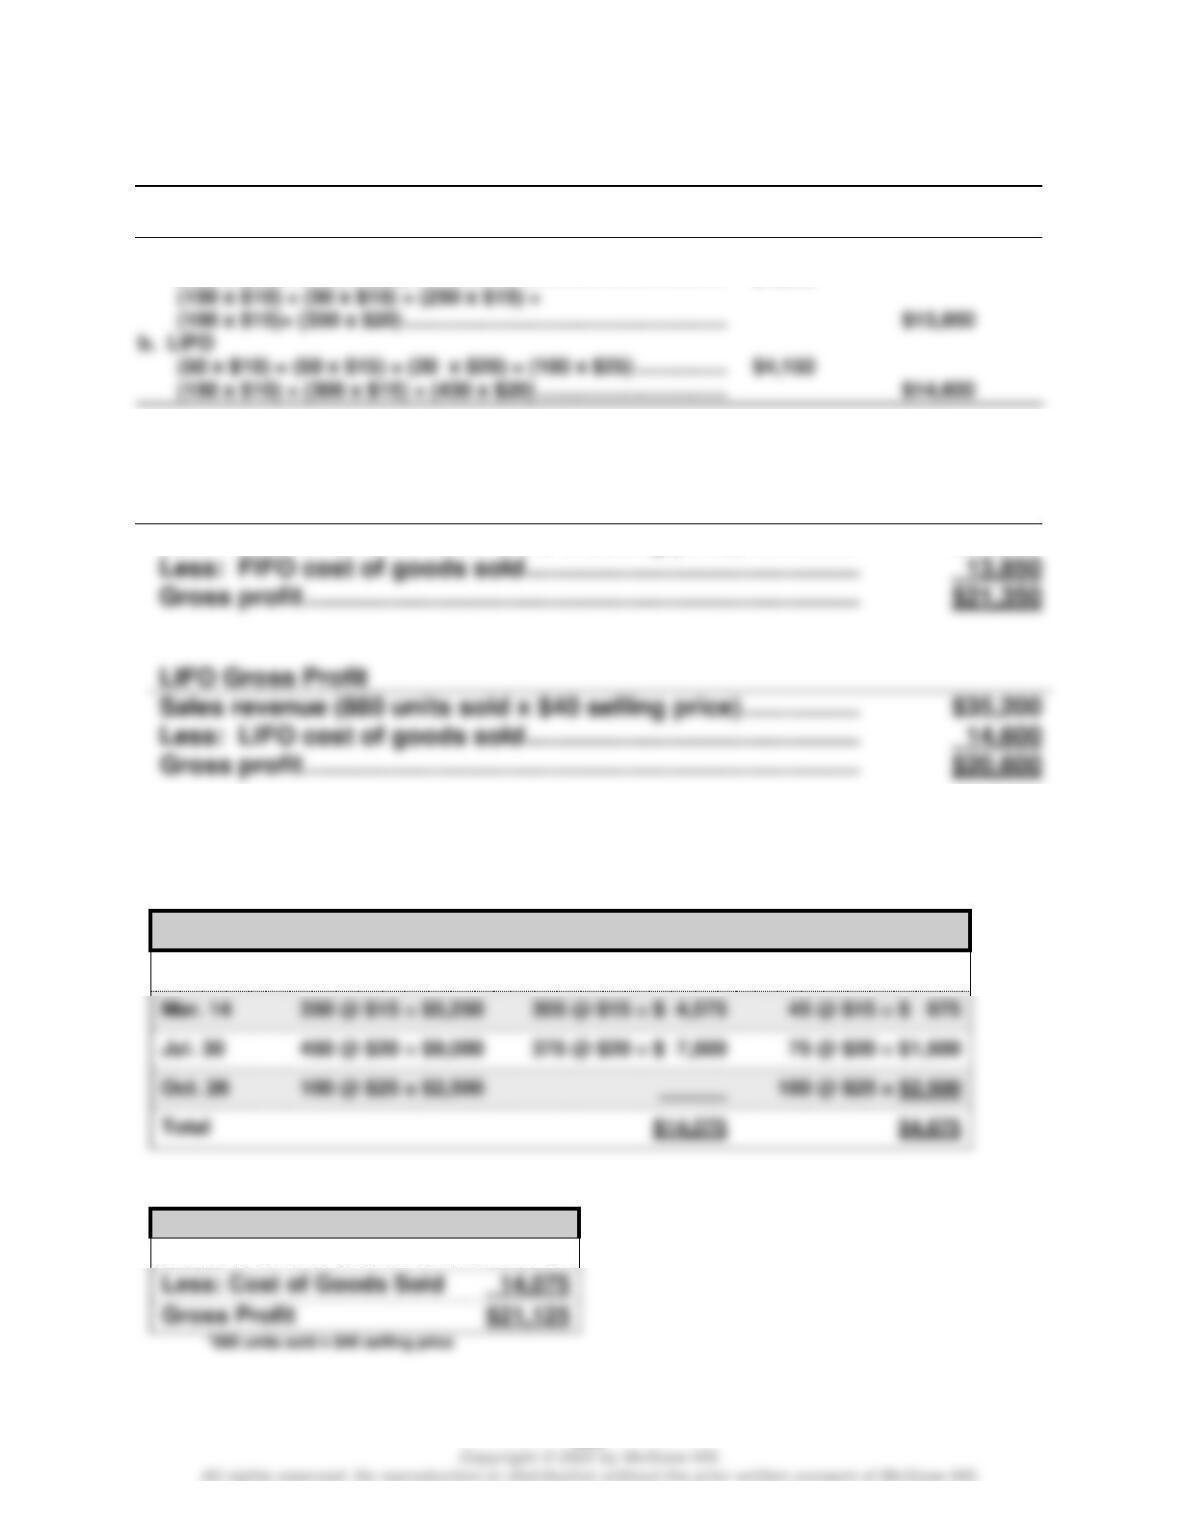
Alternate Solution Format
Ending Cost of
Inventory Goods Sold
a. FIFO
(100 x $25) + (120 x $20) ………………………………………………… $4,900
c. Gross Profit Calculations
FIFO Gross Profit
Sales revenue (880 units sold x $40 selling price) ……………..
$35,200
Gross profit ……………………………………………………………………..
$21,350
Sales revenue (880 units sold x $40 selling price) ……………..
$35,200
Exercise 5-9 (15 minutes)
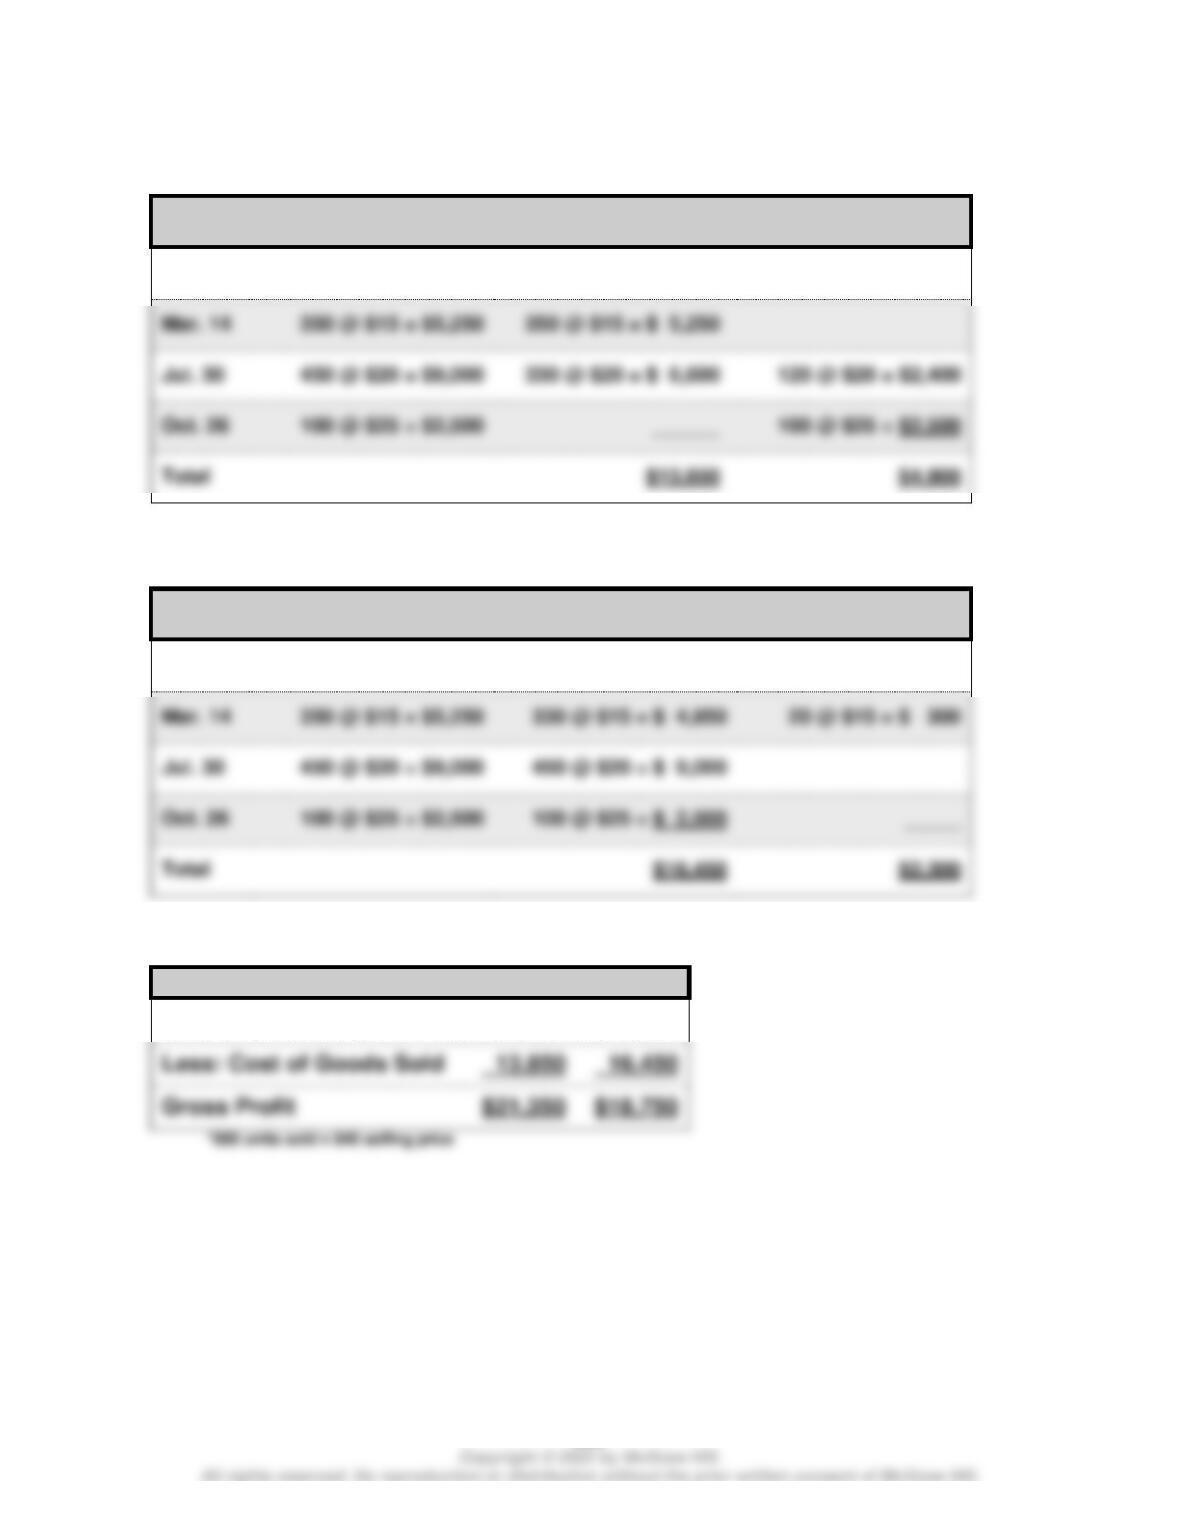
a. Specific Identification
Date
Goods Available for Sale
Cost of Goods Sold
Ending Inventory
Jan. 1
200 @ $10 = $2,000
200 @ $10 = $ 2,000
b. Gross Profit
Specific Identification
Sales*
$35,200
Gross Profit
$21,125
Wild and Shaw Financial and Managerial Accounting 9e Solutions Manual: Chapter 5
396
Exercise 5-10A (20 minutes)
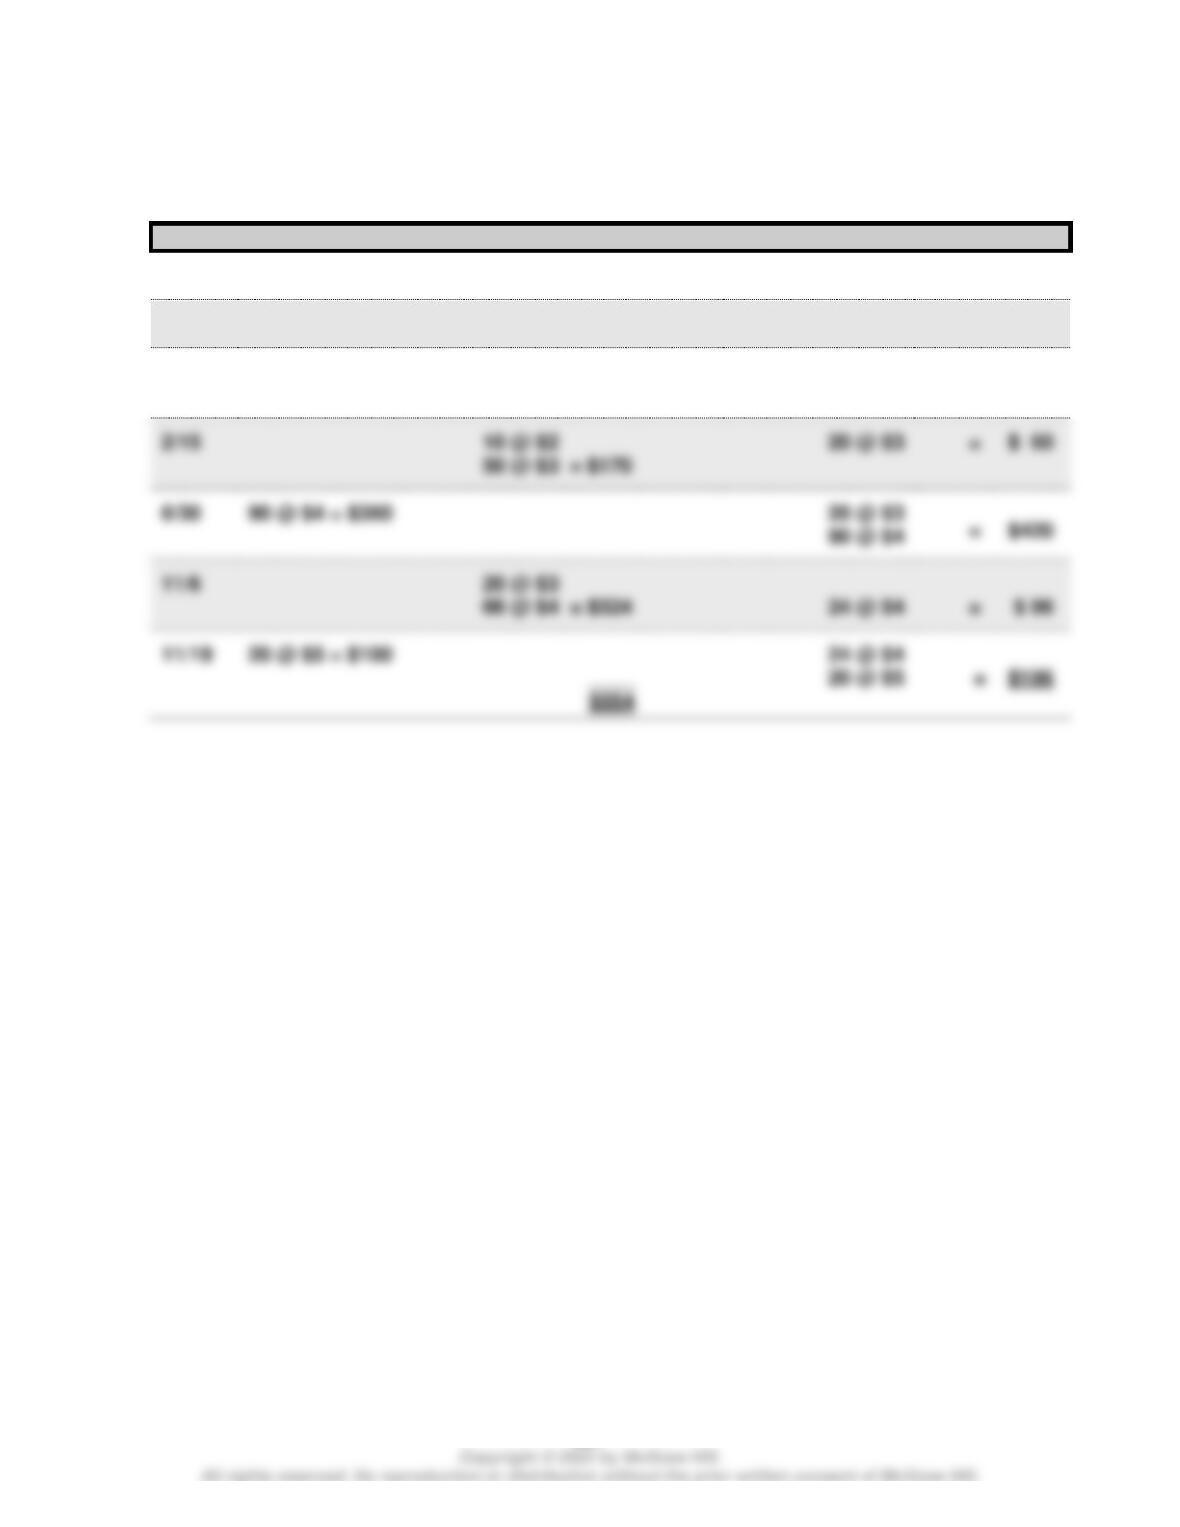
a. FIFO—Periodic
Date
Goods Available for Sale
Cost of Goods Sold
Ending Inventory
Jan. 1
200 @ $10 = $2,000
200 @ $10 = $ 2,000
Mar. 14
350 @ $15 = $5,250
Jul. 30
450 @ $20 = $9,000
120 @ $20 = $2,400
Oct. 26
100 @ $25 = $2,500
100 @ $25 = $2,500
Total
b. LIFO—Periodic
Date
Goods Available for Sale
Cost of Goods Sold
Ending Inventory
Jan. 1
200 @ $10 = $2,000
200 @ $10 = $2,000
Mar. 14
350 @ $15 = $5,250
Jul. 30
450 @ $20 = $9,000
Oct. 26
100 @ $25 = $2,500
Total
c.
FIFO
LIFO
Sales*
$35,200
$35,200
Wild and Shaw Financial and Managerial Accounting 9e Solutions Manual: Chapter 5
397
Exercise 5-11 (20 minutes)
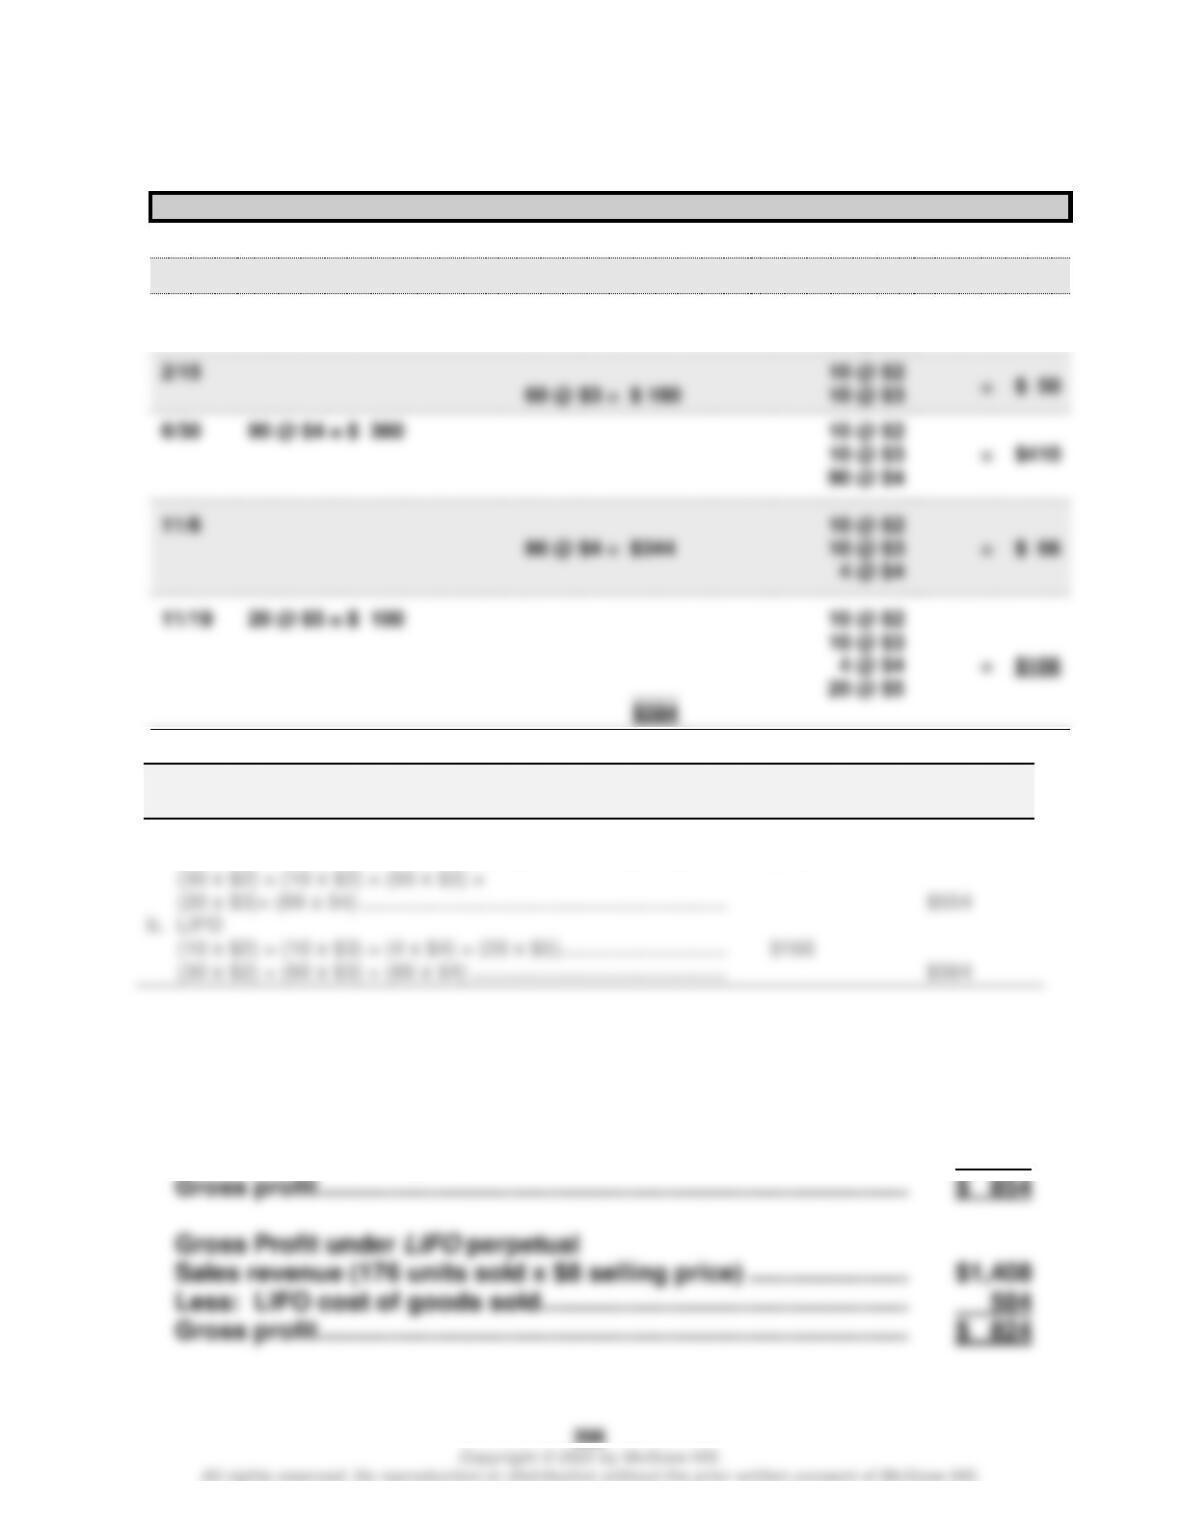
a. FIFO—Perpetual
Date
Goods Purchased
Cost of Goods Sold
Inventory Balance
1/1
40 @ $2
= $ 80
1/3
30 @ $2 = $ 60
10 @ $2
= $ 20
2/14
70 @ $3 = $210
10 @ $2
= $230
70 @ $3
2/15
10 @ $2
6/30
90 @ $4 = $360
20 @ $3
90 @ $4
11/6
20 @ $3
11/19
20 @ $5 = $100
24 @ $4
____
20 @ $5
Wild and Shaw Financial and Managerial Accounting 9e Solutions Manual: Chapter 5
Exercise 5-11 (Concluded)
b. LIFO—Perpetual
Date
Goods Purchased
Cost of Goods Sold
Inventory Balance
1/1
40 @ $2
= $ 80
1/3
30 @ $2 = $ 60
10 @ $2
= $ 20
2/14
70 @ $3 = $ 210
10 @ $2
= $230
70 @ $3
2/15
10 @ $2
60 @ $3 = $ 180
10 @ $3
6/30
90 @ $4 = $ 360
10 @ $2
10 @ $3
11/6
86 @ $4 = $344
10 @ $3
11/19
20 @ $5 = $ 100
10 @ $2
10 @ $3
Ending Cost of
Alternate Solution Format Inventory Goods Sold
a. FIFO
(20 x $5) + (24 x $4) ……………………………………………………….. $196
c. Gross Profit Computations
Gross Profit under FIFO perpetual
Sales revenue (176 units sold x $8 selling price) …………………..
$1,408
Less: FIFO cost of goods sold…………………………..…………………
554
$ 854
Sales revenue (176 units sold x $8 selling price) …………………..
$1,408
Less: LIFO cost of goods sold…………………………..…………………
584