LO 5-8 Evaluate the advantages and disadvantages of alternative cost
estimation methods.
HOW IS AN ESTIMATION METHOD CHOSEN?
• The most informative estimate of cost behavior results from using several methods because
each has the potential to provide information that the others do not.
o In general, the more sophisticated methods yield more accurate cost estimates than the
simpler methods do.
o However, even a sophisticated method yields only an imperfect estimate of an unknown
cost behavior pattern.
• Data Problems
o No matter which method is used to estimate costs, the results are only as good as the data
used.
▪ Using past costs and activity to predict future costs may be useful if a company’s
operations have followed a particular pattern in the past and the pattern is expected to
continue in the future.
• Effect of Different Methods on Cost Estimates
LO 5-9 (Appendix A) Use Microsoft Excel to perform a regression analysis.
APPENDIX A: REGRESSION ANALYSIS USING MICROSOFT EXCEL
• Using Microsoft Excel to Estimate Regression Coefficients
o The following steps are based on Version 16 of Excel (part of Microsoft Office 2016).
▪ Step 1: Ensure you have the Analysis TookPak installed. See Exhibits 5.9 and 5.10.
(If not, install it. See Exhibits 5.11 through 5.13.)
▪ Step 2: Enter the data for the Dependent and Independent Variables. See Exhibit 5.15.
LO 5-10 (Appendix B) Understand the mathematical relationship describing
the learning phenomenon.
APPENDIX B: LEARNING CURVES
• Engineers have found the following mathematical relationship for the learning phenomenon:
b
Y aX=
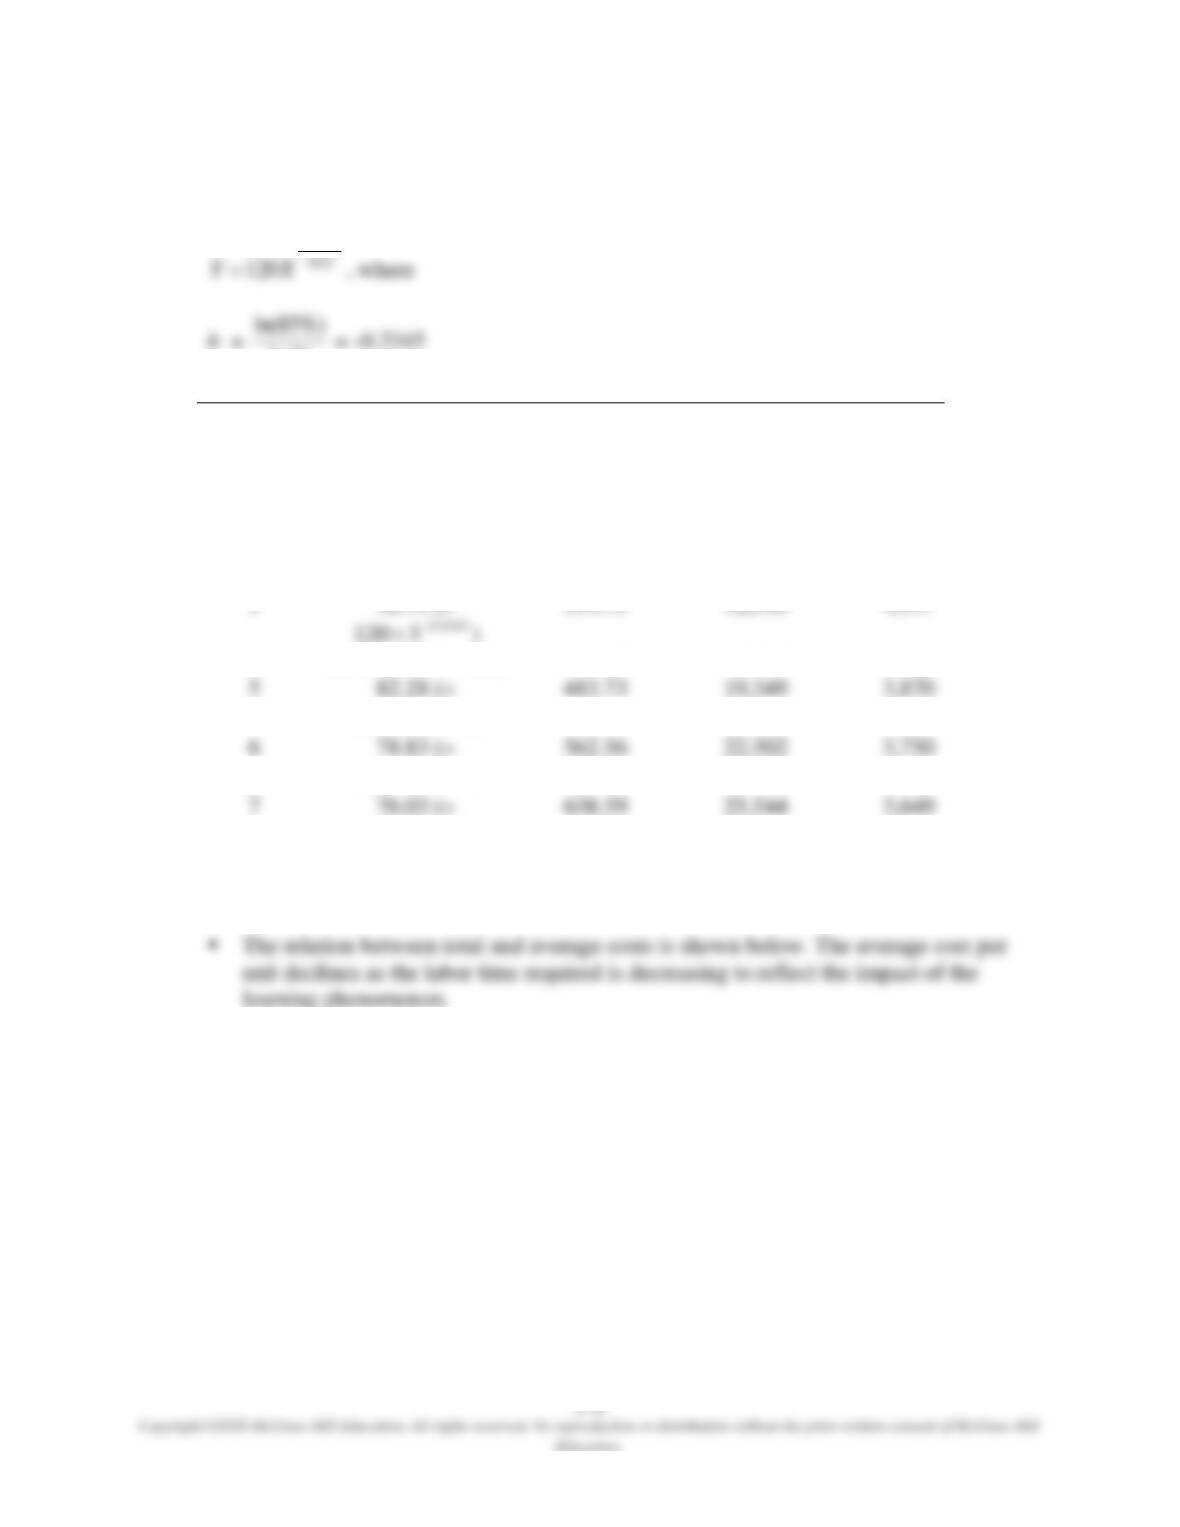
o Example (continued from previous example): With the same incremental unit-time
learning model and an 85 percent learning rate for workers, the labor cost is assumed to
be $40 per hour. The learning curve formula can be used to populate the table showing
the relation between labor time and labor costs. Specifically,
ln(85%)
ln(2)
Unit
Produced
(X)
Labor time
required to produce
the Xth unit
Cumulative
total time
in labor hours
Total cost
(@ $40 per
hour)
Average cost
per unit
1
120 hours
120 hours
$4,800
$4,800
2
102.00 (= 120
× .85)
222
8,880
4,440
)
4
86.70 (= 102 × .85)
401.45
16,058
4,015
0.2345
120 5−
)
0.2345
120 6−
)
0.2345
120 7−
)
8
73.70 (= 86.7 × .85)
712.29
28,492
3,561
…
…
…
…
…
$20,000
$25,000
$30,000
Matching
A.
Account analysis
H.
Independent variable
B.
Adjusted R-squared (R2)
I.
Learning phenomenon
C.
Coefficient of determination
J.
Regression
D.
Correlation coefficient
K.
Relevant range
E.
Dependent variable
L.
Scattergraph
F.
Engineering estimate
M
t-statistic
G.
High-low cost estimation
_____ 1. A cost estimate based on measurement and pricing of the work involved in a task.
_____ 2. Represents the limits within which a cost estimate may be valid.
_____ 3. A graph that plots costs against activity levels.
_____ 4. The value of the estimated coefficient divided by its standard error.
_____ 5. A cost estimation method that calls for a review of each account making up the total
cost being analyzed.
Multiple Choice Answers
1. F
3. L
5. A
7. H
9. J
11. C
13. B
Multiple Choice
1. Cost estimation:
a. is useful for decision making.
b. is based on past cost pattern.
c. differentiates between variable and fixed costs.
d. All of the above.
2. Engineering estimates:
a. are very time consuming.
3. You are asked to conduct an account analysis of overhead. For last month, 450 labor hours
were incurred while spending $12,750 on overhead costs. You determined that fixed
overhead accounted for 40% of total overhead costs. Which of the following statements is
correct?
4. What is the variable overhead per machine hour?
a. $30.50
b. $32.50
c. $35.50
d. $37.50
5. What is the fixed overhead cost?
6. What are the projected overhead costs if next quarter’s activity is expected to be 360 machine
hours?
7. The following shows a partial printout of a regression analysis:
Coefficients
Intercept
6903.83329
X Variable 1
3.02097535
Which of the following statement about this regression analysis is correct?
8. Regression analysis:
a. is always accurate.
b. uses statistical techniques.
c. may involve more than one predictor variable.
d. Both b and c.
9. The data used to estimate cost function:
a. may be misplaced.
10. It takes 80 hours of labor time to complete the first unit of output. Assuming that the
company adopts the individual unit-time learning model with a 90 percent learning rate:
a. the 2nd unit will take 72 hours.
b. the time to finish the 3rd unit can’t be determined.
c. the fourth unit will take 64 hours.
d. direct materials will be reduced because of learning.
11. High-low cost estimation:
a. provides a very precise cost estimate.
12. Which of the following statements about learning is correct?
Multiple Choice Answers
1. d (LO1)
3. b (LO3)
$12,750 × 40% = $5,100 fixed overhead.
4. d (LO4)
$26, 250 $18, 750
450 250
−
−
= $37.50 per machine hour.
5. c (LO4)
$26,250 – ($37.50 × 450) = $9,375 = $18,750 – ($37.50 × 250).
7. d (LO5)
8. d (LO5)
9. a (LO8)
10. a (LO6, LO10)
11. b (LO4)
Demonstration Problem 1
John, a cost analyst for a manufacturing firm, was asked to estimate the overhead costs at one of
the factories. He interviewed the supervisor and several workers there to get a feel of how
overhead costs changed. His experience with the cost accounting system pointed to the use of
Required:
1. What is the general cost equation (TC = F + VX) that describes the relation between
overhead costs and machine hours?
2. If the factory expects to spend 400 machine hours next month, what is the expected amount
of overhead costs?
Demonstration Problem 1 – Solution
Part 1
Total variable overhead costs = Total overhead costs – Total fixed costs
Total variable overhead costs = $103,918 – ($4,620 per month x 12 months) = $48,478
Part 2
Assuming 400 machine hours will be spent next month, the monthly overhead costs can be
estimated using the cost equation as follows:
Total overhead costs = $4,620 per month + $10.73 × Number of machine hours used
Total overhead costs = $4,620 per month + $10.73 × 400 machine hours = $8,912
Demonstration Problem 2
(Continued from Demonstration Problem 1)
John, a cost analyst for a manufacturing firm, was asked to estimate the overhead costs at one of
the factories. He interviewed the supervisor and several workers there to get a feel of how
overhead costs changed. His experience with the cost accounting system pointed to the use of
machine hours as the cost driver for overhead items. Over the last 12 months, the total overhead
costs were $103,918, out of which John determined $4,620 to be fixed cost per month and the
rest variable cost. For the same period of time, 4,519 machine hours were incurred in that factory.
The cost analyst, John, went back to the accounting information system to look for more relevant
data. The following breakdown of the overhead costs and the associated machine hours over the
same 12-month period was available:
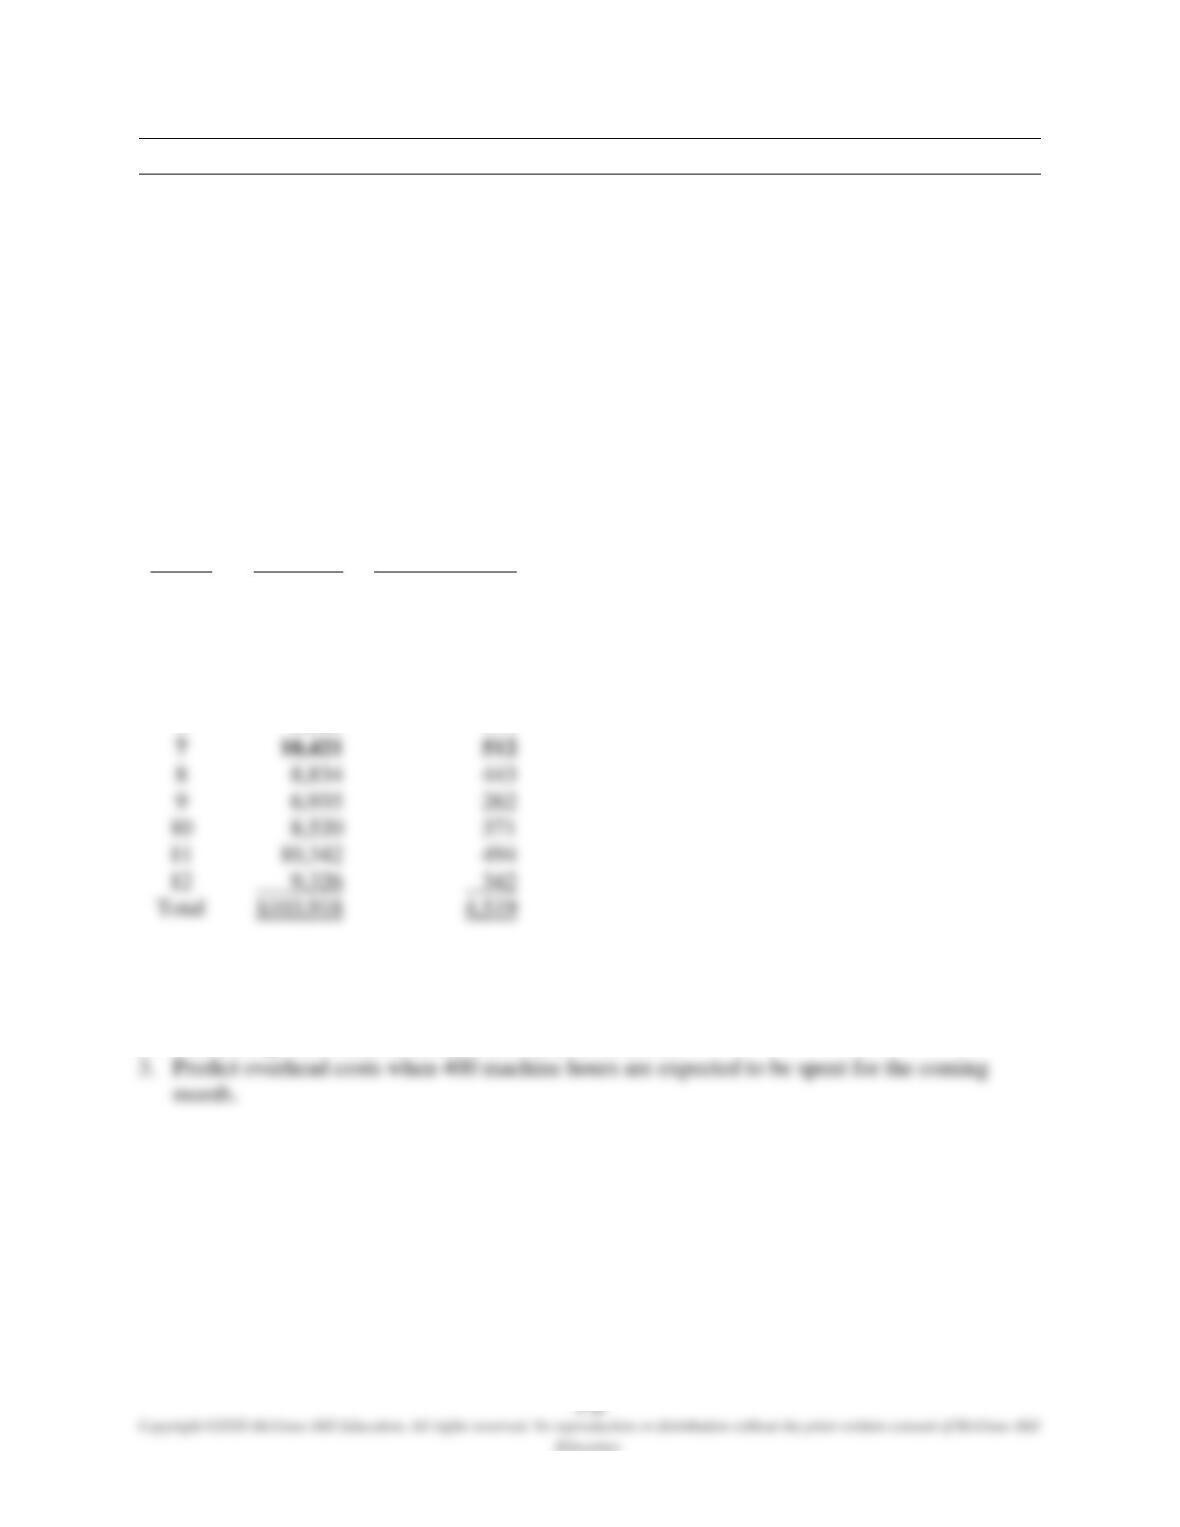
Month
Overhead
Machine Hours
1
$ 7,102
203
2
8,620
319
3
9,120
425
4
7,092
289
5
7,965
388
6
9,641
471
7
512
8
8,834
443
9
6,935
262
8,520
371
494
9,326
$103,918
Required:
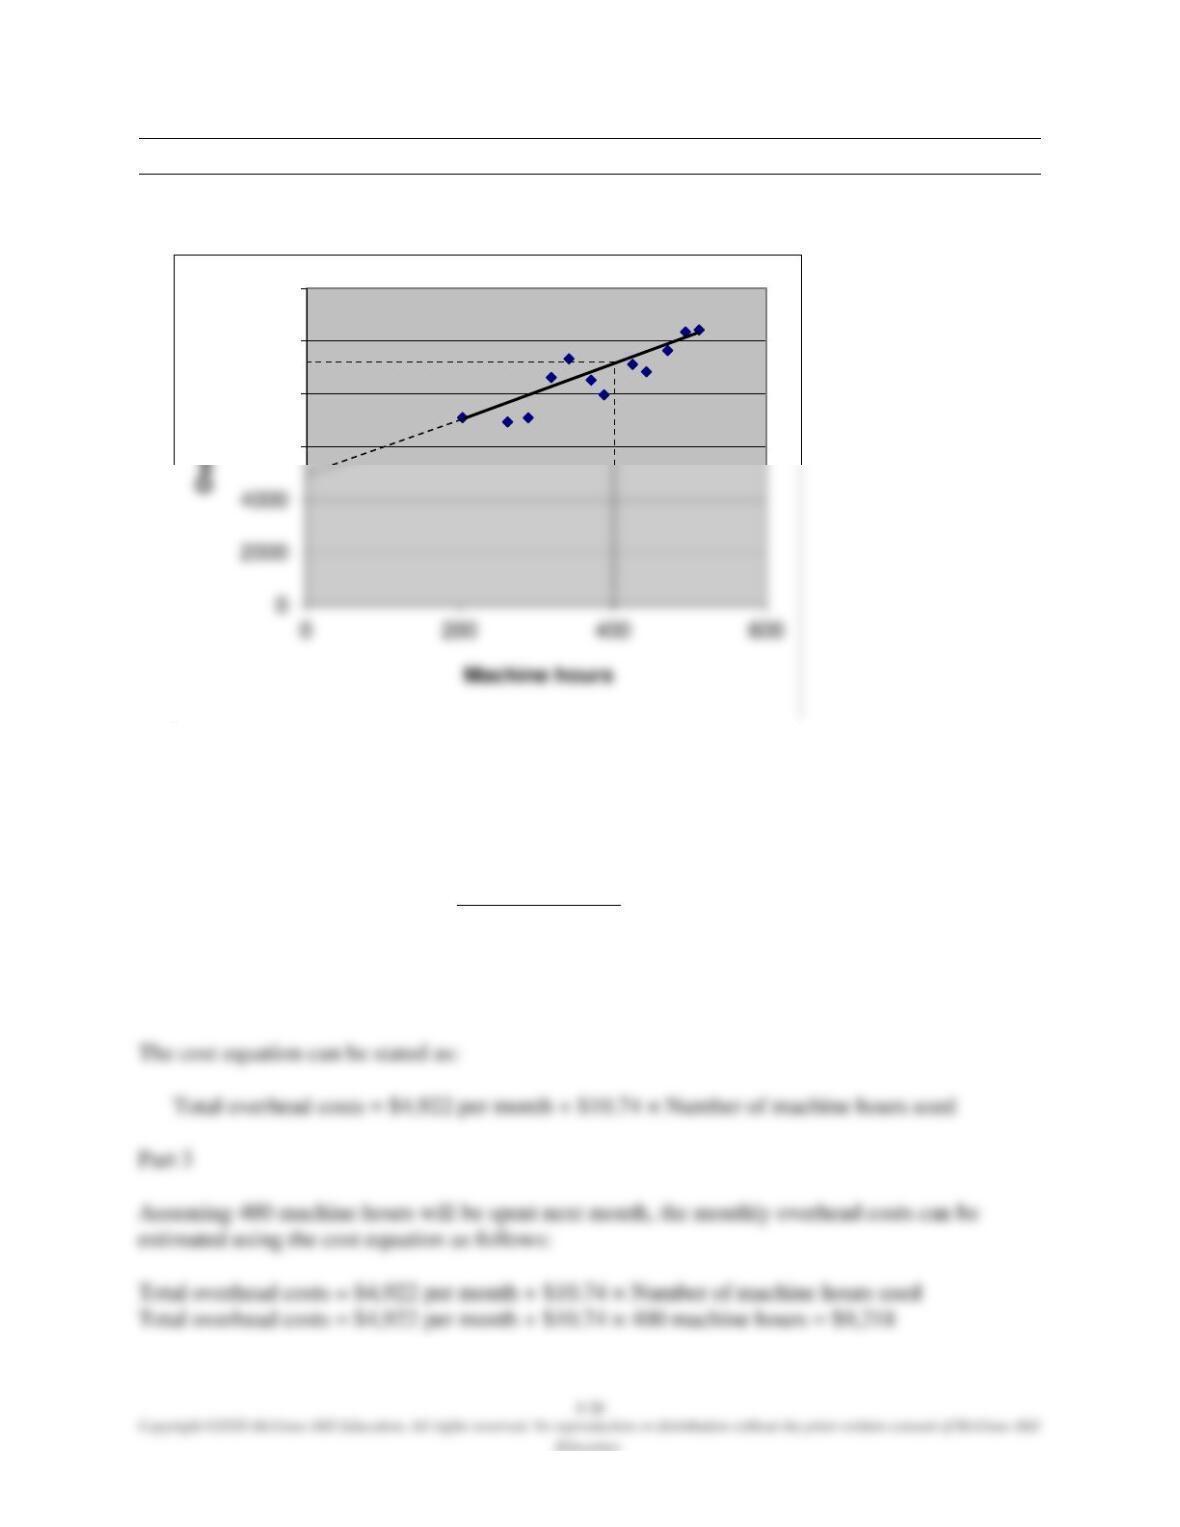
1. Plot the data using scattergraph.
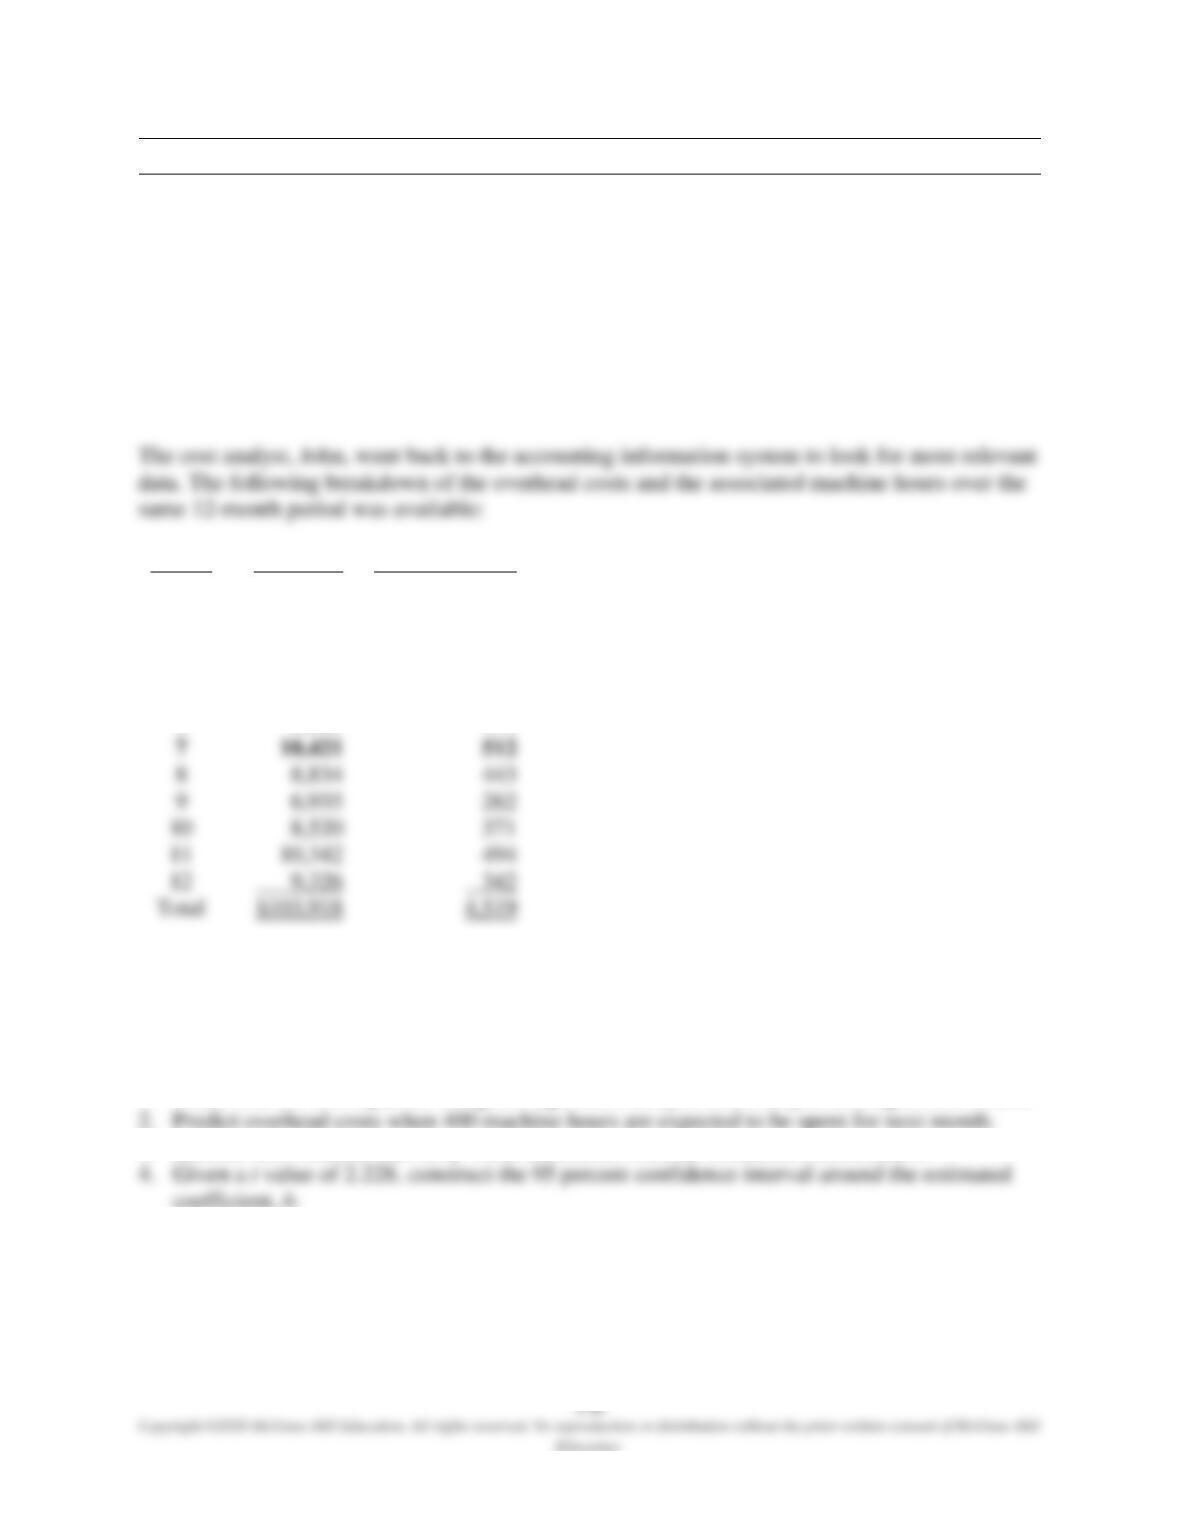
2. Use the high-low method to estimate the cost function.
Demonstration Problem 2 – Solution
Part 1
Part 2
The highest activity was 512 machine hours (MH) with overhead costs of $10,421; the lowest
activity was 203 machine hours (MH) with overhead costs of $7,102.
Variable cost per machine hour =
$10,421 – $7,102
512 MH – 203 MH
= $10.74 per machine hour
Fixed cost = $10,421 – $10.74 × 512 machine hours = $4,922
(Alternatively: Fixed cost = $7,102 – $10.74 × 203 machine hours = $4,922)
6000
8000
10000
12000
Demonstration Problem 3
(Continued from Demonstration Problem 2)
John, a cost analyst for a manufacturing firm, was asked to estimate the overhead costs at one of
the factories. He interviewed the supervisor and several workers there to get a feel of how
overhead costs changed. His experience with the cost accounting system pointed to the use of
machine hours as the cost driver for overhead items. Over the last 12 months, the total overhead
costs were $103,918, out of which John determined $4,620 to be fixed cost per month and the
rest variable cost. For the same period of time, 4,519 machine hours were incurred in that factory.
Month
Overhead
Machine Hours
1
$ 7,102
203
2
8,620
319
3
9,120
425
4
7,092
289
5
7,965
388
6
9,641
471
7
512
8
8,834
443
9
6,935
262
8,520
371
494
9,326
$103,918
John recently attended a workshop on statistical analysis. He was interested in applying the
regression analysis to solve the relation between overhead costs and machine hours.
Required:
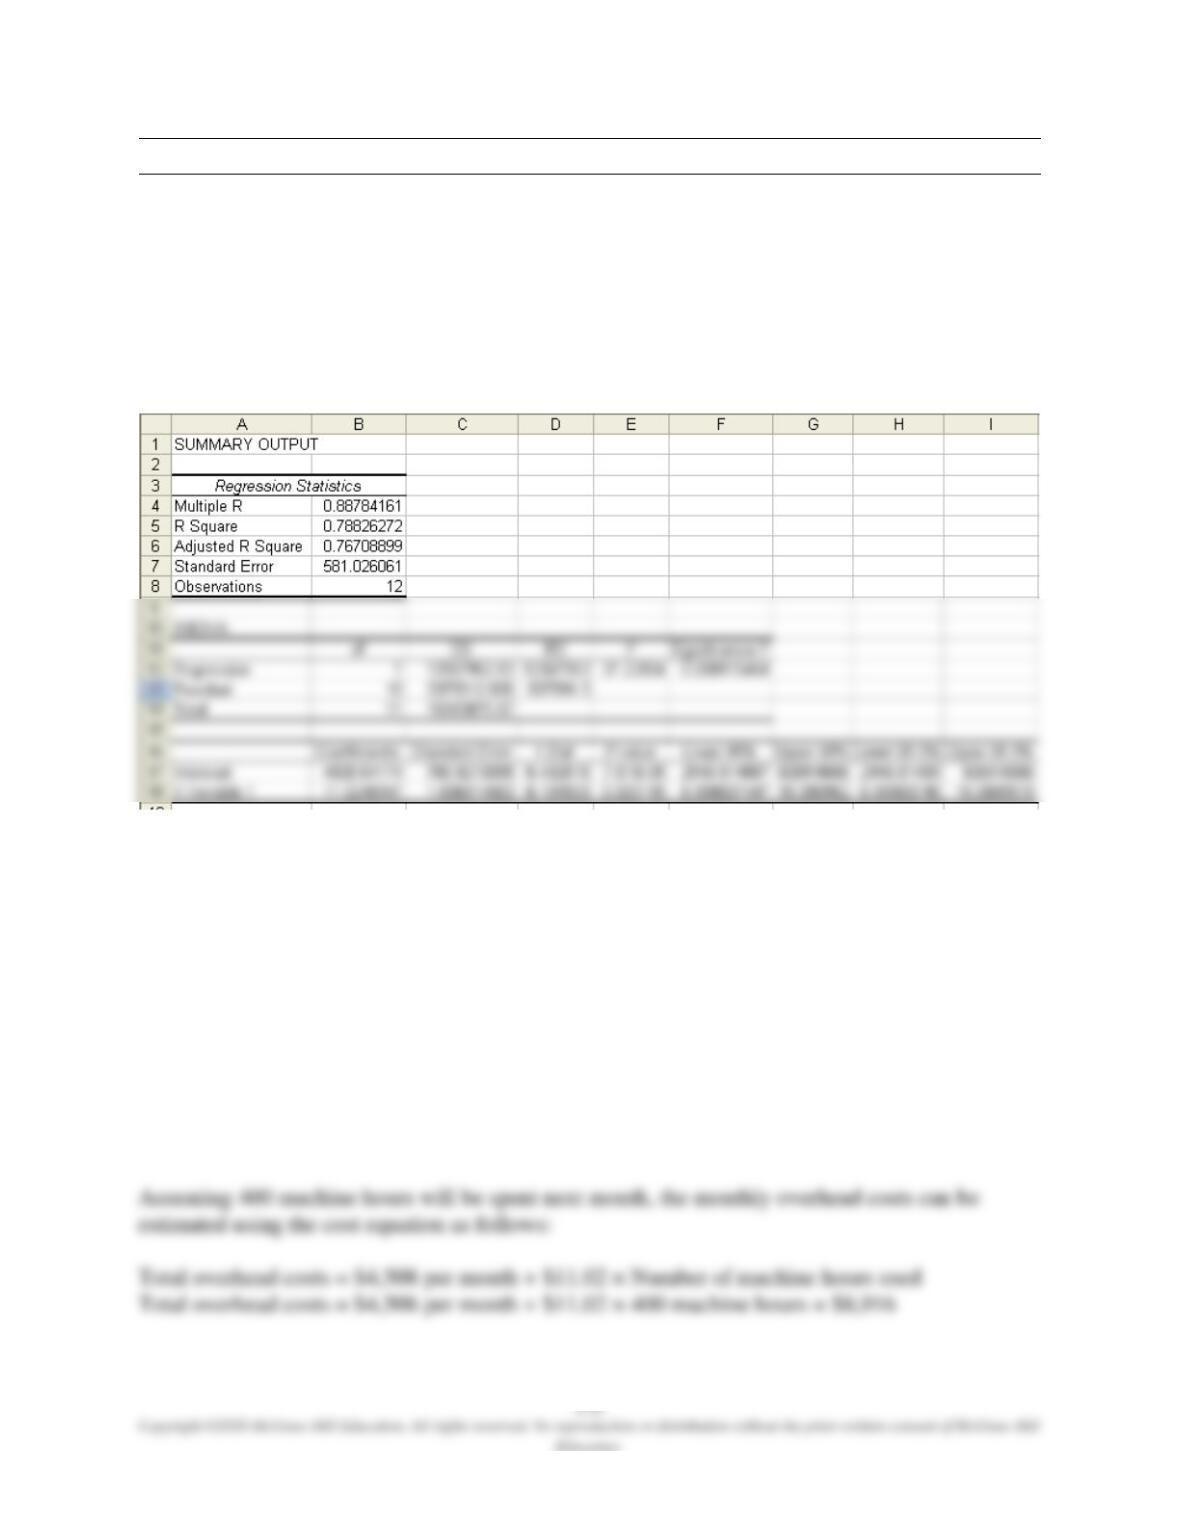
1. Determine the cost equation using the regression analysis and interpret the regression results.
3. Indicate the t-statistic and the p-value associated with the estimated coefficient, b.
Demonstration Problem 3 – Solution
Part 1
John’s analysis indicated that a logical relation exists between overhead costs and machine hours.
Microsoft Excel was used. Data on overhead costs were treated as Y, or the dependent variable.
Data on machine hours were treated as X, or the independent variable.
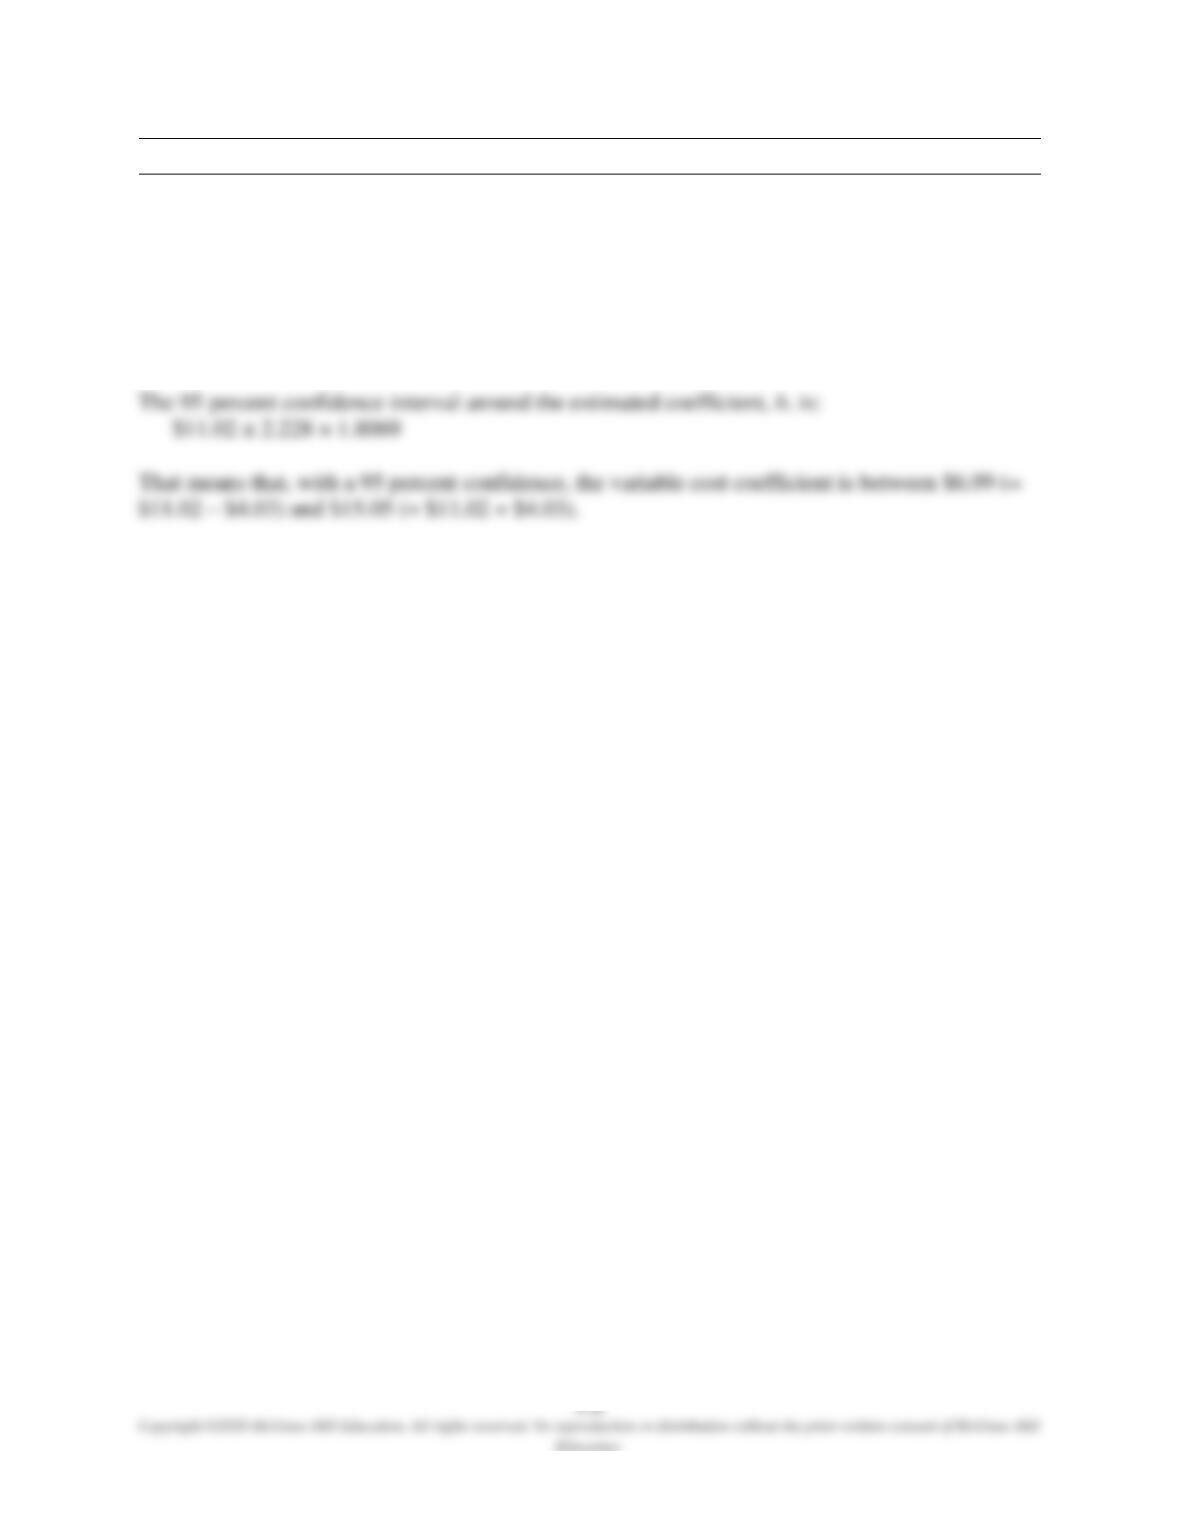
The regression results are as follows:
The intercept represents the fixed costs, while X Variable 1 shows the variable cost per unit of
machine hour.
The cost equation can be stated as:
Overhead costs = $4,508 per month + $11.02 × Number of machine hours used
The correlation coefficient (Multiple R) of 0.888 points to a relatively good linear fit between
machines hours and overhead costs. The coefficient of determination (R square) of 0.788
indicates that the machine hours as the cost driver managed to explain about 78.8% of variations
in overhead costs, which is quite acceptable for accounting data.
Part 2
Demonstration Problem 3 – Solution, continued
Part 3
The t-statistic and the p-value are 6.1015 and 0.000115, respectively. The t-statistic is considered
significant (well above 2.0), as corroborated by a p-value that is close to zero.
Part 4