CHAPTER 5
Cost-Volume-Profit
ASSIGNMENT CLASSIFICATION TABLE
Learning Objectives
Questions
Brief
Exercises
Do It!
Exercises
A
Problems
1. Explain variable, fixed, and
mixed costs and the relevant
range.
1, 2, 3, 4, 5,
6
1, 2
1
1, 2, 3, 4, 5,
6
1A, 6A
2. Apply the high-low method to
determine the components of
mixed costs.
7, 8
1, 3, 4, 5
2
3, 5,
1A
3. Prepare a CVP income
statement to determine
contribution margin.
9, 10, 11, 17
6, 7
3
7, 8, 9, 10, 11,
12, 13, 17
1A, 2A, 4A,
5A, 6A
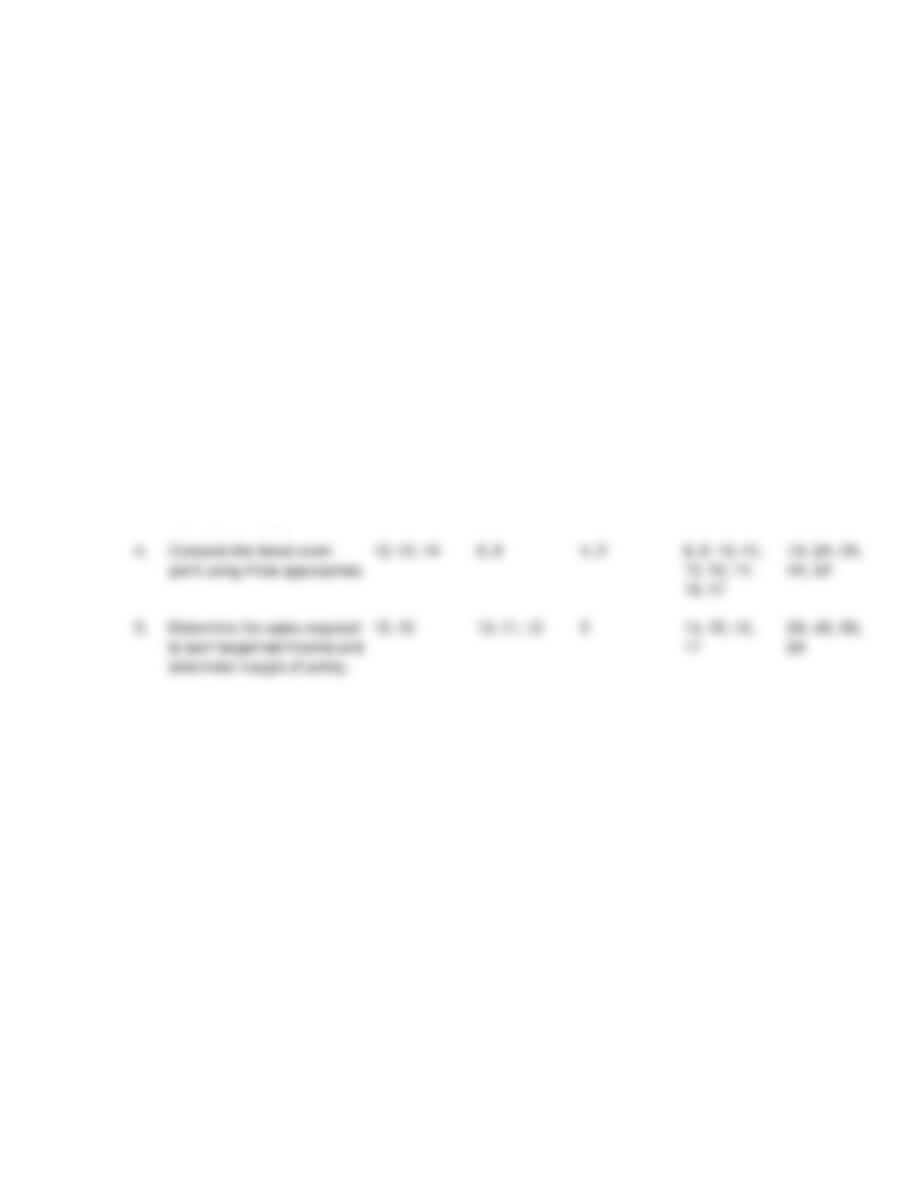
4. Compute the break-even
point using three approaches.
12, 13, 14
8, 9
8, 9, 10, 11,
12, 13, 14,
16, 17
1A, 2A, 3A,
4A, 5A
5. Determine the sales required
to earn target net income and
determine margin of safety.
15, 16
10, 11, 12
5
14, 15, 16,
2A, 4A, 5A,
ASSIGNMENT CHARACTERISTICS TABLE
Problem
Number
Description
Difficulty
Level
Time
Allotted (min.)
1A
Determine variable and fixed costs, compute break-even
point, prepare a CVP graph, and determine net income.
Simple
20–30
2A
Prepare a CVP income statement, compute break-even
point, contribution margin ratio, margin of safety ratio,
and sales for target net income.
Moderate
30–40
5A
Compute contribution margin, fixed costs, break-even
point, sales for target net income, and margin of safety
ratio.
Moderate
20–30
6A
Determine contribution margin ratio, break-even point, and
margin of safety.
Moderate
20–30
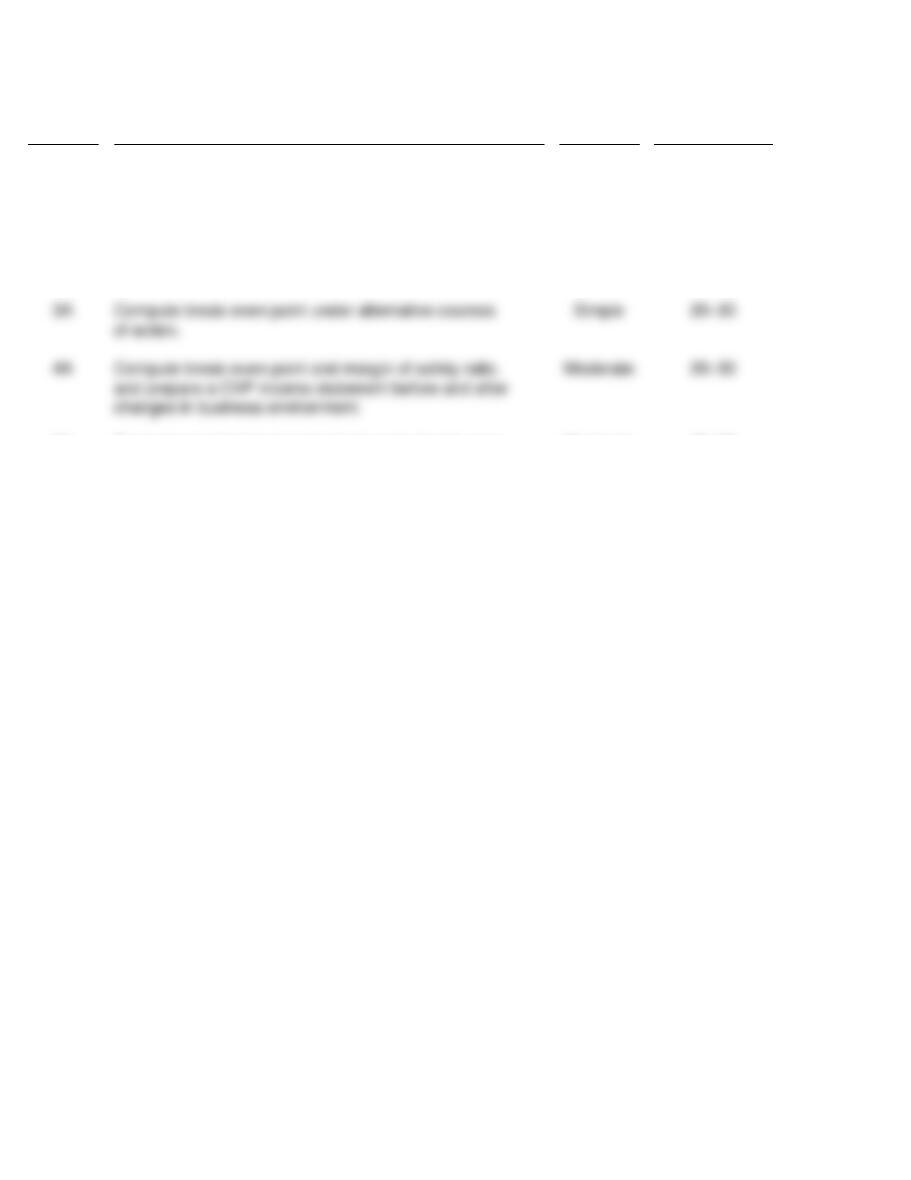
3A
Compute break-even point under alternative courses
of action.
Simple
20–30
changes in business environment.
Correlation Chart between Bloom’s Taxonomy, Learning Objectives and End–of-Chapter Exercises and Problems
Learning Objective
Knowledge
Comprehension
Application
Analysis
Synthesis
Evaluation
* 1. Explain variable, fixed, and mixed
costs and the relevant range.
E5-4
Q5-1
Q5-2
Q5-3
Q5-4
Q5-5
Q5-6
BE5-1
DI5-1
E5-1
E5-2
E5-4
E5-2
E5-5
E5-6
BE5-2
E5-3
P5–1A
P5–6A
* 2. Apply the high-low method to
determine the components of mixed
costs.
E5-4
E5-5
Q5-7
BE5-1
E5-1
Q5-8
BE5-4
BE5-5
DI5-2
E5-5
E5-6
BE5-3
E5-3
P5–1A
* 3. Prepare a CVP income statement to
determine contribution margin.
E5-7
Q5-9
Q5–10
Q5–11
Q5–17
BE5-6
BE5-7
E5-9
E5–10
E5–11
E5–12
BE5-6
P5–1A
P5–2A
P5–5A
P5–4A
P5–6A
* 4. Compute the break-even point
using three approaches.
Q5–12
Q5–14
Q5–13
BE5-8
BE5-9
DI5-4
DI5-5
E5-8
E5-9
E5–10
E5–11
E5–12
E5–13
E5–14
E5–16
E5–17
E5–16
P5–1A
P5–2A
P5–5A
P5–3A
P5–4A
* 5. Determine the sales required to
earn target net income and
determine margin of safety.
Q5–15
Q5–16
BE5-10
BE5-11
BE5-12
DI5-5
E5–12
E5–14
E5–15
E5–17
E5–16
P5–2A
P5–5A
P5–4A
P5–6A
Continuing Problems
CD5
Broadening Your Perspective
BYP5-5
BYP5-3
BYP5-1
BYP5-4
BYP5-2
BYP5-6
BYP5-7
BLOOM’ S TAXONOMY TABLE
ANSWERS TO QUESTIONS
1. (a) Cost behavior analysis is the study of how specific costs respond to changes in the level of activity
within a company.
(b) Cost behavior analysis is important to management in planning business operations and in deciding
between alternative courses of action.
2. (a) The activity index identifies the activity that causes changes in the behavior of costs. Once the
index is determined, it is possible to classify the behavior of costs in response to changes in
activity levels into three categories: variable, fixed, or mixed.
(b) Variable costs may be defined in total or on a per-unit basis. Variable costs in total vary directly
and proportionately with changes in the activity level. Variable costs per unit remain the
same at every level of activity.
3. Fixed costs remain the same in total regardless of changes in the activity level. In contrast, fixed
costs per unit vary inversely with activity. As volume increases, fixed costs per unit decline and vice
versa.
4. (a) The relevant range is the range of activity over which a company expects to operate during
the year.
(b) Disagree. The behavior of both fixed and variable costs are linear only over a certain range
of activity. CVP analysis is based on the assumption that both fixed and variable costs
remain linear within the relevant range.
5. This is true. Most companies operate within the relevant range. Within this range, it is possible to
establish a linear (straight-line) relationship for both variable and fixed costs. If a relevant range
cannot be established, segregation of costs into fixed and variable becomes extremely difficult.
6. Apartment rent is fixed because the cost per month remains the same regardless of how much Adam
uses the apartment. Rent on a Hertz rental truck is a mixed cost because the cost usually includes a
per day charge (a fixed cost) plus an activity charge based on miles driven (a variable cost).
7. For CVP analysis, mixed costs must be classified into their fixed and variable elements. One approach
to the classification of mixed costs is the high-low method.
8. Variable cost per unit is $1.30, or [($165,000 – $100,000) ÷ (90,000 – 40,000)]. At any level of activity,
fixed costs are $48,000 per month [$165,000 – (90,000 X $1.30)].
9. No. Only two of the basic components of cost-volume-profit (CVP) analysis, unit selling prices and
variable cost per unit, relate to unit data. The other components, volume, total fixed costs, and
sales mix, are not based on per-unit amounts.
10. There is no truth in Faye’s statement. Contribution margin is sales less variable costs. It is the
revenue that remains to cover fixed costs and to produce income (profit) for the company.
11. Contribution margin is $14 ($40 – $26). The contribution margin ratio is 35% ($14 ÷ $40).

Questions Chapter 5 (Continued)
12. Disagree. Knowledge of the break–even point is useful to management in deciding whether to introduce
new product lines, change sales prices on established products, and enter new market areas.
13. $26,000 ÷ 25% = $104,000
14. (a) The break-even point involves the plotting of three lines over the full range of activity: the total
revenue line, the total fixed cost line, and the total cost line. The break-even point is deter-
mined at the intersection of the total revenue and total cost lines.
(b) The break-even point in units is obtained by drawing a vertical line from the break-even point to
the horizontal axis. The break-even point in sales dollars is obtained by drawing a horizontal line
from the break-even point to the vertical axis.
15. Margin of safety is the difference between actual or expected sales and sales at the break-even
point. 1,250 X $12 = $15,000; $15,000 – $13,200 = $1,800; $1,800 ÷ $15,000 = 12%.
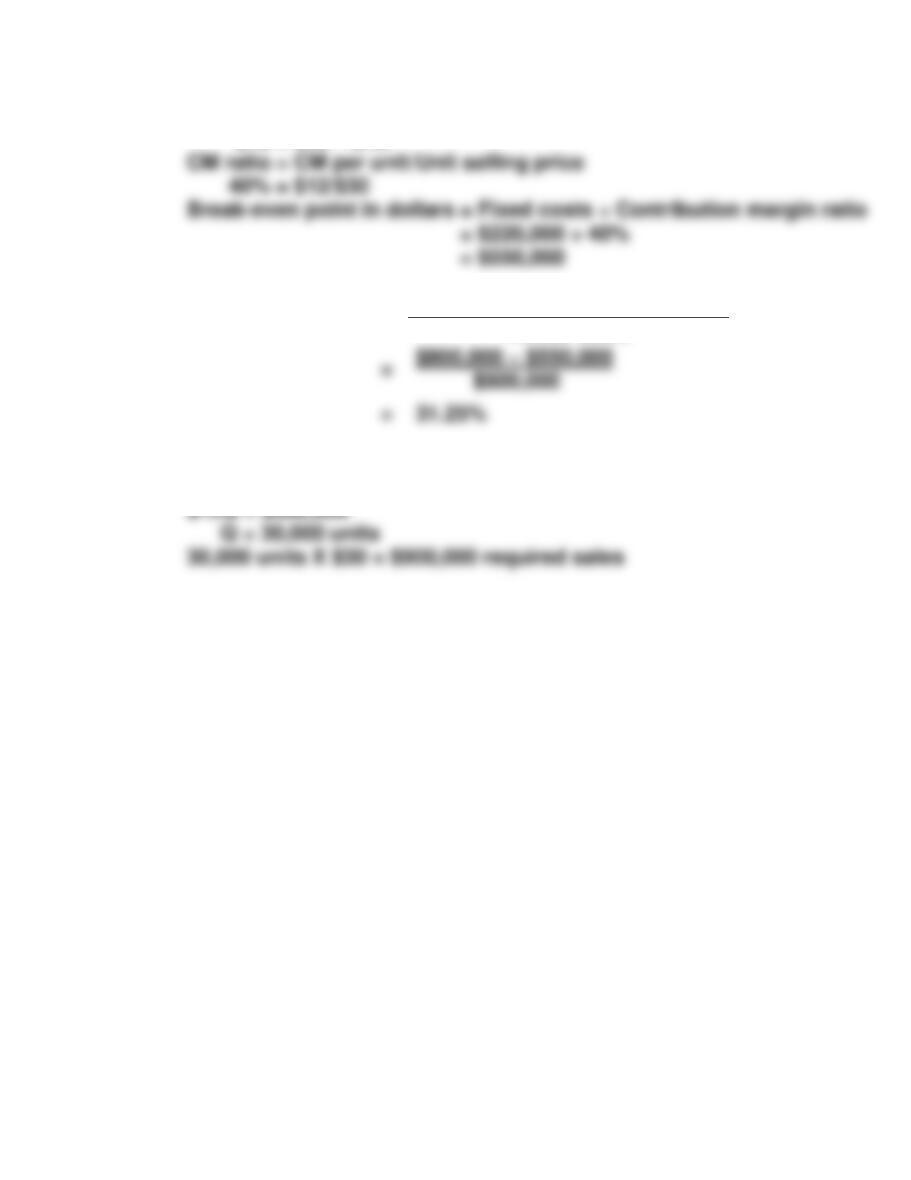
16. At break-even sales, the contribution margin is equal to the fixed costs. The contribution margin
ratio is:
$180,000
$500,000
= 36%
The sales volume to achieve net income of $90,000 is as follows:
$180,000 + $90,000
.36
= $750,000
17. PACE COMPANY
CVP Income Statement
Sales ……………………………………………………………………………………. $900,000
Variable expenses
Cost of goods sold ($600,000 X .70) …………………………………… $420,000
Operating expenses ($200,000 X .70) …………………………………. 140,000
Total variable expenses …………………………………………….. 560,000
Contribution margin ………………………………………………………………… $340,000
SOLUTIONS TO BRIEF EXERCISES
BRIEF EXERCISE 5-1
Indirect labor is a variable cost because it increases in total directly and
proportionately with the change in the activity level.
BRIEF EXERCISE 5-2
VARIABLE COST
Relevant Range
FIXED COST
Relevant Range
$10,000
$10,000
8,000
8,000
6,000
6,000
4,000
4,000
2,000
2,000
BRIEF EXERCISE 5-3
$60,000
Total Cost Line
45,000
BRIEF EXERCISE 5-4
High
Low
Difference
$15,000
$13,500
=
$1,500
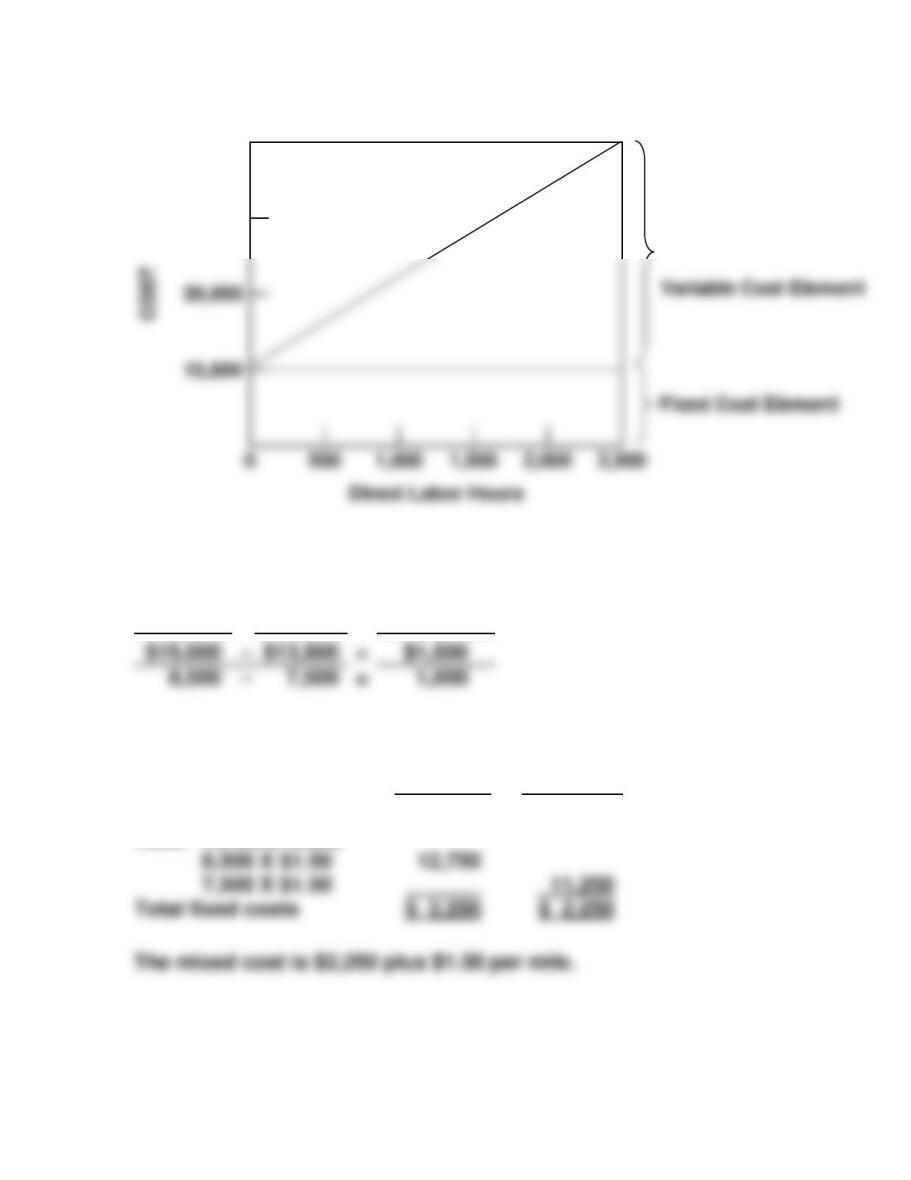
$1,500 ÷ 1,000 = $1.50—Variable cost per mile.
High
Low
Total cost
Less: Variable costs
$15,000
$13,500
30,000
15,000
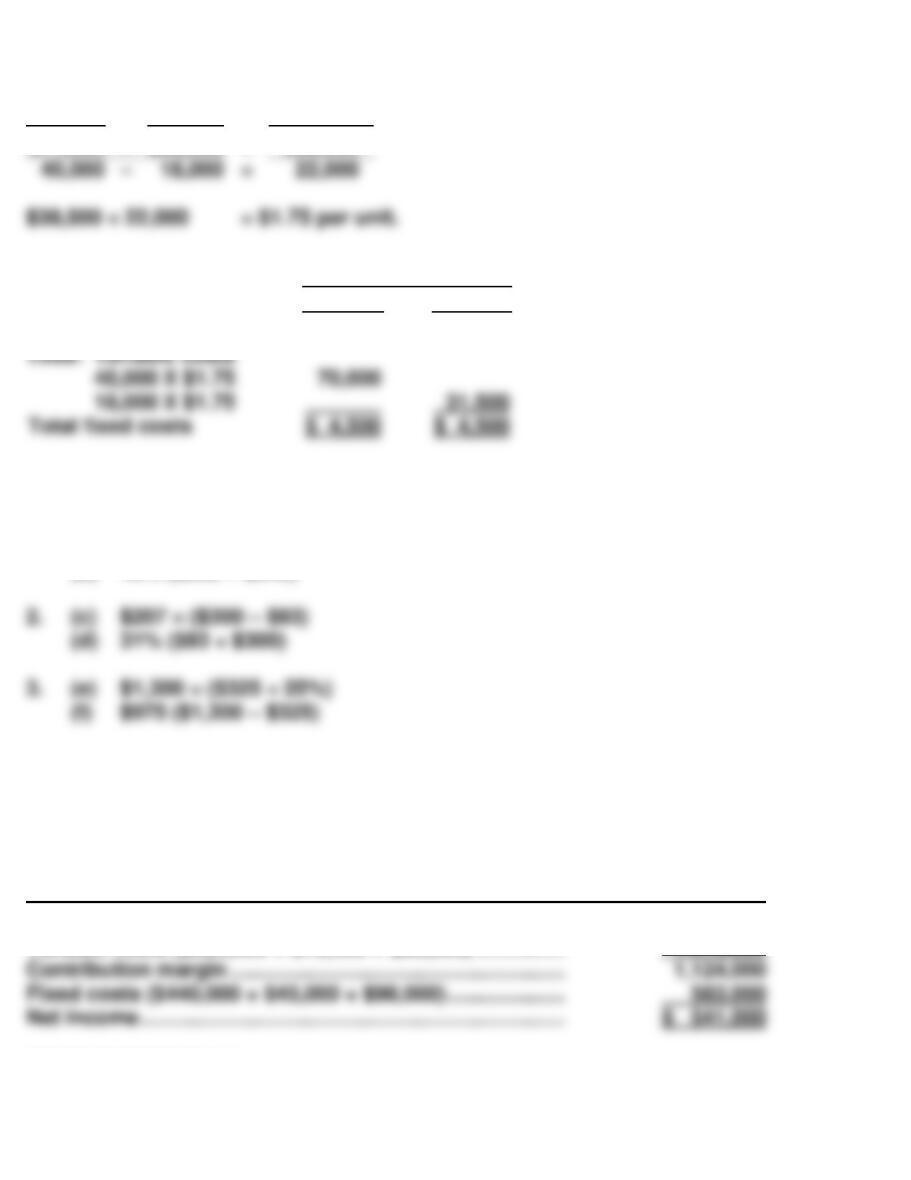
BRIEF EXERCISE 5-5
High
Low
Difference
$74,500
–
$36,000
=
$38,500
Activity Level
High
Low
Total fixed costs
Total cost
$74,500
$36,000
BRIEF EXERCISE 5-6
1. (a) $288 = ($640 – $352)
(b) 45% ($288 ÷ $640)
BRIEF EXERCISE 5-7
RUSSELL INC.
CVP Income Statement
For the Quarter Ended March 31, 2017
Sales ………………………………………………………………………. $2,200,000
Variable costs ($920,000 + $70,000 + $86,000) …………… 1,076,000
BRIEF EXERCISE 5-8
18,000
(a) $520Q – $286Q – $163,800 = $0
$234Q = $163,800
BRIEF EXERCISE 5-9
BRIEF EXERCISE 5-10
If variable costs are 70% of sales, the contribution margin ratio is ($1 – $0.70) ÷
BRIEF EXERCISE 5-11
Margin of safety = $1,000,000 – $800,000 = $200,000
Margin of safety ratio = $200,000 ÷ $1,000,000 = 20%
BRIEF EXERCISE 5-12
SOLUTIONS FOR DO IT! REVIEW EXERCISES
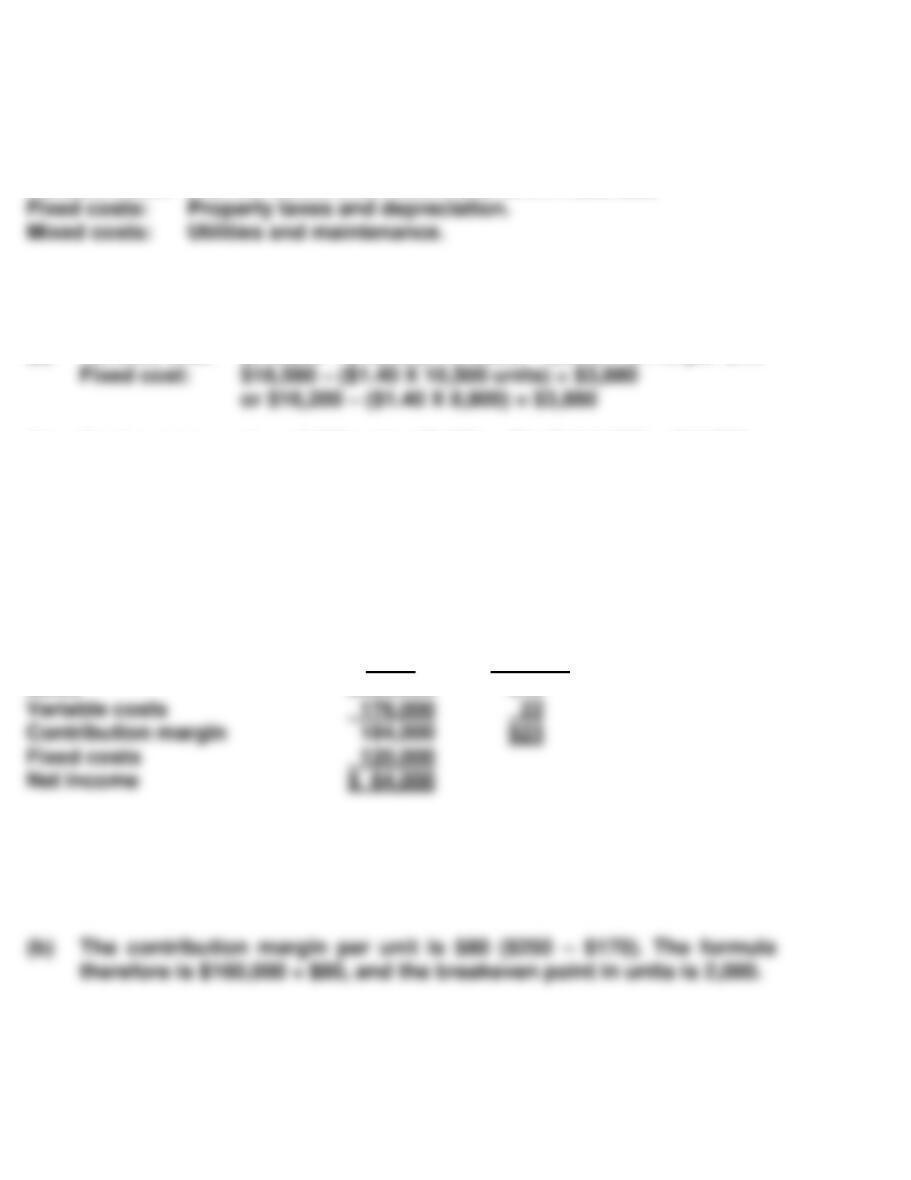
DO IT! 5-1
Variable costs: Indirect labor, direct labor, and direct materials.
DO IT! 5-2
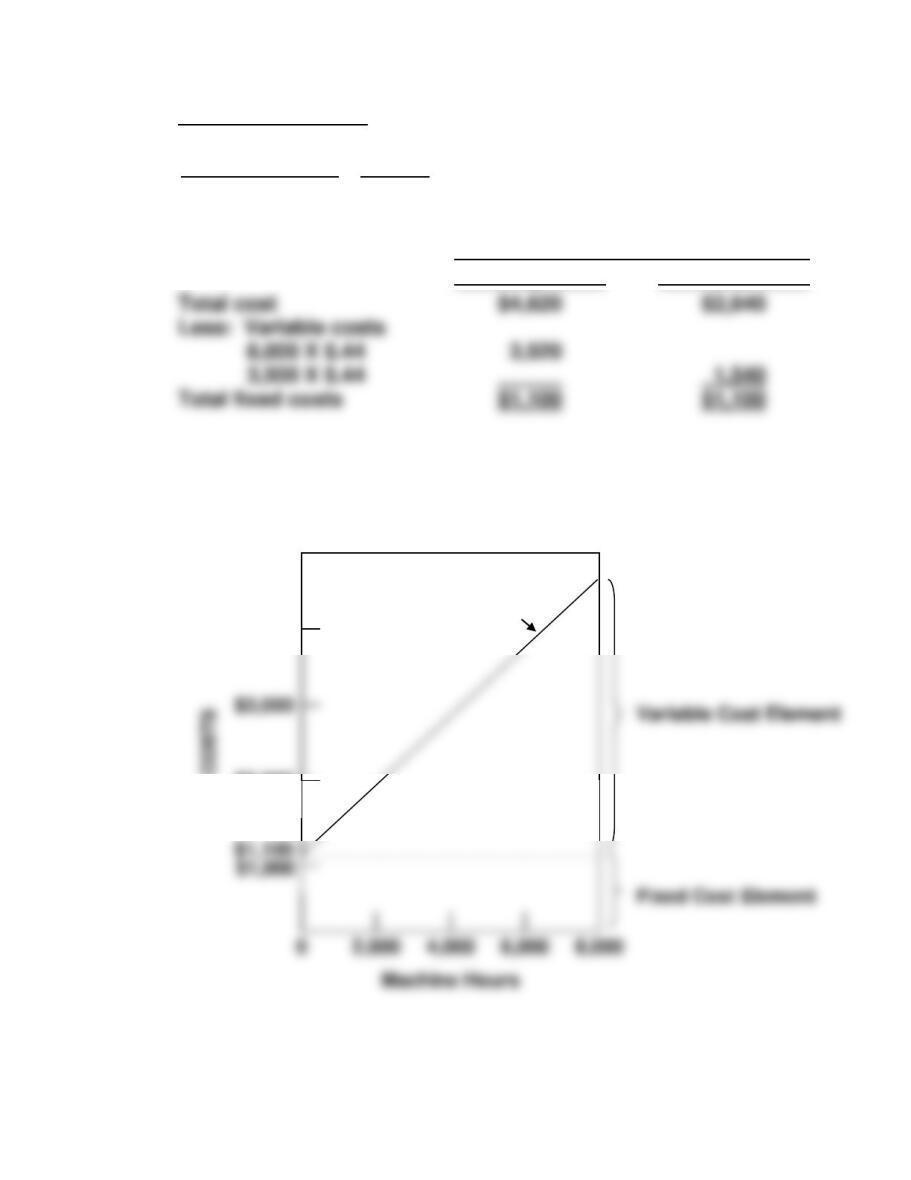
(a) Variable cost: ($18,580 – $16,200) ÷ (10,500 – 8,800) = $1.40 per unit
(b) Total cost to produce 9,200 units: $3,880 + ($1.40 X 9,200) = $16,760
DO IT! 5-3
Cedar Grove Industries
CVP Income Statement
For the Month Ended May 31, 2017
Total Per Unit
Sales $360,000 $45
DO IT! 5-4
(a) The formula is $250Q – $170Q – $160,000 = 0. Therefore, 80Q =
$160,000, and the breakeven point in units is 2,000 ($160,000 ÷ $80).
DO IT! 5-5
(a) CM per unit = Unit selling price – Unit variable costs
$12 = $30 – $18
(b)
Margin of safety
=
Actual sales – Break-even sales
Actual sales
(c) Sales – Variable costs – Fixed costs = Net income
$30Q – $18Q = $220,000 + $140,000
SOLUTIONS TO EXERCISES
EXERCISE 5-1
(a) The determination as to whether a cost is variable, fixed, or mixed can
be made by comparing the cost in total or on a per-unit basis at two
different levels of production.
(b) Using these criteria as a guideline, the classification is as follows:
Direct materials
Variable
Rent
Fixed
EXERCISE 5-2
(a)
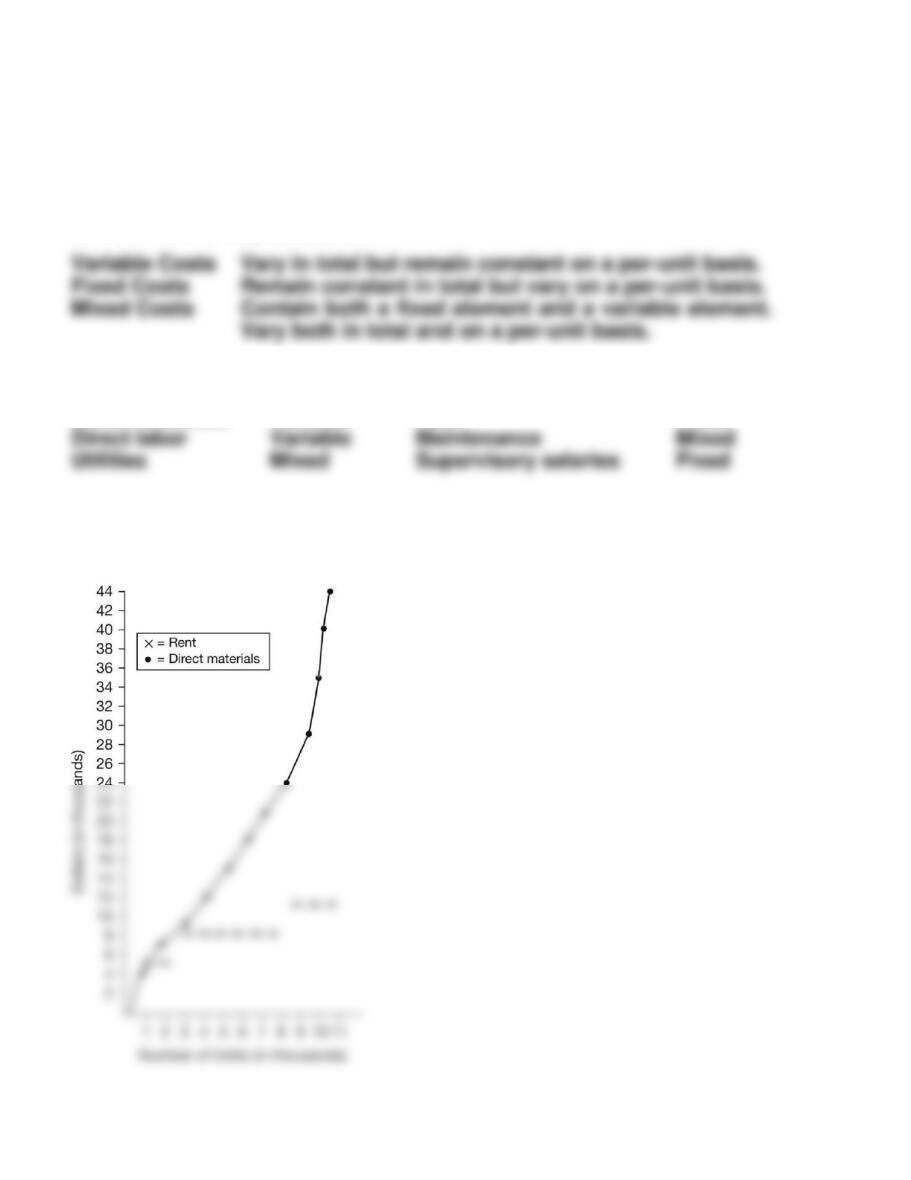
Fixed Costs
Remain constant in total but vary on a per-unit basis.
EXERCISE 5-2 (Continued)
(b) The relevant range is 3,000 – 8,000 units of output since a straight-line
relationship exists for both direct materials and rent within this range.
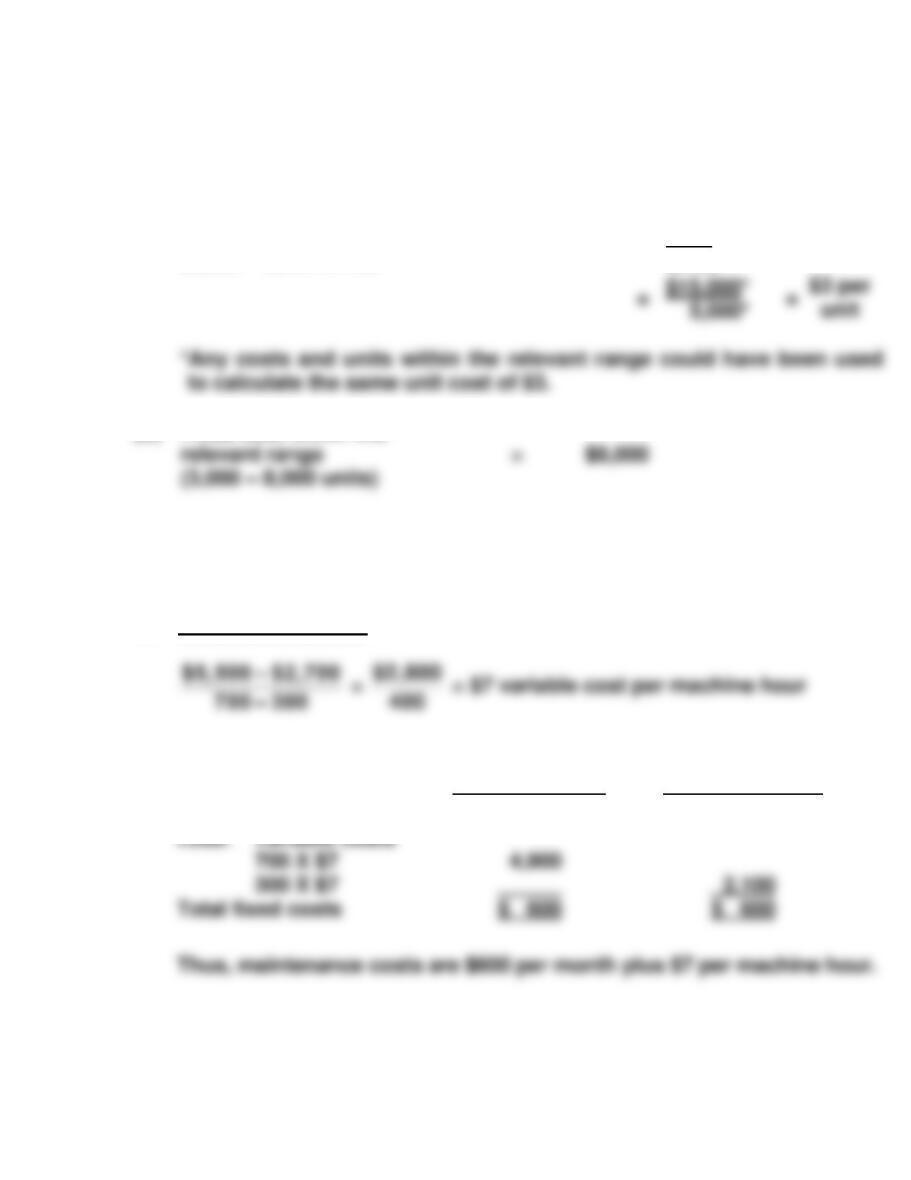
(c)
Variable cost per unit
Within the relevant range
=
Cost
Units
(3,000 – 8,000 units)
(d) Fixed cost within the
EXERCISE 5-3
(a) Maintenance Costs:
700
Machine Hours
300
Machine Hours
300 X $7
Total fixed costs
Total costs
$5,500
$2,700
=
$15,000*
5,000*
=
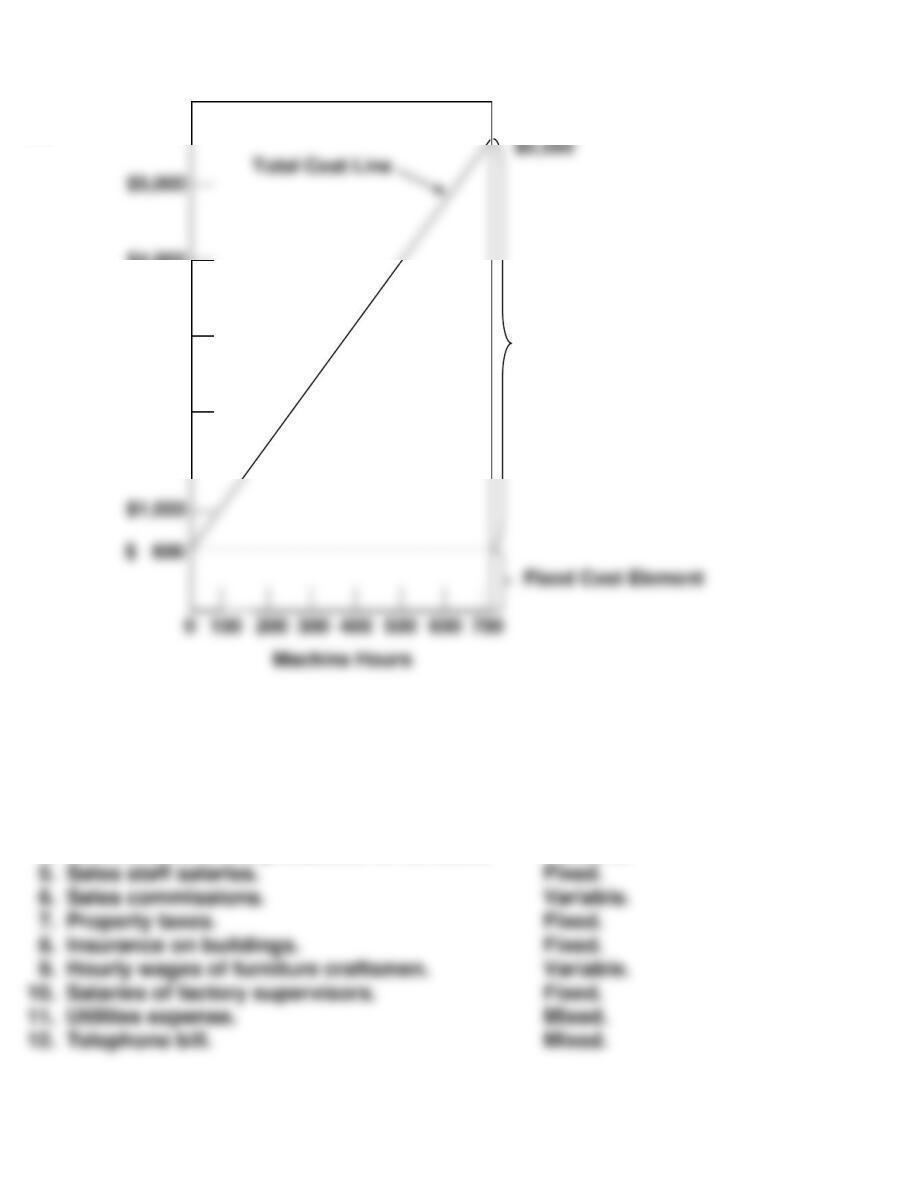
EXERCISE 5-3 (Continued)
(b)
$6,000
COSTS
$4,000
$3,000
Variable Cost Element
$2,000
EXERCISE 5-4
1.
Wood used in the production of furniture.
Variable.
2.
Fuel used in delivery trucks.
Variable.
3.
Straight-line depreciation on factory building.
Fixed.
4.
Screws used in the production of furniture.
Variable.
5.
Sales staff salaries.
Fixed.
6.
Sales commissions.
Variable.
7.
Property taxes.
Fixed.
8.
Insurance on buildings.
Fixed.
9.
Hourly wages of furniture craftsmen.
Variable.
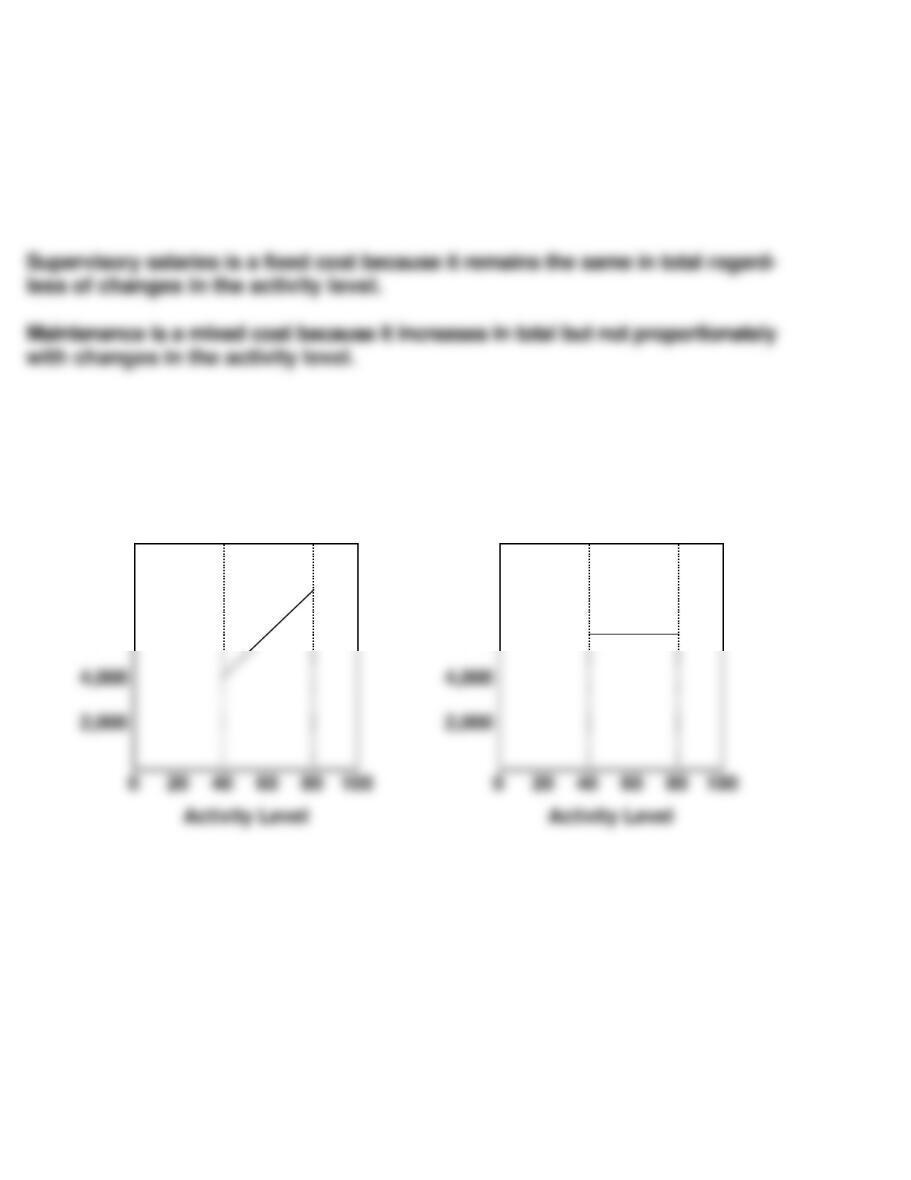
Salaries of factory supervisors.
Fixed.
Utilities expense.
Mixed.
Telephone bill.
Mixed.
EXERCISE 5-5
(a) Maintenance Costs:
$4,620 – $2,640 $1,980
=
8,000 – 3,500 4,500
= $.44 variable cost per machine hour
Activity Level
High
Low
Thus, maintenance costs are $1,100 per month plus $.44 per machine
hour.
(b)
$5,000
COSTS
$4,620
$4,000
Total Cost Line
$3,000
$2,000
Total fixed costs
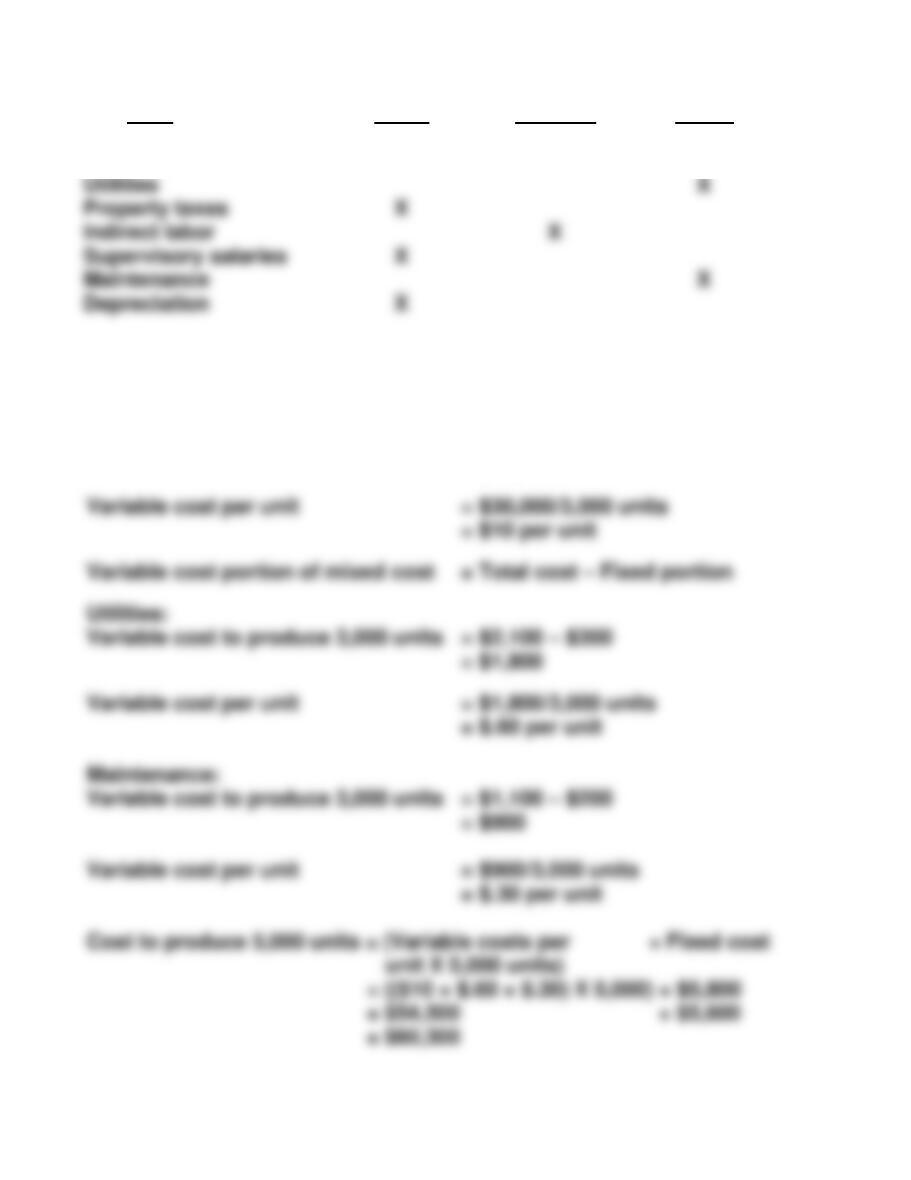
EXERCISE 5-6
(a)
Cost
Fixed
Variable
Mixed
Direct materials
X
Direct labor
X
(b) Fixed costs = $1,000 + $1,900 + $2,400 +
$300 + $200
= $5,800
Variable costs to produce 3,000 units = $7,500 + $18,000 + $4,500
= $30,000
Utilities
Property taxes
X
Indirect labor
X
Supervisory salaries
X
Maintenance
Depreciation
X
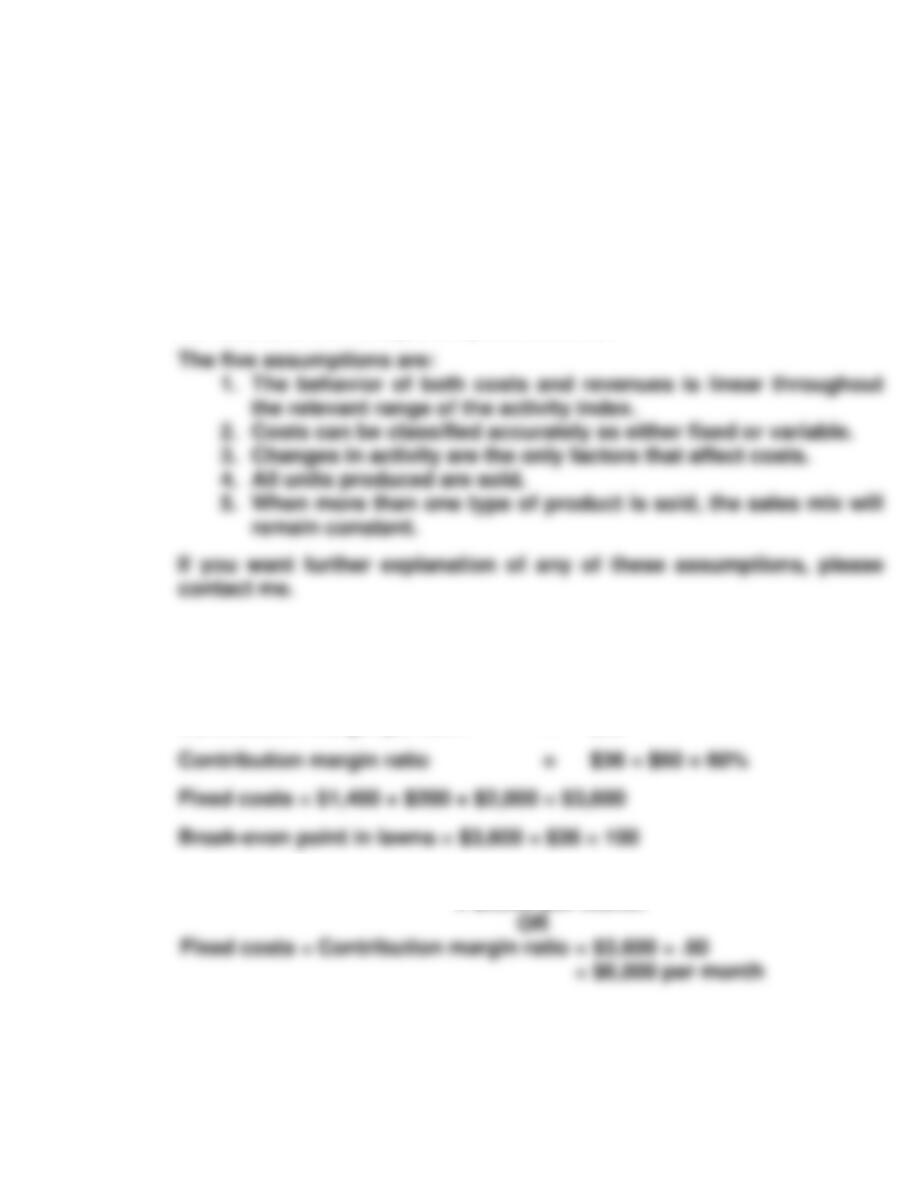
EXERCISE 5-7
MEMO
To: Marty Moser
From: Student
Re: Assumptions underlying CVP analysis
CVP analysis is a useful tool in analyzing the effects of changes in costs
and volume on a company’s profits. However, there are some assumptions
which underlie CVP analysis. When these assumptions are not valid,
the results of CVP analysis may be inaccurate.
EXERCISE 5-8
(a)
Contribution margin per lawn
Contribution margin per lawn
=
=
$60 – ($12 + $10 + $2)
$36
(b) Break-even point in dollars = 100 lawns X $60 per lawn
= $6,000 per month
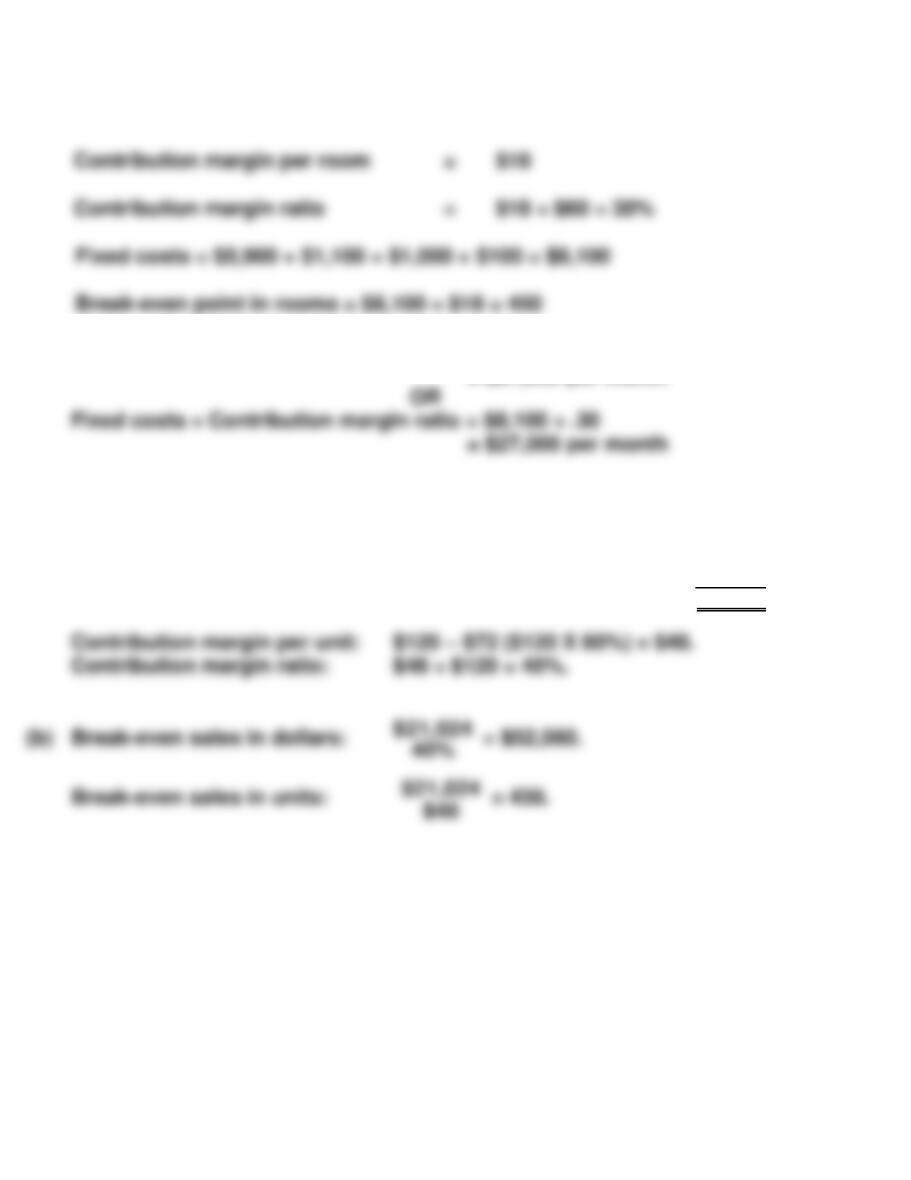
EXERCISE 5-9
1.
Contribution margin per room
=
$60 – ($14 + $28)
2. Break-even point in dollars = 450 rooms X $60 per room
= $27,000 per month
EXERCISE 5-10
(a) Contribution margin in dollars: Sales = 560 X $120 = $67,200
Variable costs = $67,200 X .60 = 40,320
Contribution margin $26,880
EXERCISE 5-11
(a)
1. Contribution margin ratio is:
$27,000
= 75%
$36,000
2. Round-trip fare =
$36,000
= $24
1,500 fares
(b) At the break-even point fixed costs and contribution margin are equal.
EXERCISE 5-12
(a) Unit contribution margin =
Fixed costs
Break-even sales in units
Variable cost per unit = Unit selling price – Unit contribution margin
= $5.00 – $1.60
= $3.40
Break-even point in dollars =
EXERCISE 5-12 (Continued)
(b) Fixed costs ÷ Contribution margin ratio = Break-even sales in dollars
Since fixed costs were $112,000 in 2016, the increase in 2017 is $22,400
($134,400 – $112,000).
EXERCISE 5-13
(a) and (b) BILLINGS COMPANY
CVP Income Statement
For the Month Ended September 30, 2017
Total
Per Unit
Sales (600 video game consoles) ……………… $240,000 $400
Variable costs …………………………………………. 168,000 280
(c) Sales = Variable costs + Fixed costs
$400X = $280X + $54,000
(d) BILLINGS COMPANY
CVP Income Statement
For the Month Ended September 30, 2017
Total
Per Unit
Sales (450 video game consoles)………………. $180,000 $400
Variable costs ………………………………………….. 126,000 280
EXERCISE 5-14
(a) Units sold in 2016 =
$570,000 + $210,000
$150 – $90
= 13,000 units
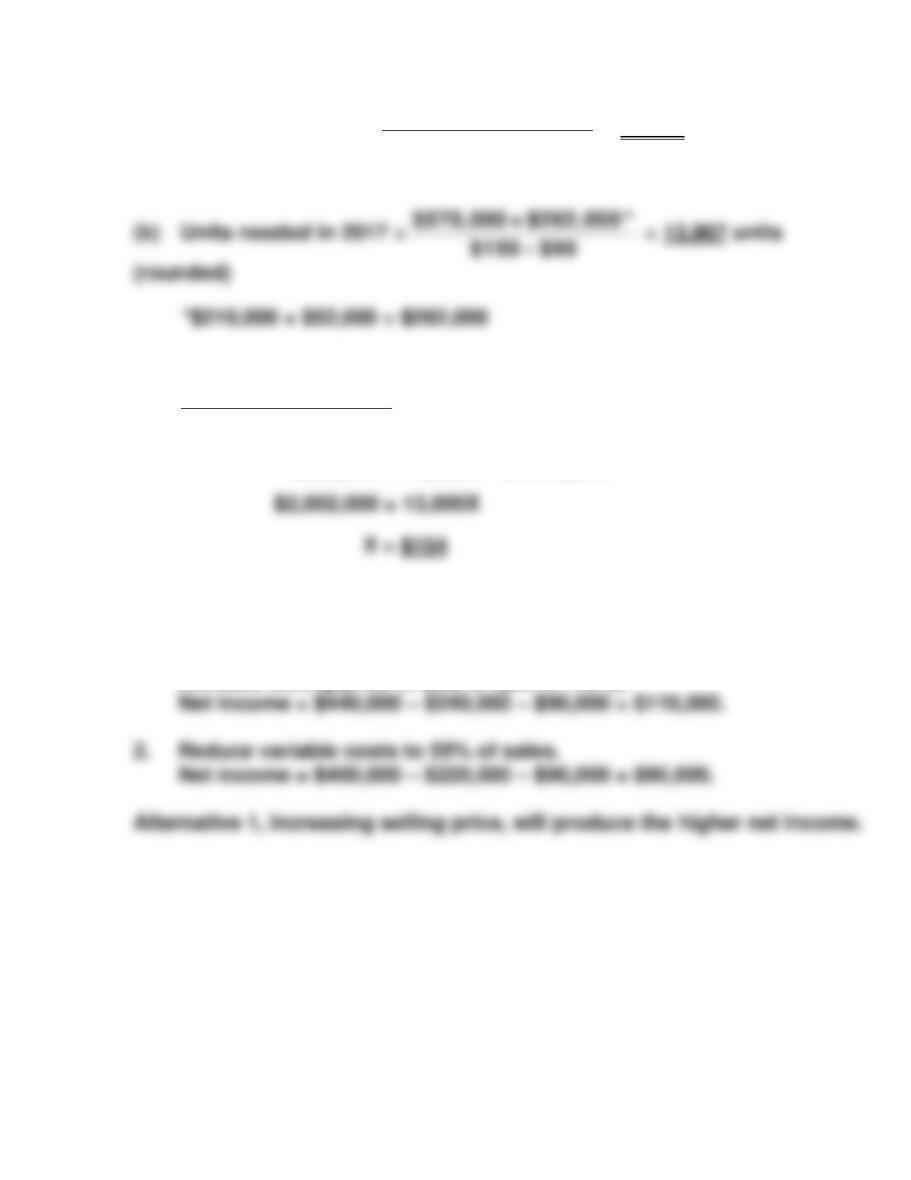
(c)
$570,000 + $262,000
X – $90
= 13,000 units, where X = new selling price
$832,000 = 13,000X – $1,170,000
EXERCISE 5-15
1. Unit sales price = $400,000 ÷ 5,000 units = $80
Increase selling price to $88, or ($80 X 110%).
EXERCISE 5-16
(a)
$3,200
Sales Line
DOLLARS (000)
2,800
2,000
1,600
1,200
Fixed Cost Line
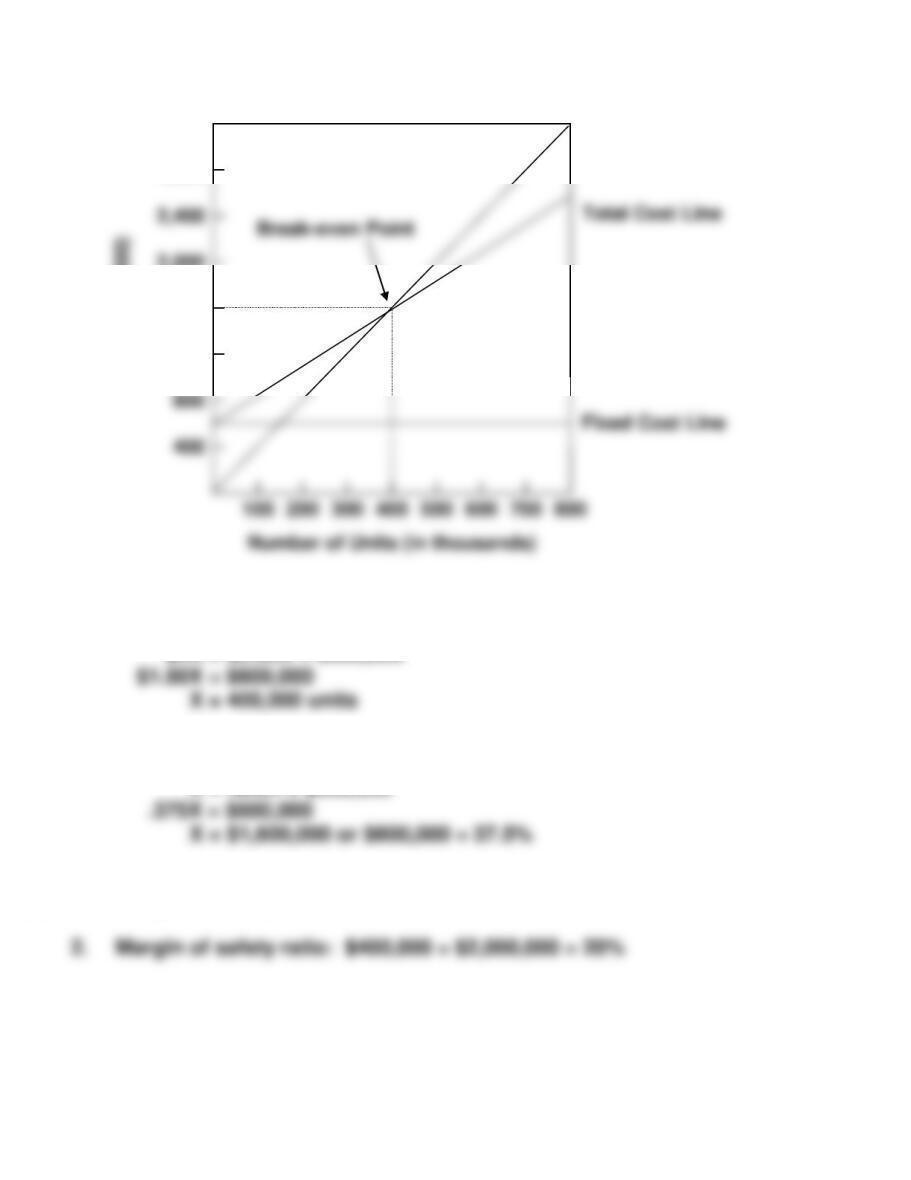
(b) 1. Break-even sales in units:
$4X = $2.50X + $600,000
2. Break-even sales in dollars:
X = .625X + $600,000
(c) 1. Margin of safety in dollars: $2,000,000 – $1,600,000 = $400,000
2,400
EXERCISE 5-17
(a) Contribution ratio = Contribution margin ÷ Sales
($40 – $24) ÷ $40 = 40%
SOLUTIONS TO PROBLEMS
PROBLEM 5-1A
(a)
Variable costs (per haircut)
Fixed costs (per month)
Barbers’ commission $4.50
Barber supplies .30
Barbers’ salaries $5,000
Manager’s extra salary 500
(b)
$10.00X = $5.00X + $7,000
1,400 haircuts X $10 = $14,000
(c)
18
Sales Line
6
15
Break-even Point
Total Cost Line
12
9
(d) Net income = $16,000 – [($5.00 X 1,600) + $7,000]
= $1,000
Total fixed $7,000
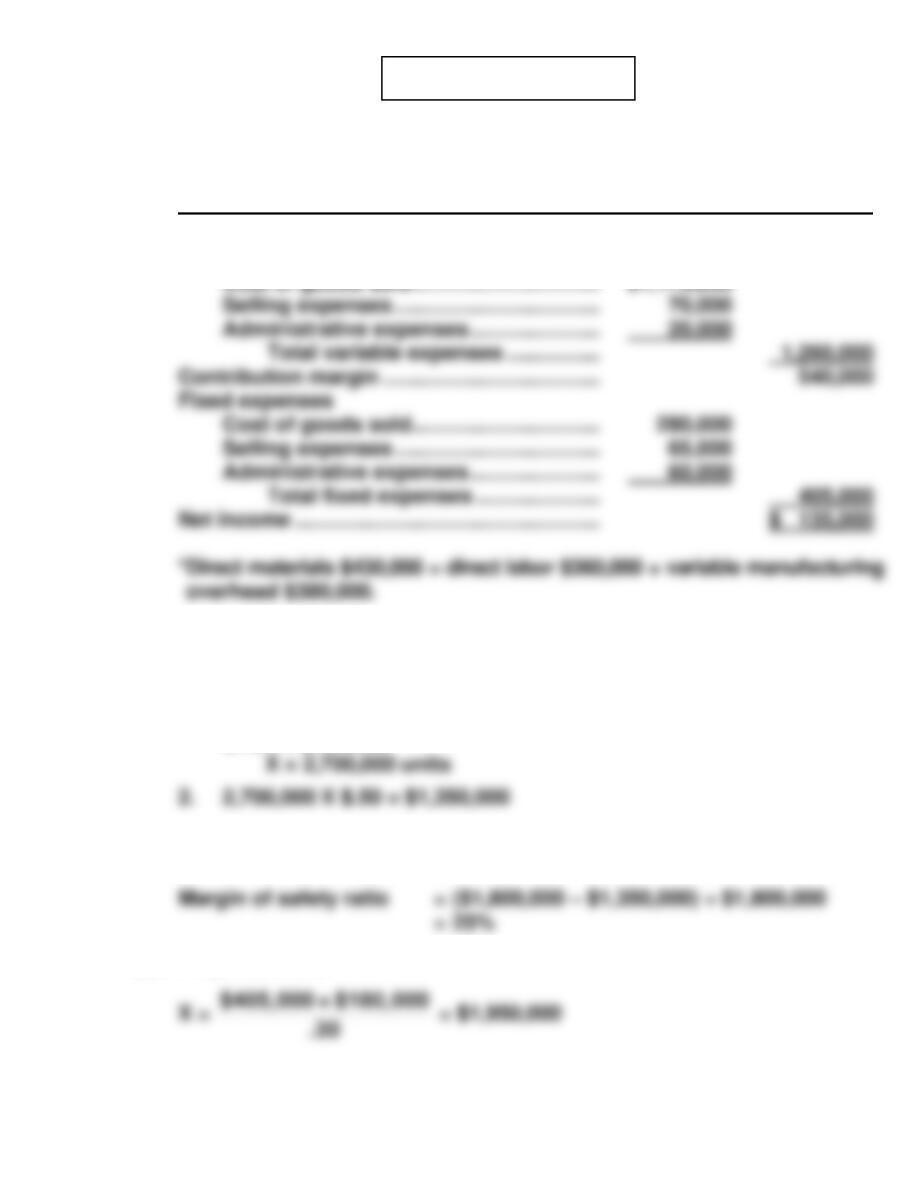
PROBLEM 5-2A
(a) JORGE COMPANY
CVP Income Statement (Estimated)
For the Year Ending December 31, 2017
Sales …………………………………………………….. $1,800,000
Variable expenses
(b) Variable costs = 70% of sales ($1,260,000 ÷ $1,800,000) or $.35 per
bottle ($.50 X 70%). Total fixed costs = $405,000.
1. $.50X = $.35X + $405,000
$.15X = $405,000
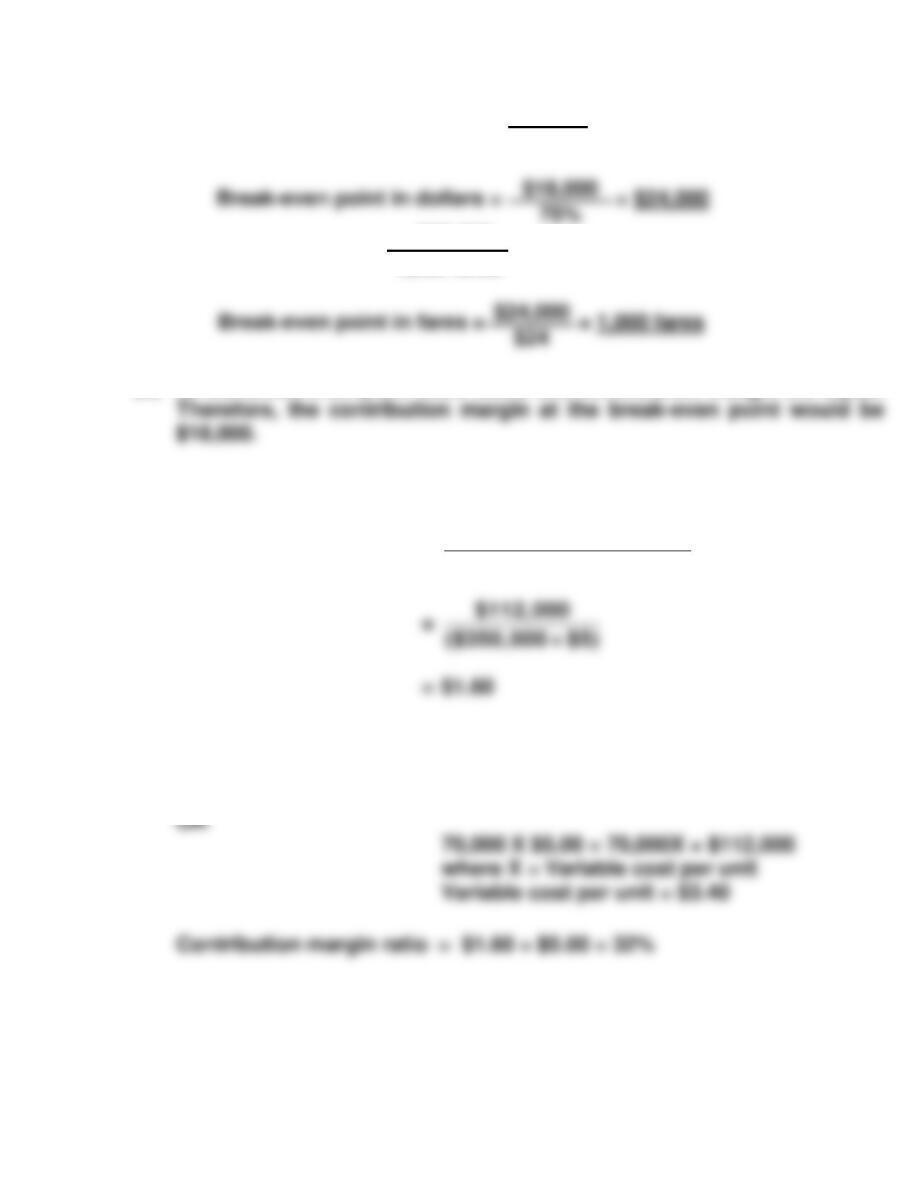
(c) Contribution margin ratio = ($.50 – $.35) ÷ $.50
= 30% (or 1 – .70)
(d) Required sales
PROBLEM 5-3A
(a) Sales were $2,500,000, variable expenses were $1,750,000 (70% of sales),
and fixed expenses were $850,000. Therefore, the break-even point in
dollars is:
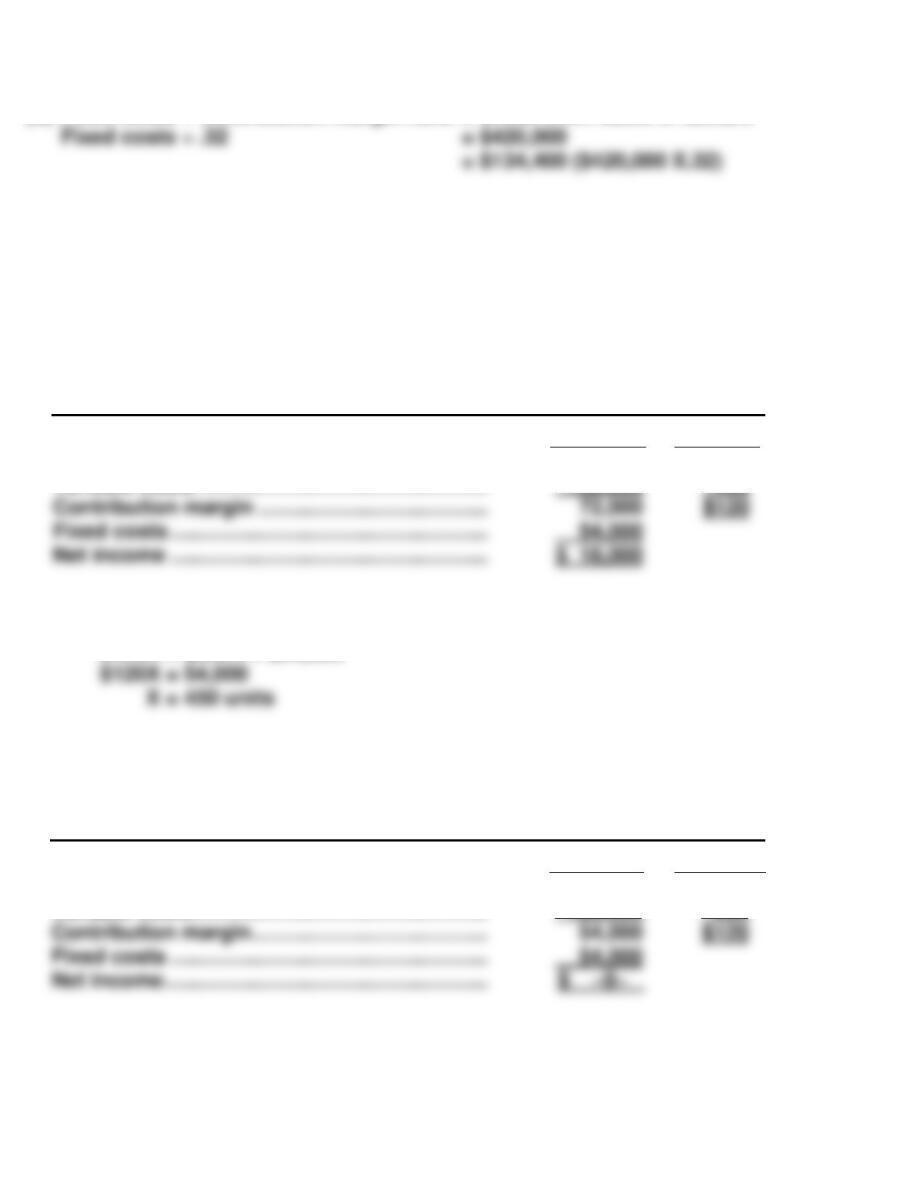
(b) 1. The effect of this alternative is to increase the selling price per unit
to $6 ($5 X 120%). Total sales become $3,000,000 (500,000 X $6).
2. The effects of this alternative are to change total fixed costs
to $760,000 ($850,000 – $90,000) and to change the contribution
Alternative 1 is the recommended course of action because it has a
lower break-even point.
PROBLEM 5-4A
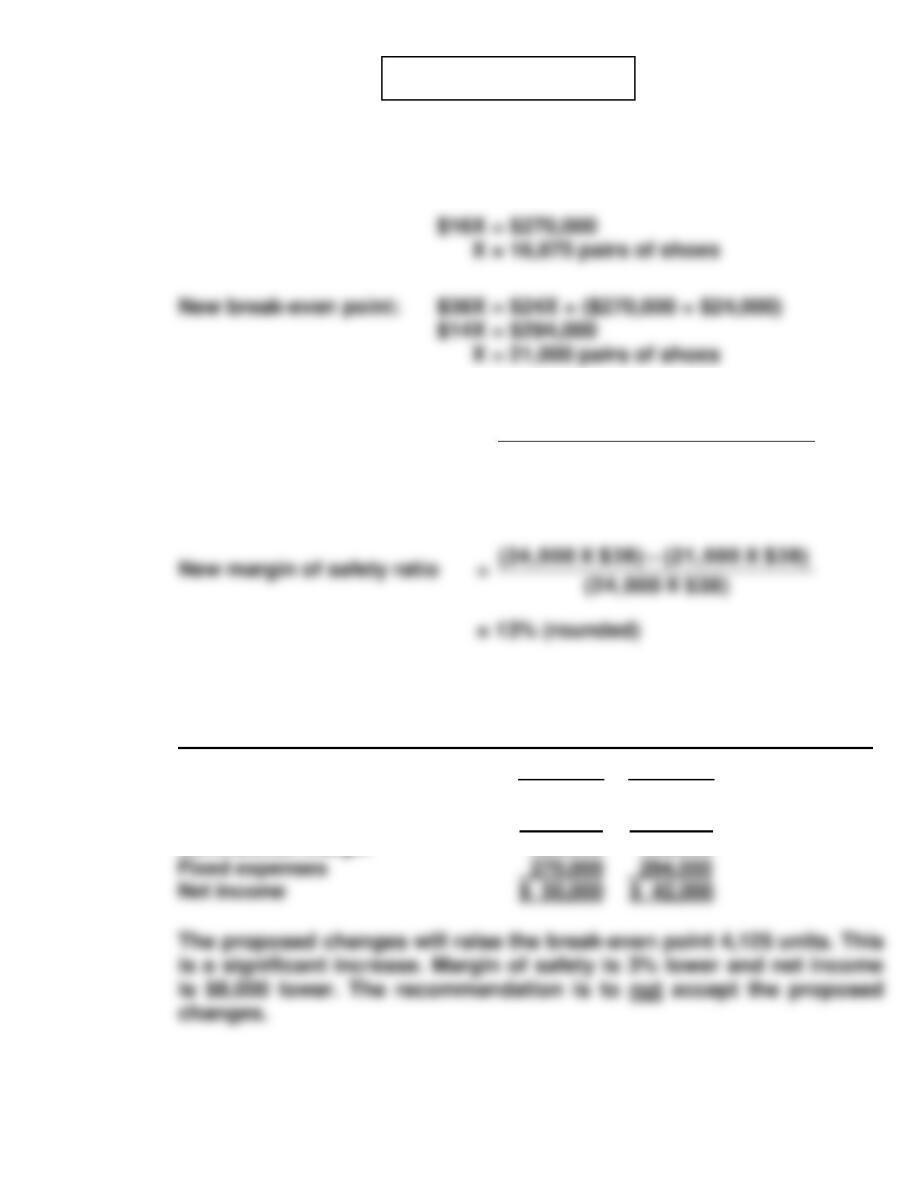
(a) Current break-even point: $40X = $24X + $270,000
(where X = pairs of shoes)
(b) Current margin of safety ratio =
(20,000 X $40) – (16,875 X $40)
(20,000 X $40)
(24,000 X $38) – (21,000 X $38)
(24,000 X $38)
= 16% (rounded)
(c) BARGAIN SHOE STORE
CVP Income Statement
Current
New
Sales (20,000 X $40)
Variable expenses (20,000 X $24)
Contribution margin
$800,000
480,000
320,000
$912,000
576,000
336,000
(24,000 X $38)
(24,000 X $24)

PROBLEM 5-5A
(a)
(1)
Current Year
Sales
Variable costs
Direct materials
Direct labor
$1,600,000
490,000
290,000
Current Year
Projected Year
Contribution margin
Sales
Variable costs
Direct materials
Direct labor
Manufacturing overhead
$1,600,000
490,000
290,000
266,000
X 1.1
X 1.1
X 1.1
X 1.1
$1,760,000
539,000
319,000
292,600
(2)
Fixed Costs
Current Year
Projected year
Total fixed costs
Manufacturing overhead ($380,000 X .30)
Selling expenses ($250,000 X .60)
$114,000
150,000
$114,000
150,000
Contribution margin
PROBLEM 5-5A (Continued)
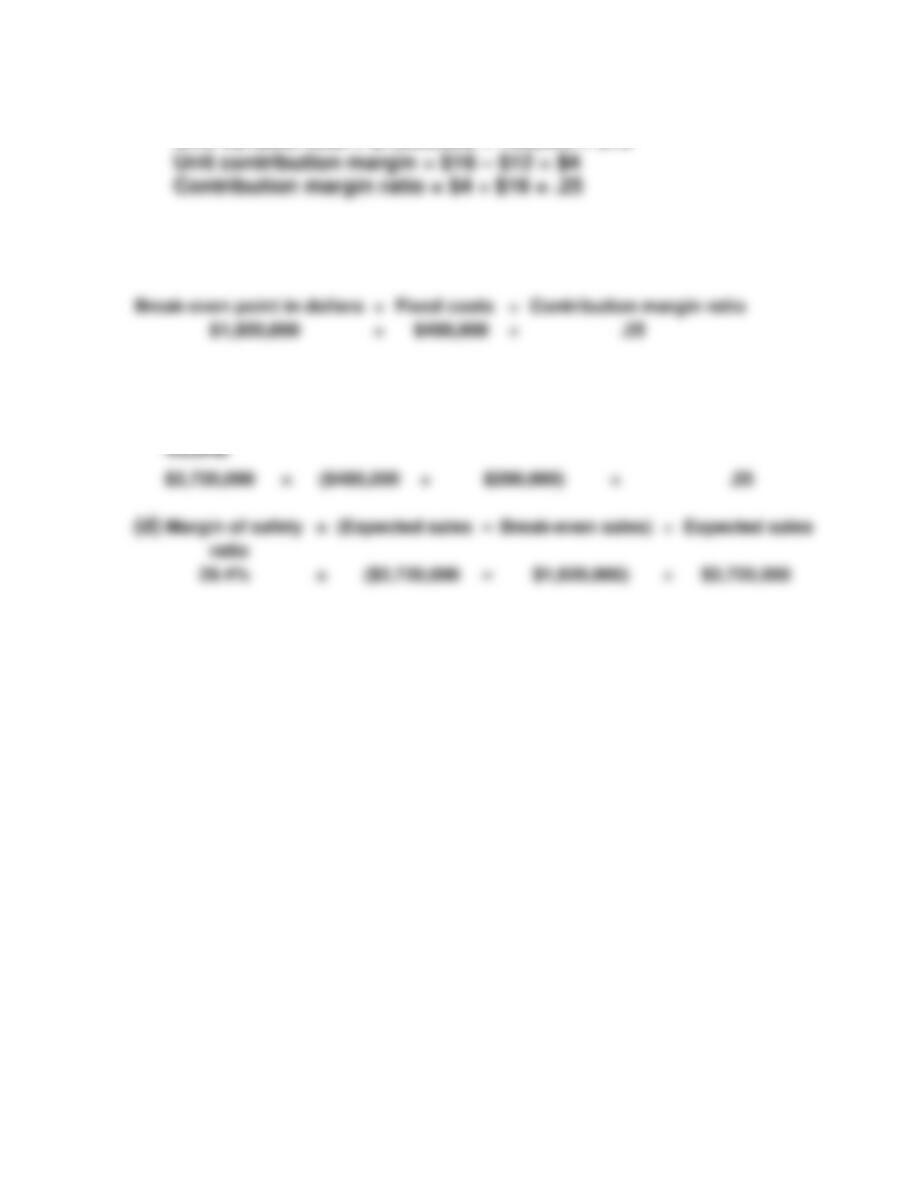
(b) Unit selling price = $1,600,000 ÷ 100,000 = $16
Unit variable cost = $1,200,000 ÷ 100,000 = $12
Break-even point in units
=
Fixed costs
÷
Unit contribution margin
120,000 units
=
$480,000
÷
$4
Break-even point in dollars
Fixed costs
÷
Contribution margin ratio
$480,000
÷
.25
(c) Sales dollars
required for
=
(Fixed costs
+
Target net income)
÷
Contribution margin ratio
=
Break-even sales)
÷
Expected sales
=
÷
target net
PROBLEM 5-6A
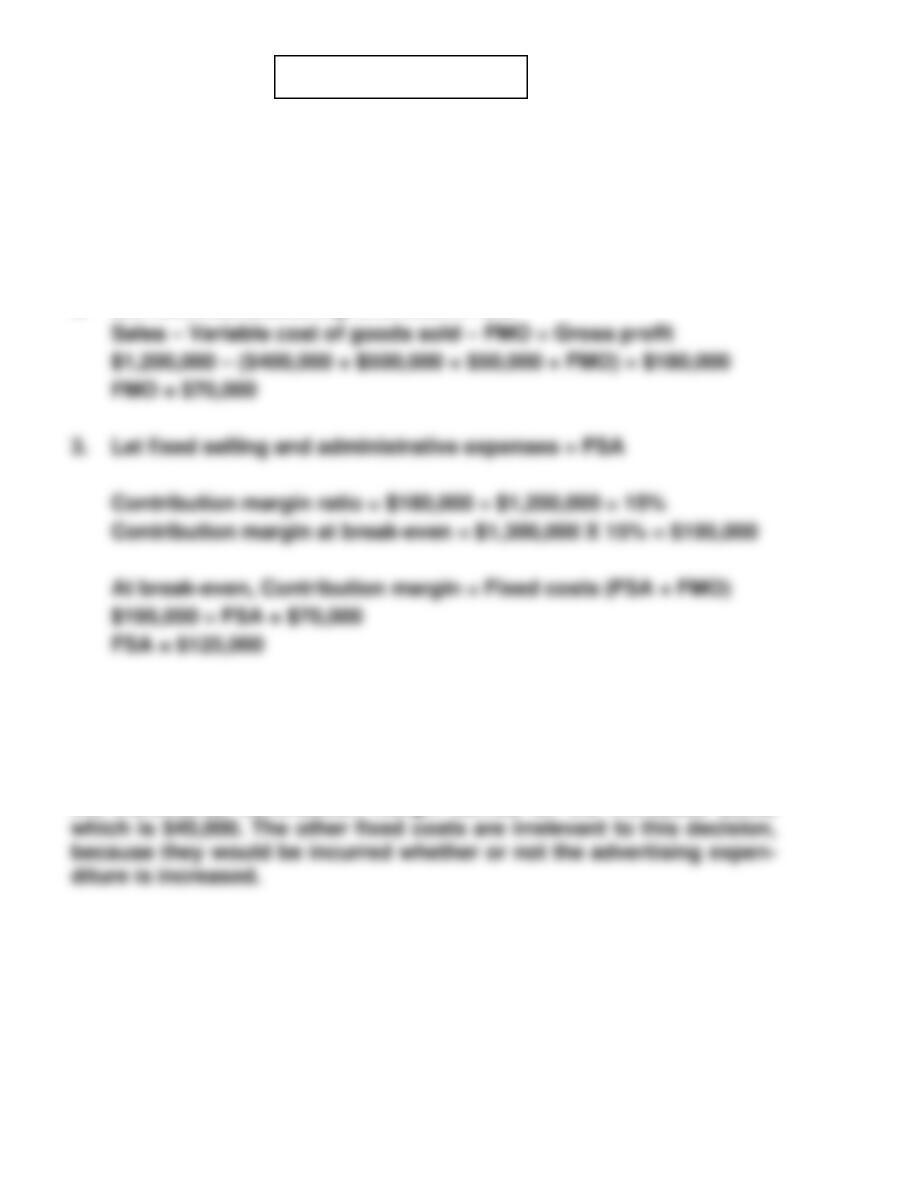
(a) 1. Let variable selling and administrative expenses = VSA
Sales – Variable cost of goods sold – VSA = Contribution Margin
$1,200,000 – ($400,000 + $500,000 + $50,000 + VSA) = $180,000
VSA = $70,000
2. Let fixed manufacturing overhead = FMO
(b) Incremental sales = $1,200,000 X 25% = $300,000
Incremental contribution margin = $300,000 X 15% = $45,000
The maximum increased advertising expenditure would be equal to
the incremental contribution margin earned on the increased sales,
CD5 CURRENT DESIGNS
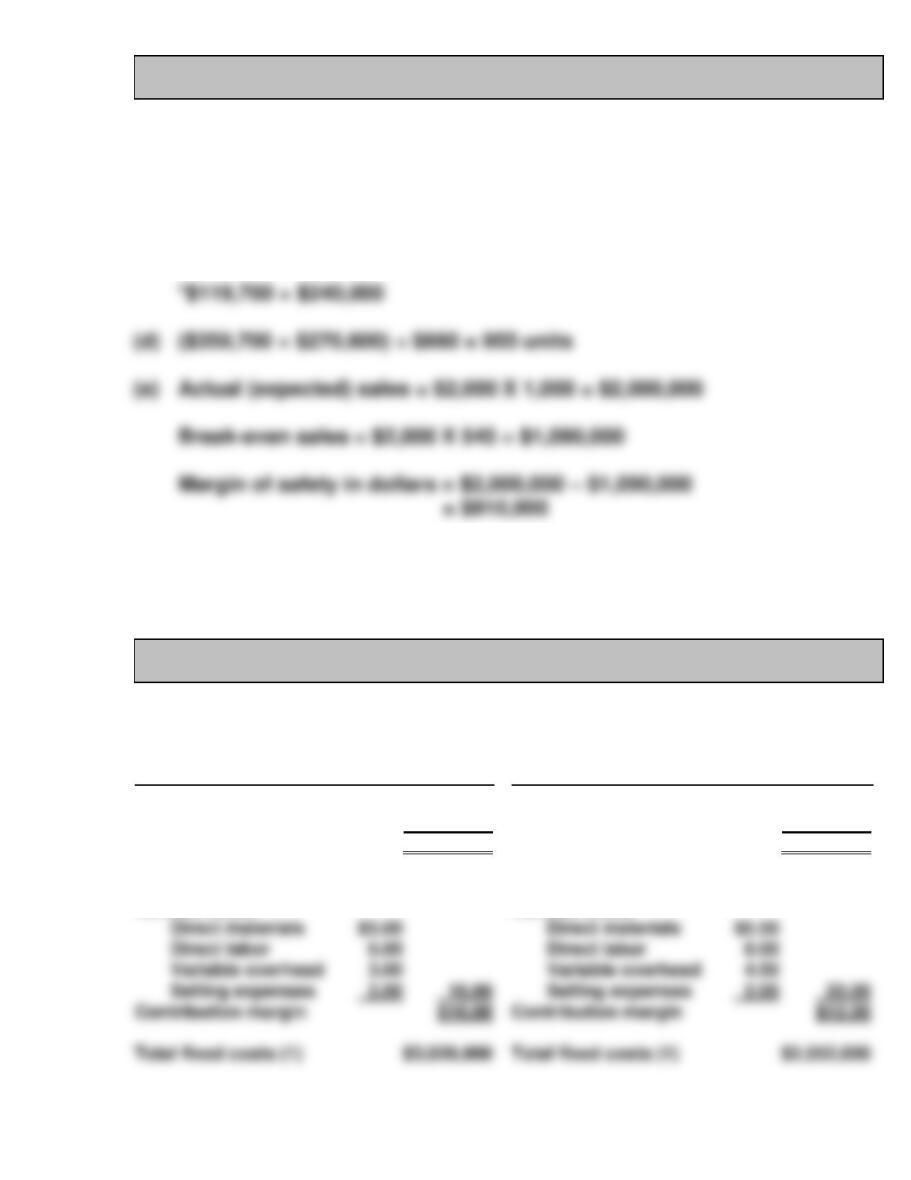
(a) $250 + $100 + $170 + $420 + $400 = $1,340 total variable costs
(b) Contribution margin per unit = $2,000 – $1,340 = $660
(c) $359,700* ÷ $660 = 545 units
Margin of safety ratio = $910,000 ÷ $2,000,000
= 45.5%
BYP 5-1 DECISION-MAKING ACROSS THE ORGANIZATION
(a)
(1) Capital-Intensive
(2) Labor-Intensive
Fixed manufacturing costs $2,524,000
Incremental selling expenses 502,000
Total fixed costs $3,026,000
Fixed manufacturing costs $1,550,000
Incremental selling expenses 502,000
Total fixed costs $2,052,000
Contribution margin $16.00
Contribution margin $12.00
Total fixed costs (1) $3,026,000
Total fixed costs (1) $2,052,000
Selling price $32.00
Variable costs
Selling price $32.00
Variable costs
Contribution margin per unit (2) $16.00
Contribution margin per unit (2) $12.00
Break-even in units (1) ÷ (2) 189,125
Break-even in units (1) ÷ (2) 171,000
(b) Creative Ideas Company would be indifferent between the two manufac-
turing methods at the volume (X) where total costs are equal.
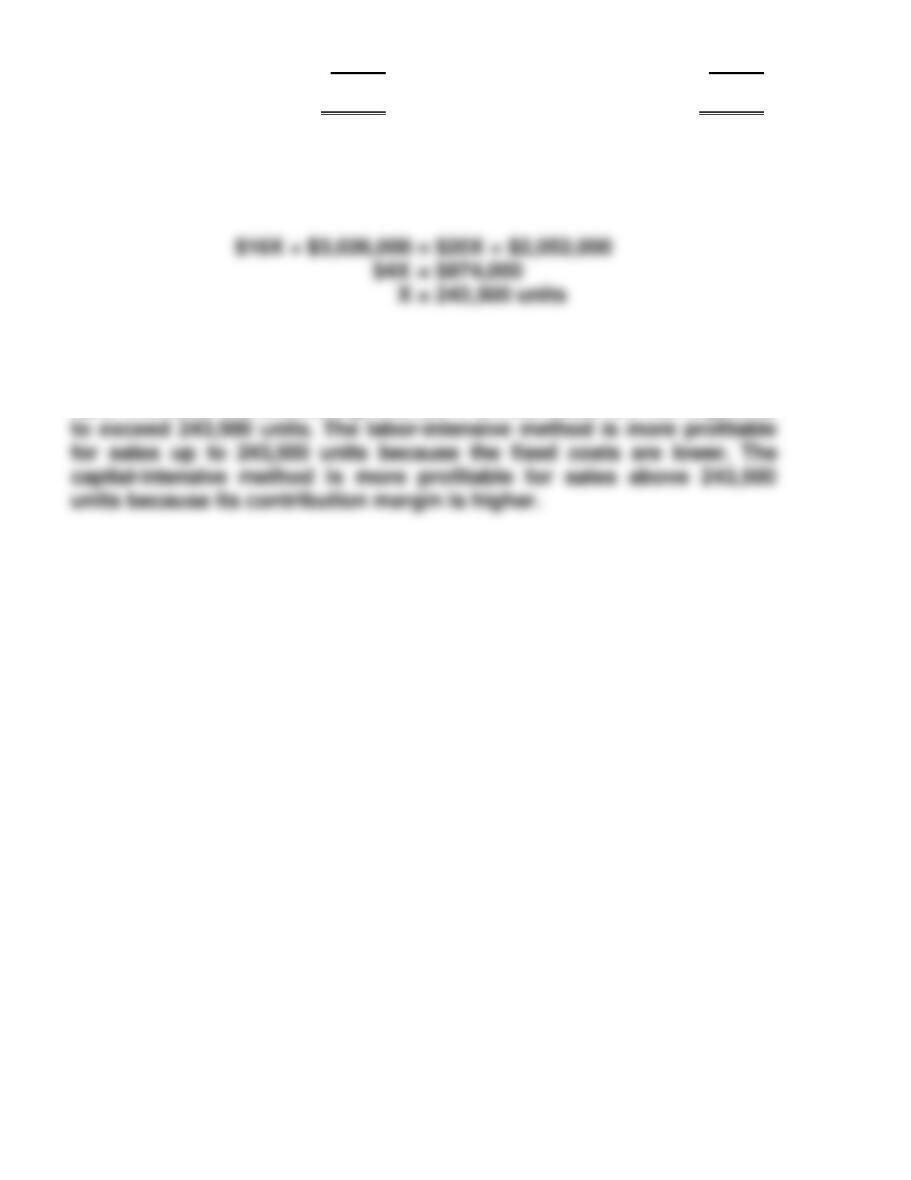
(c) Creative Ideas should employ the capital-intensive manufacturing
method if annual sales are expected to exceed 243,500 units and the
labor–intensive manufacturing method if annual sales are not expected
BYP 5-2 MANAGERIAL ANALYSIS
(a) The variable costs per unit are:
Cost of goods sold ($600,000 ÷ 240,000) ………………… $2.50
Selling expenses ($117,600 ÷ 240,000) …………………… .49
The break-even points are:
X = ($3.24 ÷ $5.00) X + $452,400
X = .65X + $452,400
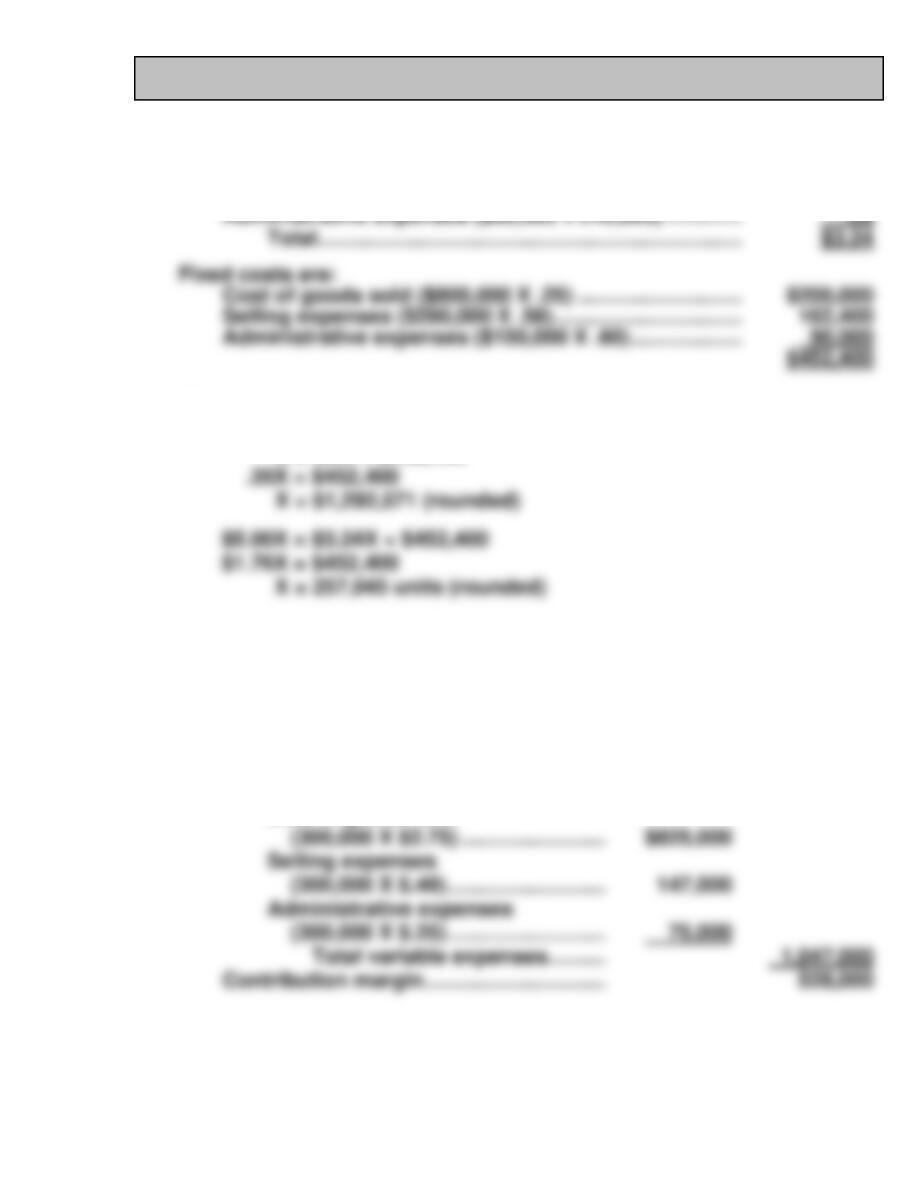
(b) Variable unit cost of goods sold = $2.75
($600,000 ÷ 240,000 = $2.50; $2.50 + $.25)
Sales volume = 300,000 units (240,000 X 125%)
Total sales = 300,000 X $5.25 = $1,575,000
Net income computation:
Sales ………………………………………………. $1,575,000
Variable expenses
Cost of goods sold
BYP 5-2 (Continued)
Fixed expenses
Cost of goods sold …………………… $200,000
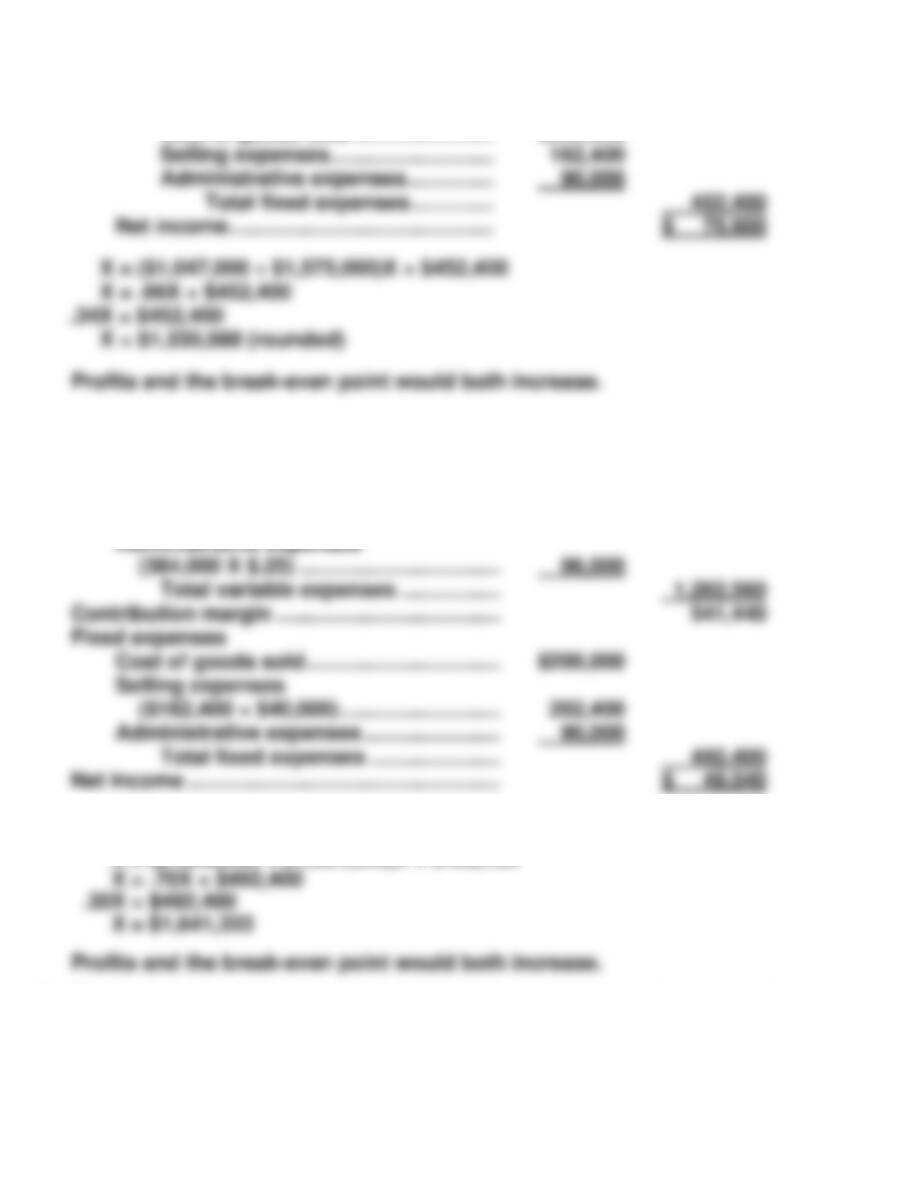
(c) Sales [384,000 (1) X ($5.00 – $.25)] …………… $1,824,000
Variable expenses
Cost of goods sold
(384,000 X $2.50) …………………………... $960,000
Selling expenses (384,000 X $.59) ……… 226,560
(1) Sales volume = 240,000 X 160% = 384,000
X = ($1,282,560 ÷ $1,824,000)X + $492,400
(d) Peri’s plan should be accepted. It produces a higher net income and
a lower break-even point than Paul’s plan.
BYP 5-3 REAL-WORLD FOCUS
(a) Sweeteners and packaging are a variable cost to Coca-Cola because
their use is directly proportional to the amount of product produced. If
the unit cost of a variable cost item increases, the contribution margin
will decline. This will lead to a decline in net income unless the company
can increase its selling price, increase the number of units it sells, or
reduce other costs.
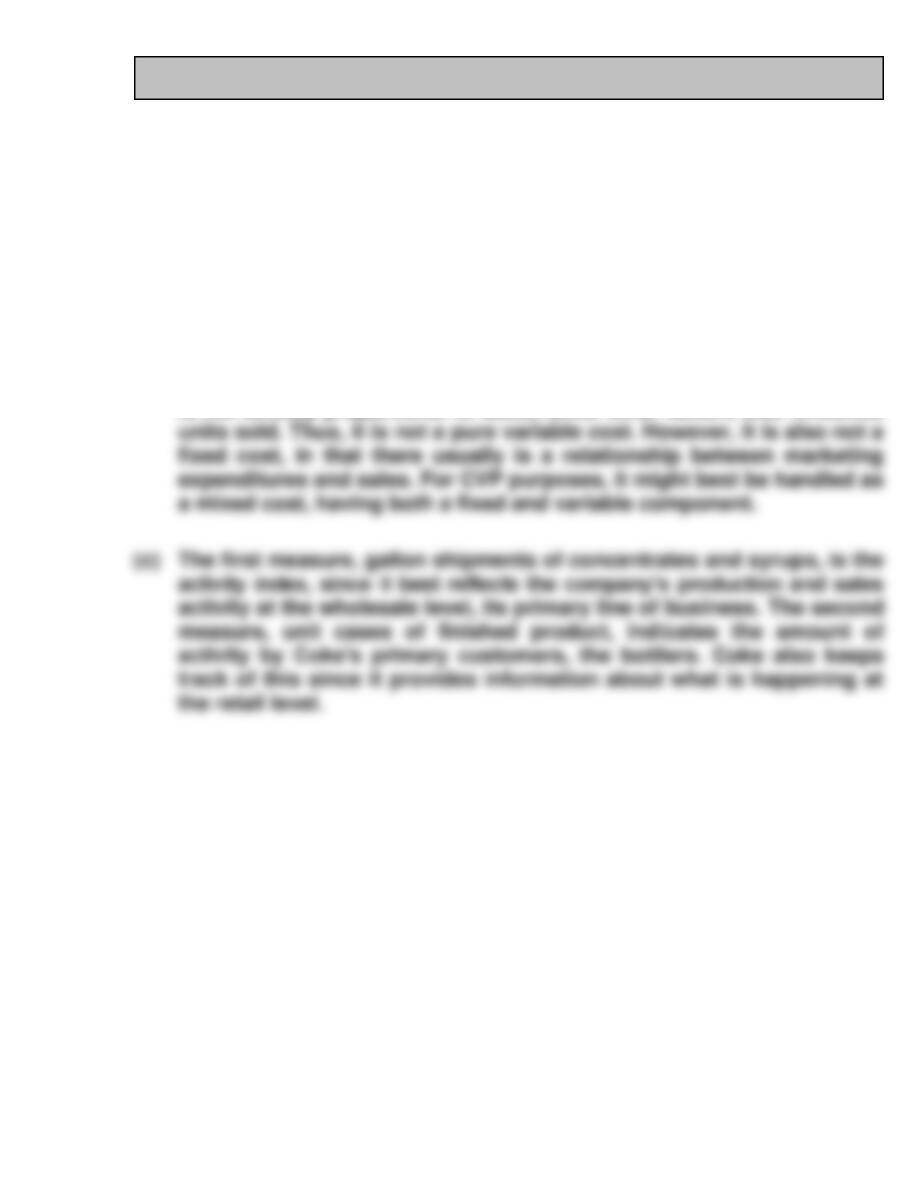
(b) This description makes the marketing expenditures sound like they are
a variable cost, since it suggests that they vary with the amount of units
sold. However, unlike variable costs, the relationship of marketing costs
is not directly proportional to sales, since other factors also influence
BYP 5-4 REAL-WORLD FOCUS
(a) Barnes and Noble has 1,362 stores with a total of 18.8 million square
feet. That is a huge investment in fixed costs that have very little value
in an e-book environment.
(b) Barnes and Noble’s big advantage (which enabled it to put lots of
small independent book sellers out of business), was that each of its
superstores had 150,000 books in stock. However, that is no longer as
(e) Barnes and Noble was one of the first companies to have an e-reader,
called the Rocket e-book. However, it abandoned its e-reader in 2003
because sales of e-books had been very low. Four years later Amazon
introduced its Kindle e-reader, which has been hugely popular. A second
BYP 5-5 COMMUNICATION ACTIVITY
To: My Roommate
From: Your Roommate
Subject: Cost-Volume-Profit Questions
In response to your request for help, I provide you the following:
(a) The mathematical formula for break-even sales is:
Break-even Sales = Variable Costs + Fixed Costs
Break-even sales in dollars is found by expressing variable costs as a
(b) The formulas for unit contribution margin and contribution margin
ratio differ as shown below:
Unit Selling Price – Unit Variable Costs = Unit Contribution Margin
(c) When contribution margin is used to determine break-even sales, total
fixed costs are divided by either the contribution margin ratio or unit
BYP 5-5 (Continued)
The formula for determining break-even sales in dollars is:
Fixed Costs ÷ Contribution Margin Ratio = Break-even Sales in Dollars
BYP 5-6 ETHICS CASE
(a) The stakeholders in this situation are:
Scott Bestor, accountant of Westfield Company.
The dislocated personnel of Westfield.
The senior management who made the decision.
(b) Scott is hiding an error and is knowingly deceiving the company’s
management with inaccurate data.
(c) Scott’s alternatives are:
BYP 5-7 ALL ABOUT YOU
(a) The variable gasoline cost of going one mile in the hybrid car would
be $0.09 ($3.60/40). The variable gasoline cost of going one mile in the
traditional car would be $0.12 ($3.60/30).
(b) The savings per mile of driving the hybrid vehicle would be $0.03
($0.12 – $0.09).