Problem 5-8AA (Concluded)
Part 2
If QP Corp. had been experiencing declining costs in the acquisition of
inventory, we would observe the opposite results in our comparisons.
Specifically:
Part 3
Advantages
FIFO: The advantage of using FIFO is that the inventory figure reported on
the balance sheet is likely similar to the current replacement cost.
Disadvantages
LIFO: Given the cost trends in the problem, the disadvantage of using LIFO
is that the inventory figure, which is also reported on the balance sheet,
will likely be understated in comparison to the current replacement costs.
Problem 5-9AB (25 minutes)
Part 1
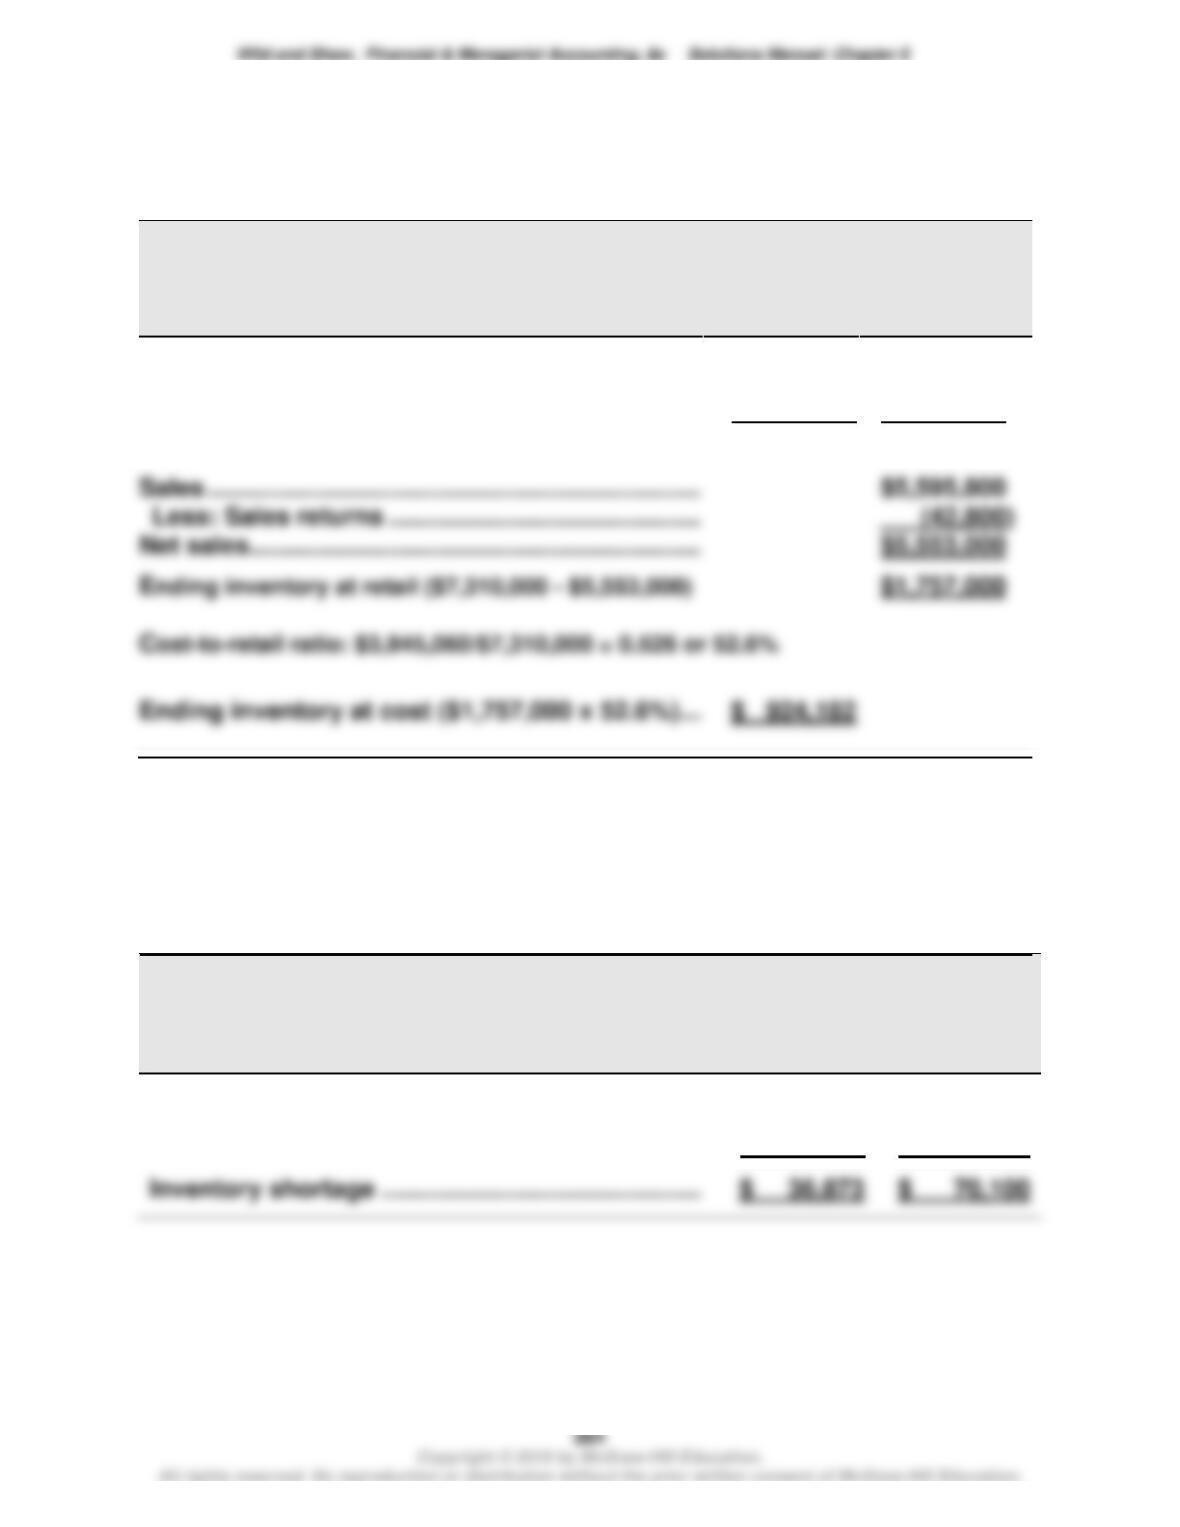
ALASKA COMPANY
Estimated Inventory
December 31
At Cost
At Retail
Goods available for sale
Beginning inventory……………………………………..
$ 469,010
$ 928,950
Cost of goods purchased ……………………………..
3,376,050
6,381,050
Goods available for sale ……………………………….
$3,845,060
$7,310,000
Less: Sales returns ………………………………………
Net sales ………………………………………………………..
Part 2
Estimated physical inventory at cost: $1,686,900 x 52.6% = $887,309
ALASKA COMPANY
Inventory Shortage
December 31
At Cost
At Retail
Estimated inventory (from part 1) ……………………….
$ 924,182
$ 1,757,000
Physical inventory ……………………………………………..
887,309
1,686,900
Problem 5-10AB (25 minutes)
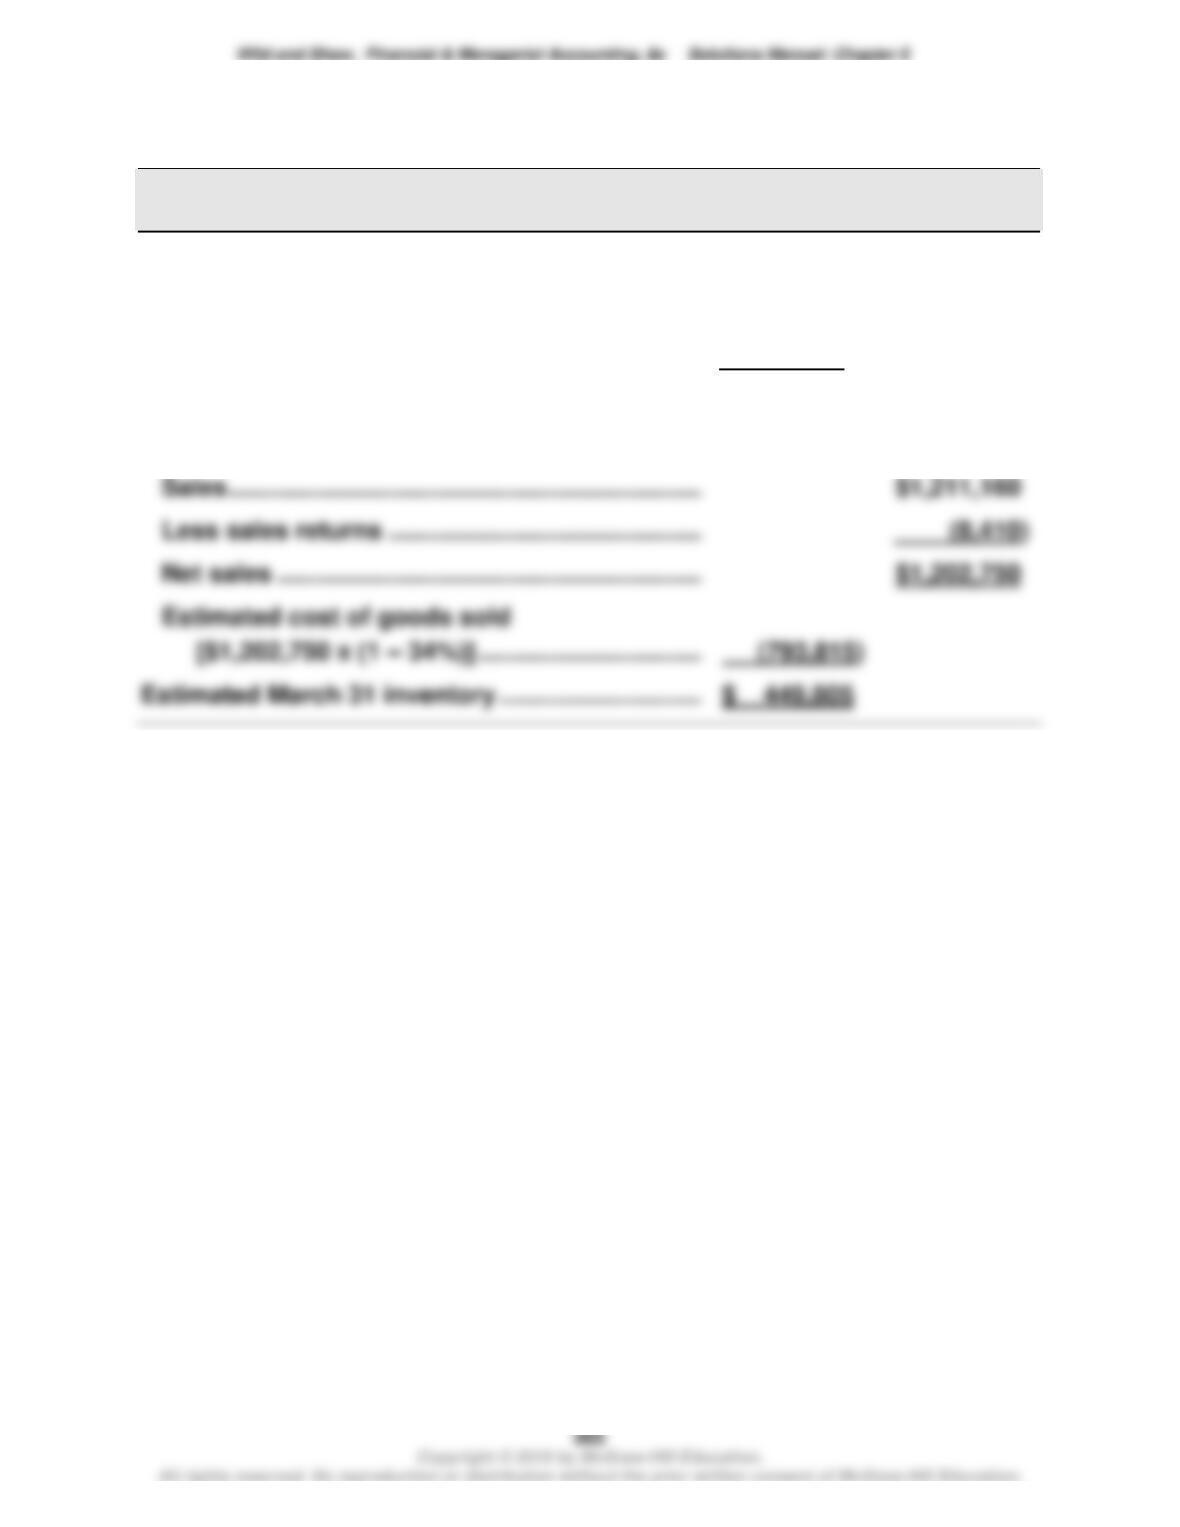
WAYWARD COMPANY
Estimated Inventory at March 31
Goods available for sale
Beginning inventory, Jan. 1 …………………………..
$ 302,580
Cost of goods purchased ………………………………..
941,040
Goods available for sale ………………………………….
1,243,620
Less estimated cost of goods sold
Sales …………………………..………………………………….
Net sales ……………………………………………………….
[$1,202,750 x (1 – 34%)] …………………………..….
Estimated March 31 inventory …………………………..
Wild and Shaw, Financial & Managerial Accounting, 8e Solutions Manual: Chapter 5
PROBLEM SET B
Problem 5-1B (40 minutes)
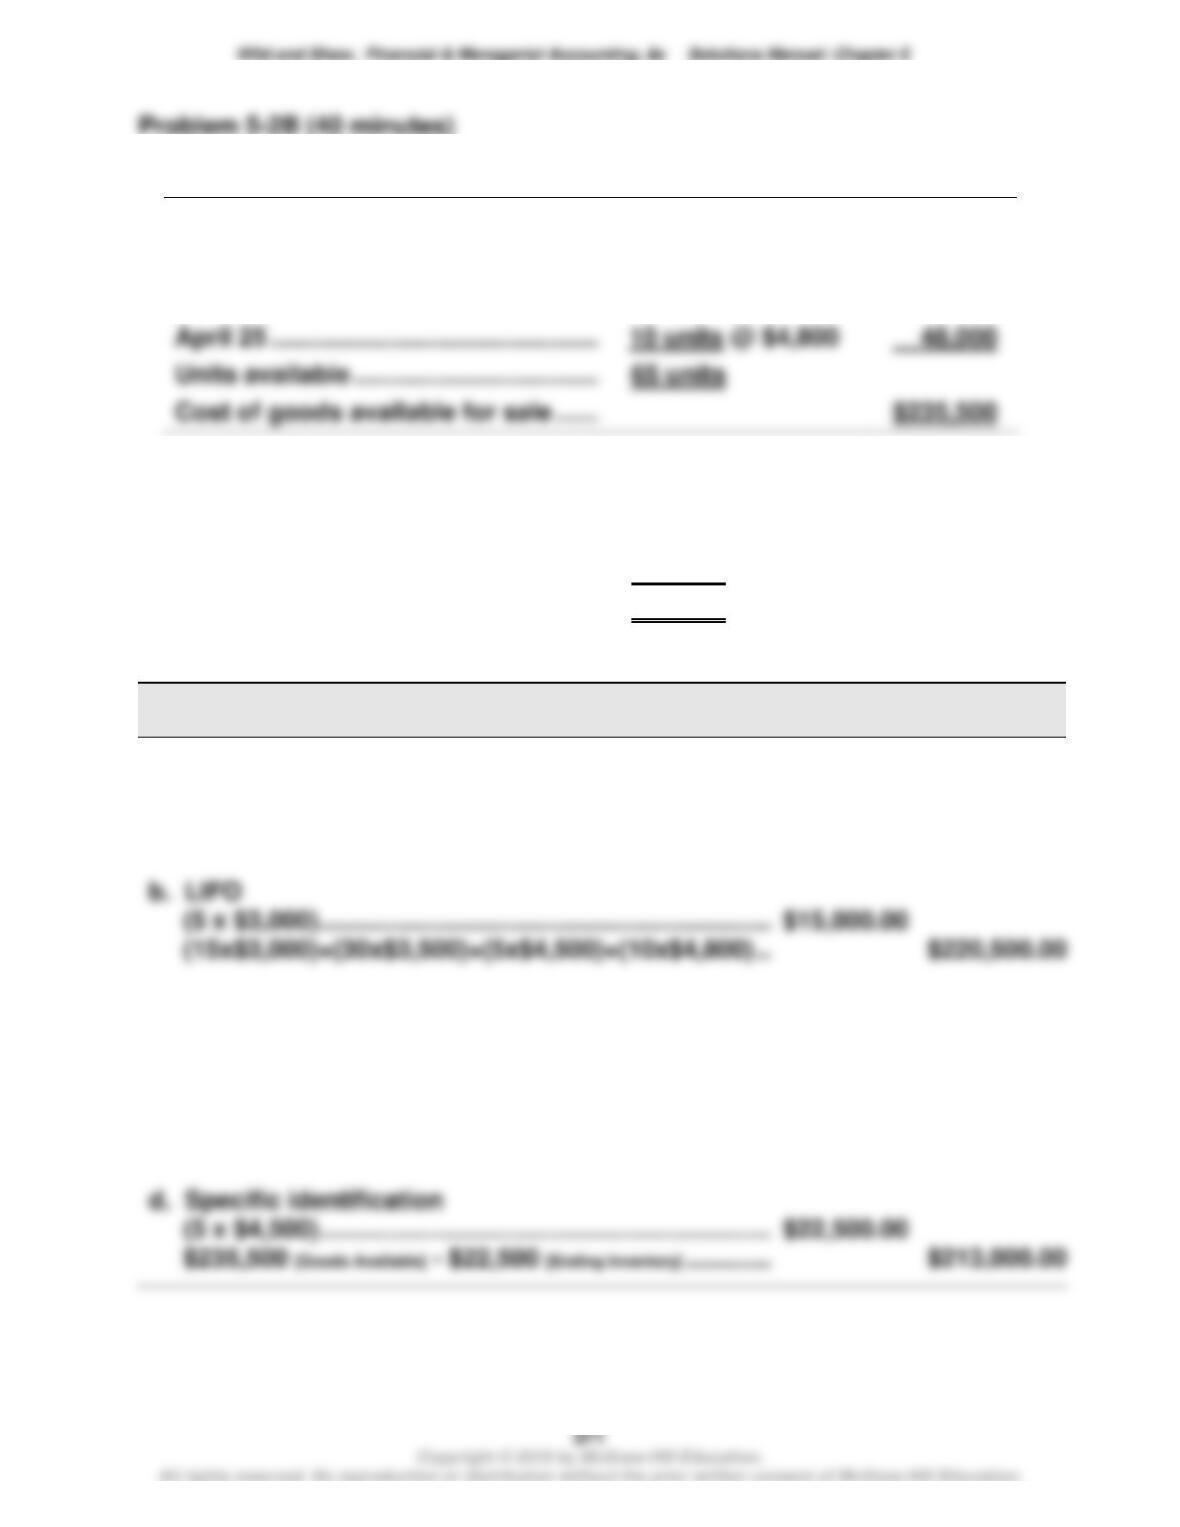
1. Compute cost of goods available for sale and units available for sale
Beginning inventory ……………………..
20 units @ $3,000
$ 60,000
April 6 ………………………………………….
30 units @ $3,500
105,000
April 17 …………………………………………
5 units @ $4,500
22,500
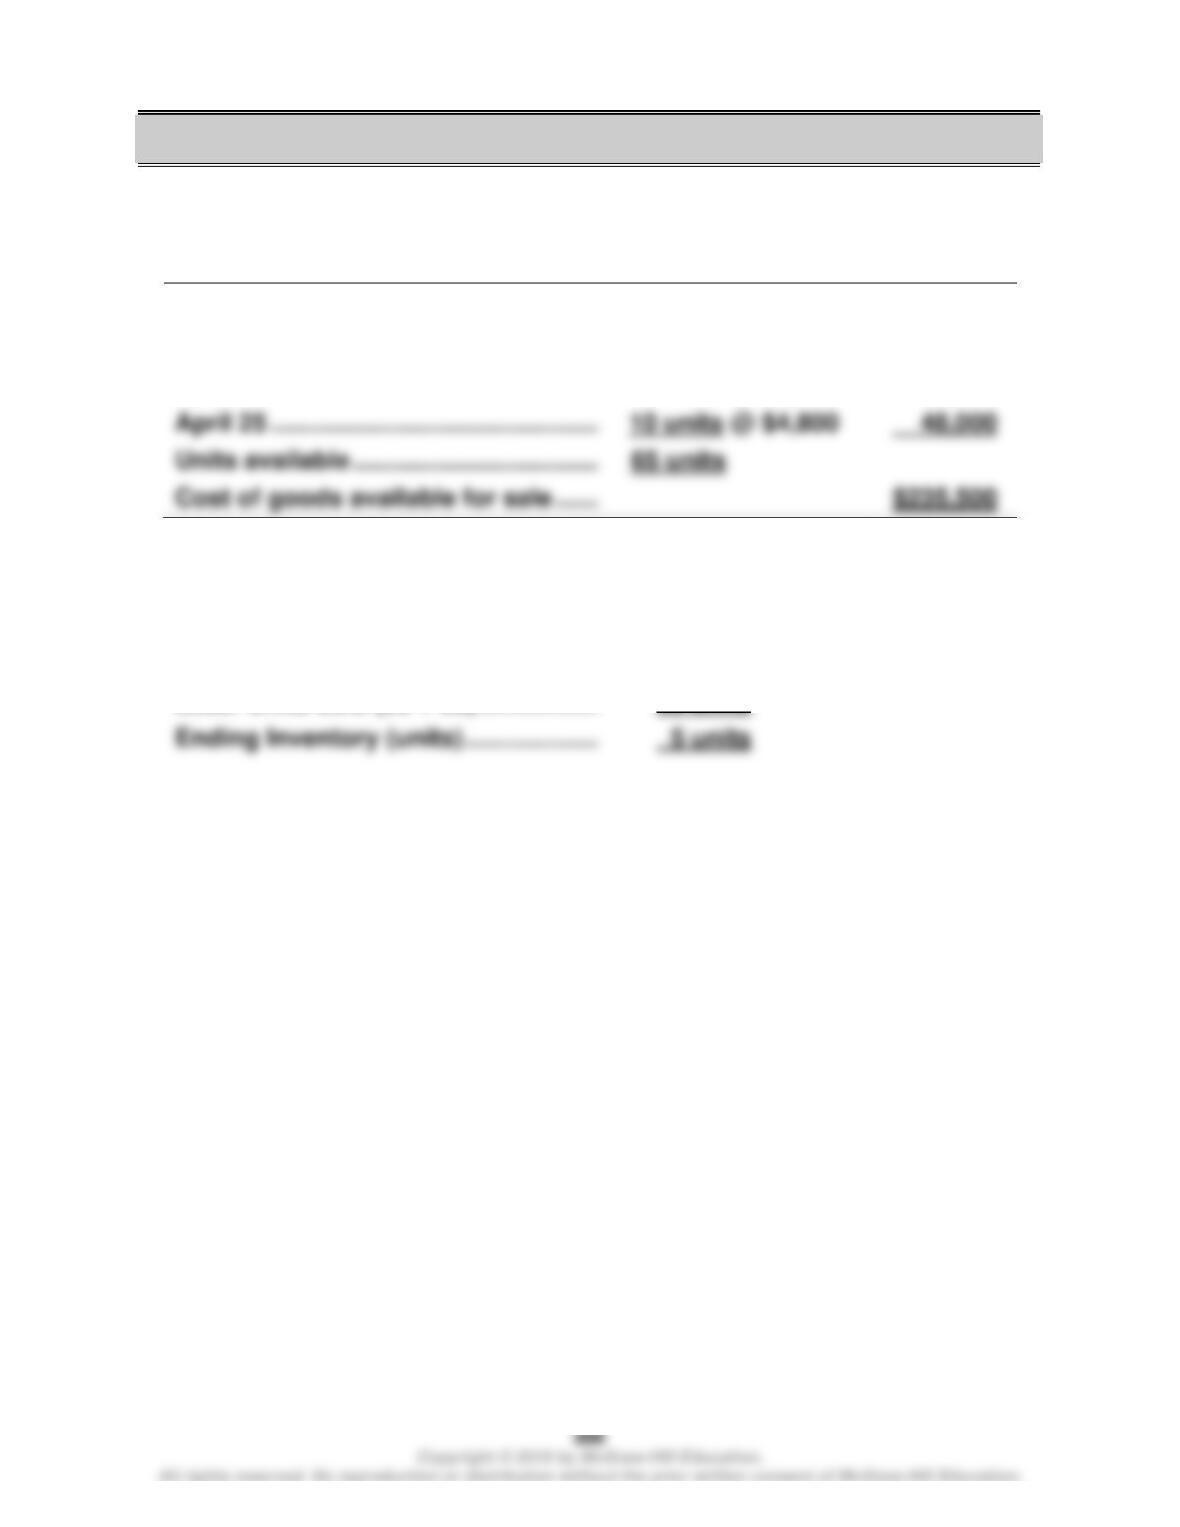
April 25 …………………………………………
10 units @ $4,800
Units available ………………………………
2. Units in ending inventory
Units available (from part 1) ……………………….
65 units
60 units
Problem 5-1B (Continued)
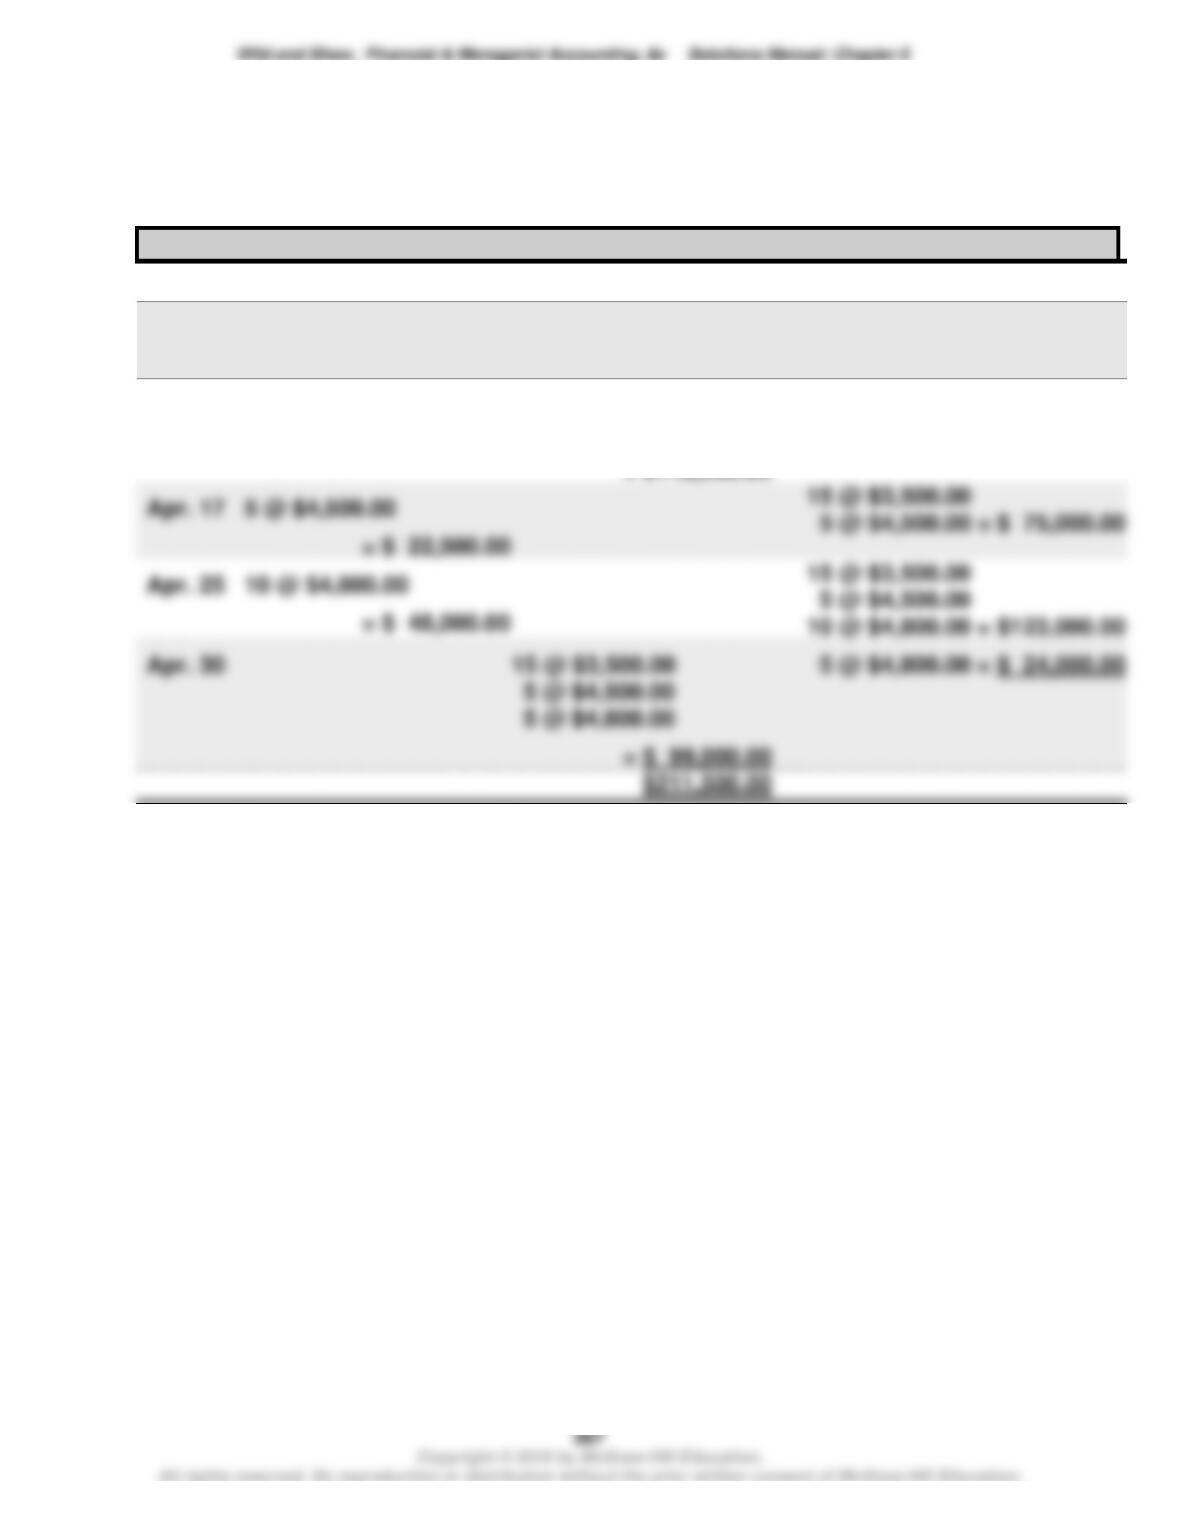
3a. FIFO perpetual
Date
Goods Purchased
Cost of Goods Sold
Inventory Balance
Apr. 1
20 @ $3,000.00 = $ 60,000.00
Apr. 6
30 @ $3,500.00
= $105,000.00
20 @ $3,000.00
30 @ $3,500.00 = $165,000.00
Apr. 9
20 @ $3,000.00
15 @ $3,500.00
Apr. 17
5 @ $4,500.00
= $ 22,500.00
15 @ $3,500.00 = $ 52,500.00
Problem 5-1B (Continued)
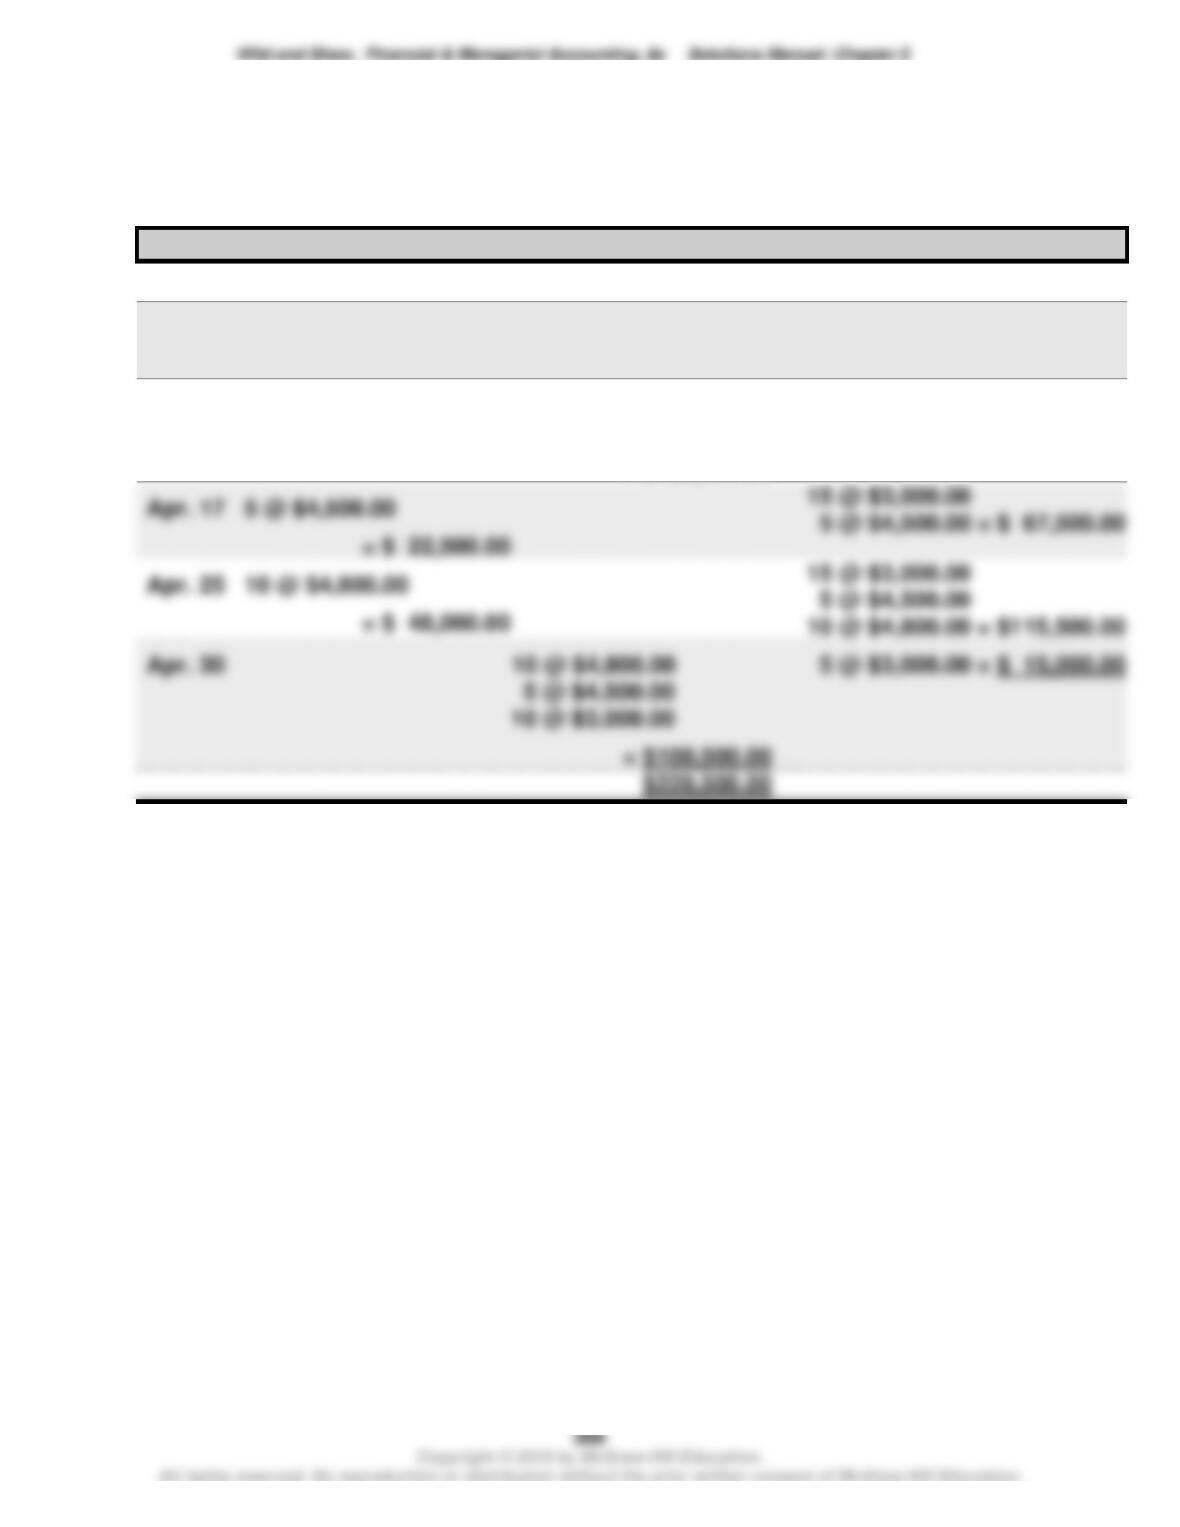
3b. LIFO perpetual
Date
Goods Purchased
Cost of Goods Sold
Inventory Balance
Apr. 1
20 @ $3,000.00 = $ 60,000.00
Apr. 6
30 @ $3,500.00
= $105,000.00
20 @ $3,000.00
30 @ $3,500.00 = $165,000.00
Apr. 9
30 @ $3,500.00
5 @ $3,000.00
= $120,000.00
15 @ $3,000.00 = $ 45,000.00
Apr. 17
5 @ $4,500.00
= $ 22,500.00
Problem 5-1B (Continued)
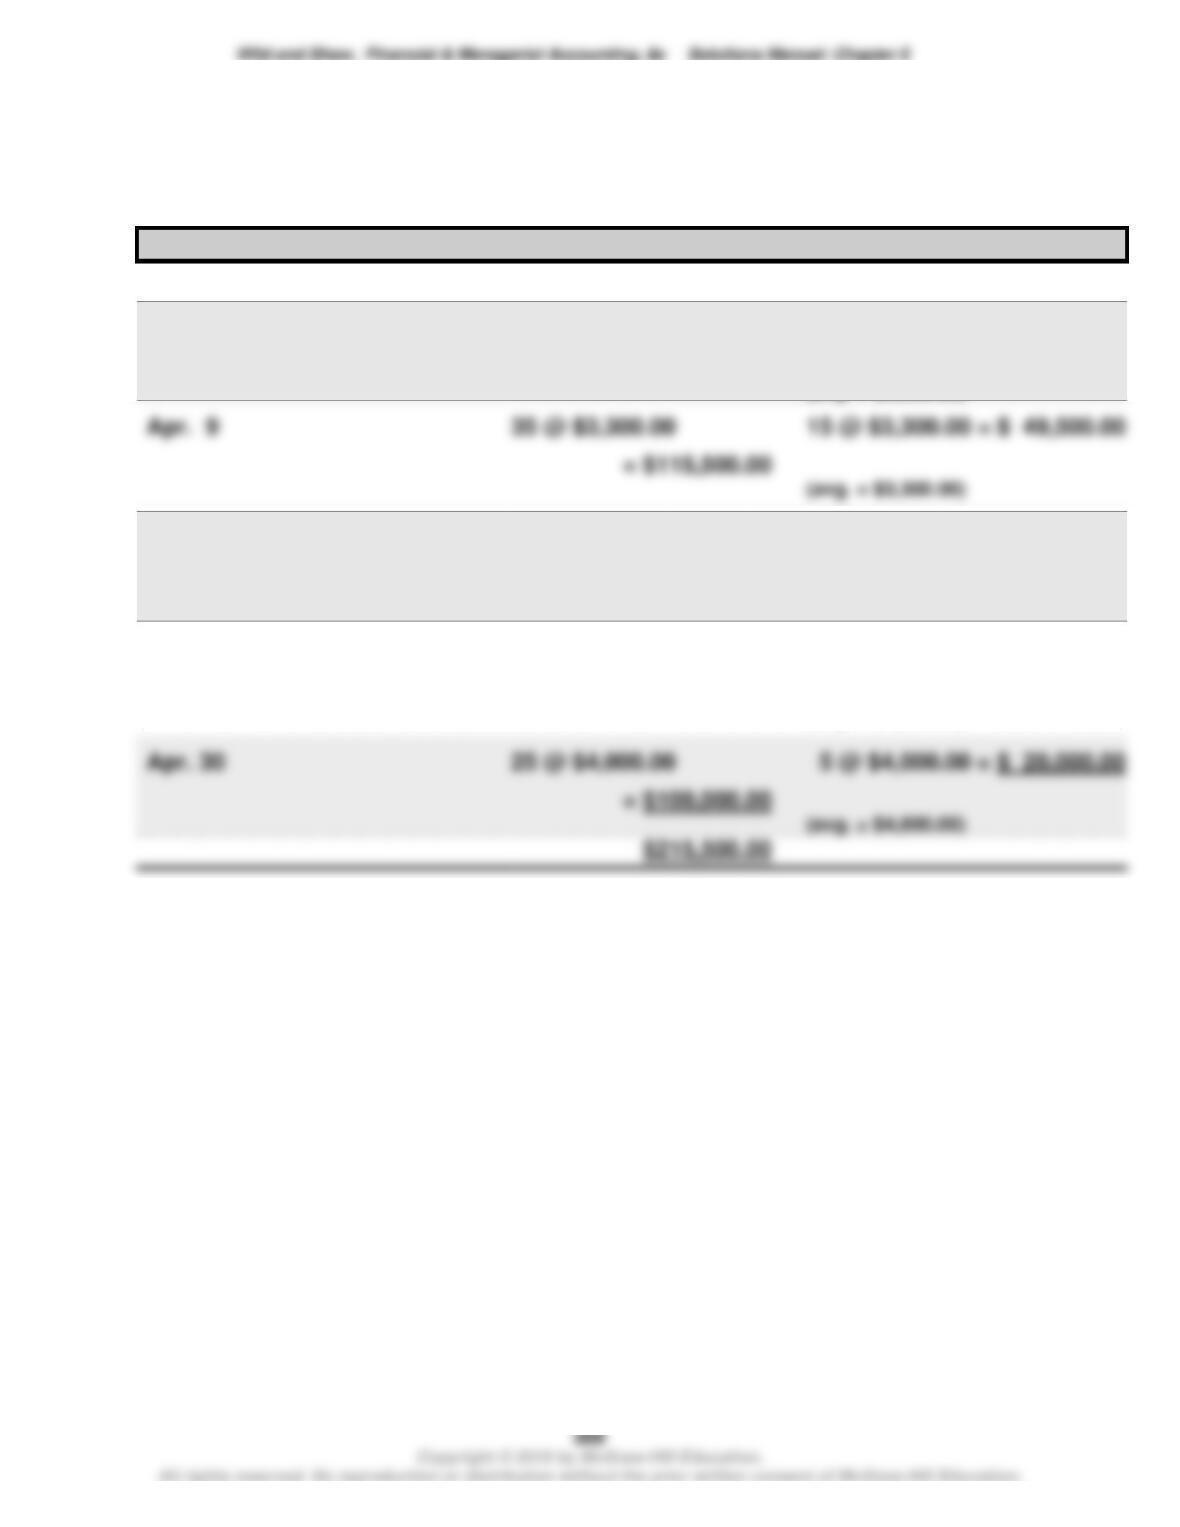
3c. Weighted Average perpetual
Date
Goods Purchased
Cost of Goods Sold
Inventory Balance
Apr. 1
20 @ $3,000.00 = $ 60,000.00
Apr. 6
30 @ $3,500.00
= $105,000.00
20 @ $3,000.00
30 @ $3,500.00 = $165,000.00
Apr. 9
15 @ $3,300.00 = $ 49,500.00
(avg. = $3,300.00)
Apr. 17
5 @ $4,500.00
= $ 22,500.00
15 @ $3,300.00
5 @ $4,500.00 = $ 72,000.00
(avg. = $3,600.00)
Apr. 25
10 @ $4,800.00
= $ 48,000.00
15 @ $3,300.00
5 @ $4,500.00
10 @ $4,800.00 = $120,000.00
(avg. = $4,000.00)
Problem 5-1B (Concluded)
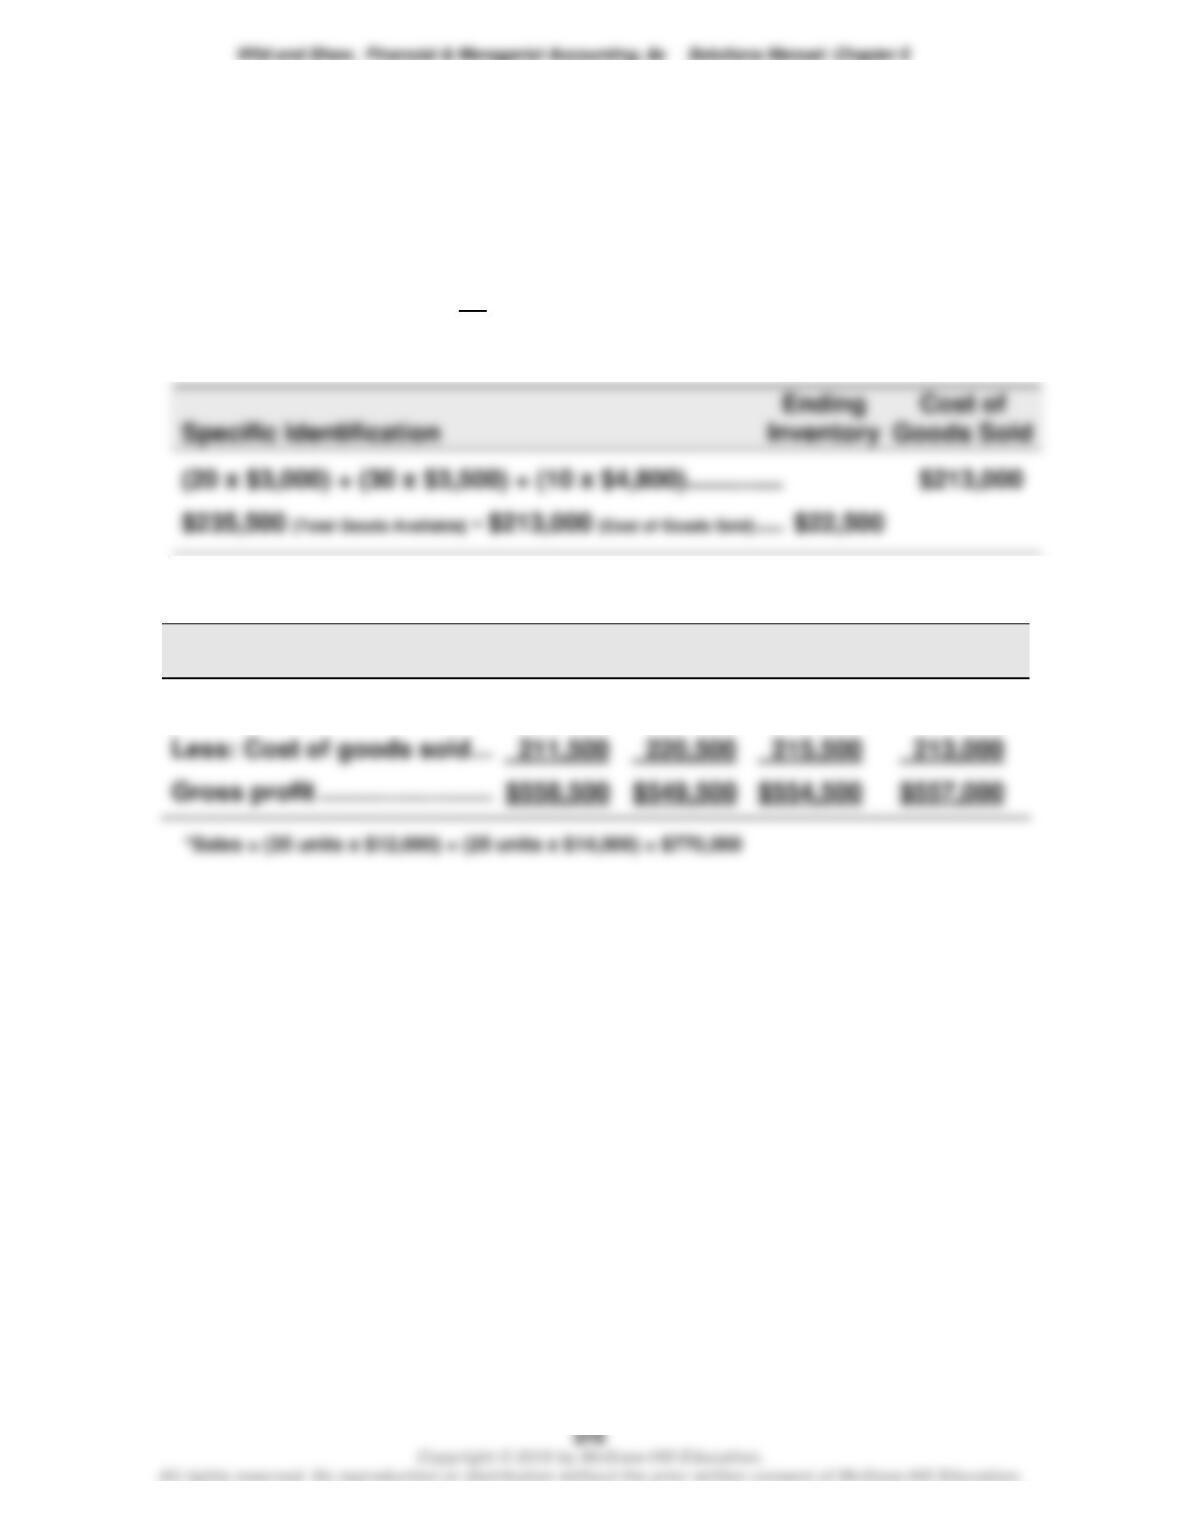
3d. Specific Identification
Cost of goods sold— 20 [8 + 12] units from beginning inventory
30 [27 + 3] units from April 6 purchase
10 units from April 25 purchase
60 units sold in total
4.
FIFO
LIFO
Weighted
Average
Specific
Identification
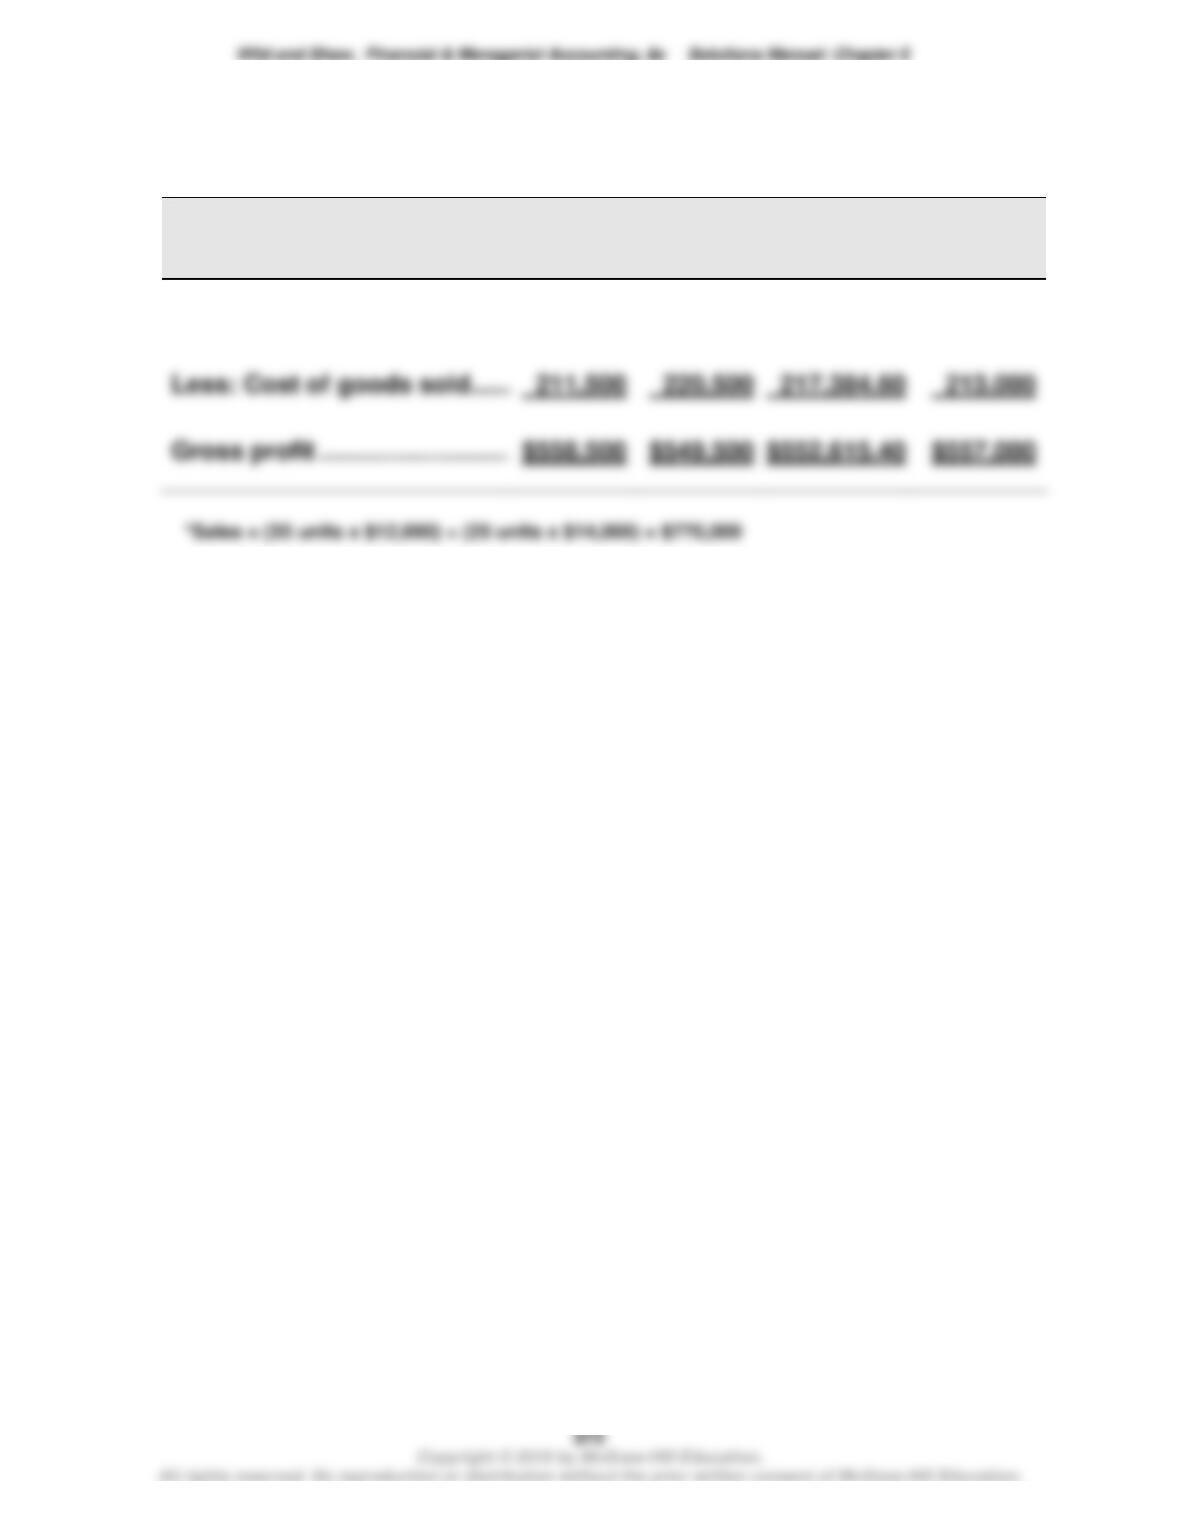
Sales* …………………………………
$770,000
$770,000
$770,000
$770,000
1. Compute cost of goods available for sale and units available for sale
Beginning inventory ……………………..
20 units @ $3,000
$ 60,000
April 6 ………………………………………….
30 units @ $3,500
105,000
April 17 …………………………………………
5 units @ $4,500
22,500
April 25 …………………………………………
10 units @ $4,800
Units available ………………………………
2. Units in ending inventory
Units available (from part 1) ……………………….
65 units
Less: Units sold (35 + 25) …………………………..
60 units
Ending Inventory (units) …………………………..
5 units
3.
Periodic Inventory
Ending
Inventory
Cost of
Goods Sold
a. FIFO
(5 x $4,800)…………………………………………………………
$24,000.00
(20x$3,000)+(30x$3,500)+(5x$4,500)+(5x$4,800) …..
$211,500.00
(5 x $3,000)…………………………………………………………
$15,000.00
c. Weighted average ($235,500/65=$3,623.08 [rounded])
(5 x $3,623.08)…………………………………………………….
$18,115.40
$235,500 [Goods Available] – $18,115.40 [Ending Inventory] ……..
$217,384.60
(5 x $4,500)…………………………………………………………
$22,500.00
Problem 5-2B (Concluded)
4.
FIFO
LIFO
Weighted
Average
Specific
Identifi-
cation
Sales* …………………………………
$770,000
$770,000
$770,000.00
$770,000
Problem 5-3B (40 minutes)
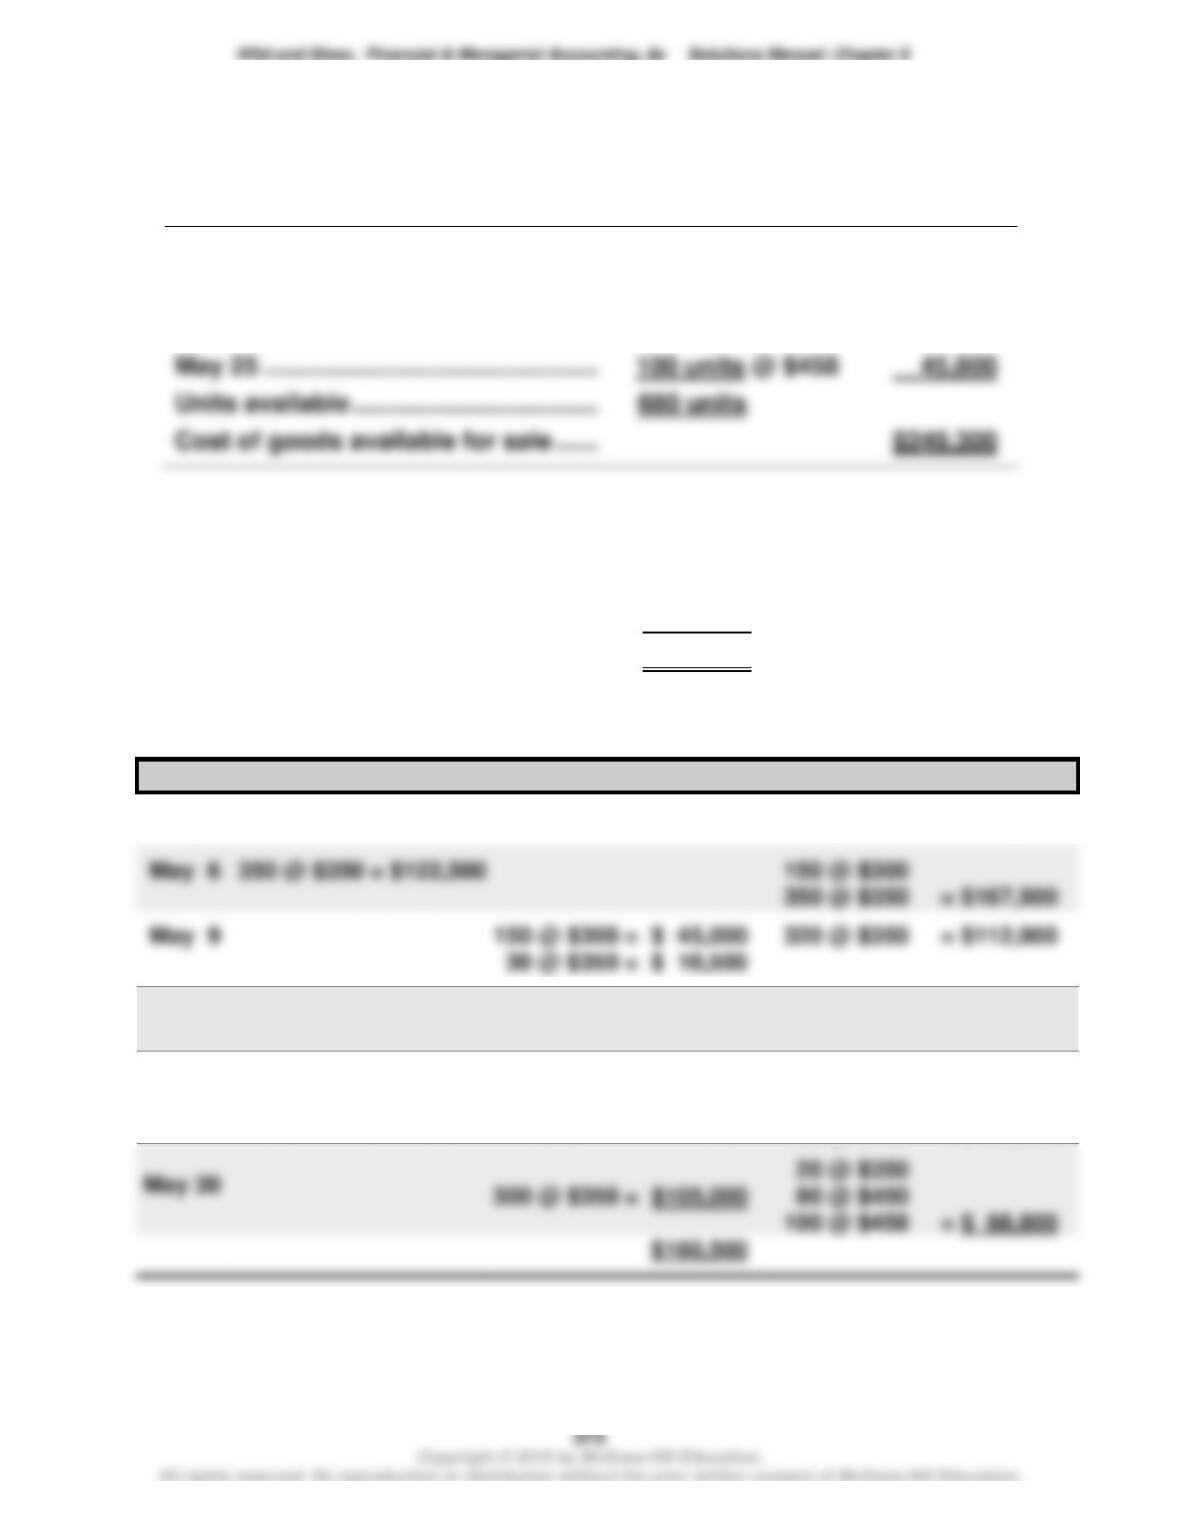
1. Compute cost of goods available for sale and units available for sale
Beginning inventory ……………………..
150 units @ $300
$ 45,000
May 6 …………………………………………..
350 units @ $350
122,500
May 17 ………………………………………….
80 units @ $450
36,000
May 25 ………………………………………….
100 units @ $458
Units available …………………………..….
2. Units in ending inventory
Units available (from part 1) ……………………….
680 units
Less: Units sold (180 + 300) ……………………….
480 units
Ending Inventory (units) …………………………..
200 units
3a. FIFO perpetual
Date
Goods Purchased
Cost of Goods Sold
Inventory Balance
May 1
150 @ $300 = $ 45,000
May 6
150 @ $300
May 17
80 @ $450 = $ 36,000
320 @ $350
80 @ $450 = $148,000
May 25
100 @ $458 = $ 45,800
320 @ $350
80 @ $450
100 @ $458 = $193,800
Problem 5-3B (Continued)
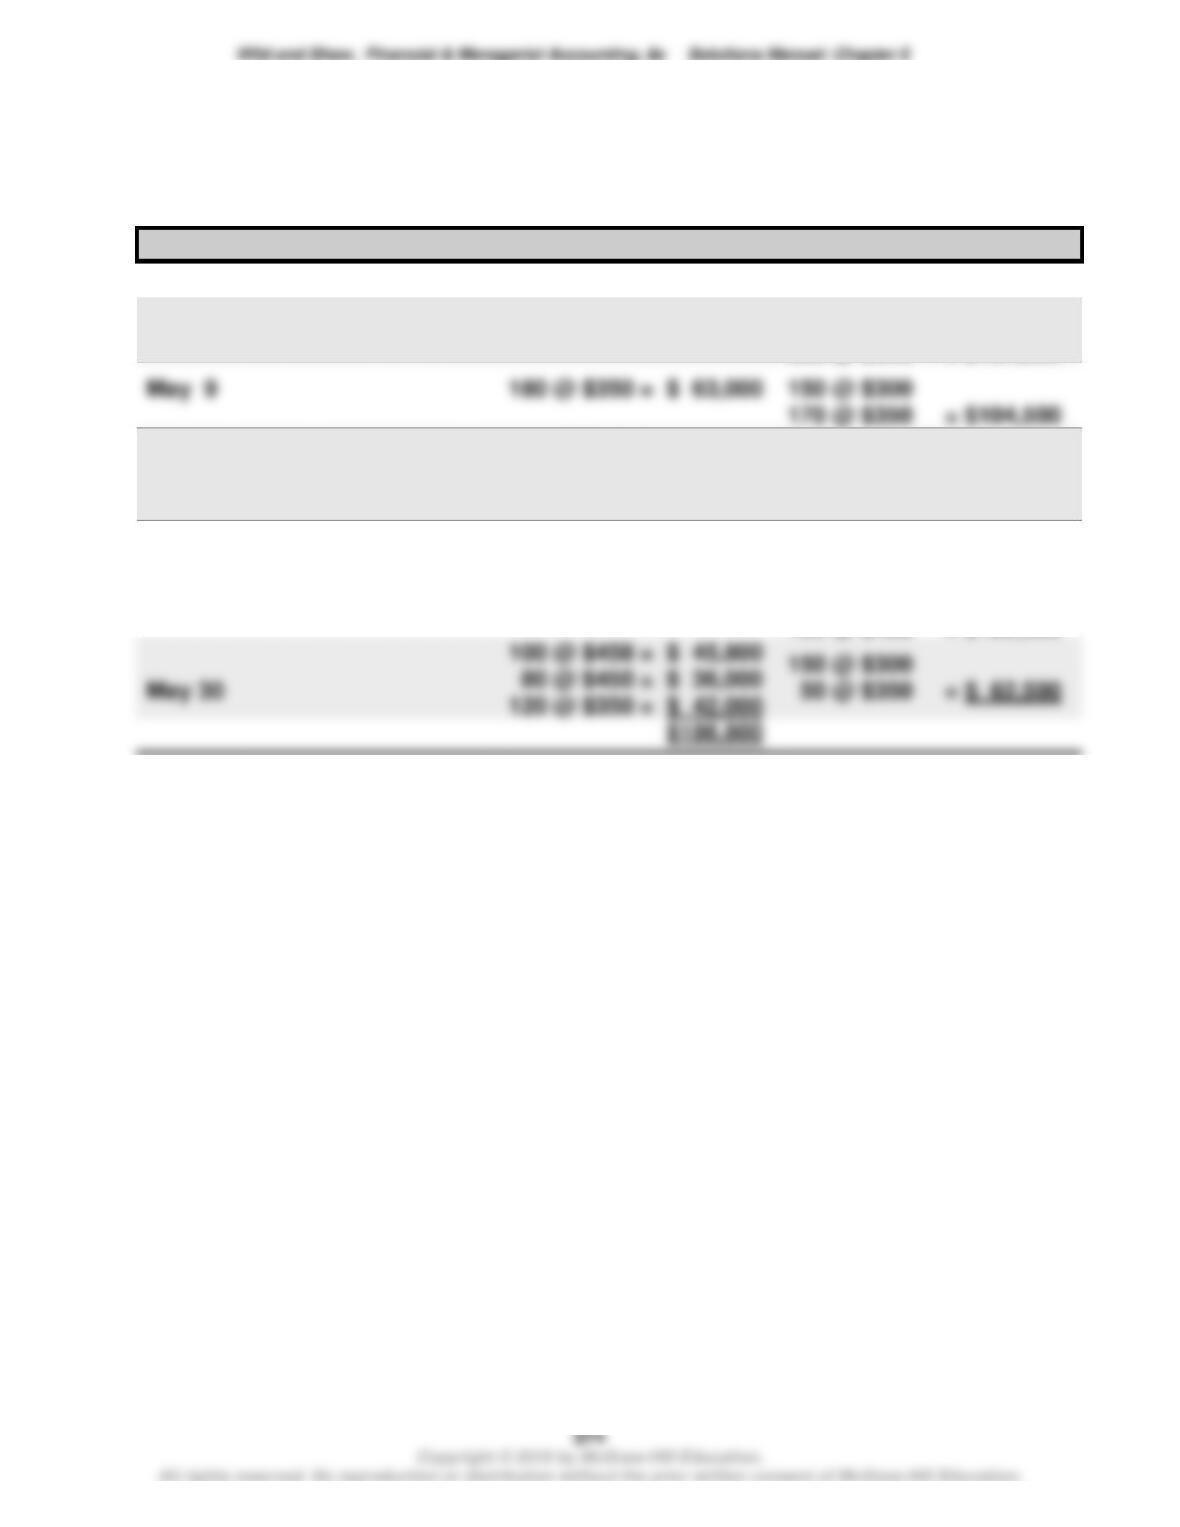
3b. LIFO perpetual
Date
Goods Purchased
Cost of Goods Sold
Inventory Balance
May 1
150 @ $300 = $ 45,000
May 6
350 @ $350 = $122,500
150 @ $300
350 @ $350 = $167,500
May 9
180 @ $350 = $ 63,000
150 @ $300
170 @ $350 = $104,500
May 17
80 @ $450 = $ 36,000
150 @ $300
170 @ $350
80 @ $450 = $140,500
May 25
100 @ $458 = $ 45,800
150 @ $300
170 @ $350
80 @ $450
100 @ $458 = $186,300
Problem 5-3B (Continued)
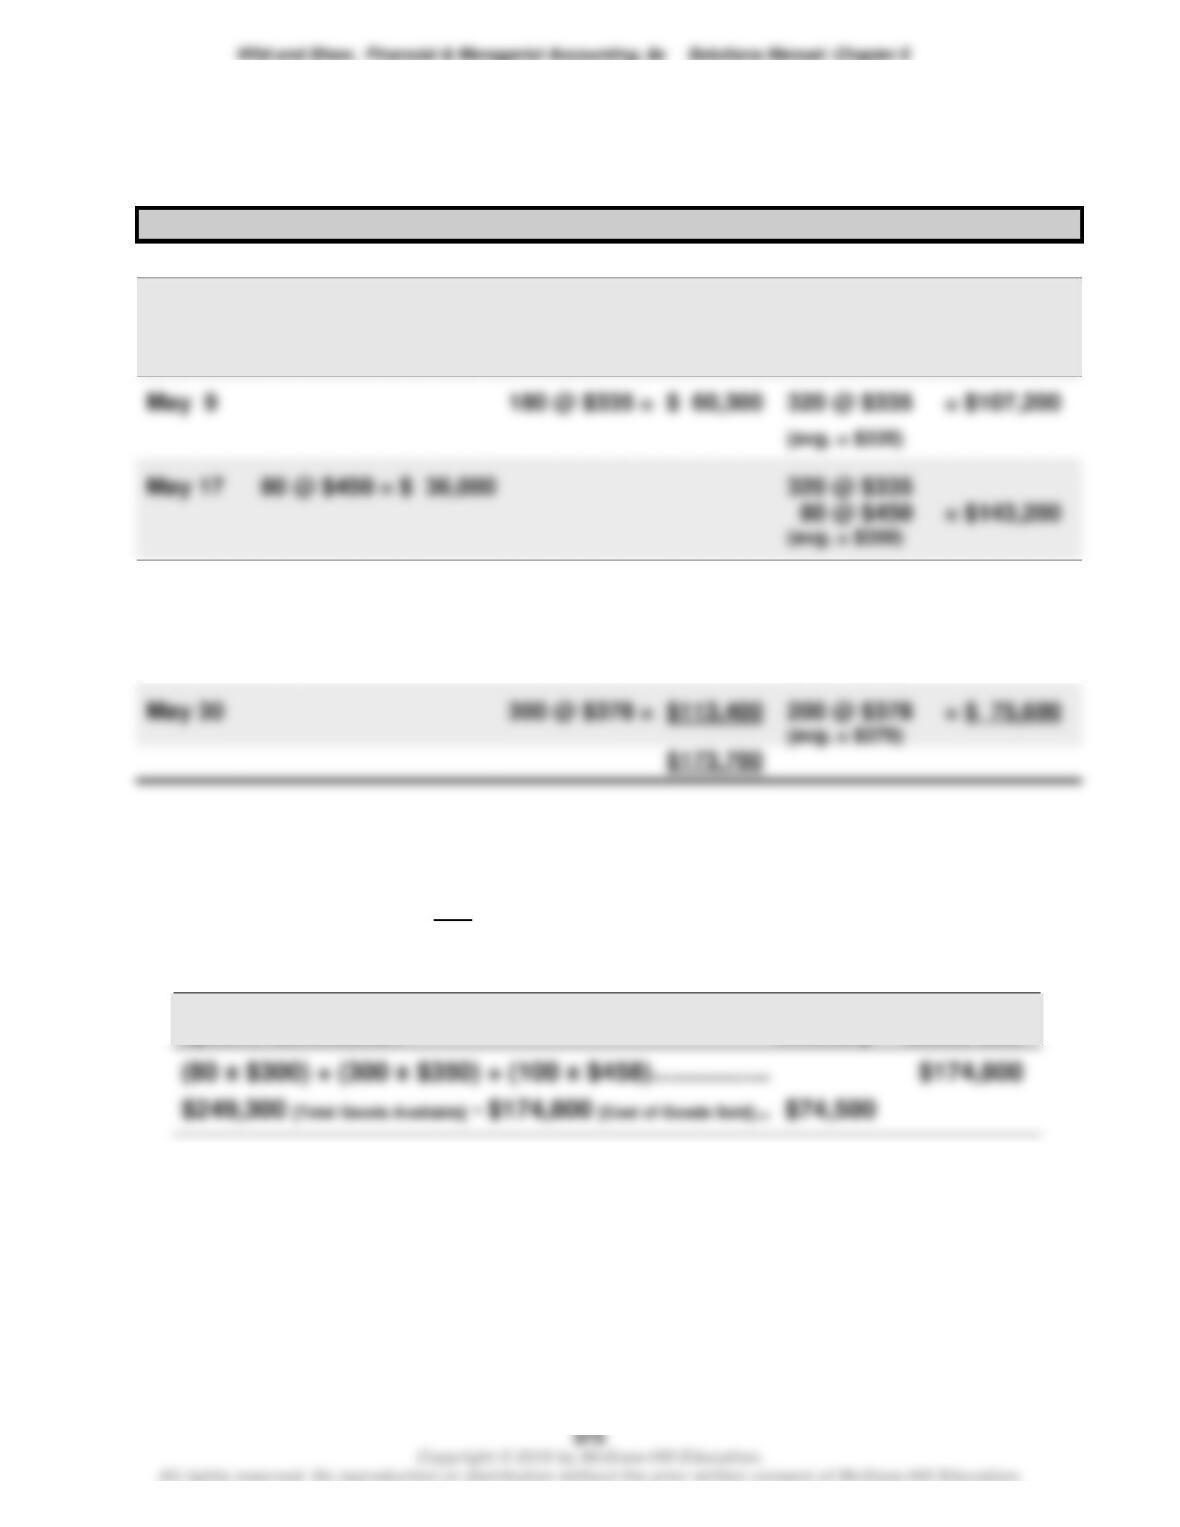
3c. Weighted Average perpetual
Date
Goods Purchased
Cost of Goods Sold
Inventory Balance
May 1
150 @ $300 = $ 45,000
May 6
350 @ $350 = $122,500
150 @ $300
350 @ $350 = $167,500
(avg. = $335)
(avg. = $335)
May 17
320 @ $335
(avg. = $358)
May 25
100 @ $458 = $ 45,800
320 @ $335
80 @ $450
100 @ $458 = $189,000
(avg. = $378)
200 @ $378 = $ 75,600
3d. Specific Identification
Cost of goods sold— 80 units from beginning inventory
300 [100 + 200] units from May 6 purchase
100 units from May 25 purchase
480 units sold in total
Ending Cost of
Problem 5-3B (Continued)
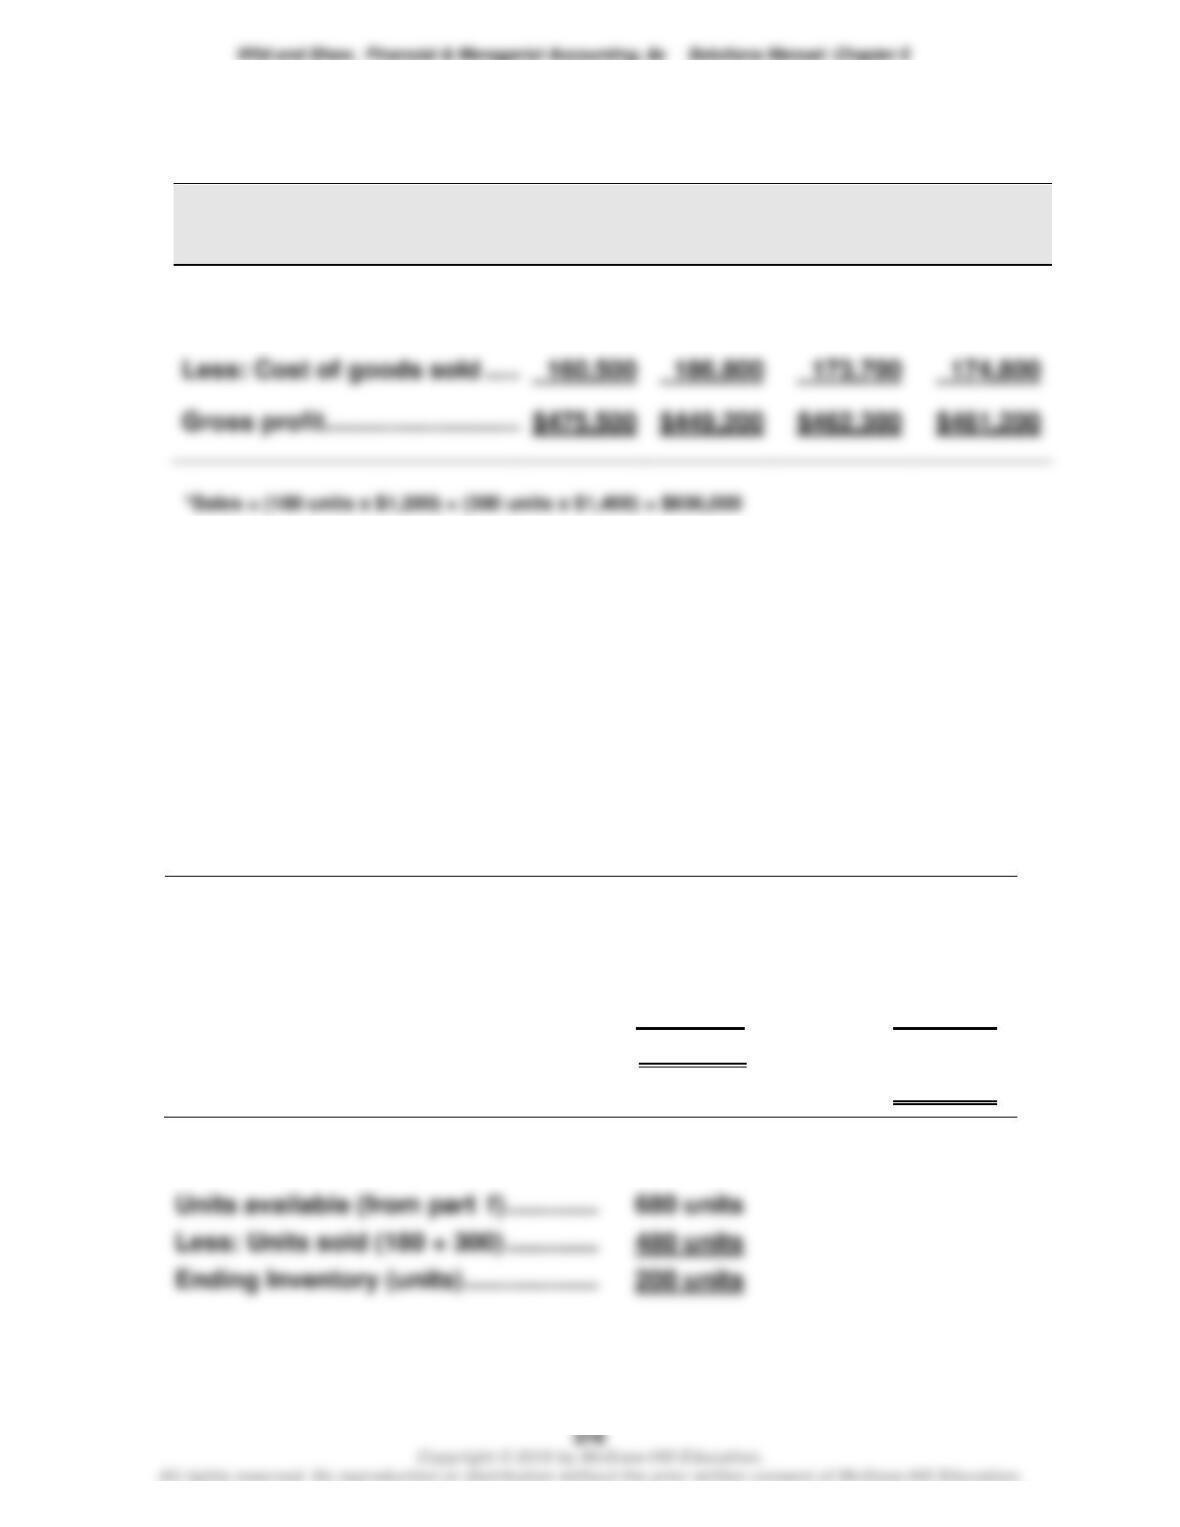
4.
FIFO
LIFO
Weighted
Average
Specific
Identifi-
cation
Sales* ………………………………..
$636,000
$636,000
$636,000
$636,000
5. FIFO. The manager of Aloha Company likely will prefer the FIFO method
because it would yield the largest gross profit (in this period of rising
costs). This would give the manager the highest bonus based on gross
profit.
Problem 5-4B (40 minutes)
1. Compute cost of goods available for sale and units available for sale
Beginning inventory ……………………..
150 units @ $300
$ 45,000
May 6 …………………………………………..
350 units @ $350
122,500
May 17 ………………………………………….
80 units @ $450
36,000
May 25 ………………………………………….
100 units @ $458
45,800
Units available ………………………………
680 units
Cost of goods available for sale …….
$249,300
2. Units in ending inventory
Units available (from part 1) ……………………….
680 units
Less: Units sold (180 + 300) ……………………….
480 units
Problem 5-4B (Concluded)
3.
Periodic Inventory
Ending
Inventory
Cost of
Goods Sold
a. FIFO
(100 x $458.00) + (80 x $450.00) + (20 x $350.00) ….
$88,800.00
(150 x $300.00) + (330 x $350.00) …………………………
$160,500.00
b. LIFO
(150 x $300.00) + (50 x $350.00) …………………………..
$62,500.00
(100 x $458.00) + (80 x $450.00) + (300 x $350.00) ..
$186,800.00
c. Weighted average ($249,300/680=$366.62 [rounded])
(200 x $366.62) …………………………………………………..
$73,324.00
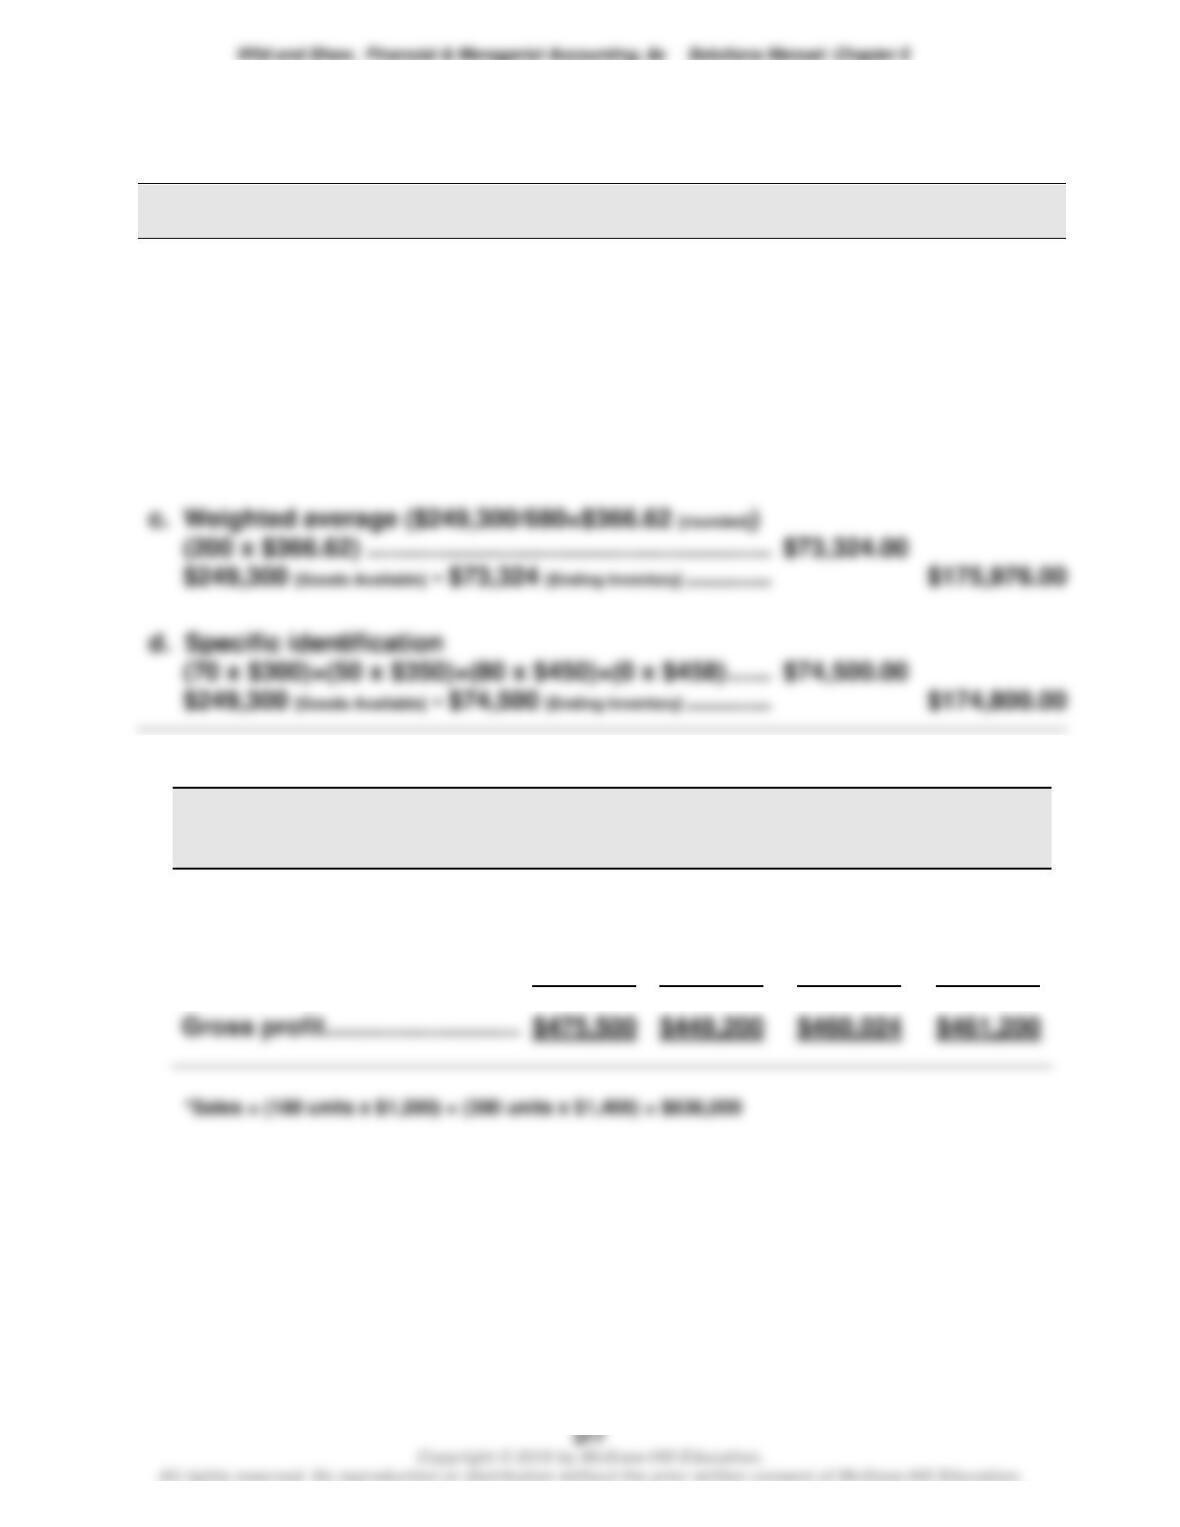
d. Specific identification
(70 x $300)+(50 x $350)+(80 x $450)+(0 x $458) …….
$74,500.00
4.
FIFO
LIFO
Weighted
Average
Specific
Identifi-
cation
Sales* ………………………………..
$636,000
$636,000
$636,000
$636,000
Less: Cost of goods sold ……
160,500
186,800
175,976
174,800
5. FIFO. The manager likely will prefer the FIFO method because it would
yield the largest gross profit (in this period of rising costs). This would
give the manager the highest bonus based on gross profit.
Problem 5-5B (50 minutes)
Per Unit
Total
Total
LCM Applied
Inventory Items
Units
Cost
Market
Cost
Market
to Items
Office furniture
Desks ………………….
536
$261
$305
$139,896
$163,480
$139,896
Chairs ………………….
395
227
256
89,665
101,120
89,665
Mats …………………….
687
49
43
33,663
29,541
29,541
Bookshelves ……….
421
93
82
39,153
34,522
34,522
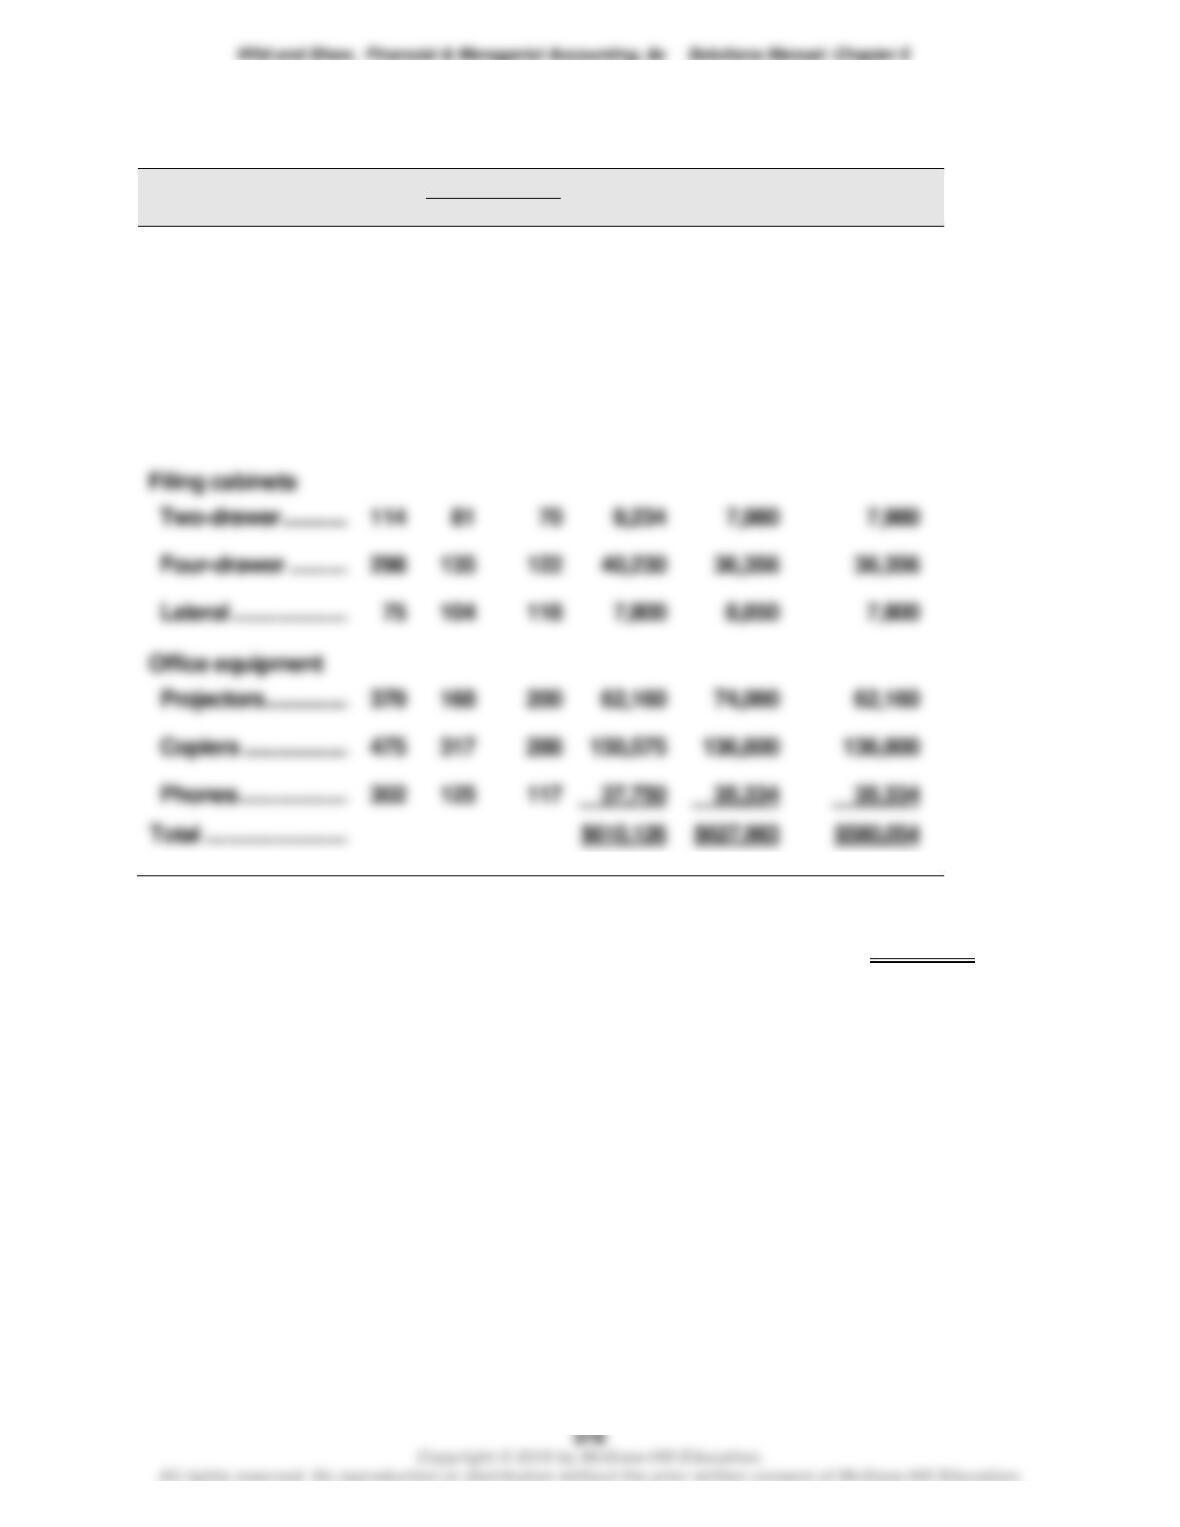
Two–drawer …………
114
81
70
9,234
Four–drawer ………..
298
135
122
40,230
36,356
36,356
Lateral …………………
75
104
118
Projectors ……………
370
168
200
62,160
74,000
62,160
Copiers ……………….
475
317
288
136,800
1. Lower of cost or market for inventory applied separately = $580,054
2.
Dec 31
Cost of Goods Sold ……………………………………………..
30,072
Merchandise Inventory …………………………………..
30,072
Adjust inventory cost to market.
$30,072 = $610,126 – $580,054
Problem 5-6B (35 minutes)
Part 1
(a)
Cost of goods sold
Year 1
Year 2
Year 3
Reported ……………………………………
$ 207,200
$ 213,800
$ 197,030
Adjustments: 12/31/Year 1 error ……
+ 18,000
– 18,000
12/31/Year 2 error ……
________
– 26,000
+ 26,000
Corrected …………………………………..
$ 225,200
$ 169,800
$ 223,030
(b)
Net income
Year 1
Year 2
Year 3
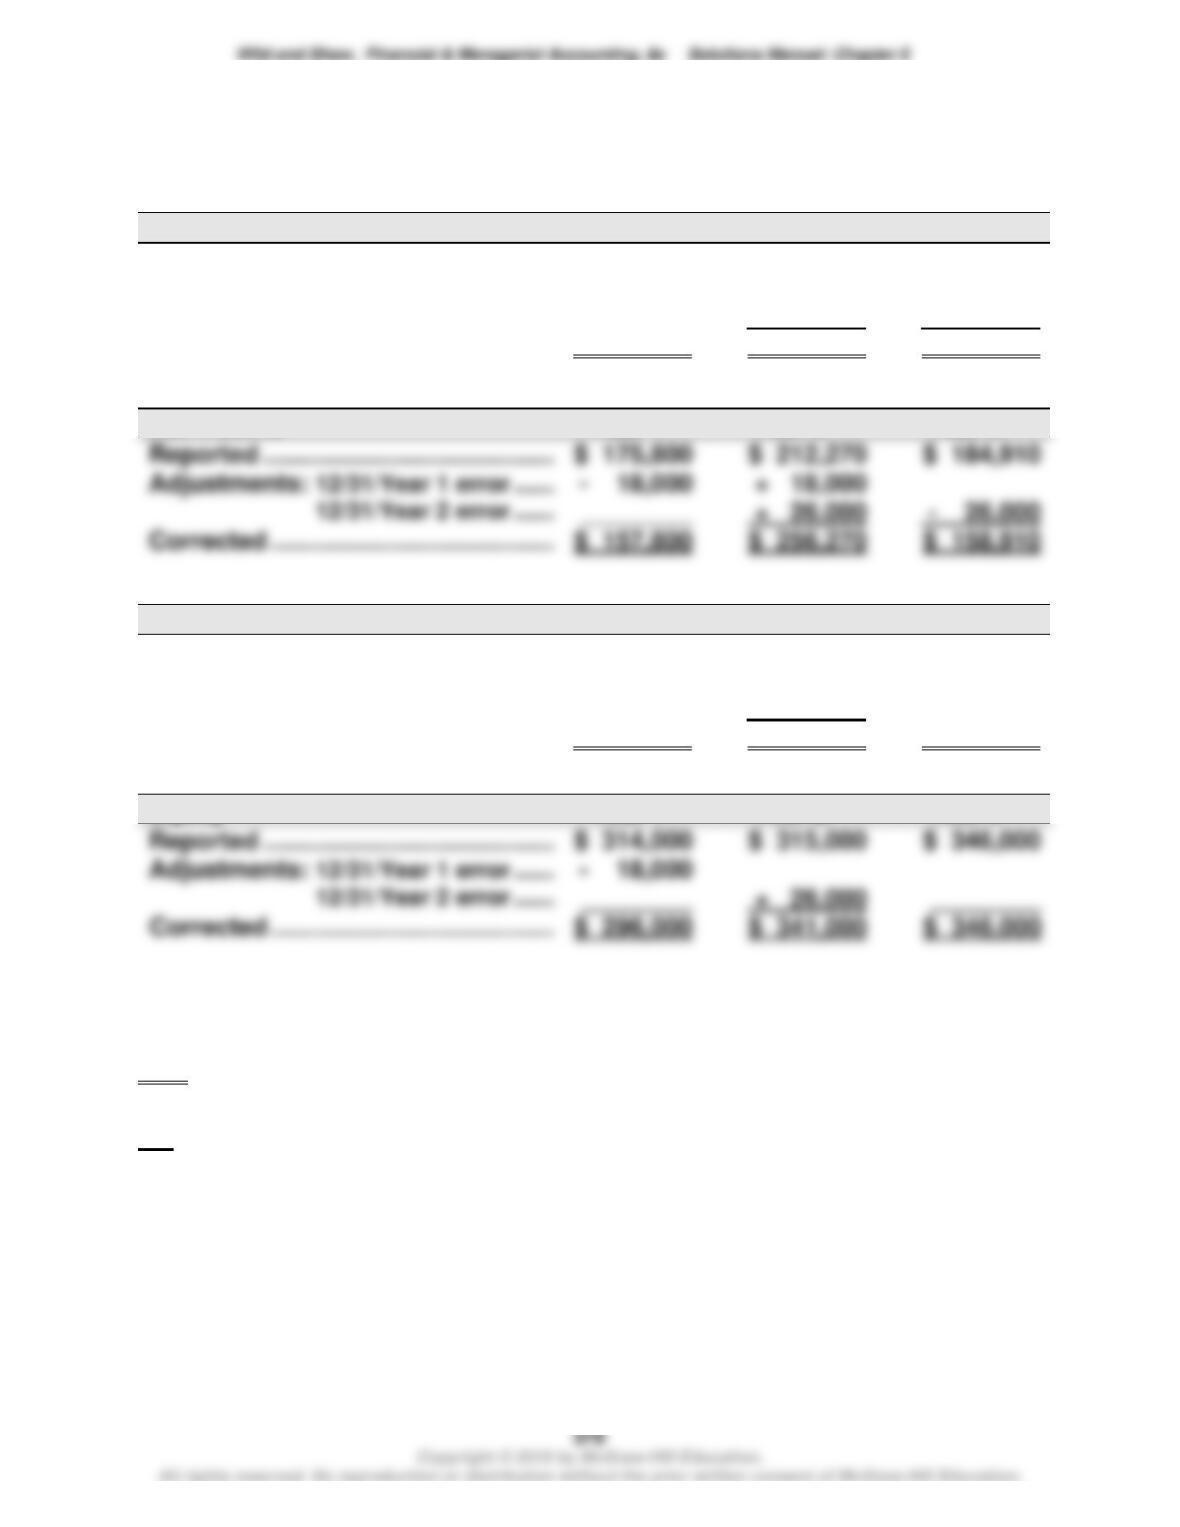
Reported ……………………………………
$ 175,800
$ 212,270
$ 184,910
Adjustments: 12/31/Year 1 error ……
12/31/Year 2 error ……
________
+ 26,000
– 26,000
Corrected …………………………………..
$ 157,800
$ 256,270
$ 158,910
(c)
Total current assets
Year 1
Year 2
Year 3
Reported ……………………………………
$ 276,000
$ 277,500
$ 272,950
Adjustments: 12/31/Year 1 error ……
– 18,000
12/31/Year 2 error ……
________
+ 26,000
________
Corrected …………………………………..
$ 258,000
$ 303,500
$ 272,950
(d)
Year 1
Year 2
Year 3
Reported ……………………………………
$ 314,000
$ 315,000
$ 346,000
Adjustments: 12/31/Year 1 error ……
________
+ 26,000
________
Part 2
Zero (there is no error in combined net income).
Explanation: Total net income for the combined three-year period ($572,980) is
not affected by the errors. This is because these errors are “self-correcting”—that
is, each overstatement (or understatement) of net income is offset by a matching
understatement (or overstatement) in the following year.
Problem 5-7BA (25 minutes)
Part 1
Number and total cost of units available for sale
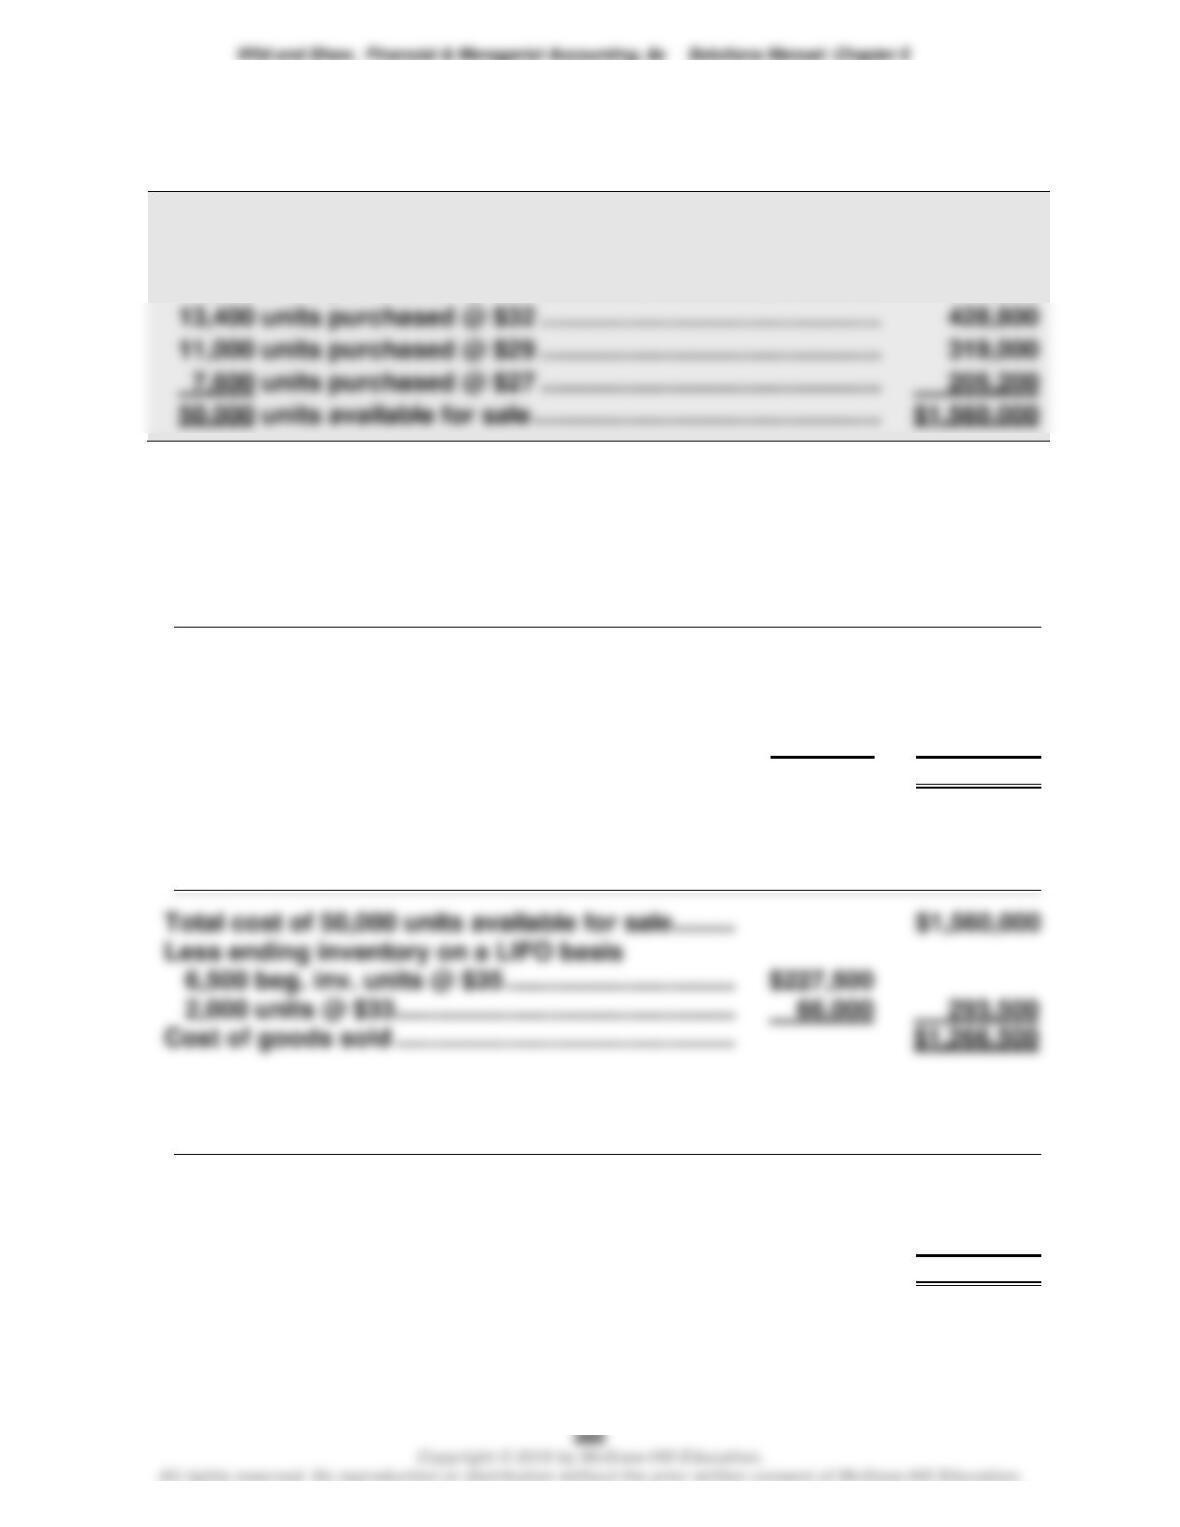
6,500 units in beginning inventory @ $35 ………………………..
$ 227,500
11,500 units purchased @ $33 ………………………………………….
379,500
11,000 units purchased @ $29 ………………………………………….
319,000
7,600 units purchased @ $27 ………………………………………….
Part 2
a. FIFO periodic
Total cost of 50,000 units available for sale……….
$1,560,000
Less ending inventory on a FIFO basis
7,600 units @ $27…………………………………………
$205,200
900 units @ $29…………………………………………
26,100
231,300
Cost of goods sold …………………………………………..
$1,328,700
b. LIFO periodic
Total cost of 50,000 units available for sale……….
$1,560,000
Less ending inventory on a LIFO basis
6,500 beg. inv. units @ $35 …………………………….
$227,500
2,000 units @ $33…………………………………………..
66,000
c. Weighted average periodic
Total cost of 50,000 units available for sale……….
$1,560,000
Less ending inventory at weighted average cost
($1,560,000/50,000) x 8,500 units…………………….
265,200
Cost of goods sold …………………………………………..
$1,294,800