AMAT has operating leases, warranty and other guarantees, but these
amounts do not add an unusual amount of risk to the debt structure.
Despite the decreasing profits and CFO, AMAT generates enough funds to
cover all necessary items. As long as the trend in profits and CFO can be
reversed, the firm should not have a long-term solvency problem.
Profitability
AMAT’s sales decreased 14% from 2012 to 2013, and 17% from 2011 to
2012. AMAT has four distinct segments: Silicon Systems Group, Applied
Global Services, Display and Energy and Environmental Solutions. The only
segment with increasing sales in 2013 was the Display segment which
Gross profit margin decreased in 2012, but recovered somewhat in 2013.
Despite lower sales in 2013, gross profit margin increased due to lower
costs, lower inventory charges and a favorable product mix. The decrease in
gross profit margin in 2012 was a result of lower sales (AMAT has fixed
costs), higher inventory charges and costs associated with the Varian
acquisition.
Selling, general and administrative (SG&A) expenses increased in dollars in
2012 and then returned to dollar levels comparable to 2011 in 2013;
however in percentage terms the change in percentage in 2013 was minimal
due to the large decrease in sales without a proportional decrease in
expenses. The increased costs in 2012 were a result of the Varian
acquisition. In 2013, those costs did not occur again and the firm was able to
reduce costs through their restructuring programs along with a reduction in
bad debt expense as a result of lower risk exposure in display and solar
customers.
AMAT’s effective tax rate has been volatile. The non-deductibility of the
goodwill impairment charges in 2012 caused the rate to be 65.5%. The
effective tax rate for the firm, with no goodwill impairment charges, was
19% in 2011. AMAT benefits from lower tax rates to a great extent and
realized a much lower tax rate as a result of global business in 2013. This
was offset, however, by more non-deductible goodwill impairment charges
resulting in an effective tax rate of 26.9% instead of a rate of 4.4% had
impairment charges not been taken.
Market Measures
Earnings per share has dropped significantly from 2011, although it
improved slightly in 2013. The PE ratio indicates that investors are not
alarmed by the past two years of lower profits and lower CFO. The PE ratio
increased from 8.64 in 2011 to 118.33, with the stock price dropping by
Strengths
Acquisition strategy
Good short-term liquidity
Weaknesses
Increasing average collection period
Increasing inventories
Investment Potential
AMAT has recognized challenges it faces in a very competitive industry and
has made changes to mitigate losses in the deteriorating solar industry while
Creditworthiness
AMAT has an average amount of debt and the ability to repay debt as it
comes dues. The firm has good short-term and long-term solvency with a
healthy cash balance and short-term investments. The firm is a good credit
risk.
(c)
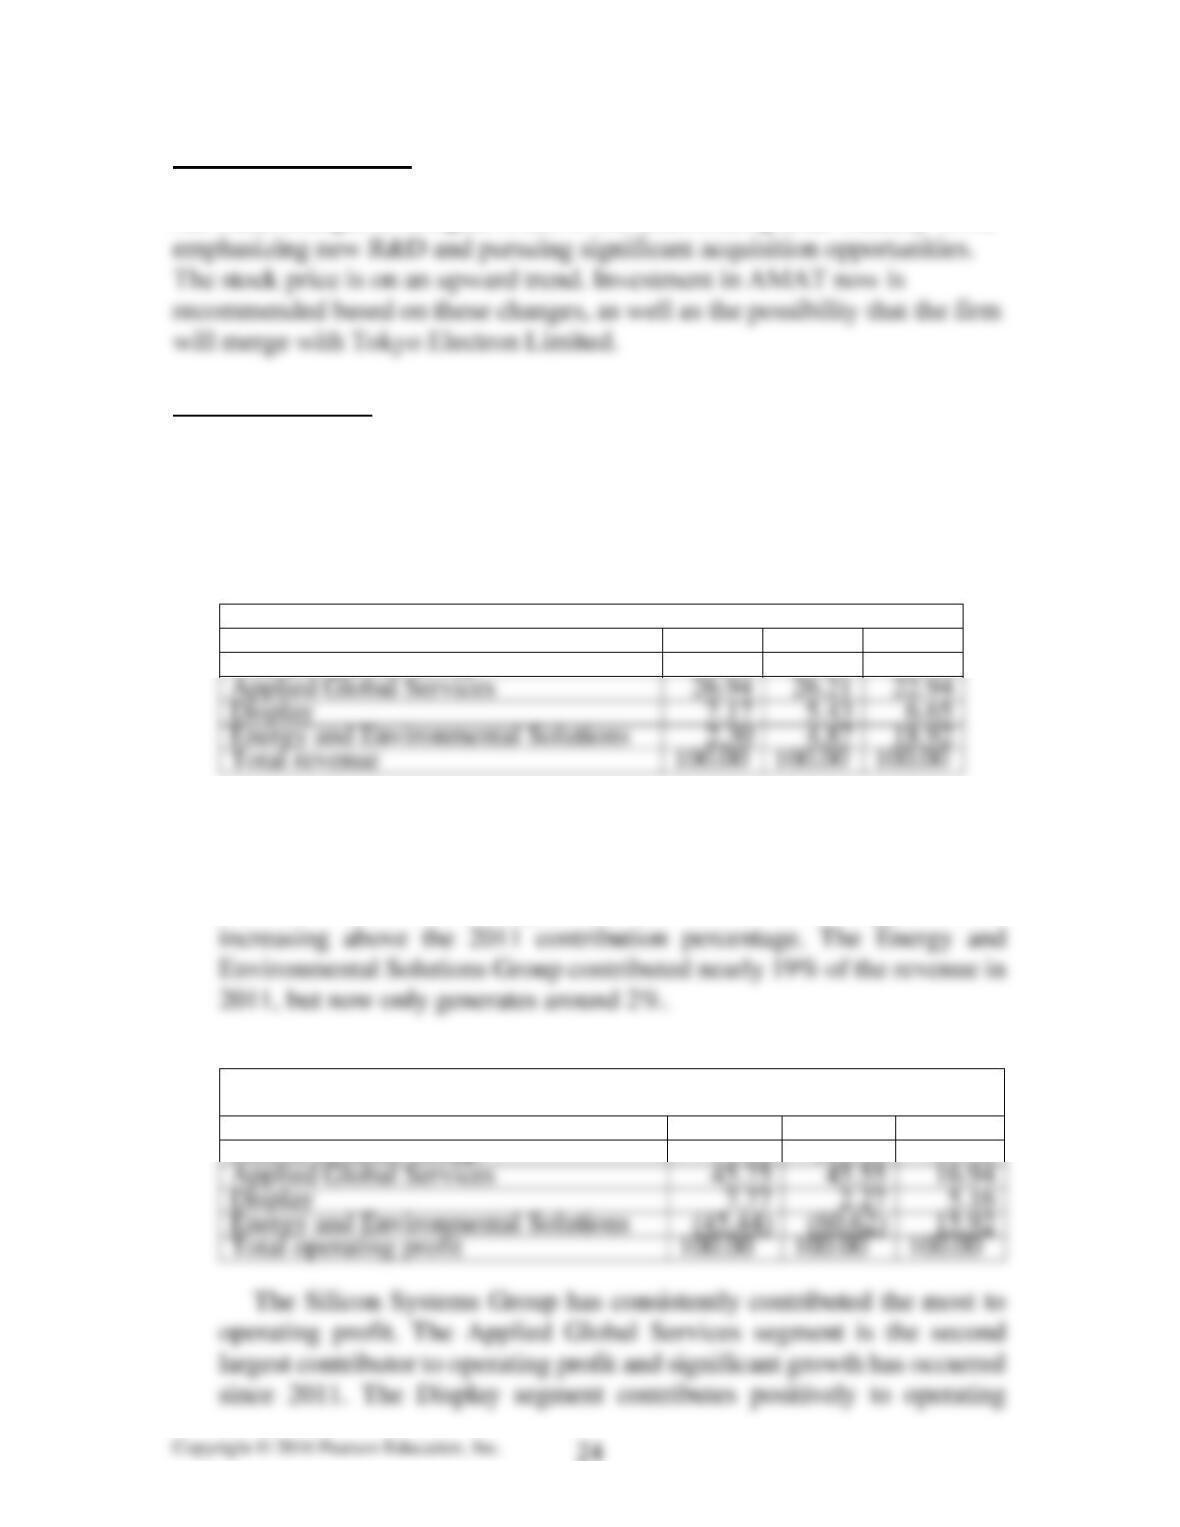
Table 5A.1 Contribution by Segment to Revenue (Percentages)
2013
2012
2011
Silicon Systems Group
63.59
63.49
51.49
Applied Global Services
26.94
26.21
22.94
Display
7.17
5.43
6.65
Energy and Environmental Solutions
2.30
4.87
18.92
Total revenue
100.00
100.00
100.00
The Silicon Systems Group and the Applied Global Services segments
are the largest revenue producers. Both segments have experienced
increased sales from 2011 to 2013. The Display segment produces less
than 10% of revenue each year and in 2012 revenues dropped before
Table 5A.2 Contribution by Segment to Operating Profit
(Percentages)
2013
2012
2011
Silicon Systems Group
91.92
112.80
61.98
Applied Global Services
45.75
45.55
16.94
Display
Energy and Environmental Solutions
15.92
Total operating profit
100.00
100.00
100.00
profit, but the contribution declined in 2012 before recovering in 2013.
The Energy and Environmental Solutions segment has generated
operating losses in 2012 and 2013.
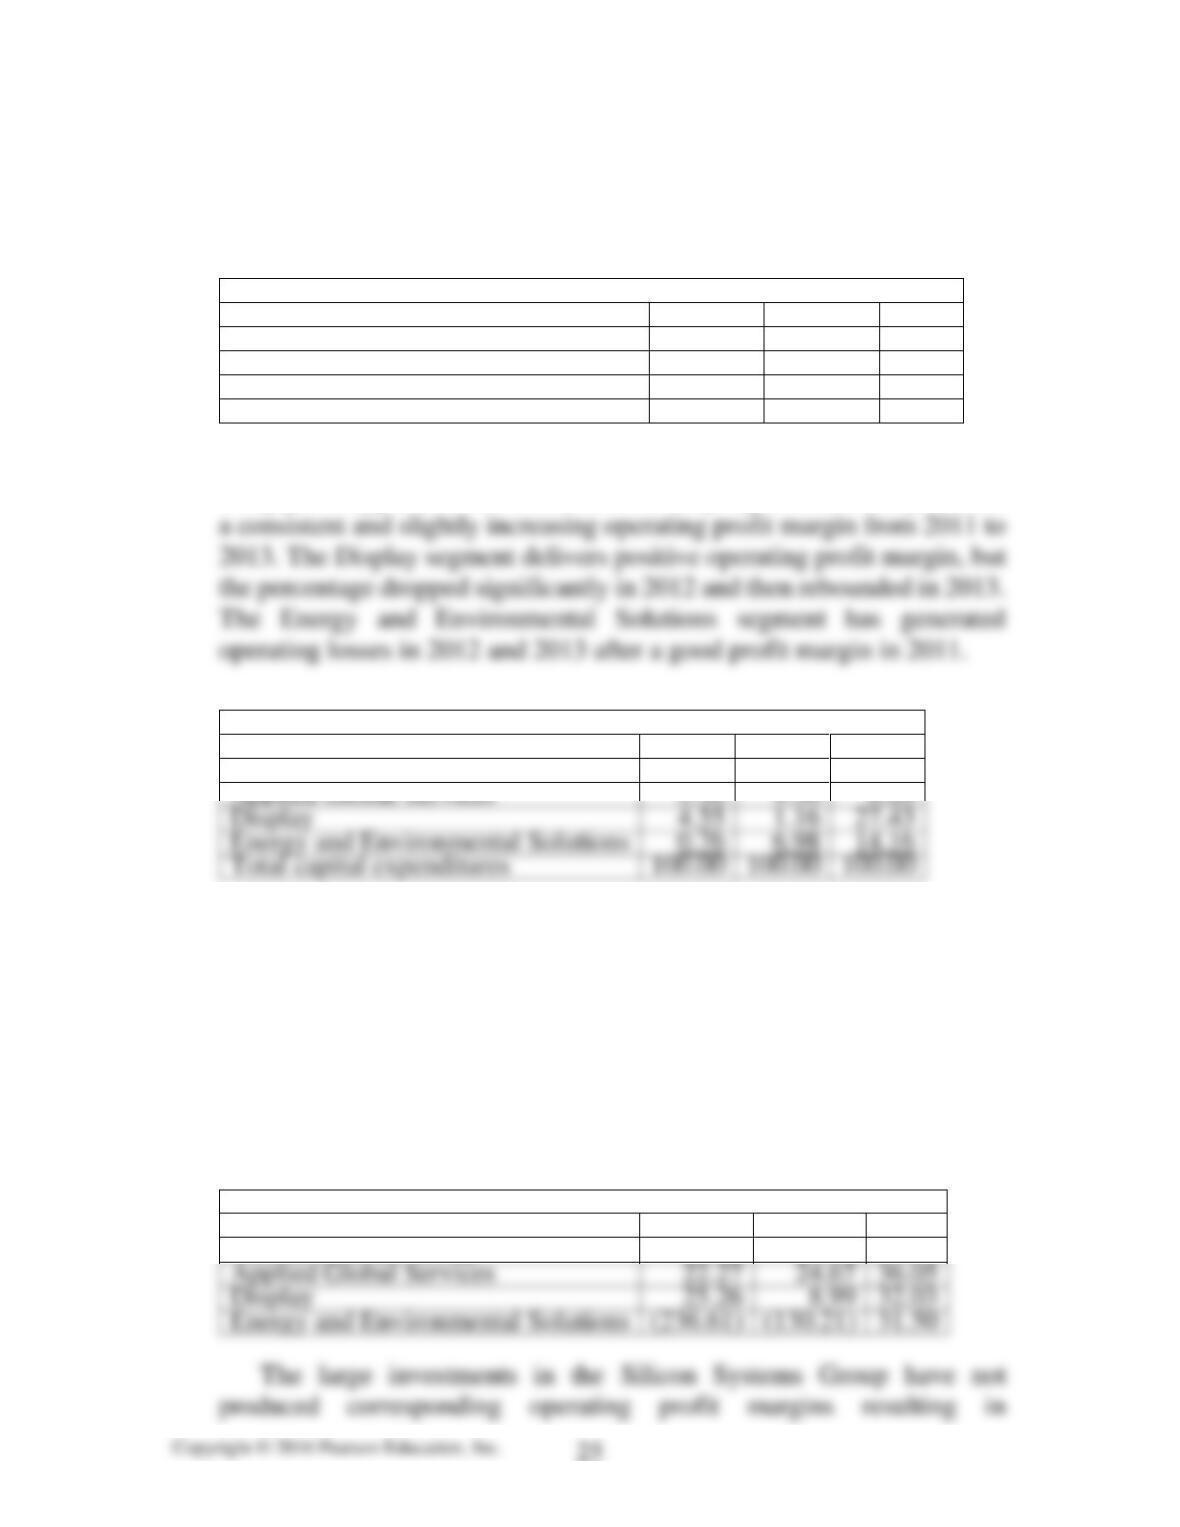
Table 5A.3 Operating Profit Margin by Segment (Percentages)
2013
2012
2011
Silicon Systems Group
18.35
22.45
32.58
Applied Global Services
21.55
21.97
19.98
Display
13.76
5.29
21.03
Energy and Environmental Solutions
(250.29)
(157.18)
22.76
The operating profit margin of the Silicon Systems Group is declining
every year. Applied Global Services is the only segment that has produced
Table 5A.4 Capital Expenditures by Segment (Percentages)
2013
2012
2011
Silicon Systems Group
89.39
82.56
52.21
Display
27.43
Energy and Environmental Solutions
14.16
Total capital expenditures
100.00
100.00
100.00
AMAT has chosen to invest the most in the Silicon Systems Group,
while cutting expenditures significantly in the Display and Energy and
Environmental Solutions segments. This is not surprising given the poor
performance in the Energy and environmental Solutions segment.
Investments in the Applied Global Services segment increased in 2012,
but declined the following year. Despite the lower investment this
segment has performed well for AMAT.
Table 5A.5 Return on Investment by Segment (Percentages)
2013
2012
2011
Silicon Systems Group
15.86
24.34
86.64
Applied Global Services
22.27
24.67
36.05
Display
25.26
32.03
has produced negative returns all years except 2011. Continued
investment in this segment may not be warranted.
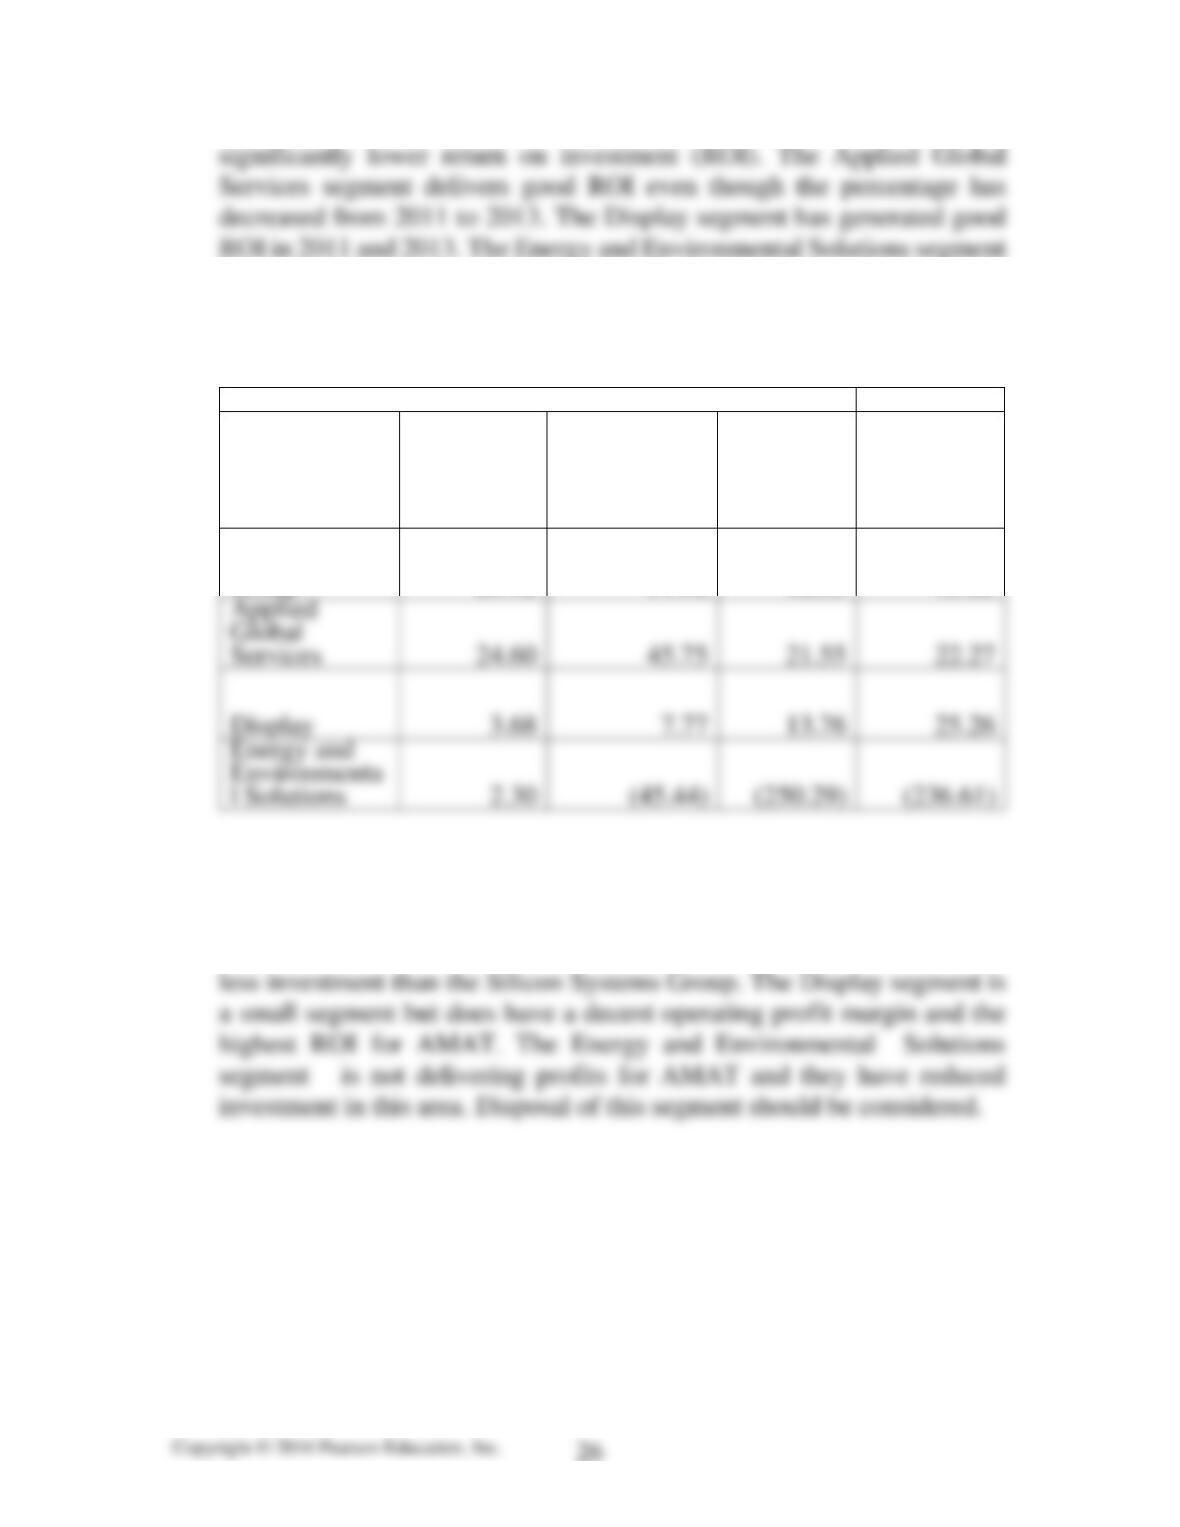
Table 5A.6 Ranking of Segments in 2013
Percentag
e of Total
Segment
Assets
Percent
Contributio
n to
Operating
Profit
Operatin
g Profit
Margin
Return on
Investmen
t
Silicon
Systems
Group
69.42
91.92
18.35
15.86
Applied
Global
Services
24.60
45.75
21.55
22.27
Display
13.76
25.26
The Silicon Systems Group is Applied’s largest segment in terms of
investment and contribution to operating profits, but does not deliver the
highest operating profit margin or ROI. The Applied Global Services
segment delivers the highest operating profit margin and solid ROI with
Case 5.3
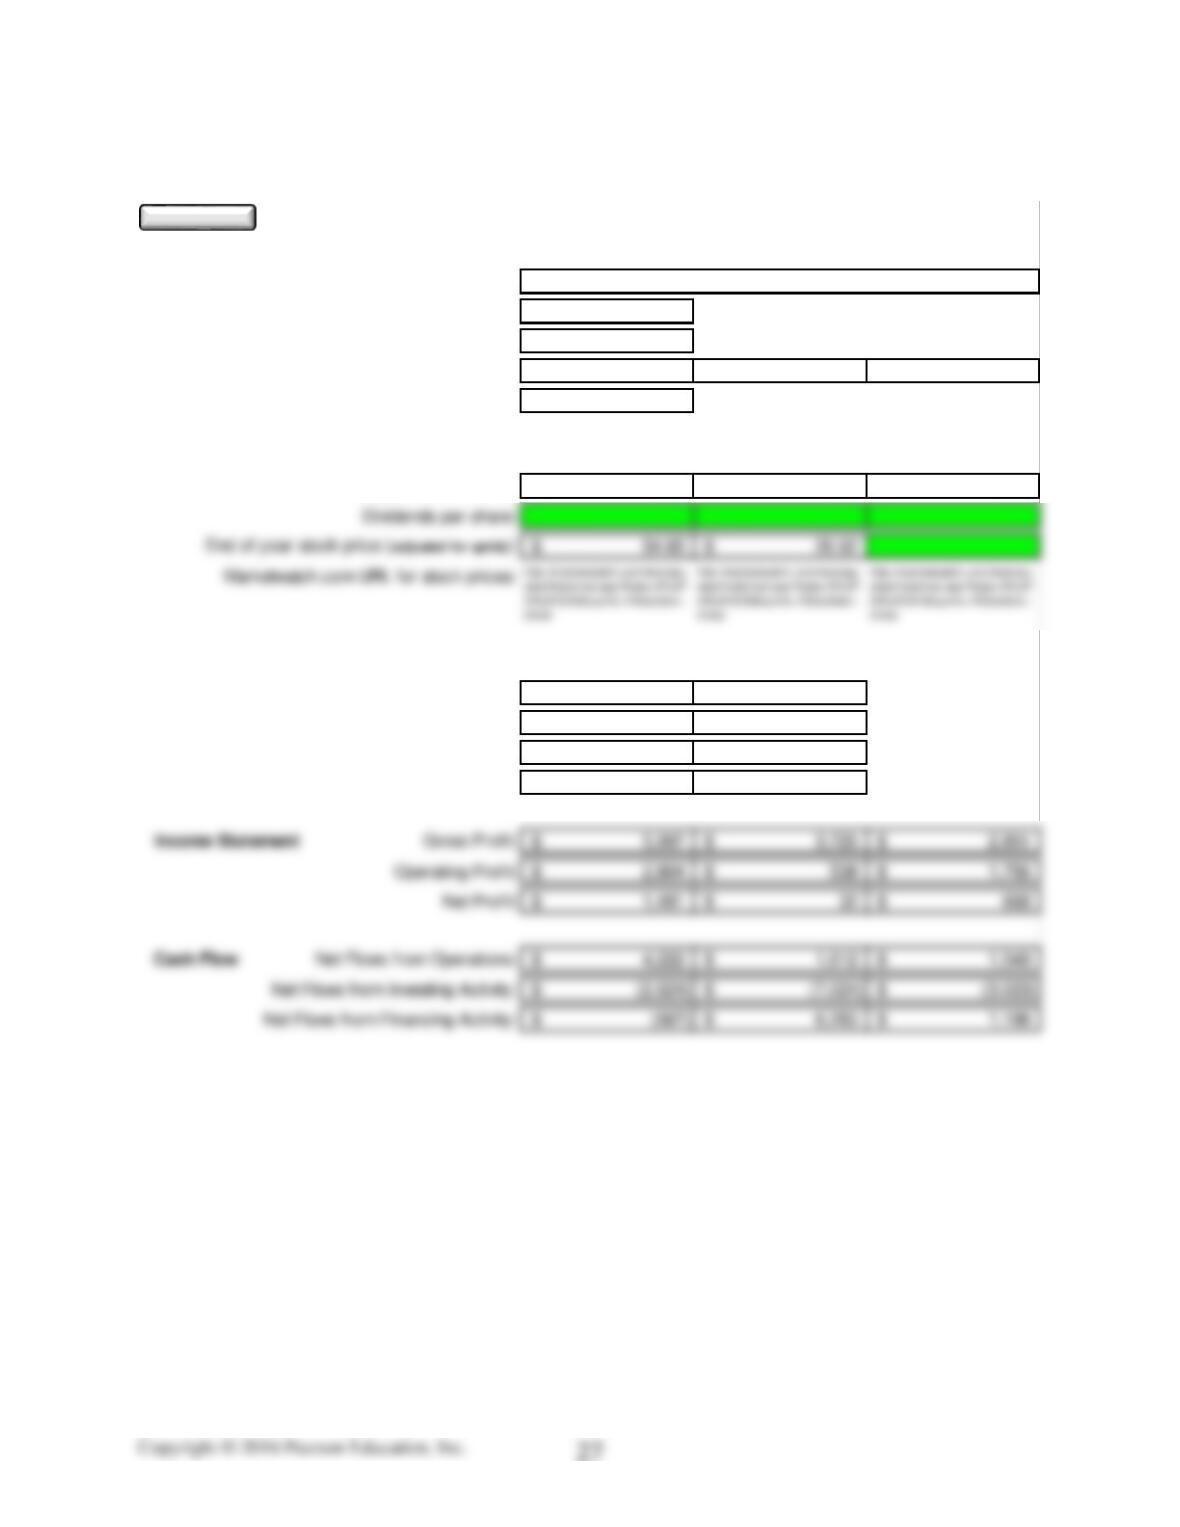
(a)
Company Name:
Stock Ticker Symbol: FB
U.S. Stock Exchange: NASDAQ Fixed
1 /31/ 000
Statement Year-end Dates: 12/31/2013 12/31/2012 12/31/2011
Financial Reports Rounded to : Millions
Supplemental Ratio Requirements: 2013 2012 2011
Rent expense (in millions): 130$ 196$ 219$
Check Figures:
Balance Sheet Current Assets: 13,070$ 11,267$
Total Assets: 17,895$ 15,103$
Current Liabilities: 1,100$ 1,052$
Total Stockholders’ Equity: 15,470$ 11,755$
Facebook, Inc.
The ‘Analysis ToolPak‘ add–in must be installed and active.
Enter data on this sheet before other financial statement information.
Clear
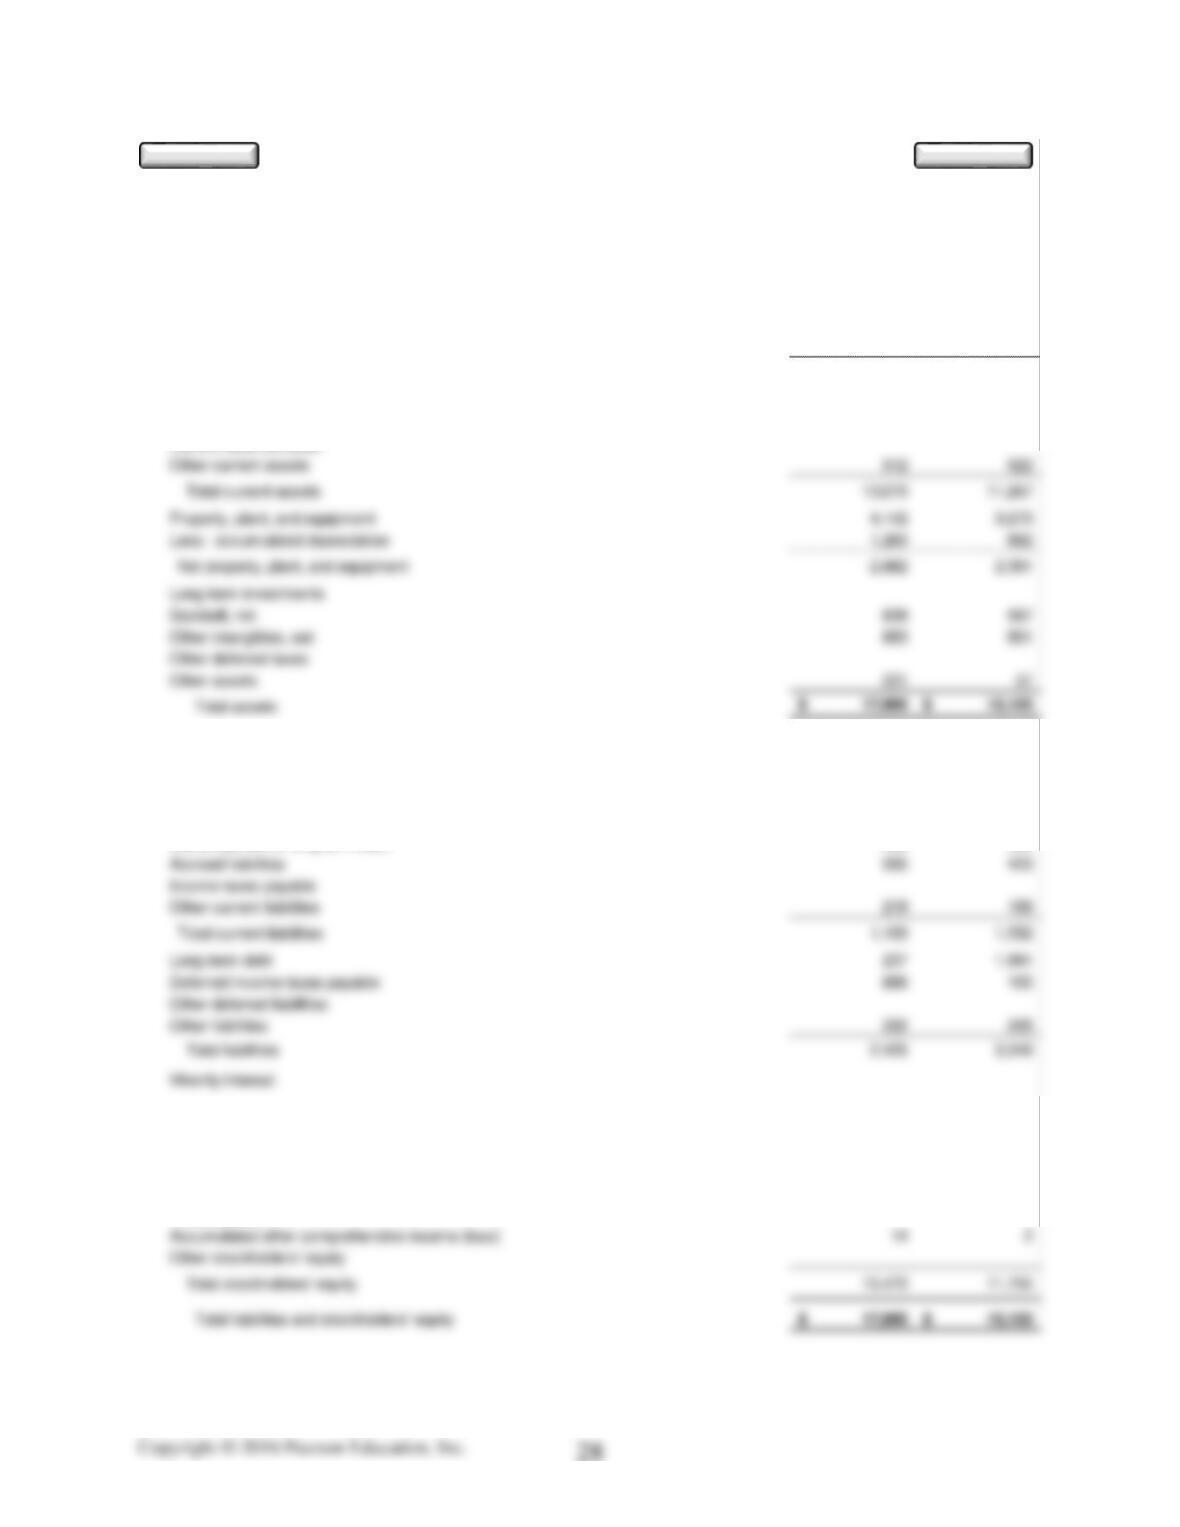
2013 2012
ASSETS
Current Assets:
Cash and cash equivalents 3,323$ 2,384$
Short-term investments 8,126 7,242
Total cash and short-term investments 11,449 9,626
Accounts receivable, net 1,109 719
Inventories, net
Current deferred taxes
LIABILITIES
Current Liabilities:
Accounts payable 87$ 65$
Short-term debt
Current portion of long-term debt 239 365
STOCKHOLDERS’ EQUITY
Preferred stock
Common stock, par value plus additional paid-in capital 12,297 10,094
Retained earnings (accumulated deficit) 3,159 1,659
Treasury stock
Facebook, Inc. (FB / NASDAQ)
Annual Consolidated Balance Sheet
Amou n ts Rou nd ed to : M illion s
Results as of December 31
Clear
Edit
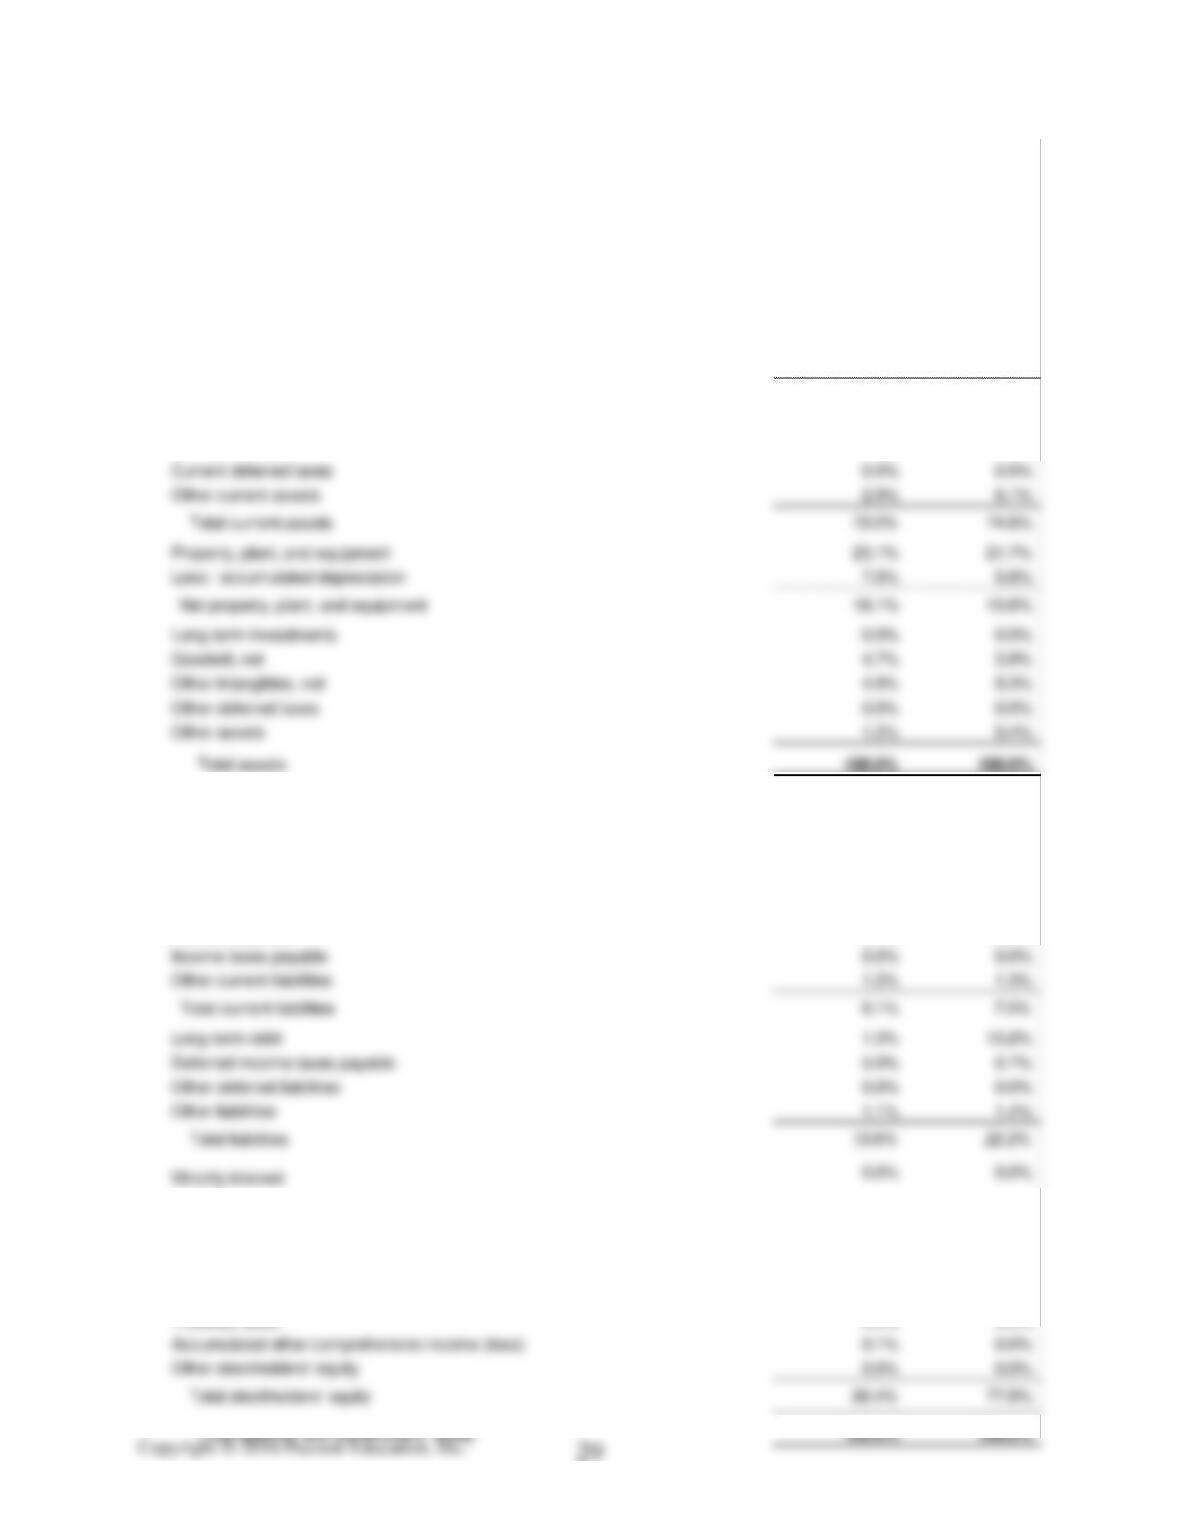
2013 2012
ASSETS
Current Assets:
Cash and cash equivalents 18.6% 15.8%
Short-term investments 45.4% 48.0%
Total cash and short-term investments 64.0% 63.7%
Accounts receivable, net 6.2% 4.8%
Inventories, net 0.0% 0.0%
LIABILITIES
Current Liabilities:
Accounts payable 0.5% 0.4%
Short-term debt 0.0% 0.0%
Current portion of long-term debt 1.3% 2.4%
Accrued liabilities 3.1% 2.8%
STOCKHOLDERS’ EQUITY
Preferred stock 0.0% 0.0%
Common stock, par value plus additional paid-in capital 68.7% 66.8%
Retained earnings (accumulated deficit) 17.7% 11.0%
Treasury stock 0.0% 0.0%
Results as of December 31
S um mary p ercentag es in italics will n ot f oot d ue to rou nding
Annual Common Size Balance Sheet
Facebook, Inc. (FB / NASDAQ)
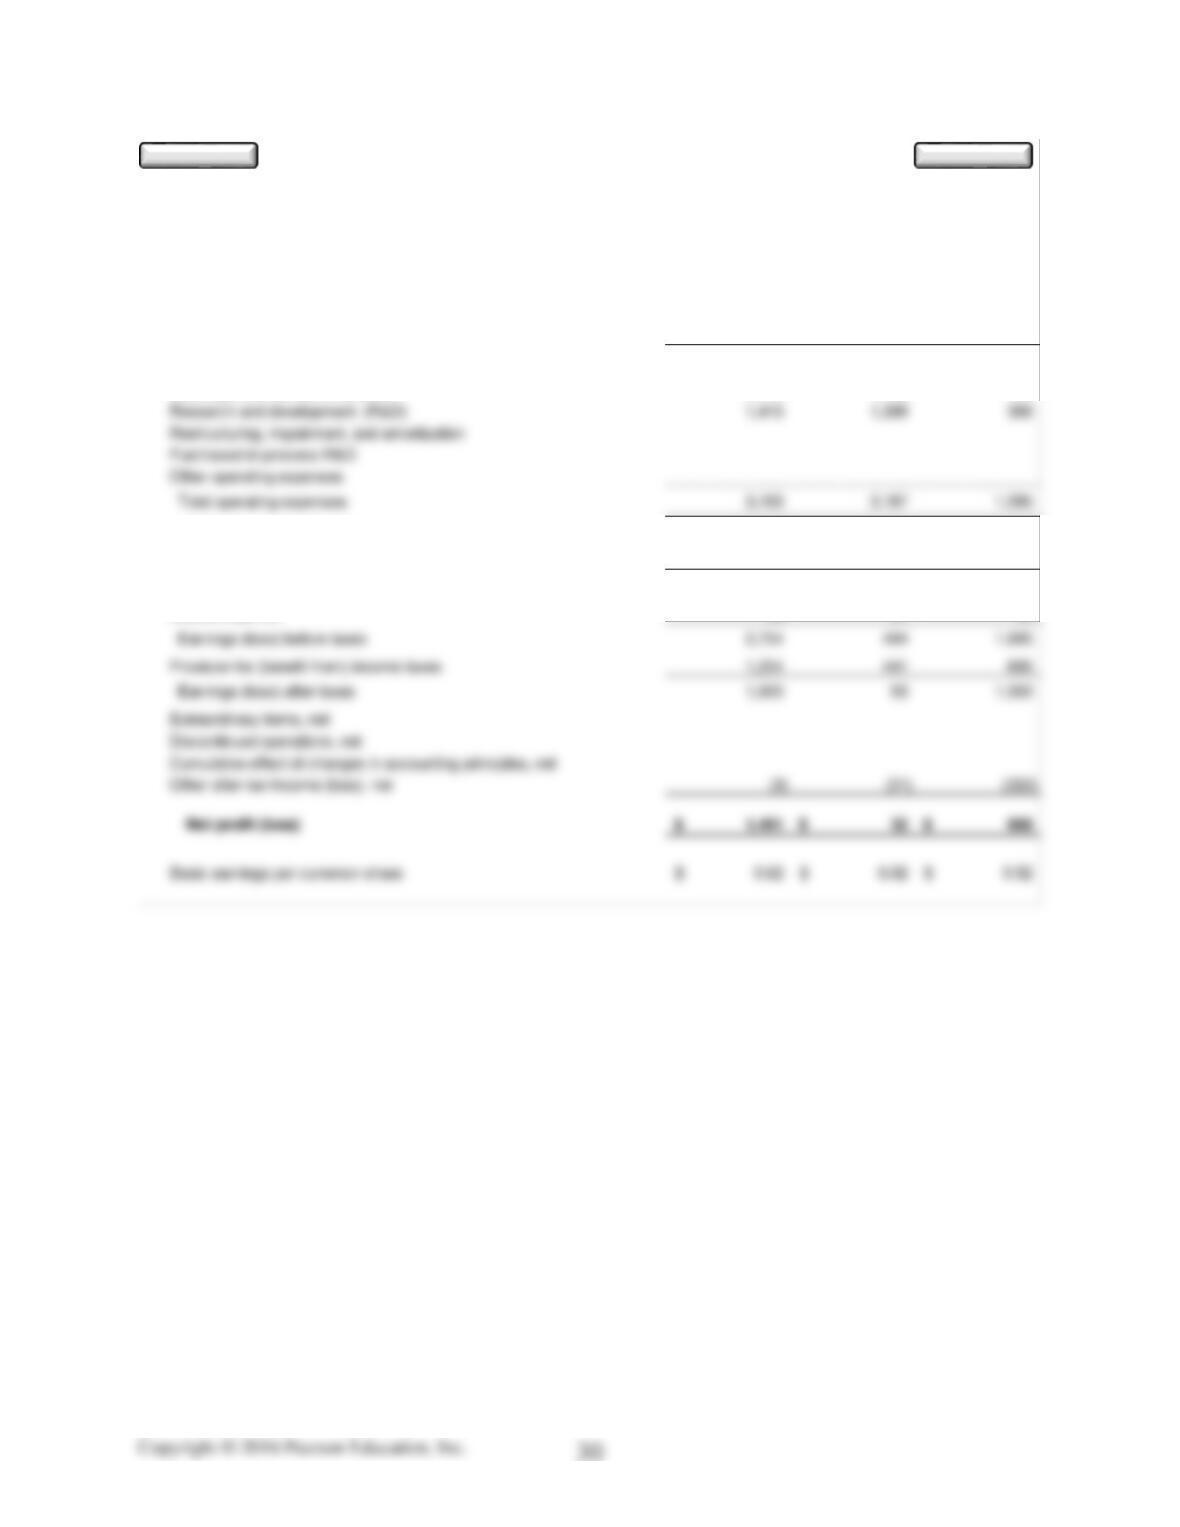
2013 2012 2011
Net sales 7,872$ 5,089$ 3,711$
Less: Cost of goods sold 1,875 1,364 860
Gross profit 5,997 3,725 2,851
Sales, general and administrative 1,778 1,788 707
Operating profit (loss) 2,804 538 1,756
Other income (expenses), net excluding interest expense 6 7 (19)
Earnings (loss) before interest and taxes 2,810 545 1,737
Interest expense 56 51 42
Results for the Years Ending December 31
Facebook, Inc. (FB / NASDAQ)
Annual Consolidated Income Statement
Amou n ts Rou nd ed to : M illion s ( except p er sh are am oun ts)
Edit
Clear
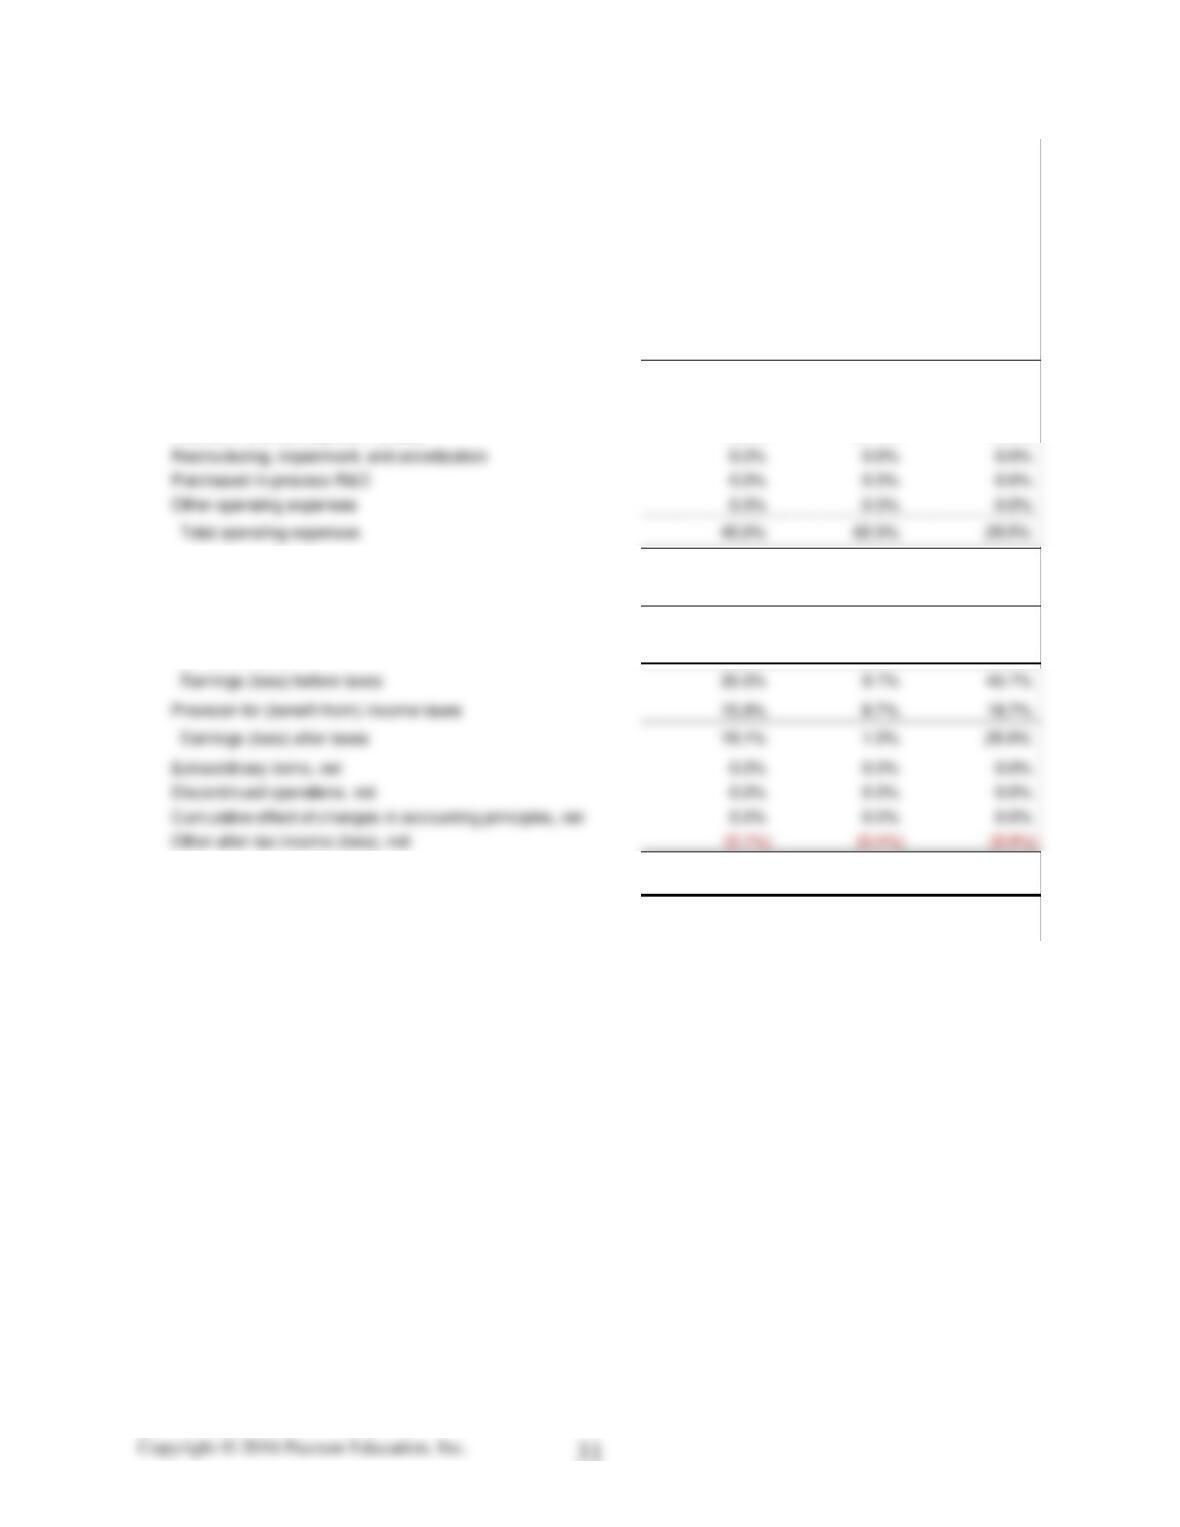
2013 2012 2011
Net sales 100.0% 100.0% 100.0%
Less: Cost of goods sold 23.8% 26.8% 23.2%
Gross profit 76.2% 73.2% 76.8%
Sales, general and administrative 22.6% 35.1% 19.1%
Research and development (R&D) 18.0% 27.5% 10.5%
Operating profit (loss) 35.6% 10.6% 47.3%
Other income (expenses), net excluding interest expense 0.1% 0.1% (0.5%)
Earnings (loss) before interest and taxes 35.7% 10.7% 46.8%
Interest expense 0.7% 1.0% 1.1%
Net profit (loss) 18.9% 0.6% 18.0%
Effective tax rate 45.5% 89.3% 41.0%
Results for the Years Ending December 31
Facebook, Inc. (FB / NASDAQ)
Annual Common Size Income Statement
S um mary p ercentag es in italics will not f oot d ue to roun din g
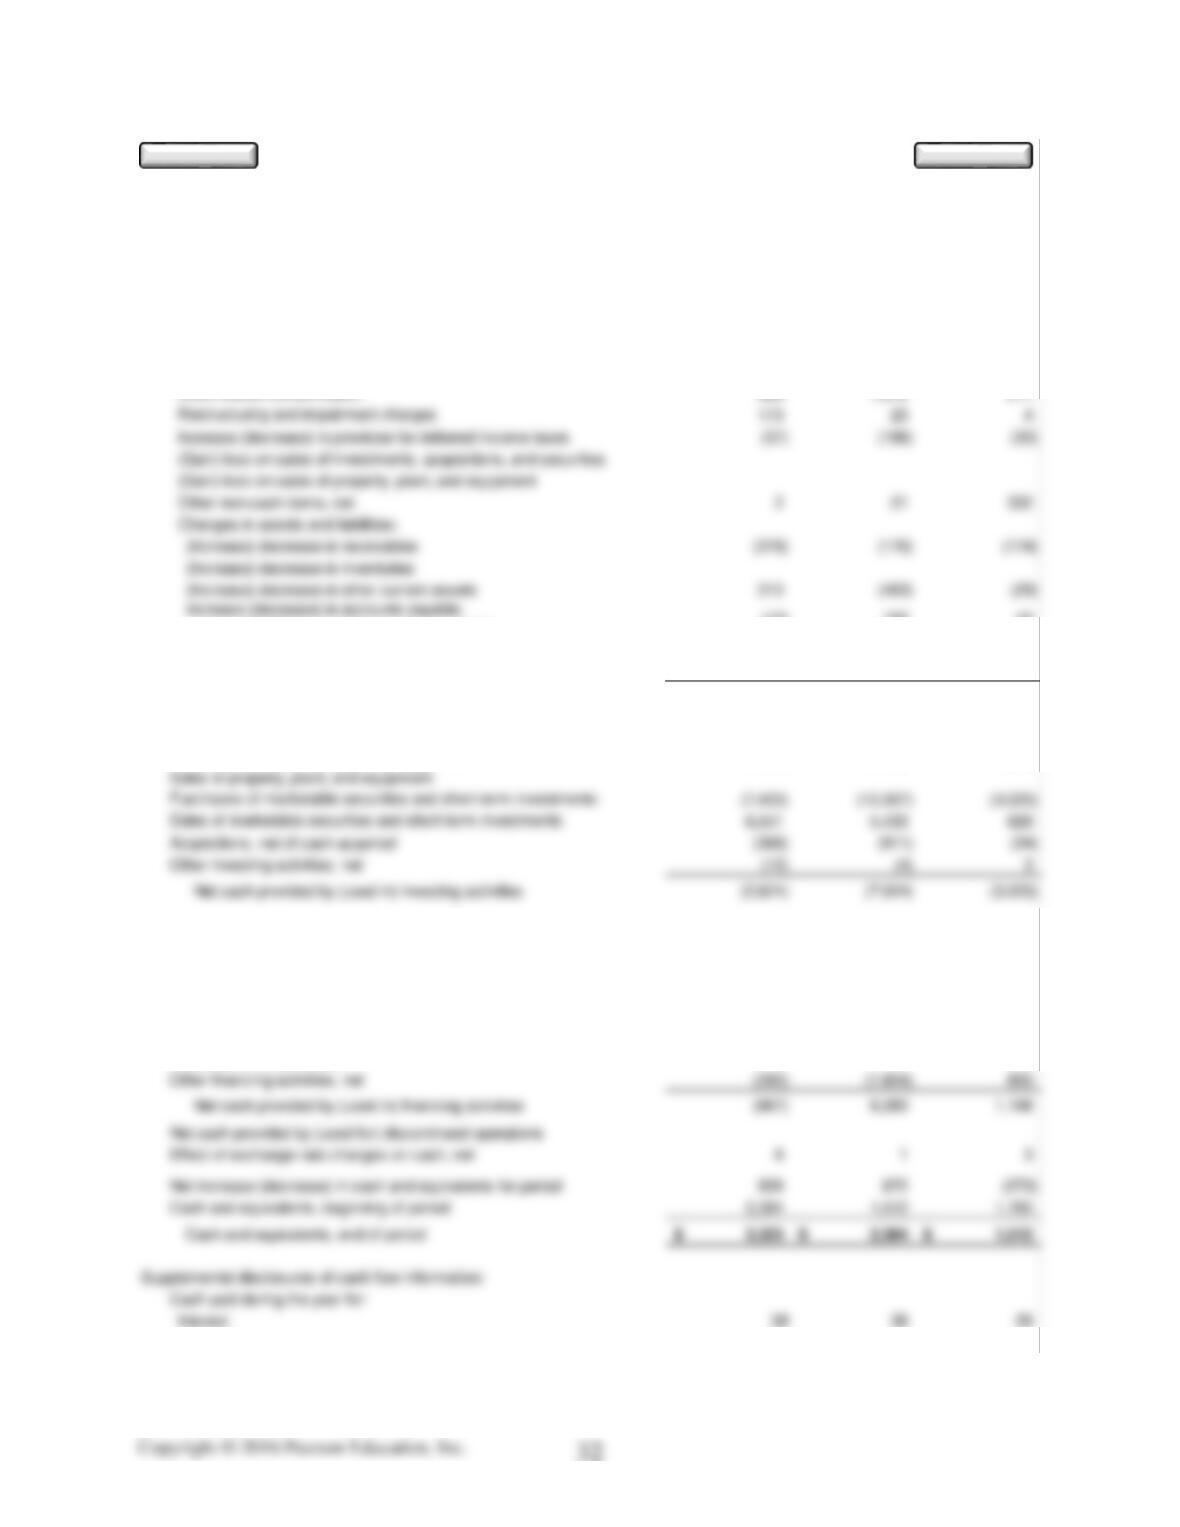
2013 2012 2011
Cash flows from operating activities:
Income (loss) from continuing operations 1,491$ 32$ 668$
Adjustments to reconcile to net cash provided by operating activities:
Depreciation and amortization 1,011 649 323
Stock-based compensation 906 1,572 217
accrued liabilities, and income taxes payable
(12) 153 43
Increase (decrease) in deferred liabilities 8 (60) 49
Other assets and liabilities, net 845 41 146
Net cash provided by (used in ) operating activities 4,222 1,612 1,549
Cash flows from investing activities:
Purchases of property, plant, and equipment (1,362) (1,235) (606)
Cash flows from financing activities:
Short-term borrowings, net
Proceeds from long-term borrowings 1,496
Payment of long-term borrowings (1,891) (366) (431)
Proceeds from sales of common stock 1,504 6,777 1,026
Repurchase of common stock / treasury stock
Dividends to shareholders
Income taxes (refunded) -339 53 197
Results for the Years Ending December 31
Facebook, Inc. (FB / NASDAQ)
Annual Consolidated Statement of Cash Flows
Amou n ts Rou nd ed to : M illion s
Clear
Edit
Payment of short-term borrowings, net – – –
Payment of long-term borrowings 1,891 16.7 366 2.5 431 10.6
Payment of dividends to shareholders – – –
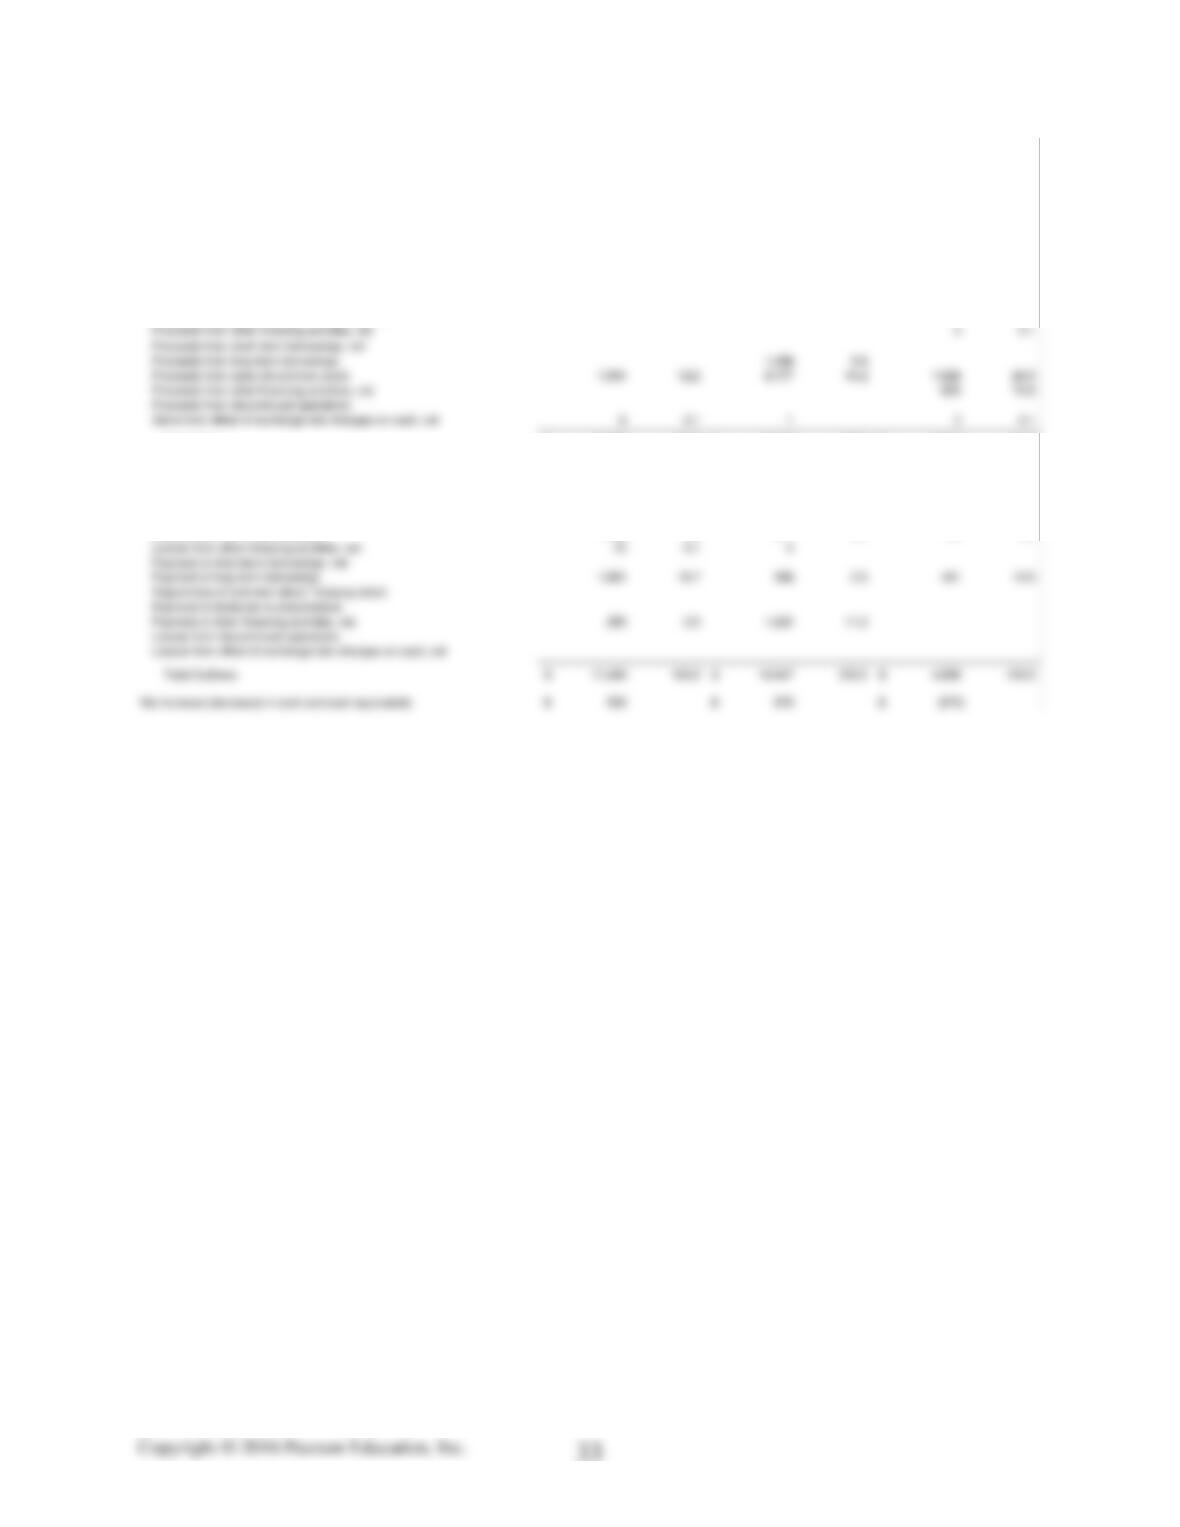
2013 % 2012 % 2011 %
Inflows $ $ $
Proceeds from operating activities 4,222 34.4 1,612 10.5 1,549 40.6
Sales of property, plant, and equipment – – –
Sales of marketable securities and short-term investments 6,551 53.3 5,433 35.5 629 16.5
Proceeds from sales of common stock 1,504 12.2 6,777 44.2 1,026 26.9
Proceeds from discontinued operations – – –
Gains from effect of exchange rate changes on cash, net 8 0.1 1 – 3 0.1
Divestiture of acquisitions, net of cash acquired – – –
Total Inflows 12,285$ 100.0 15,319$ 100.0 3,813$ 100.0
Outflows $ $ $
Losses from operating activities – – –
Purchases of property, plant, and equipment 1,362 12.0 1,235 8.6 606 14.8
Purchases of marketable securities and short-term investments 7,433 65.5 10,307 71.3 3,025 74.0
Acquisitions, net of cash acquired 368 3.2 911 6.3 24 0.6
Facebook, Inc. (FB / NASDAQ)
Annual Summary Analysis Statement of Cash Flows
S u m m ary p ercen tag es i n italics d o n ot f oot d u e to rou ndin g di f f eren ce s
Results for the Years Ending December 31