Results for the Years Ending December 31
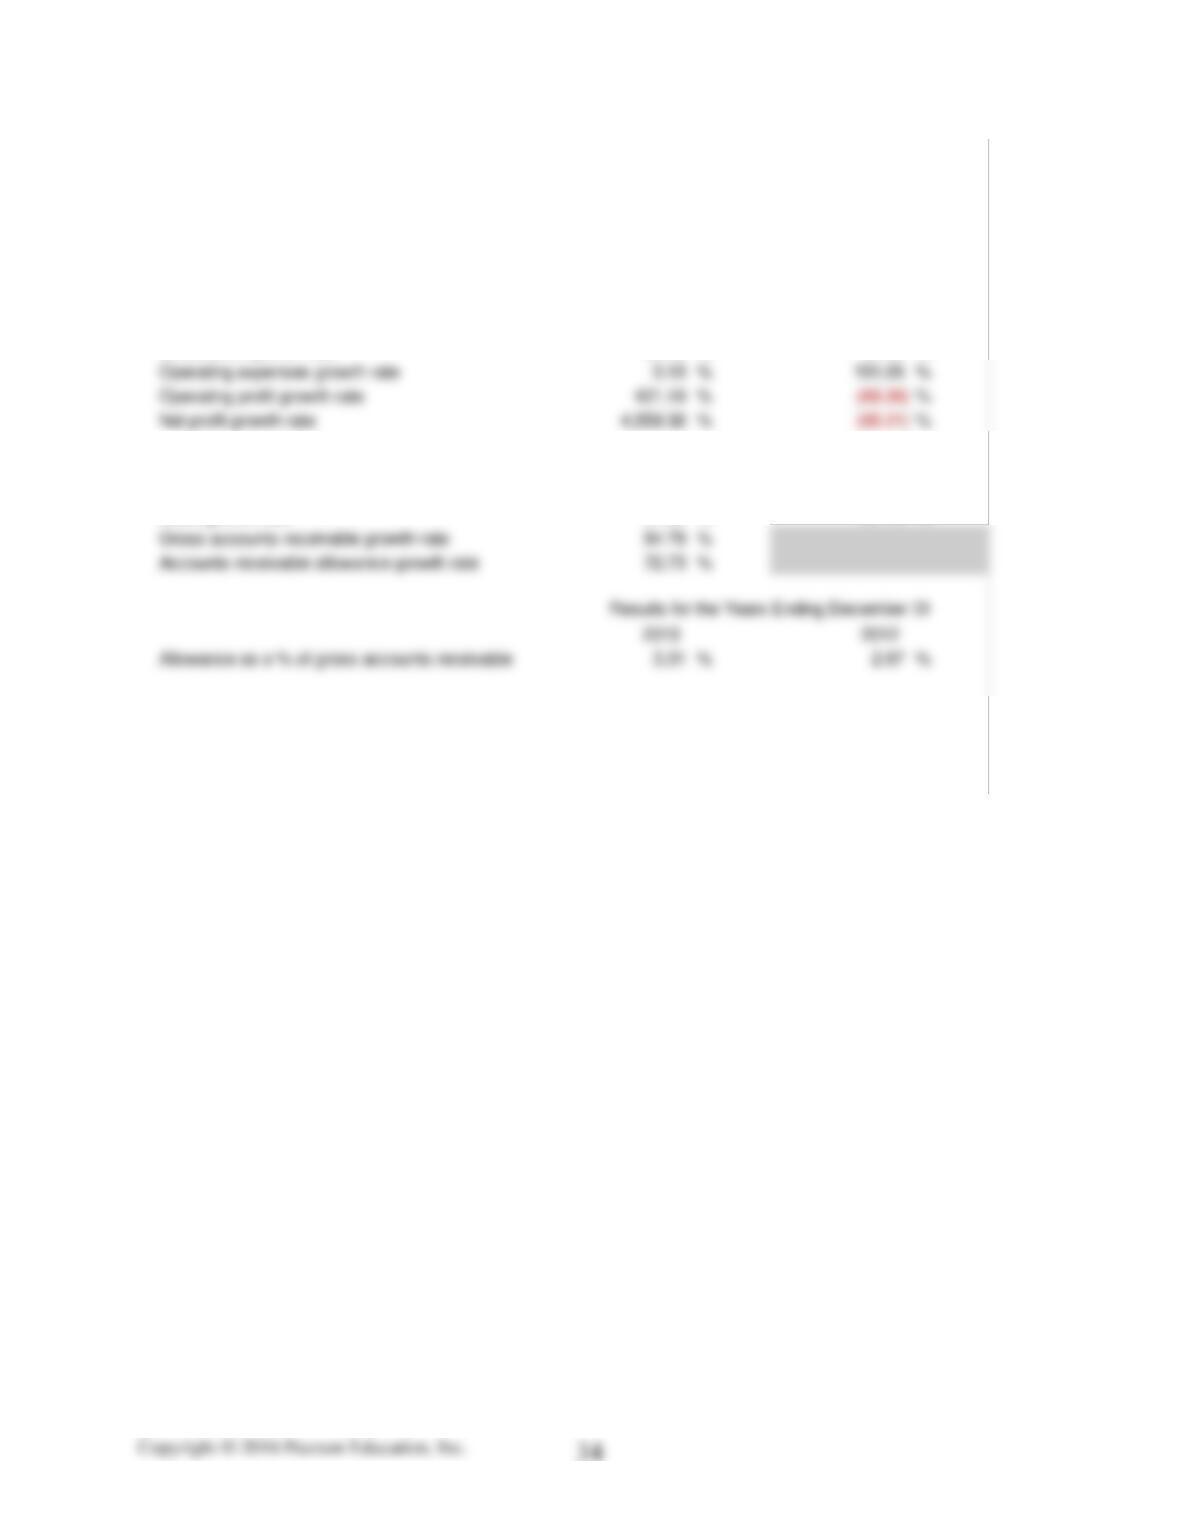
Selected Income Statement Growth Rates:
Sales growth rate 54.69 % 37.13 %
Gross profit growth rate 60.99 % 30.66 %
Accounts Receivable Analysis
Sales growth rate 54.69 % 37.13 %
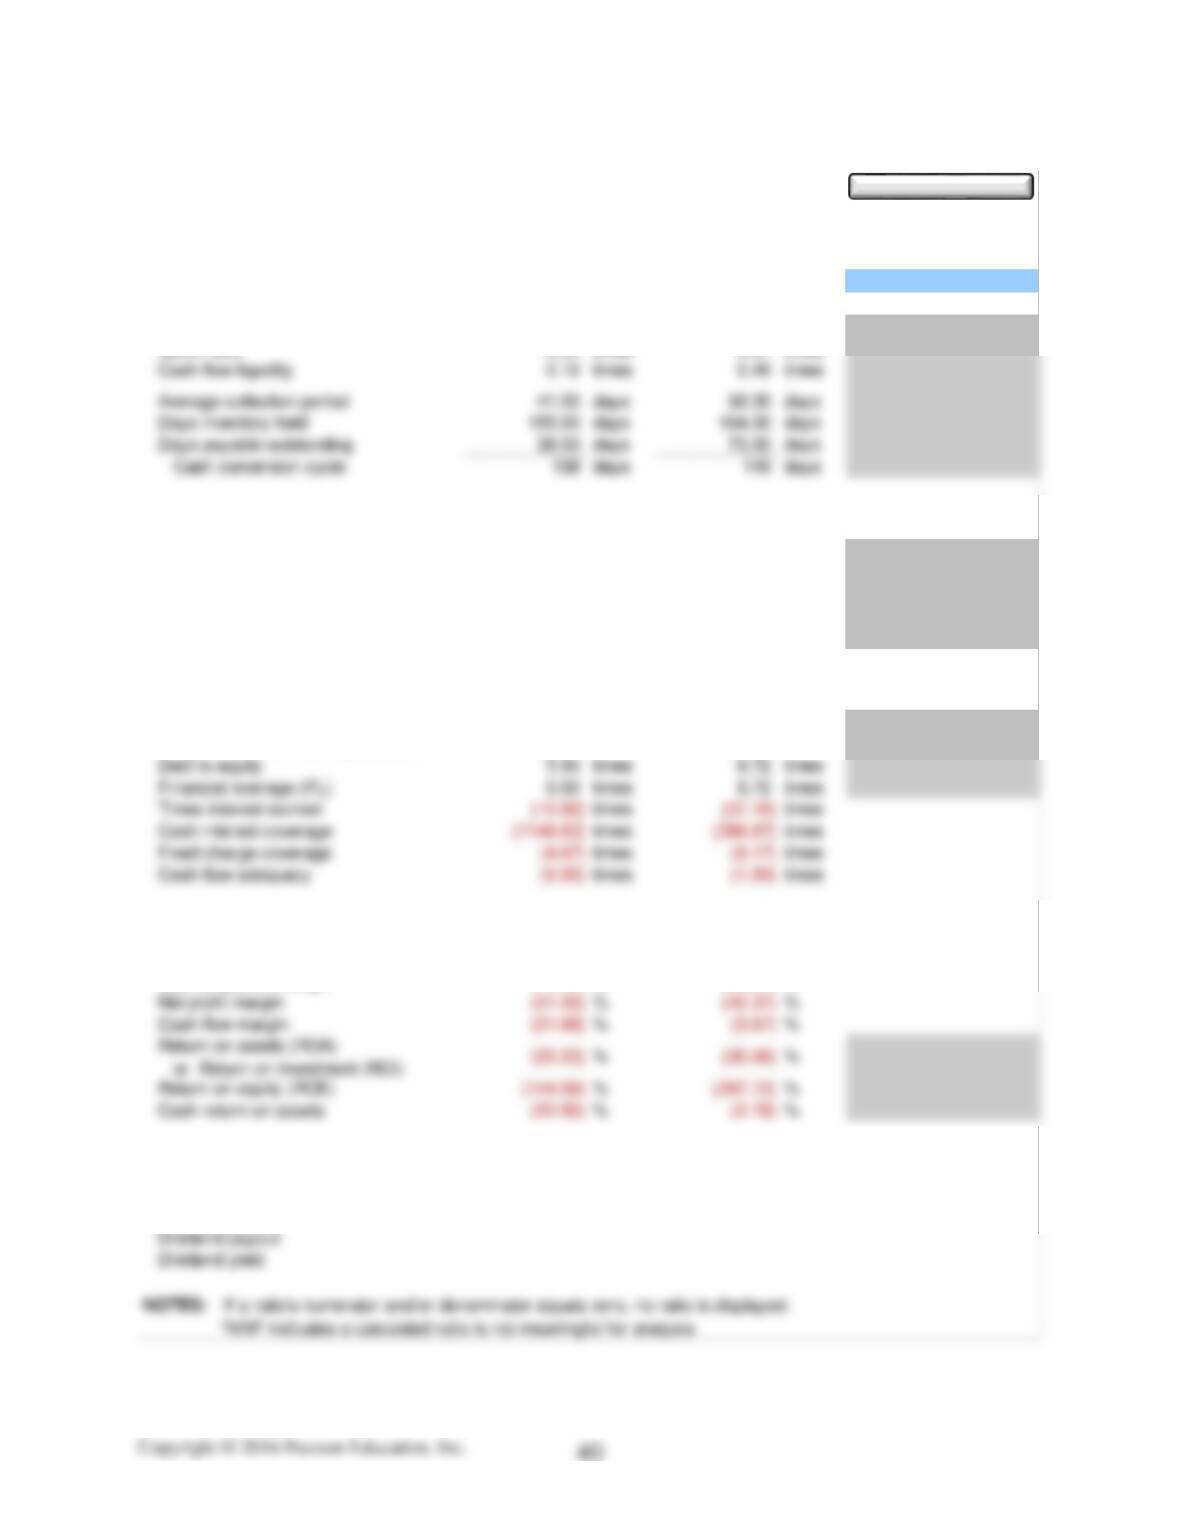
NOTES: “N/M” indicates a calculated rate is not meaningful for analysis
2013 vs. 2012
2012 vs. 2011
Facebook, Inc. (FB / NASDAQ)
Additional Ratio Analysis
Growth Rate Comparisons Between December 31
Liquidity Ratios:
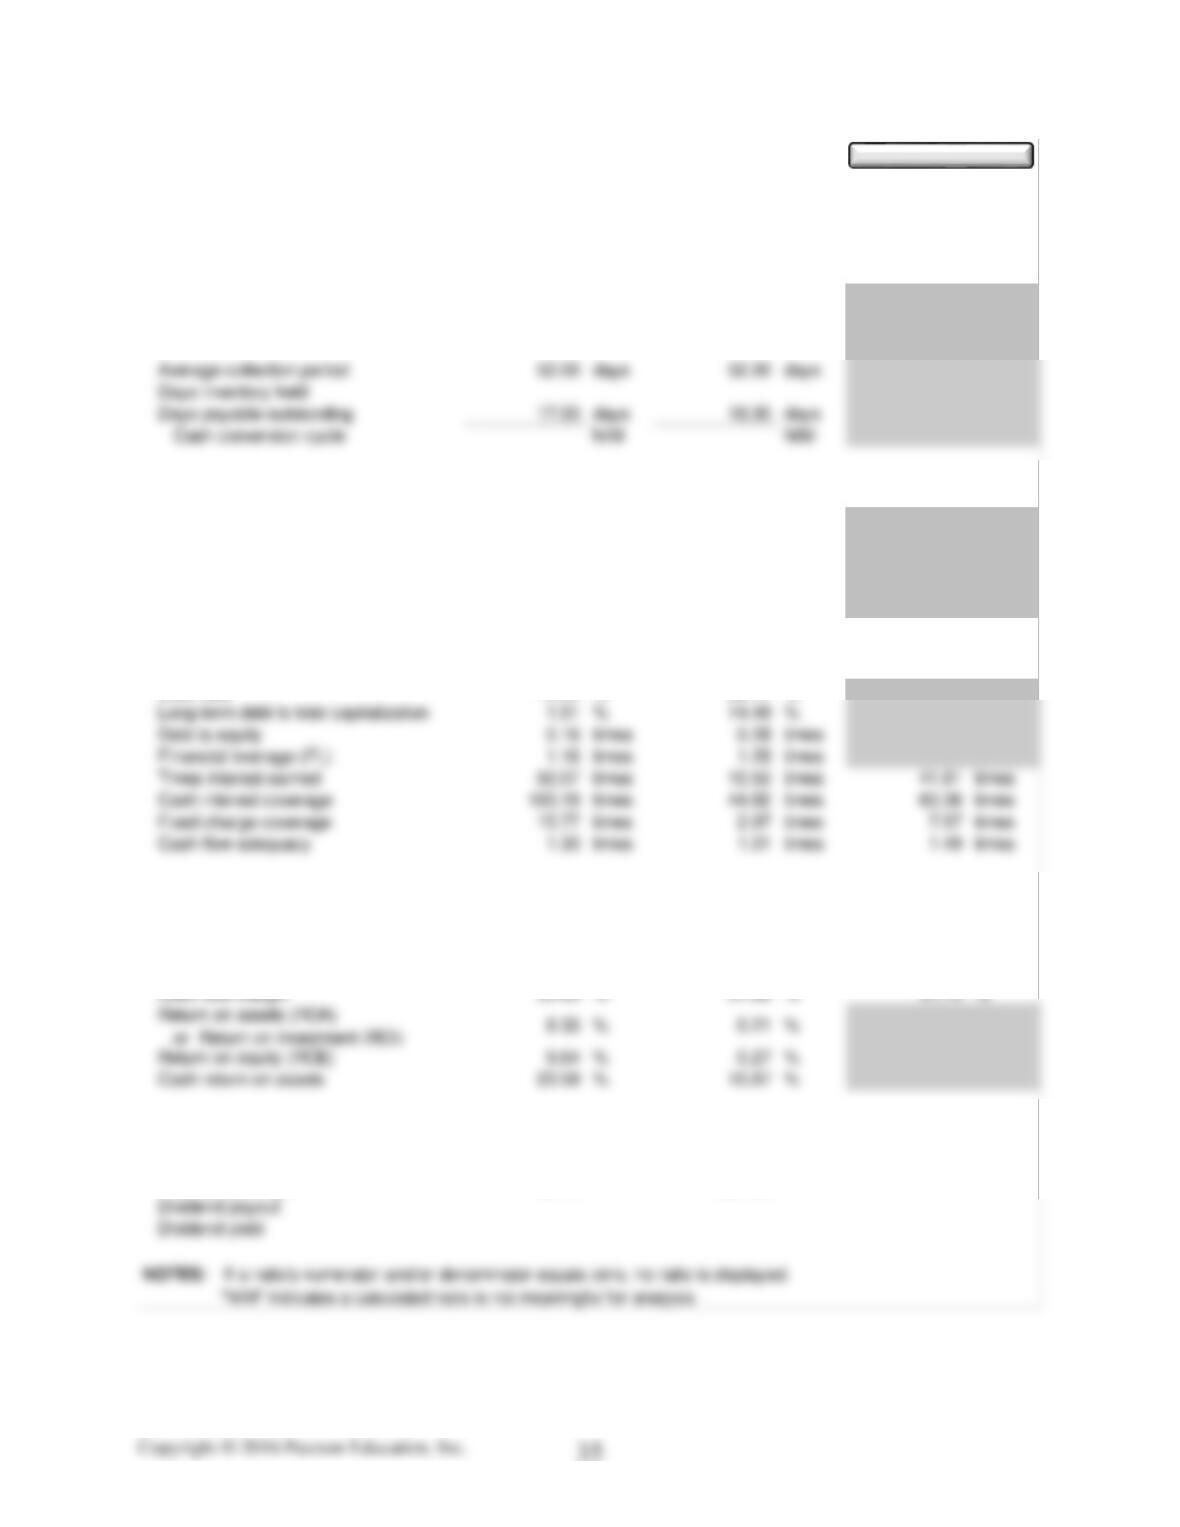
Current ratio 11.88 times 10.71 times
Quick ratio 11.88 times 10.71 times
Cash flow liquidity 14.25 times 10.68 times
Activity Ratios:
Accounts receivable turnover 7.10 times 7.08 times
Inventory turnover 0.00 0 0.00 0
Payables turnover 21.55 times 20.98 times
Fixed asset turnover 2.73 times 2.13 times
Total asset turnover 0.44 times 0.34 times
Leverage Ratios:
Debt ratio 13.55 % 22.17 %
Profitability Ratios:
Gross profit margin 76.18 % 73.20 % 76.83 %
Operating profit margin 35.62 % 10.57 % 47.32 %
Net profit margin 18.94 % 0.63 % 18.00 %
Market Ratios:
Earnings per share 0.62$ 0.02$ 0.52$
Price-to-earnings 88.15 01331.00 0 0.00 0
Facebook, Inc. (FB / NASDAQ)
Summary of Financial Statement Ratios
Results for the Years Ending December 31
2013
2012
2011
Show Formulas
Short-term liquidity
Facebook’s current, quick and cash flow liquidity ratios are extremely high and
increasing. This can be explained by the structure of the balance sheet. Cash and
short-term investments make up 64% of total assets and current assets make up
73% of total assets. Current liabilities make up a mere 6.1% of total assets. Cash
from operating activities (CFO) is significantly higher than net income every year
and has increased all three years with a significant increase in 2013.
As a service provider, Facebook does not have inventory. The firm pays their
suppliers quickly (in 17 days) and while they allow their customers a longer time
frame (52 days) to pay, the firm has no problem generating cash needed in a timely
manner. The cash conversion cycle of 35 days is good and could be shortened if
necessary by extending the time taken to pay suppliers.
The short-term liquidity for Facebook is excellent.
Operating efficiency
As noted under the “Short–term liquidity” section in the prior section Facebook has
Capital structure and long-term solvency
The capital structure of Facebook is low risk. The debt ratio has decreased from
consisting of total minimum operating lease payments of $978 and commitments in
the amount of $258 million to construct data center sites and maintain network
infrastructure. The total amount of these items is less than the reduction of the
long-term debt that has been eliminated from Facebook’s balance sheet in 2013.
The firm should have no issues paying these items in the future.
commitments and significant CFO.
Profitability
Profitability has been volatile over the three year period. In 2012, despite a 37%
growth in sales, operating expenses grew 191% causing significant declines in both
operating and net profit margins. A better financial picture emerged in 2013 as
sales grew 55% and operating expenses increased only 0.19%.
Gross profit margin decreased from 2011 to 2012, but rebounded in 2013. The
decline in 2012 was due to expansion of data centers, a 65% increase in headcount,
and increased compensation expenses triggered by the completion of the Facebook
IPO in this year. The lack of expenses related to the IPO in 2013 combined with
significant sales price and volume increases resulted in the gross profit margin
returning to a level similar to 2011.
Operating profit as a result of the above-mentioned increases in expenses dropped
from 47% in 2011 to 11% in 2012 before rebounding to 36% in 2013.
Net profit margin has followed the same pattern as operating profit margin.
Cash flow margin and cash return on assets have both increased due to the
increasing CFO which was previously discussed. The return on assets and return
on equity ratios have also improved as the result of the large increases in sales
combined with power expenses relative to sales in 2013.
Market Measures
Because Facebook did not go public until 2012, it is hard to assess the PE ratio
which was extremely high at 1331 at the end of 2012. The PE ratio has dropped
back to a level of 88 at the end of 2013 which is still high, but much lower than
(b)
Reasons to invest
Reasons not to invest
Short-term liquidity is excellent
Unsustainable sales growth
Minimal debt
Volatile profitability
Increasing sales
Increasing CFO
Increasing fixed and total asset turnover
Riskiness of technology
industry
Declining PE ratio
Case 5.4 (a)
Liquidity Ratios:
Current ratio 1.40 times 1.33 times
Quick ratio 0.84 times 0.87 times
Activity Ratios:
Accounts receivable turnover 8.98 times 6.31 times
Inventory turnover 2.37 times 2.23 times
Payables turnover 9.74 times 5.00 times
Fixed asset turnover 25.19 times 22.66 times
Total asset turnover 1.06 times 0.76 times
Leverage Ratios:
Debt ratio 84.62 % 89.72 %
Long-term debt to total capitalization 26.84 % 23.02 %
Profitability Ratios:
Gross profit margin 28.44 % 16.56 % 0.00 0
Operating profit margin (15.99) %(38.57) %0.00 0
Market Ratios:
Earnings per share (1.04)$ (1.74)$ –$
Price-to-earnings 0.00 N/M 0.00 N/M 0.00 0
Hydrogenics Corporation (HYGS / NASDAQ)
Summary of Financial Statement Ratios
Results for the Years Ending
Dec 31, 2013
Dec 31, 2012
Jan 0, 1900
Show Formulas
(b) As requested, an evaluation of Hydrogenics has been completed. The
following report includes an evaluation of short-term liquidity, capital structure
Short-term Liquidity
Hydrogenics current ratio is above one and has increased slightly as a result of
current assets decreasing at a slower rate than the decrease in current liabilities.
The quick ratio, on the other hand, has decreased because inventories make up a
larger percentage of current assets. The current and quick ratios are acceptable
amounts, but the cash flow liquidity ratio is below one and decreasing
significantly. This is due to the negative cash flow from operating activities which
As sales have increased, accounts receivable has decreased. This is not an expected
pattern, but is a positive situation for Hydrogenics as they have reduced accounts
receivable through collection, rather than through write-offs of bad debts, as
evidenced by the valuation schedule in Note 27. The collection period has dropped
from 58 to 41 days which is a good improvement in this ratio. The allowance for
doubtful accounts has increased even though accounts receivable has decreased;
again, not an expected pattern. There is no indication that bad debt will increase in
2014, although Hydrogenics may be aware of high risk accounts that are not
up a significant portion of accounts receivable and revenues. Hydrogenics two
largest customers accounted for 34% of revenue and 42.6% of accounts receivable
at the end of 2013. Assessing the financial well being of these two customers is
warranted.
The cash conversion cycle increased 9 days. The improvements in average
collection period and inventory days held reduced the cash conversion cycle by a
total of 26 days, but Hydrogenics paid accounts payable 35 days faster in 2013,
compared to 2012, resulting in the overall increase.
Operating Efficiency
As discussed under short-term liquidity, Hydrogenics accounts receivable and
inventory turnovers have improved and the firm is paying suppliers quicker.
Total asset turnover has also improved due to the increased revenues and a decline
in total assets. The small turnover is a result of the large amount of cash and
goodwill that is included in total assets.
Capital Structure and Long-term Solvency
retained earnings (deficit) resulting in total stockholders’ equity increasing by 5%.
Hydrogenics addresses their sources of liquidity and their liquidity risks in
Note 27. Because the firm has sustained losses and generated negative cash flows
from operations since inception, it relies on external sources of funding through
common stock issuance and long-term debt. The majority of total liabilities is
current which means the firm will need to have enough cash to pay these bills
within one year; however, the long-term debt, including both principal and interest,
does not begin to come due for at least three years. This will allow Hydrogenics
some time to improve profitability and cash flow in order to begin paying down
long-term debt commitments.
Profitability
Revenues for Hydrogenics increased 33.81% overall in 2013 while operating
expenses increased 7.84% resulting in a favorable change. Hydrogenics has
operated at a net loss, however, the net loss is decreasing from 2012 to 2013. The
firm operates in two key segments, Onsite Generation and Power Systems.
Gross profit margin has improved from 16.6% in 2012 to 28.4% in 2013 due to
improved margins from the Onsite generation segment and increased revenue from
the Power Systems segment. The gross profit change for Onsite generation only a
1% improvement and is being harmed by the decrease in revenues in this segment.
Hydrogenics is affected by volume changes which indicates that fixed costs are
significant for the firm. As noted in the MDA the gross profit margin has declined
from 22% in 2011 to 15% in 2013. Power Systems gross profit has also increased
due to custom projects which have higher gross margins.
Raw materials and consumables and employee benefits are the largest expense
categories for Hydrogenics. Raw materials and consumables used are stable in
dollar amount and have actually declined in 2013. Employee benefits have
increased 38.6% due to increased salaries and wages and share-based
compensation. The MDA explains that the increase in SG&A is largely attributed
to increased marketing efforts and a higher level of activity in commercial
activities in the Power Systems segment. It appears that the increase in expenses
has resulted in favorable revenue increases.
Market Measures
Due to Hydrogenics’ losses, earnings per share is negative, but improving. The
firm does not pay dividends, nor should they be using scarce resources in this
manner. A positive sign is that the stock price for Hydrogenics has increased
substantially since the end of 2012. Clearly investors see value in the new and
innovative products that the firm has to offer.
Strengths
Innovative products
Ability to attract investors and creditors
Weaknesses
Reliance on two customers
Riskiness and competitiveness of industry
Negative cash flows from operating activities
Lack of profitability
High debt ratio
Investment potential
Hydrogenics is in a high risk industry and has a high risk capital structure. The
Creditworthiness
With a debt ratio currently at 85% it is not recommended that creditors loan more