Financial and Managerial Accounting, 8e
5-1
CHAPTER 5
INVENTORIES AND COST OF SALES
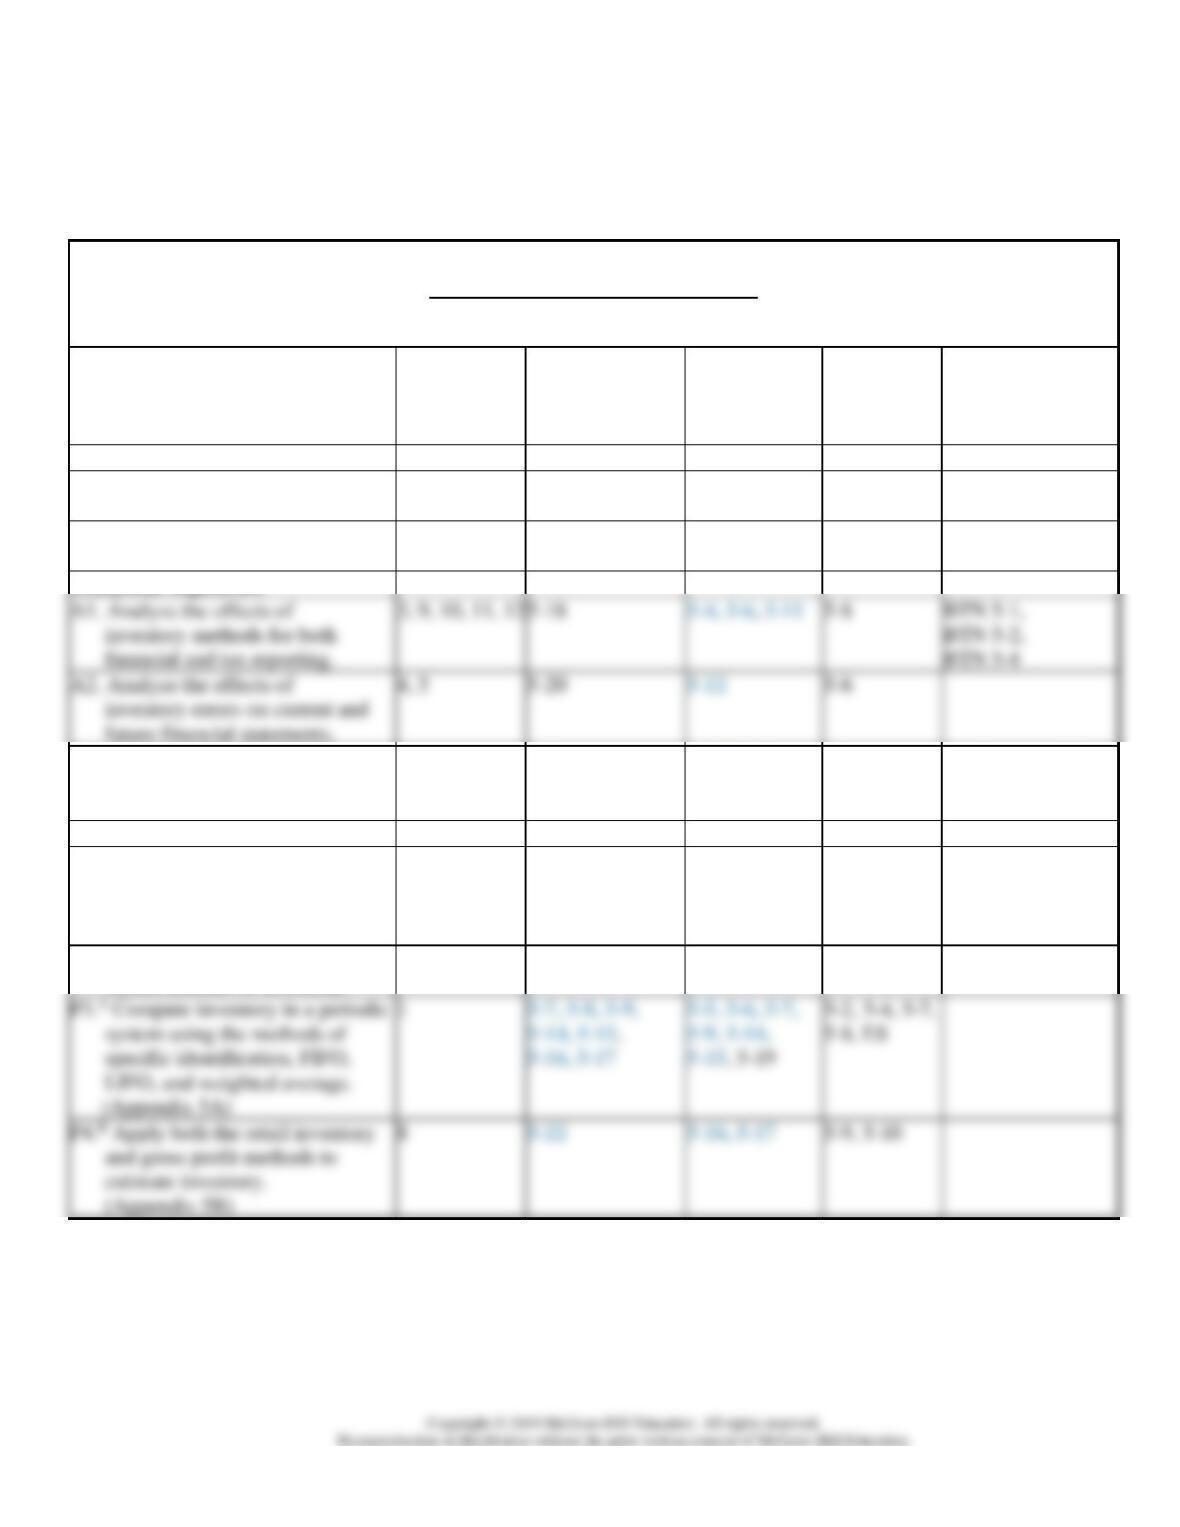
Related Assignment Materials
Student Learning Objectives
Questions
Quick Studies*
Exercises*
Problems*
AA and BTN
Conceptual objectives:
C1. Identify the items making up
merchandise inventory.
7
5-1, 5-17, 5-23
5-1
BTN 5-6
C2. Identify the costs of merchandise
inventory.
1, 2
5-2, 5-23
5-2
AA 5-1,
BTN 5-6
Analytical objectives:
A1. Analyze the effects of
inventory methods for both
financial and tax reporting.
3, 9, 10, 11, 12
5-18
5-8
BTN 5-1,
BTN 5-2,
BTN 5-4
A2. Analyze the effects of
inventory errors on current and
future financial statements.
4, 5
5-20
5-12
5-6
A3. Assess inventory management
using both inventory turnover and
days’ sales in inventory.
5-21
5-11, 5-13
SP
AA 5-1, AA 5-2,
AA 5-3, BTN 5-3,
BTN 5-5
Procedural objectives:
P1. Compute inventory in a perpetual
system using the methods of
specific identification, FIFO,
LIFO, and weighted average.
1
5-3, 5-4, 5-5,
5-6, 5-10, 5-11, 5-
12, 5-13
5-3, 5-8, 5-18
5-1, 5-3
BTN 5-4
P2. Compute the lower of cost or
market amount of inventory.
LIFO, and weighted average.
(Appendix 5A)
estimate inventory.
(Appendix 5B)
6
5-19, 5-23
5-10
5-5, SP
*See additional information on next page that pertains to these quick studies, exercises, and problems.
SP refers to the Serial Problem
AA refers to Accounting Analysis
BTN refers to Beyond the Numbers
Questions with Guided Example videos
Copyright © 2019 McGraw-Hill Education. All rights reserved.
No reproduction or distribution without the prior written consent of McGraw-Hill Education.
5-2
Additional Information on Related Assignment Material
See Chapter 1 of the Instructor’s Resource Manual for more information on materials for this text available in
Connect.
Connect
Available on the instructor’s course-specific website, Connect:
• All numerical Quick Studies, all Exercises and Problems Set A.
Hints/Guided Examples
Please note that the Guided Examples are labeled as “Hints” in Connect assignments. The animated PowerPoints without
the video and audio functions for the Guided Examples are also available in the Connect Instructor Library and Exercise
Presentations. These are indicated in the Related Assignment Materials grid on page 1 in blue bold font.
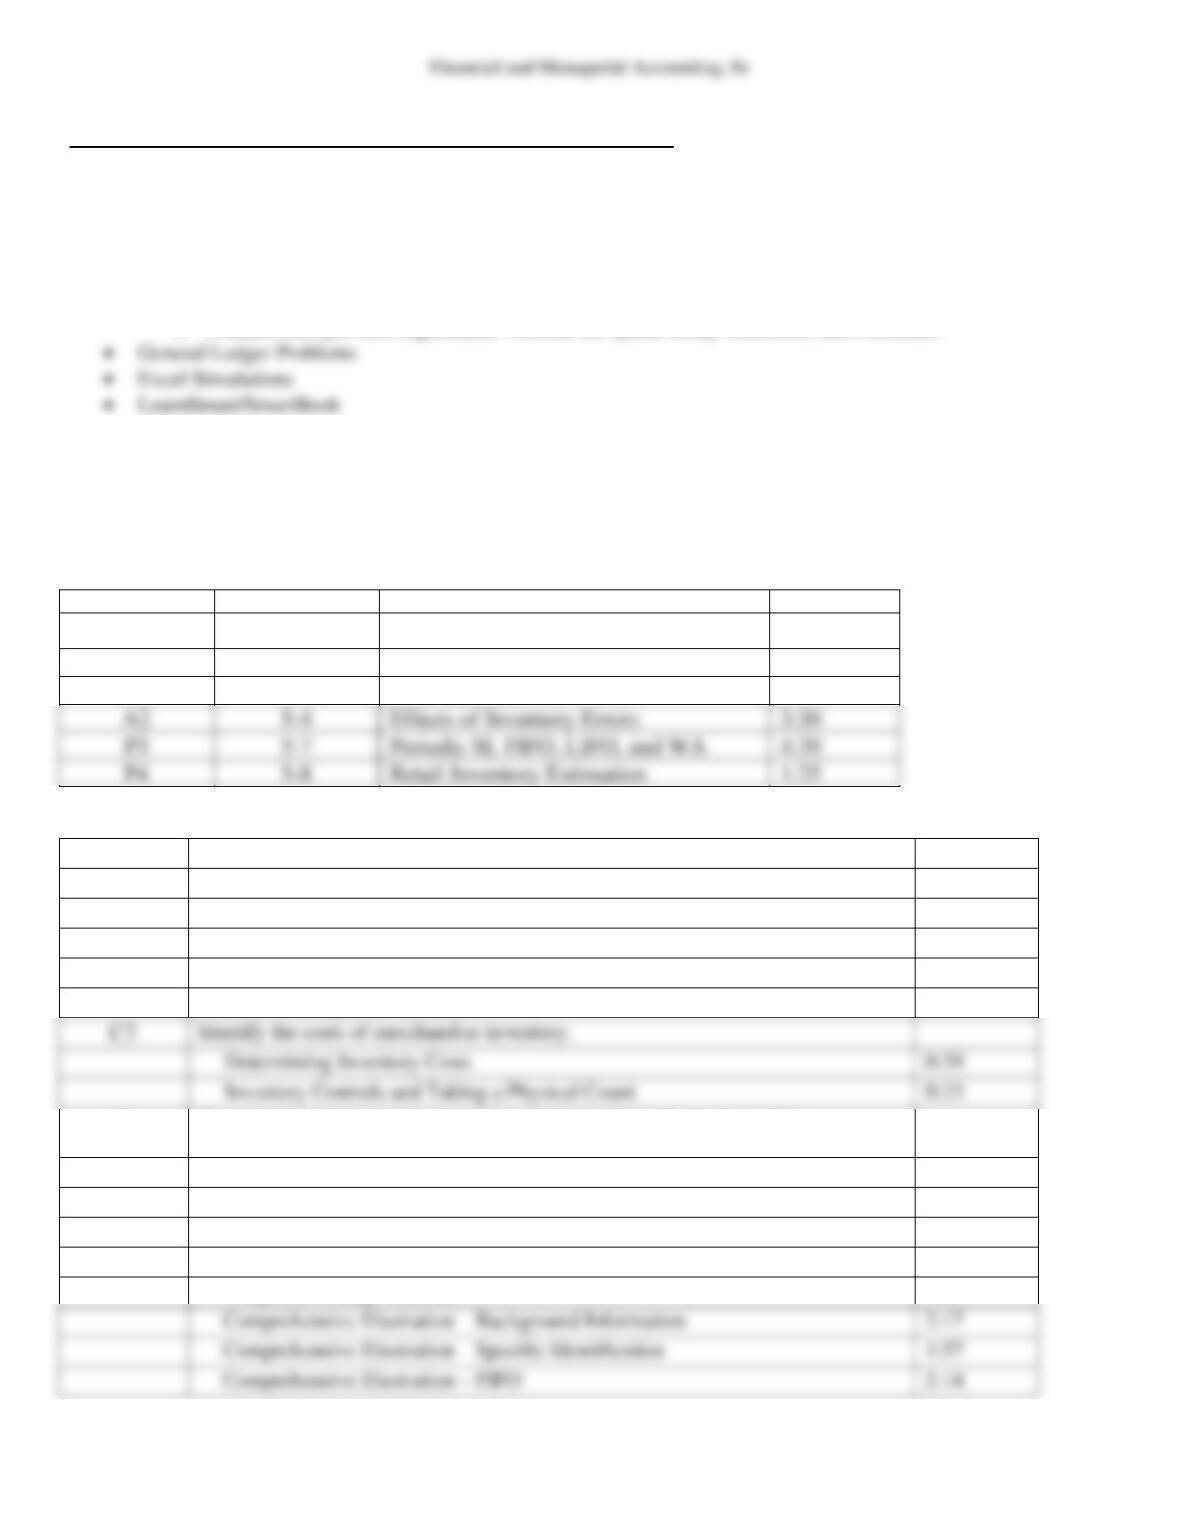
Need-to-Know Videos
LO
Need–to-Know
Title
Time
C1, C2
5-1
Inventory Items and Costs
2:34
P1
5-2
Perpetual SI, FIFO, LIFO, and WA
9:52
P2
5-3
LCM Method
1:57
5-4
Effects of Inventory Errors
3:30
P3
5-7
Periodic SI, FIFO, LIFO, and WA
4:39
P4
5-8
Retail Inventory Estimation
1:25
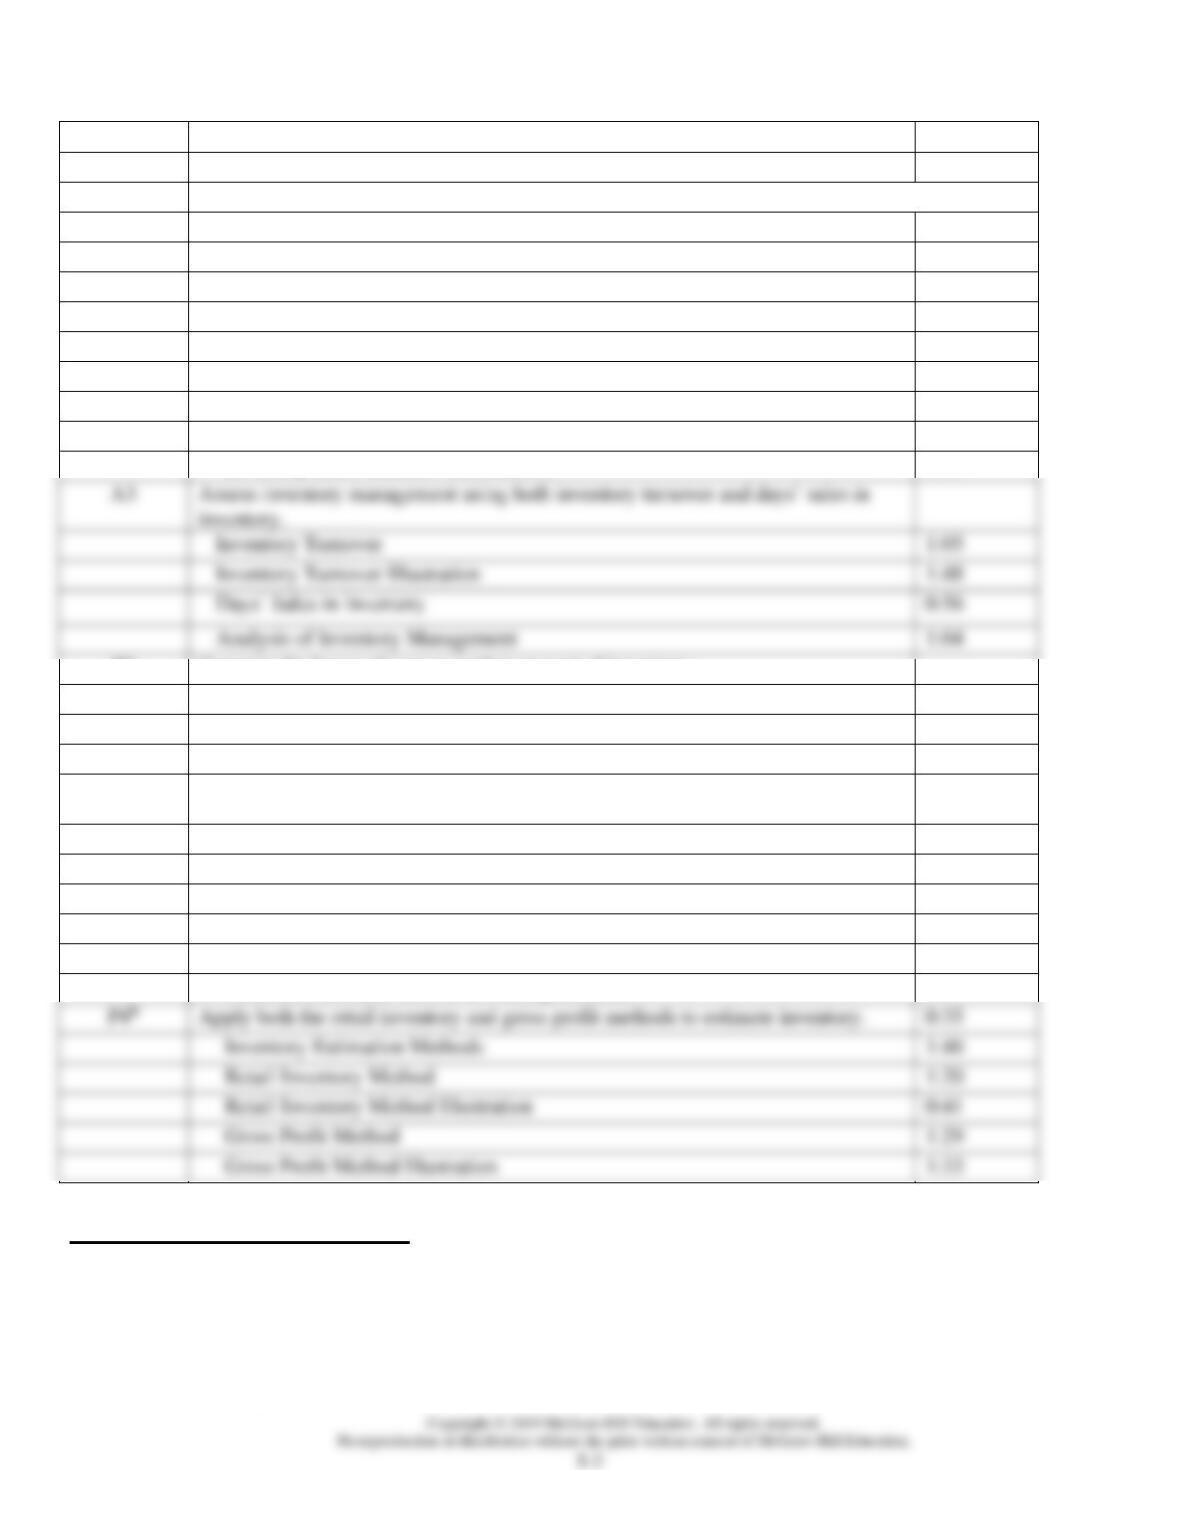
Concept Overview Videos
LO
Title
Time
C1
Identify the items making up merchandise inventory.
Determining Inventory Items
0:17
Goods in transit
0:56
Goods on consignment
0:57
Goods damaged or obsolete
0:33
C2
Identify the costs of merchandise inventory.
0:39
0:33
P1
Compute inventory in a perpetual system using the methods of specific
identification, FIFO, LIFO, and weighted average.
Inventory Costing Illustration
1:22
Specific Identification
1:07
First-In, First-Out Method
1:09
Last-In, First-Out Method
0:52
Weighted Average Method
1:18
Comprehensive Illustration – Specific Identification
1:57
Comprehensive Illustration – FIFO
2:14
Financial and Managerial Accounting, 8e
Comprehensive Illustration – LIFO
2:14
Comprehensive Illustration – Weighted Average
1:22
A1
Analyze the effects of inventory methods for both financial and tax reporting.
Financial Statement Effects of Costing Methods
1:19
Tax Effects of Costing Methods
0:48
A2
Analyze the effects of inventory errors on current and future financial statements.
0:45
Financial Statement Effects of Inventory Errors
Income Statement Effects
1:11
Inventory Error Example
0:26
Year 1 Understated Inventory: Income Statement Effects
1:40
Years 1 and 2 Understated Inventory: Income Statement Effects
1:08
Inventory Error: Balance Sheet Effects
1:03
1:05
1:48
1:04
P2
Compute the lower of cost or market amount of inventory.
Lower of Cost or Market Definition
1:33
Lower of Cost or Market Illustration
1:02
Lower of Cost or Market Journal Entry
0:47
P3A
Compute inventory in a periodic system using the methods of specific
identification, FIFO, LIFO, and weighted average.
Inventory Costing under a Periodic System
1:28
Specific Identification Illustration
2:42
First-In, First-Out Illustration
1:29
Last-In, First-Out Illustration
1:36
Weighted Average Illustration
0:48
Financial Statement Effects of Costing Methods
Apply both the retail inventory and gross profit methods to estimate inventory.
0:35
Inventory Estimation Methods
1:46
Retail Inventory Method
1:20
Retail Inventory Method Illustration
0:41
Gross Profit Method
1:29
Gross Profit Method Illustration
1:33
Synopsis of Chapter Revisions
NEW opener—Shake Shack and entrepreneurial assignment.
New Ethical Risk on the alleged fraud of Homex.
Simplified introduction to inventory costing.
Shortened explanation for specific identification.
Added colored arrow lines to Exhibits 5A.3 and 5A.4 to show cost flows from purchases to sales.
Enhanced layout to explain effects of inventory errors across years.
Financial and Managerial Accounting, 8e
Updated inventory turnover and days’ sales in inventory analysis using Costco and Walmart.
New Cheat Sheet reinforces chapter content.
Added one new Quick Study.
Added two new Exercises.
Added new analysis assignments: Company Analysis, Comparative Analysis, and Global Analysis.
Chapter Outline
I. Inventory Basics
A. Determining Inventory Items
Merchandise inventory includes all goods that a company owns and holds for sale. The following
inventory items require special attention:
1. Goods in Transit—if ownership has passed to the purchaser, the goods are included in the
purchaser’s inventory. Ownership is determined by reviewing the shipping terms.
a. FOB destination—goods included in buyer’s inventory after arrival at their destination.
b. FOB shipping point—goods included in buyer’s inventory once they are shipped.
3. Goods Damaged or Obsolete
a. Damaged and obsolete (and deteriorated) goods are not reported in inventory if they cannot be
sold.
b. If these goods can be sold at a lower price, they are included in inventory at their net realizable
value, the sales price minus the cost of making the sale.
B. Determining Inventory Costs
C. Internal Controls and Taking a Physical Count
1. Events (theft, loss, damage, and errors) can cause the Inventory account balance to differ from the
actual inventory on hand.
2. Nearly all companies take a physical count of inventory at least once a year; the physical count is
used to adjust the Inventory account balance to the actual inventory on hand.
3. Internal controls when taking a physical count of inventory:
a. Prenumbered inventory tickets—each ticket must be accounted for.
b. Those responsible for the inventory do not count the inventory.
d. A second count is taken by a different counter.
II. Inventory Costing under a Perpetual System One of the most important issues in accounting for
inventory is determining the per unit cost assigned to inventory items. The periodic system is covered in
Appendix 5A.
A. Inventory Cost Flow Assumptions
Four methods are used to assign costs to inventory and cost of goods sold. Each method assumes a
Financial and Managerial Accounting, 8e
particular pattern for how costs flow through inventory. Physical flow and cost flow need not be the
same.
1. First-In, First-Out (FIFO)—assumes costs flow in the order incurred. (Results are identical under
the periodic and perpetual systems.)
2. Last-In, First-Out (LIFO)—assumes costs flow in the reverse order incurred. (Results differ from
perpetual in the appendix because the periodic method applies its computation at period-end only
versus the perpetual method that applies its computation at each sale.)
B. Under the perpetual inventory system, Merchandise Inventory is updated for each purchase and sale of
inventory. Cost of goods available for sale must be allocated between cost of goods sold and ending
inventory.
1. Specific identification—Each item can be identified with a specific purchase and invoice. Specific
identification is usually only practical for companies with expensive, custom-made inventory.
2. First-in, first-out (FIFO)—Assumes costs flow in the order incurred.
C. Financial Statement Effects of Costing Methods
1. Rising Costs—when purchase costs regularly rise:
a. FIFO reports lowest cost of goods sold and highest gross profit and net income.
b. LIFO reports highest cost of goods sold and lowest gross profit and net income.
c. Weighted average results are between FIFO and LIFO.
3. Method Advantages:
a. FIFO—inventory on balance sheet approximates its current cost and better matches current costs
with revenues.
D. Tax Effects of Costing Methods
Since inventory costs affect net income, they have potential tax effects.
III. Valuating Inventory at LCM and the Effects of Inventory Errors
A. Lower of Cost or Market
Inventory is reviewed to ensure it is reported at the lower of cost or market (LCM).
1. Computing the Lower of Cost or Market—Market in the term LCM is replacement cost for LIFO,
but net realizable value for the other three methods.
2. A decline in market value means a loss of value in inventory
Financial and Managerial Accounting, 8e
3. When market value is lower than inventory cost, a loss is recognized;
4. When market value is higher than inventory cost, no adjustment is made.
4. Recording the Lower of Cost or Market—accounting rules require that inventory be adjusted to
market when market is less than cost, but inventory normally cannot be written up to market when
market exceeds cost.
B. Financial Statement Effects of Inventory Errors
An inventory error causes misstatements in cost of goods sold, gross profit, net income, current assets,
and equity. It also causes misstatements in the next period’s financial statements because ending
inventory of one period is the beginning inventory of the next.
1. Income Statement Effects:
a. If ending inventory is understated, cost of goods sold is overstated and net income is
understated.
b. If beginning inventory is understated, cost of goods sold is understated and net income is
2. Balance Sheet Effects:
a. If ending inventory is understated, assets and equity are understated.
b. If ending inventory is overstated, assets and equity are overstated.
IV. Decision Analysis—Inventory Turnover and Days’ Sales in Inventory
A. Inventory Turnover
1. Inventory turnover, also called merchandise inventory turnover, measures the number of times a
company’s average inventory was sold during an accounting period.
2. It is used to analyze short-term liquidity and assess if management is doing a good job controlling
the amount of inventory.
3. A low ratio means company may have more inventory than it needs to support its sales volume.
B. Days’ Sales in Inventory
1. Day’s sales in inventory measures the adequacy of inventory to meet sales demand.
2. It reveals how much inventory is available in terms of the number of days’ sales.
4. Viewed as the buffer against out-of-stock inventory and useful in evaluating liquidity of
inventory.
C. Analysis of Inventory Management
Financial and Managerial Accounting, 8e
Inventory management is a major emphasis for most merchandisers; they must both plan and control
inventory purchases and sales. We prefer a high inventory turnover.
V. Inventory Costing under a Periodic System (Appendix 5A)
One of the most important issues in accounting for inventory is determining the per unit cost assigned to
inventory items.
A. Inventory Cost Flow Assumptions
Four methods are used to assign costs to inventory and cost of goods sold. Each method assumes
a particular pattern for how costs flow through inventory. Physical flow and cost flow need not
be the same.
1. First-in, first-out (FIFO)—assumes costs flow in the order incurred. (Results are identical
3. Weighted average—assumes costs flow in an average of the costs available. (Results differ
from periodic in the appendix because the periodic method applies its computation at
B. Inventory Costing Illustration
1. First-in, first-out (FIFO)—At period-end, FIFO charges costs of the earliest units acquired
to cost of goods sold, leaving costs of the most recent purchases in inventory.
2. Last-in, first-out (LIFO)—At period-end, LIFO charges costs of the most recent purchase to
4. Specific identification—At period-end, cost of goods sold is charged with the actual or
invoice cost, leaving actual costs of inventory available in the inventory account.
5. The units of inventory are identical under all methods.
C. Financial Statement Effects of Costing Methods
1. When purchase prices do not change, each inventory costing method assigns the same
amounts to inventory and to cost of goods sold. When purchase prices are different, the
methods assign different cost amounts.
2. Rising Costs:
3. Falling Costs: When costs regularly decline, the reverse occurs for FIFO and LIFO.
4. Method Advantages:
a. FIFO inventory on the balance sheet approximates its current replacement cost; it also
mimics the actual flow of goods for most businesses.

Financial and Managerial Accounting, 8e
5-8
b. LIFO cost of goods sold on the income statement approximates current costs; better
match of current costs with revenues.
c. Weighted average smooths out erratic price changes.
d. Specific identification matches costs of items with revenues they generate.
VI. Inventory Estimation Methods (Appendix 5B)
Financial and Managerial Accounting, 8e
Chapter 5 Alternate Demonstration Problem #1 (Periodic)
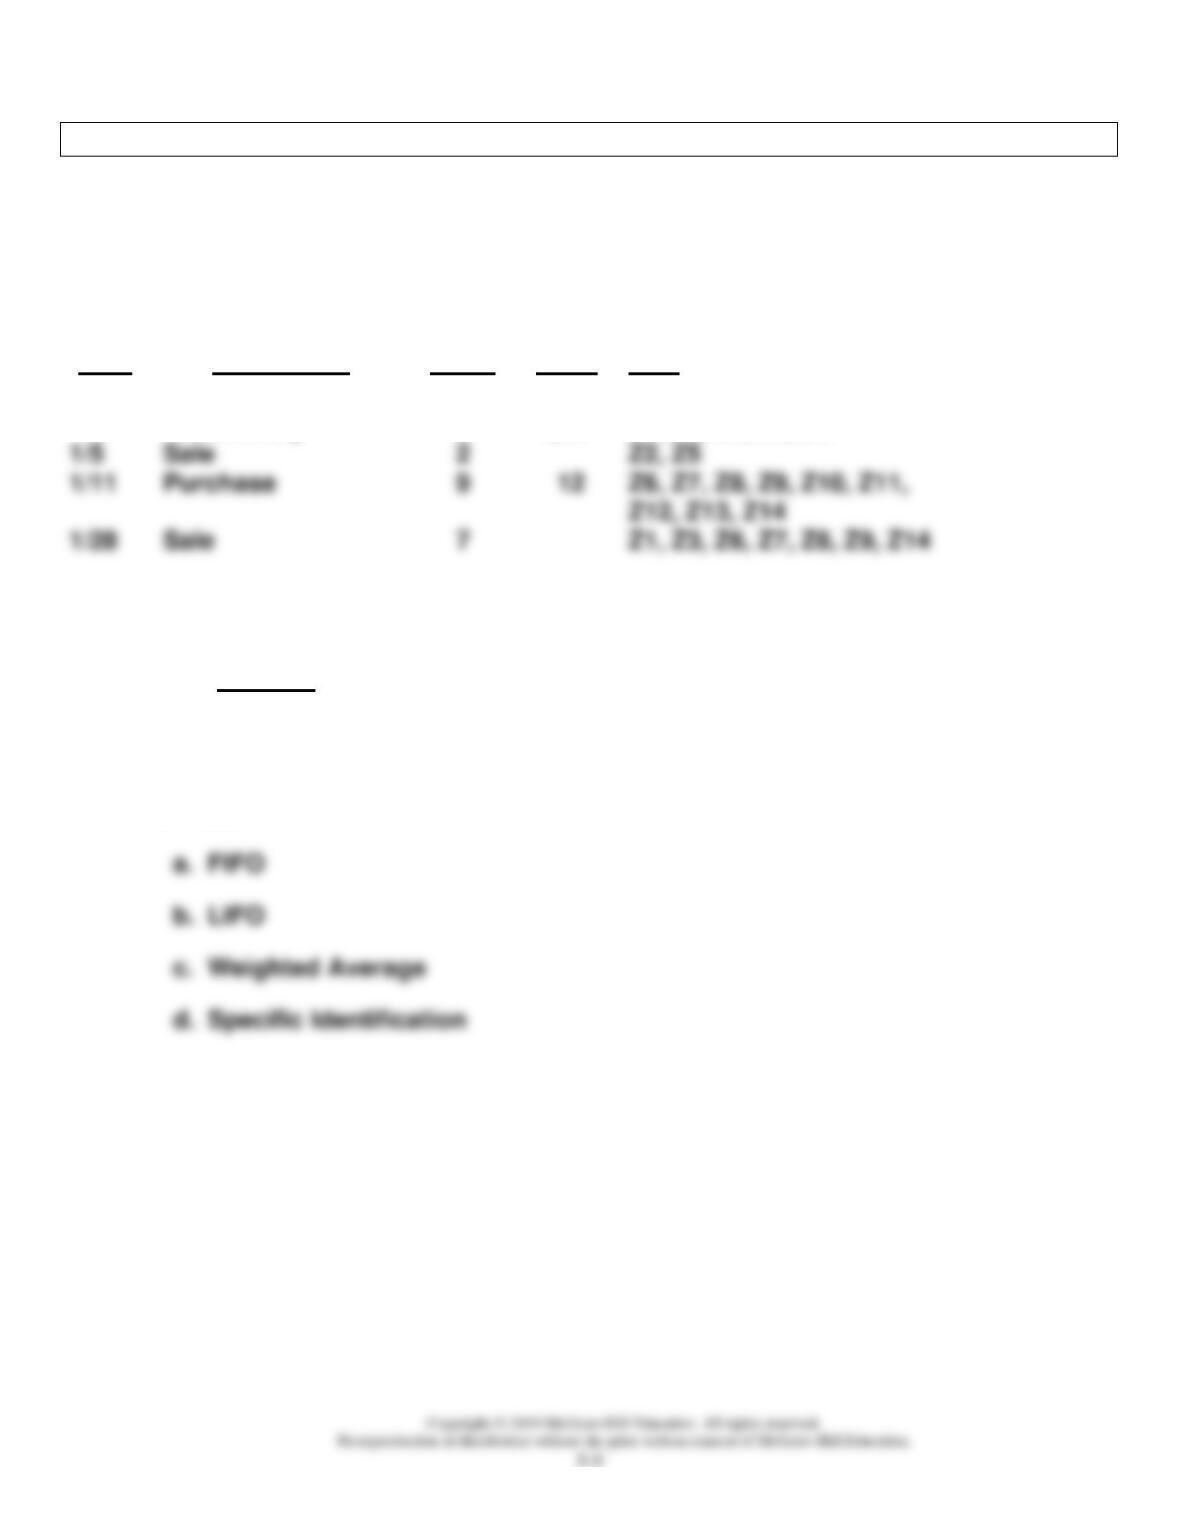
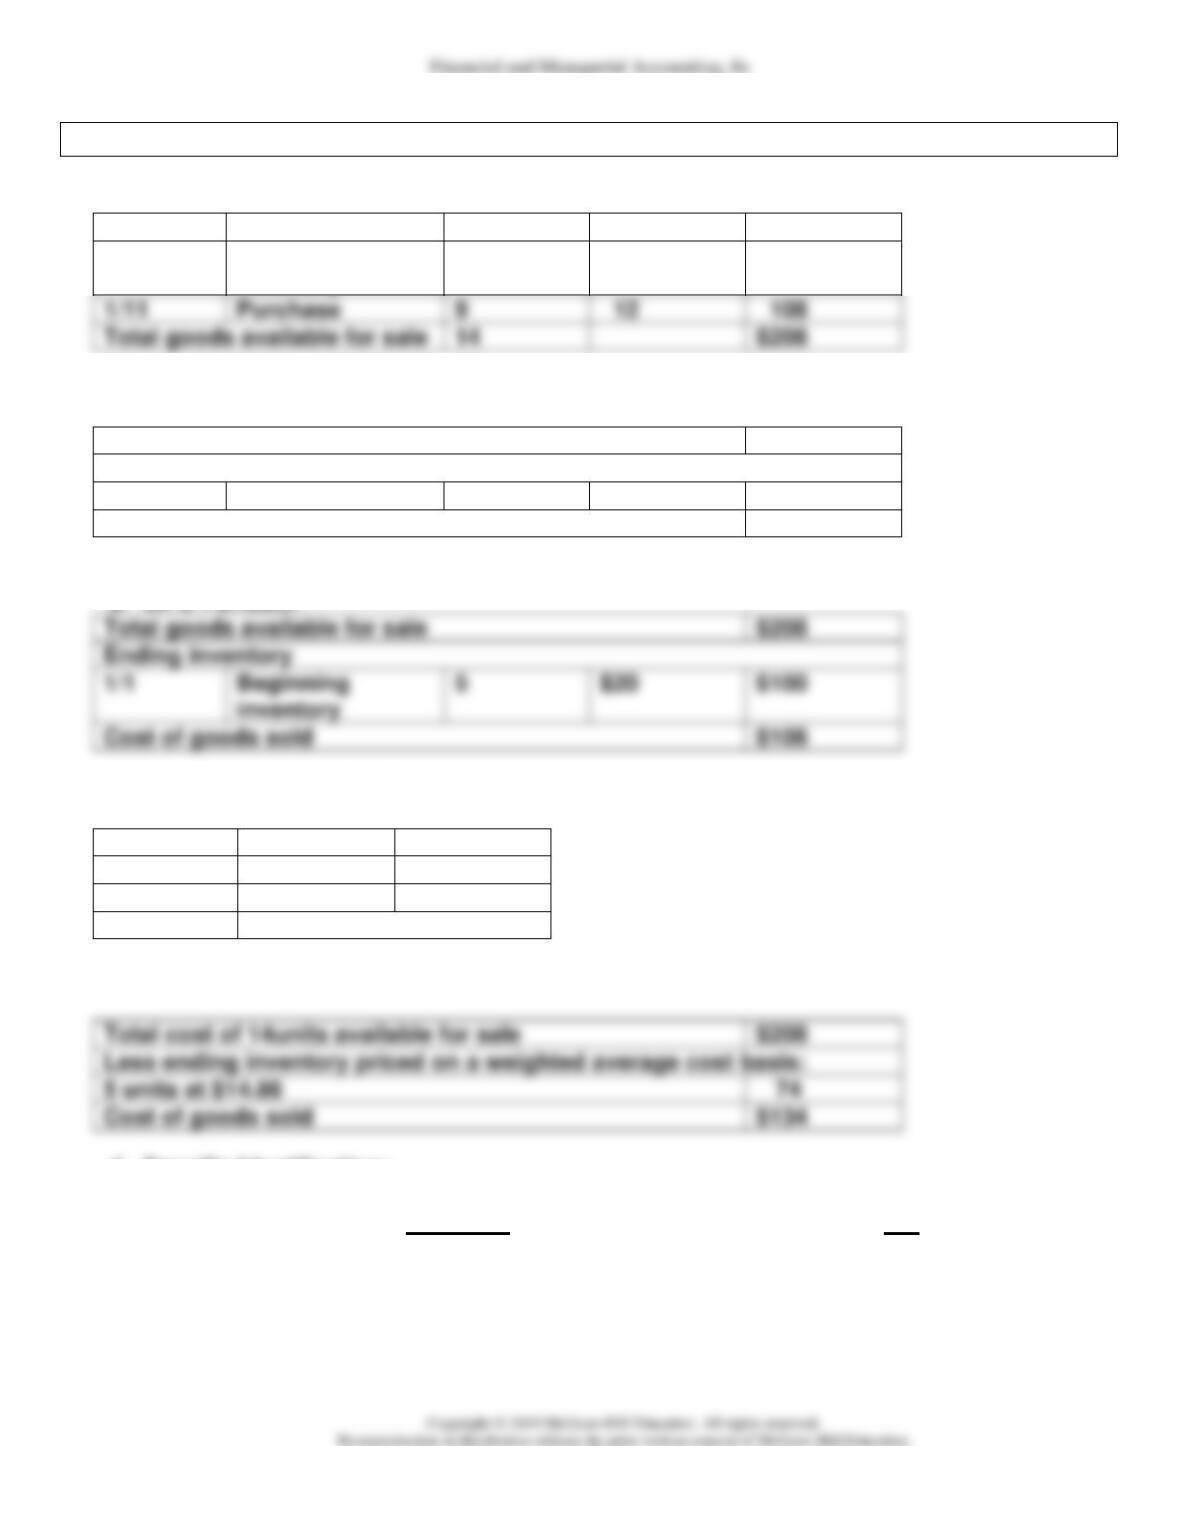
The ABC Company had the following inventory record for the month of January:
# of
Unit
Date
Description
Items
Price
Item
1/1
Beginning
inventory
5
$20
Z1, Z2, Z3, Z4, Z5
2
Z2, Z5
7
Z1, Z3, Z6, Z7, Z8, Z9, Z14
Required:
Assuming a periodic system is in use, determine the following:
1. Cost of goods available for sale.
2. Cost of goods sold and the ending inventory using each of the following
methods:
5-10
Solution: Chapter 5 Alternate Demonstration Problem #1
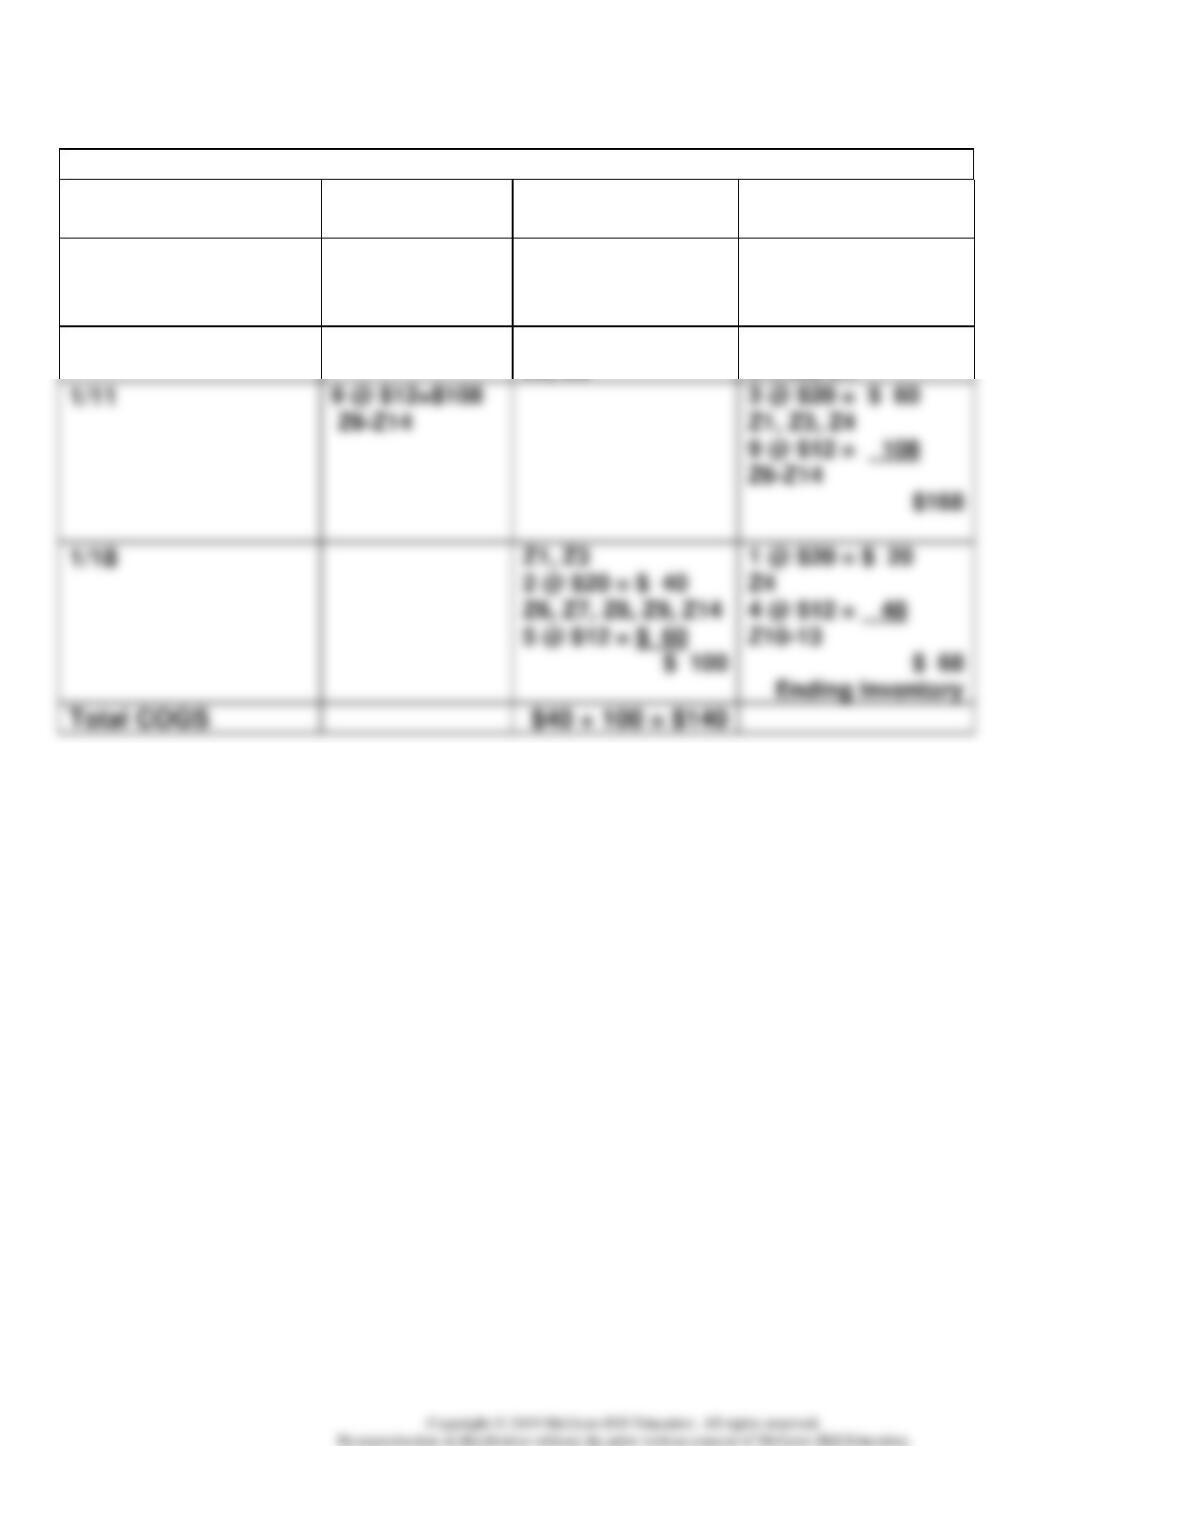
1. Cost of goods available for sale:
Date
Units
Unit Cost
Cost
1/1
Beginning
inventory
5
$20
$100
1/11
Purchase
9
12
108
Total goods available for sale
14
$208
2. a. FIFO Periodic (FIFO under periodic and perpetual yields identical results).
Total goods available for sale
$208
Ending inventory
1/28
Purchase
5
$12
$60
Cost of goods sold
$148
b. LIFO Periodic:
Total goods available for sale
$208
Ending inventory
1/1
Beginning
inventory
5
$20
$100
Cost of goods sold
$108
c. Weighted Average Periodic:
Units
Unit cost
Total cost
5
$20
$100
9
12
108
14
$208
$208 / 14 = $14.86 rounded.
Total cost of 14units available for sale
$208
Less ending inventory priced on a weighted average cost basis:
5 units at $14.86
74
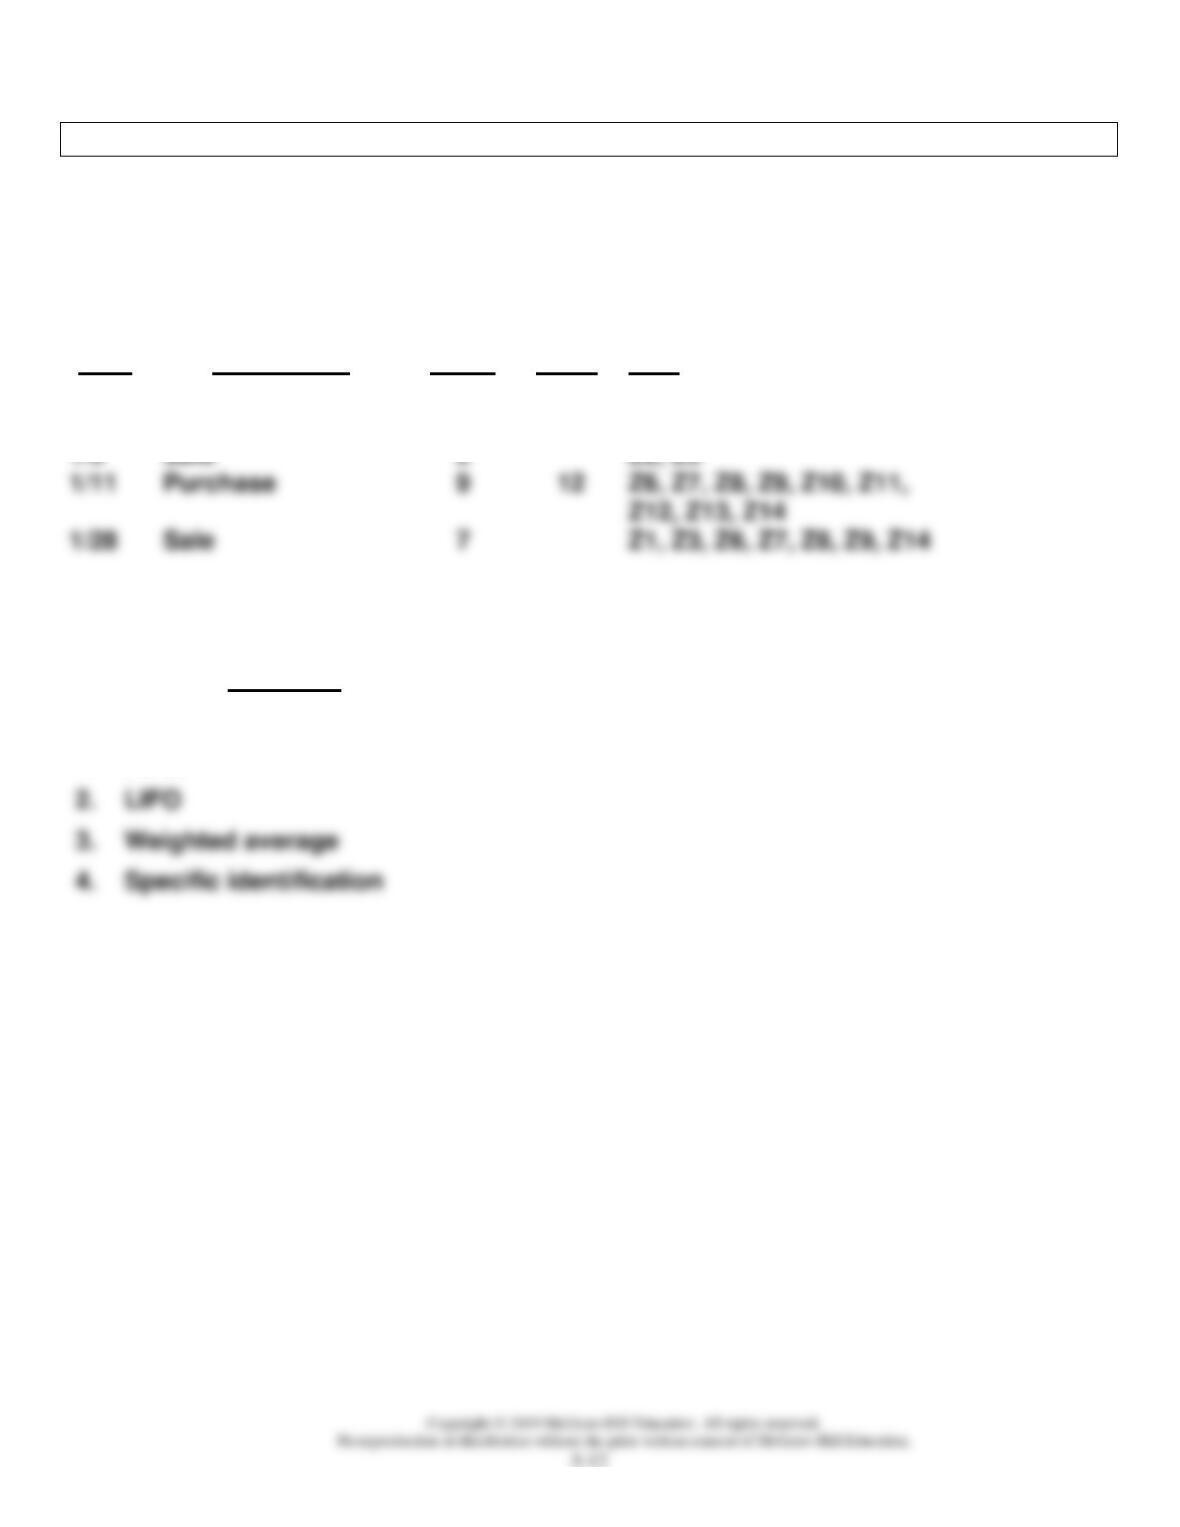
Specific identification method: solution is identical to the solution shown in alternative
demonstration problem for perpetual because specific identification is not a cost flow
assumption; it is a method which specifically identifies each item in inventory and each
item that is sold.
Financial and Managerial Accounting, 8e
5-11
Specific Identification Periodic
Date
Purchases
Sales at Cost
Inventory
Balance
1/1
Beginning
Inventory
5 @ $ 20 = $100
Z1–Z5
1/5
2 @ $20 = $ 40
3 @ $20 = $ 60
Financial and Managerial Accounting, 8e
Chapter 5 Alternate Demonstration Problem #2 (Perpetual)
The ABC Company had the following inventory record for the month of January:
# of
Unit
Date
Description
Items
Price
Item
1/1
Beginning
inventory
5
$20
Z1, Z2, Z3, Z4, Z5
2
Z2, Z5
Z12, Z13, Z14
7
Z1, Z3, Z6, Z7, Z8, Z9, Z14
Required:
Assuming a perpetual system is in use, determine the cost of goods sold and the
ending inventory using each of the following methods:
1. FIFO
5-13
Solution: Chapter 5 Alternate Demonstration Problem #2
1.
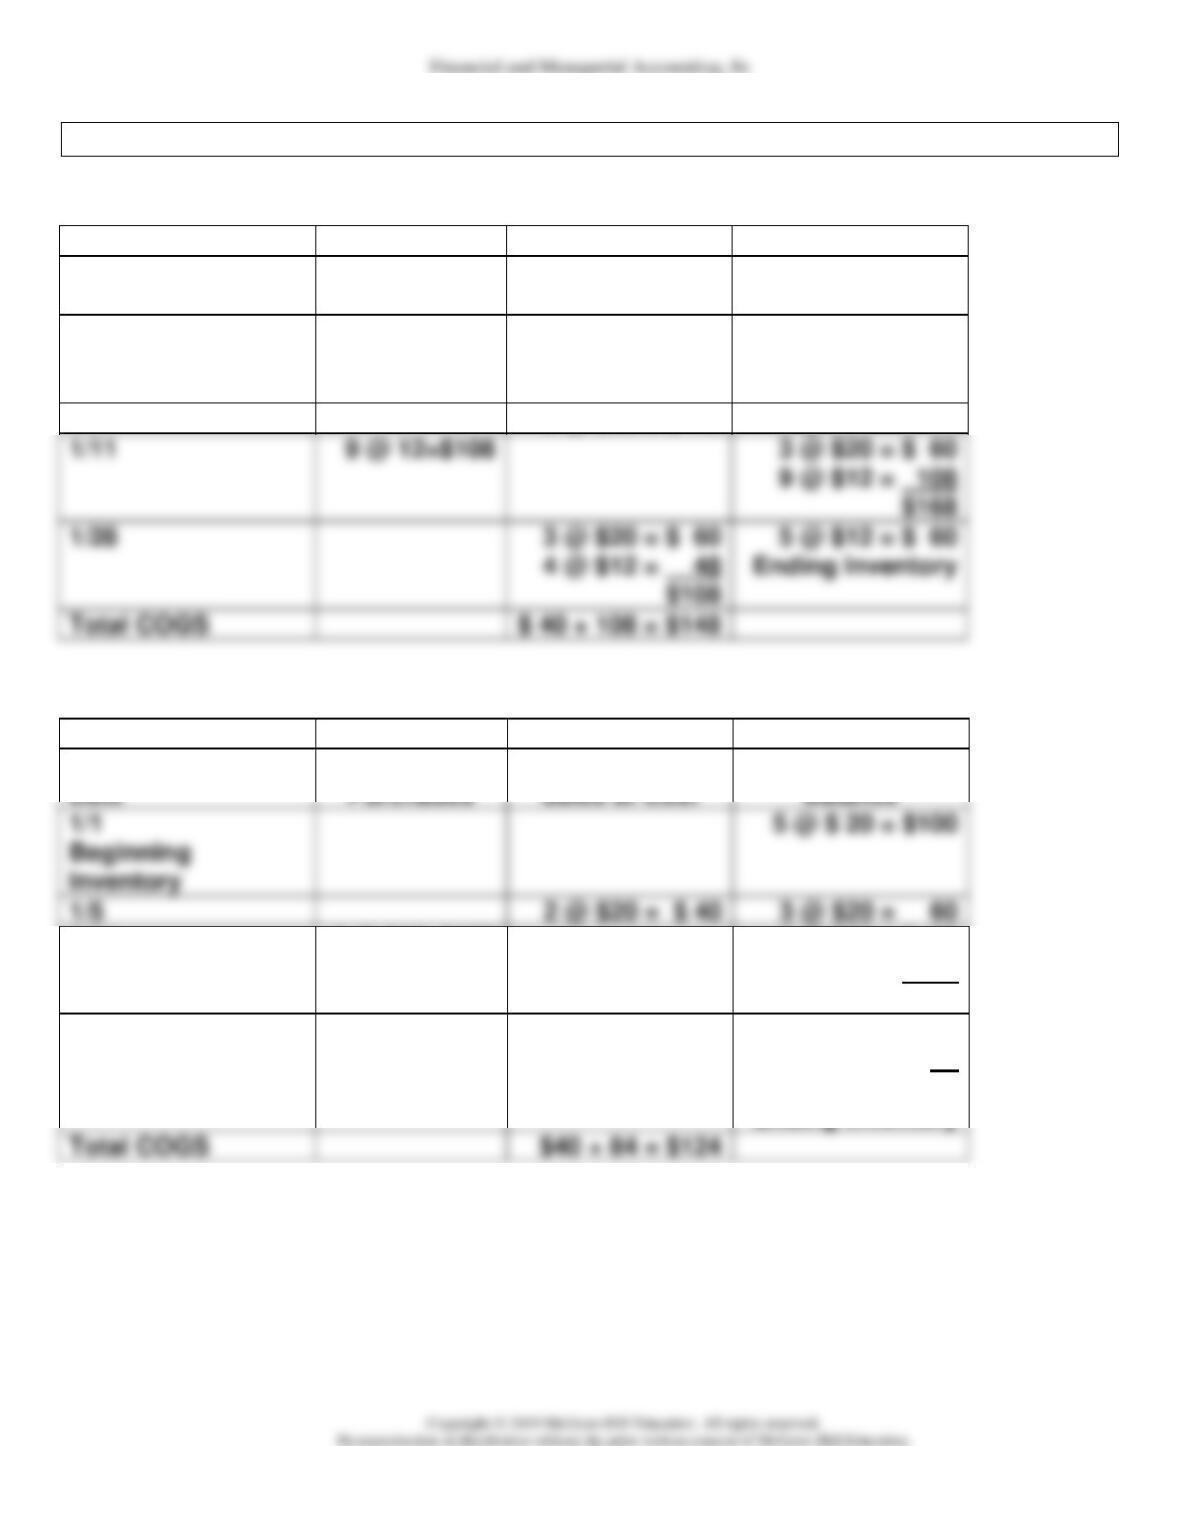
FIFO Perpetual
Date
Purchases
Sales at Cost
Inventory
Balance
1/1
Beginning
Inventory
5 @ $20 = $100
1/5
2 @ $20 = $ 40
3 @ $20 = $ 60
3 @ $20 = $ 60
9 @ $12 = 108
1/28
5 @ $12 = $ 60
Total COGS
$ 40 + 108 = $148
2.
LIFO Perpetual
1/1
Inventory
1/5
2 @ $20 = $ 40
3 @ $20 = 60
Inventory
1/11
9 @ $12=$108
3 @ $20 = $ 60
9 @ $12 = 108
$168
1/18
7 @ $12 = $ 84
3 @ $20 = $ 60
2 @ $12 = 24
$ 84
Total COGS
Financial and Managerial Accounting, 8e
Solution: Chapter 5 Alternate Demonstration Problem #2, continued
3.
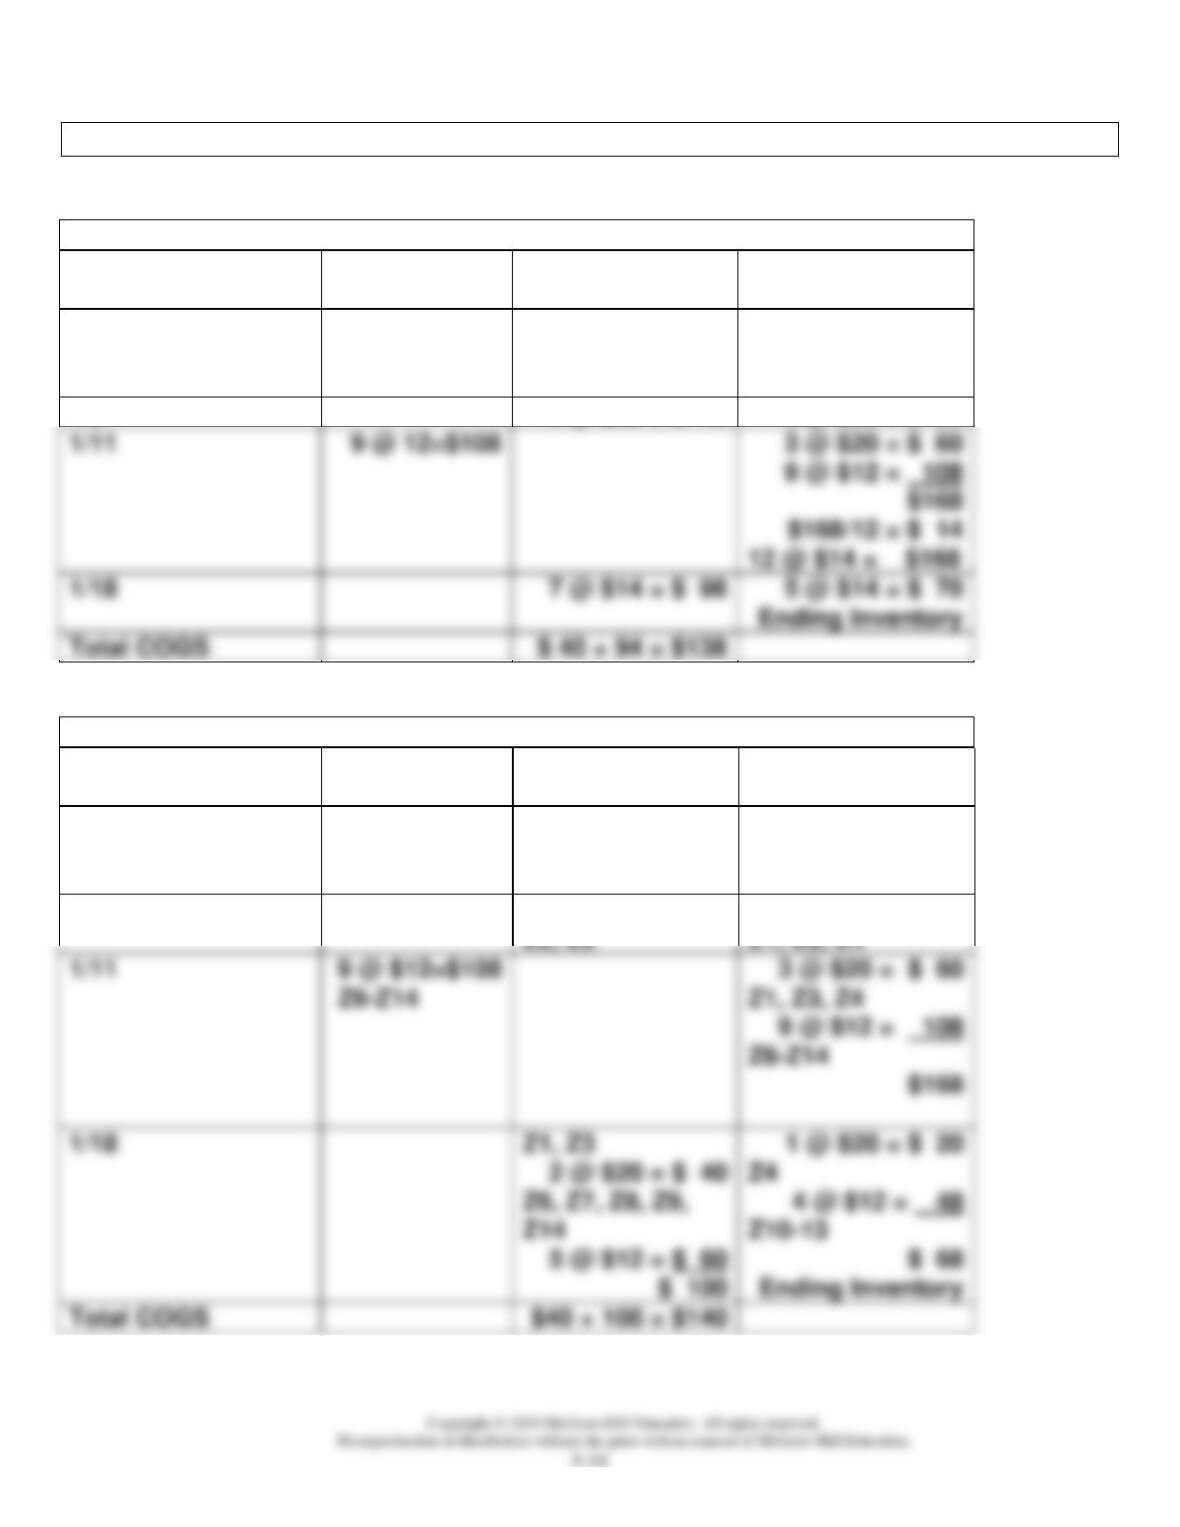
Weighted Average Perpetual
Date
Purchases
Sales at Cost
Inventory
Balance
1/1
Beginning
Inventory
5 @ $20 = $100
1/5
2 @ $20 = $ 40
3 @ $20 = $ 60
12 @ $14 = $168
Total COGS
4.
Specific Identification Perpetual
Date
Purchases
Sales at Cost
Inventory
Balance
1/1
Beginning
Inventory
5 @ $ 20 = $100
Z1–Z5
1/5
2 @ $20 = $ 40
Total COGS
3 @ $20 = $ 60