CONTINUING PROBLEMS
CON5-1.
a.
Retained earnings (−SE) …………………………………………….
10,000
Cash (−A) ……………………………………………………………..
10,000
b.
Cash (+A) …………………………………………………………………
2,000
Deferred revenue (+L) …………………………………………….
2,000
Rent expense (+E, −SE) ……………………………………………..
Cash (−A) ……………………………………………………………..
d.
Equipment (+A) …………………………………………………………
Note payable (+L) ………………………………………………….
e.
Depreciation expense (+E, −SE) ………………………………….
Accumulated depreciation (+XA, −A) …………………………
Interest expense (+E, −SE) …………………………………………
Interest payable (+L) ……………………………………………….
Req. 1
Transaction
Gross Profit
Operating
Income (Loss)
Current
Assets
a.
NE
NE
−10,000
b..
NE
NE
+2,000
NE
d.
NE
NE
NE
NE
NE
NE
NE
NE
Req. 2
Transaction
Net Profit
Margin
Total Asset
Turnover
Return on
Assets
a.
NE
+
+
NE
NE
+
NE
Financial Accounting, 9/e 5-33
CON5-2.
Req. 1
Pool Corporation
Consolidated Statement of Income
For Year Ended December 31, Current Year
(In Thousands Except Per Share Amounts)
Net sales
$1,793,318
Cost of goods sold
1,261,728
Gross profit
531,590
Selling and administrative expenses
406,523
Operating income
125,067
Interest expense
Income before income taxes
117,312
Provision for income taxes
Net income
$71,993
Earnings per share:
Basic earnings per share
Weighted average shares outstanding
CC5-2. (continued)
Pool Corporation
Consolidated Balance Sheet
December 31, Current Year
(in Thousands)
Assets
Current Assets
Cash and cash equivalents
$ 17,487
Receivables, net
110,555
Product inventories, net
386,924
Total current assets
$538,001
Noncurrent Assets
Property and equipment, net
41,394
Intangible assets
188,841
Other non-current assets, net
30,386
Total assets
$798,622
Liabilities and Stockholders’ Equity
Current Liabilities
Accounts payable
$ 177,437
53,398
Current portion of long-term debt
22
Total current liabilities
230,857
Noncurrent Liabilities
Long-term debt
247,300
Other long-term liabilities
40,719
Total Liabilities
288,019
Stockholders’ Equity
Common stock
47
Additional paid-in capital
173,180
Retained earnings
106,519
Total stockholders’ equity
279,746
Total liabilities and stockholders’ equity
Req. 2
Gross profit percentage
=
Gross profit
=
531,590
=
0.296 (29.6%)
Net sales
1,793,318
Return on assets (ROA)
=
Net income
=
=
0.094 (9.4%)
Avg total assets
Financial Accounting, 9/e 5-35
CASES AND PROJECTS
ANNUAL REPORT CASES
CP5-1.
2. The company owned $17,495,000 in land at the end of the year. This is disclosed in
Note 7, “Property and Equipment”.
4. Website sales are recorded “upon the estimated customer receipt date of the
merchandise” (see Note 2 under “Revenue Recognition”).
Fiscal 2014
Fiscal 2013
Net Income _
Average
Total Assets
$80,322 _
($1,696,908 +$1,694,164)/2
$82,983 _
($1,694,164 + $1,756,053)/2
= 0.05
= 0.05
CP5-2.
1. The company presents the subtotals “gross profit,” “income from operations,” and
“income before income taxes”.
4. The company “capitalizes applicable costs incurred during the application and
infrastructure development stage and expenses costs incurred during the planning
and operating stage”. This is disclosed in Note 2 under “Website Development
Costs.”
7.
2015
2014
Gross Profit
=
Gross Profit
$1,174,930
=
0.354
$1,161,342
=
0.376
Percentage
Net Sales
3,323,077
3,086,608
Financial Accounting, 9/e 5-37
CP5-3.
Req. 1.
American Eagle Outfitters
Urban Outfitters
Net Income _
Average
$80,322 _
$232,428 = 0.113
Req. 2.
ROA Analysis
American Eagle
Outfitters
Urban Outfitters
Net Income
Net Sales
80,322 = 0.024
3,282,867
232,428_ = 0.070
3,323,077
Net Sales
Average Total Assets
2,054,978
Return on Assets
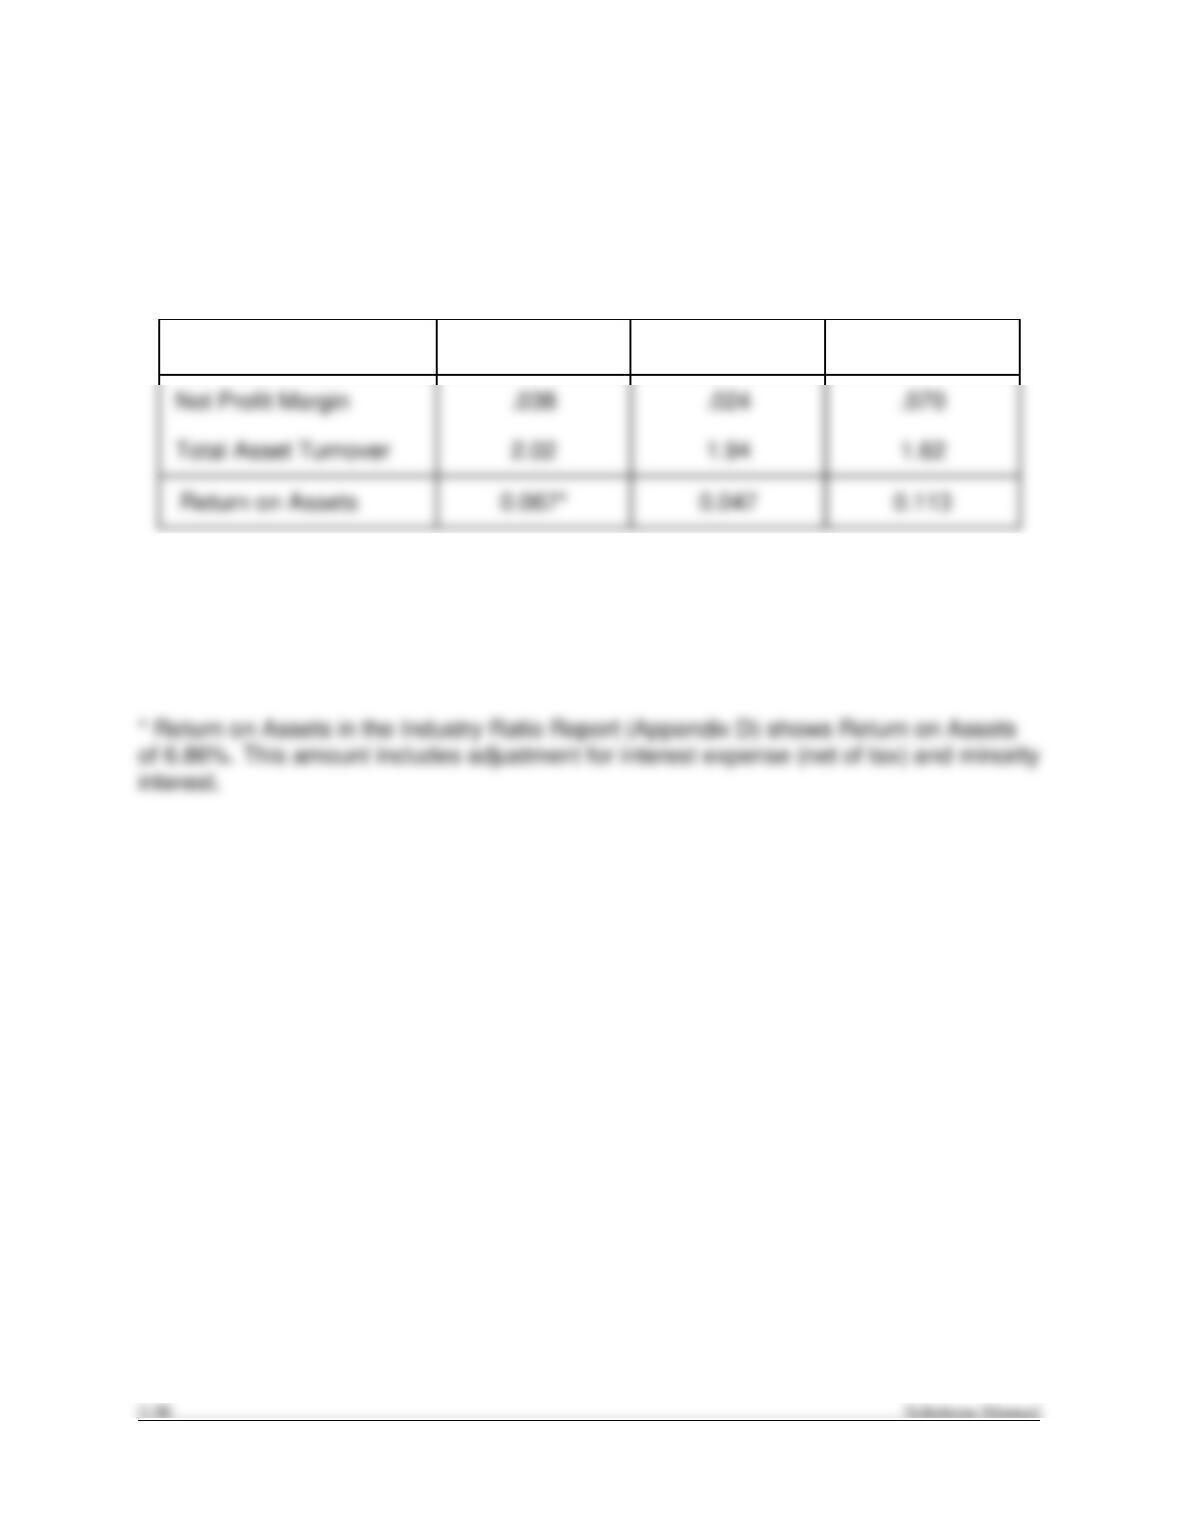
Urban Outfitters has a higher ROA than American Eagle because it has a higher profit
margin which more than compensates for its lower total asset turnover ratio. Ownership
of property, plant, and equipment decreases the total asset turnover ratio relative to
= 0.047
CP5-3. (continued)
Req. 3.
Industry Return on Assets (ROA) profit driver analysis:
ROA = Net Profit Margin Total Asset Turnover
ROA Analysis
Industry
Average
American Eagle
Outfitters
Urban Outfitters
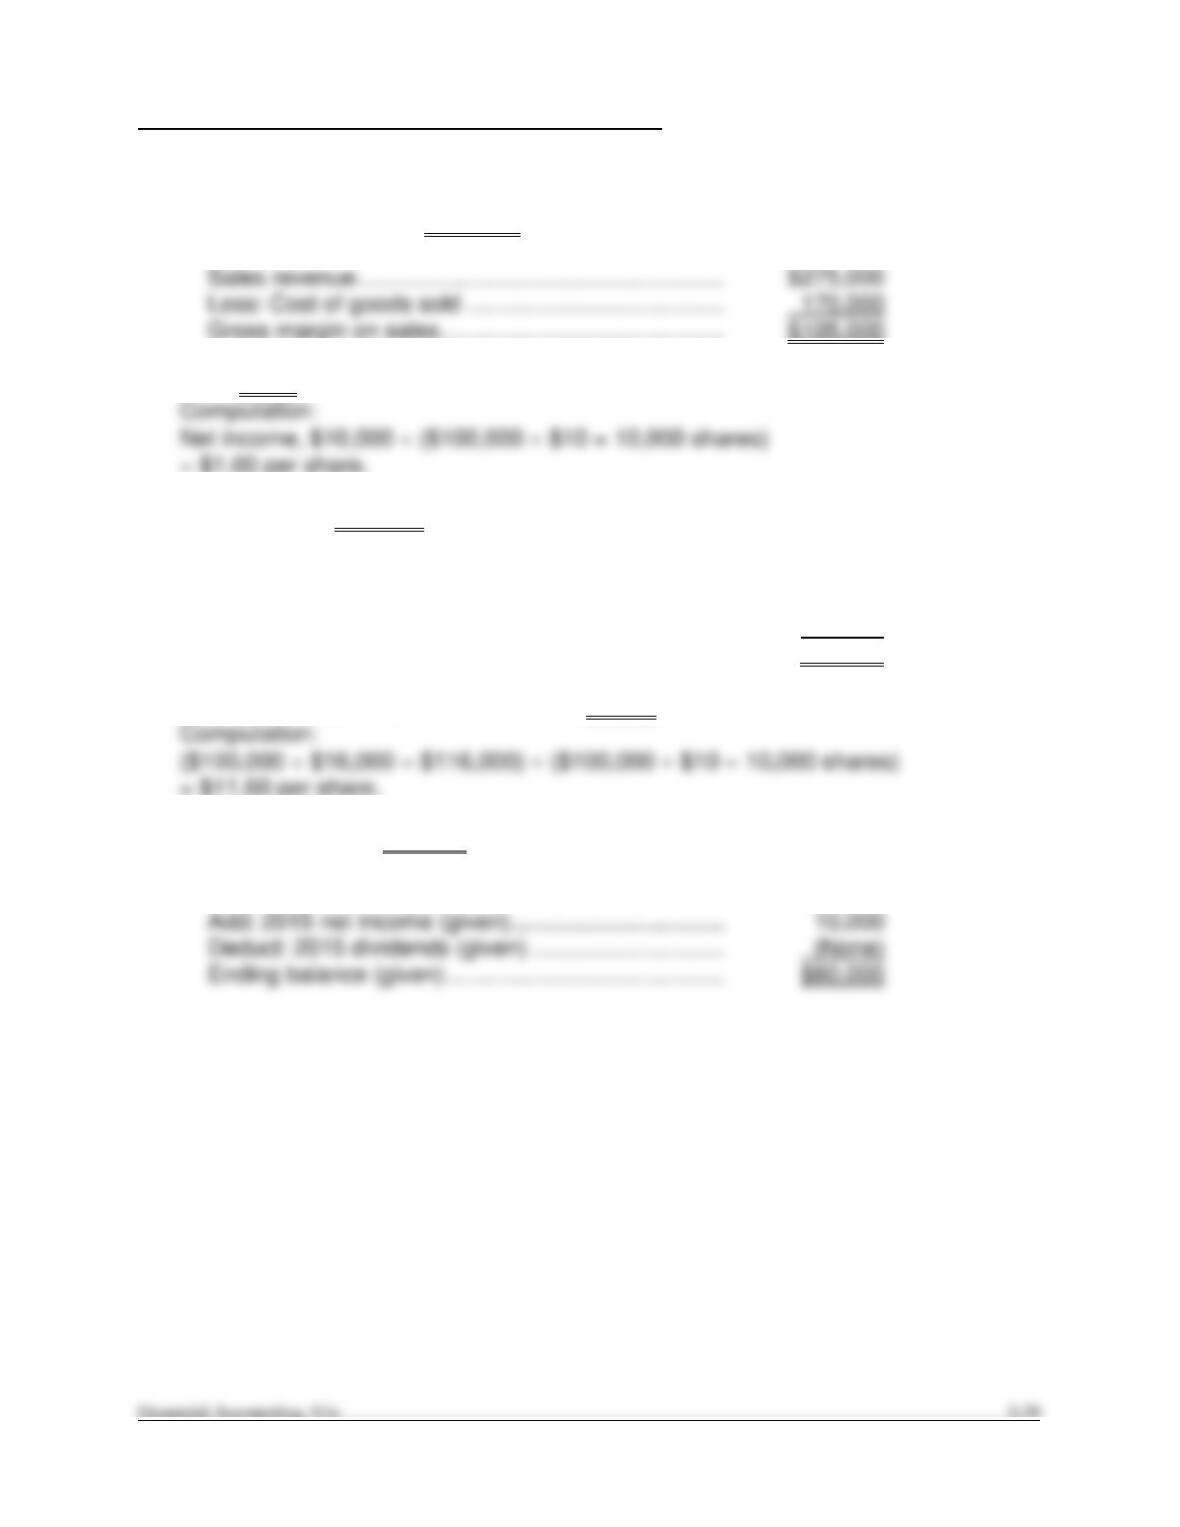
Urban Outfitters has a higher ROA and American Eagle has a lower ROA than the
industry average. This is being driven solely by Urban Outfitters’ higher net profit
margins. This is expected, given that the Urban Outfitters competes by differentiating
their product rather than competing more on price. Both firms have asset turnover
lower than the industry average.
FINANCIAL REPORTING AND ANALYSIS CASES
CP5-4.
1. Gross margin on sales, $105,000.
Computation:
2. EPS, $1.00.
3. Pretax income, $13,333.
Computation (and proof):
Pretax income [$10,000 (100% – 25% = 75%)] …….. $13,333
Proof:
Income tax ($13,333 x 25%) …………………………….. 3,333
Net income ($13,333 x 75%) (given) …………………. $10,000
4. Average sales price per share of stock, $11.60.
5. Beginning balance, $70,000.
Computation: (work backwards)
Beginning balance (?) ($80,000 – $10,000) ………… $70,000
CP5-5.
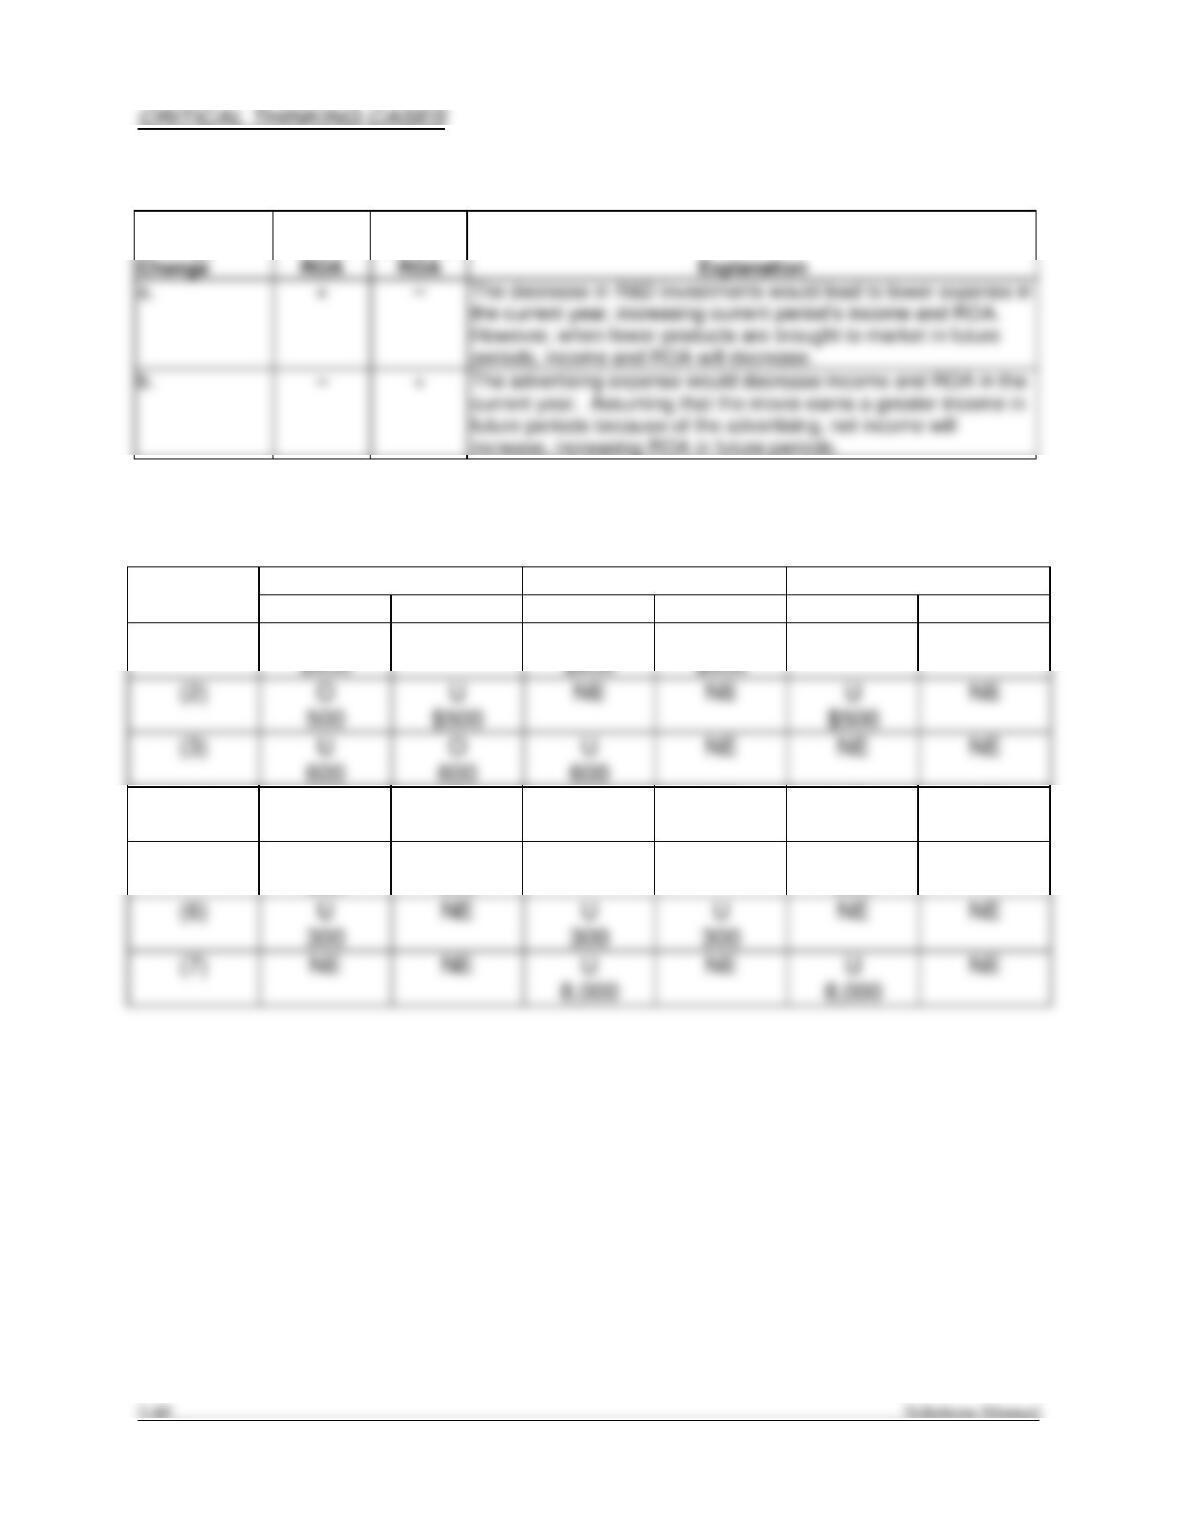
Strategy
Current
Period
Future
Periods’
CP5-6.
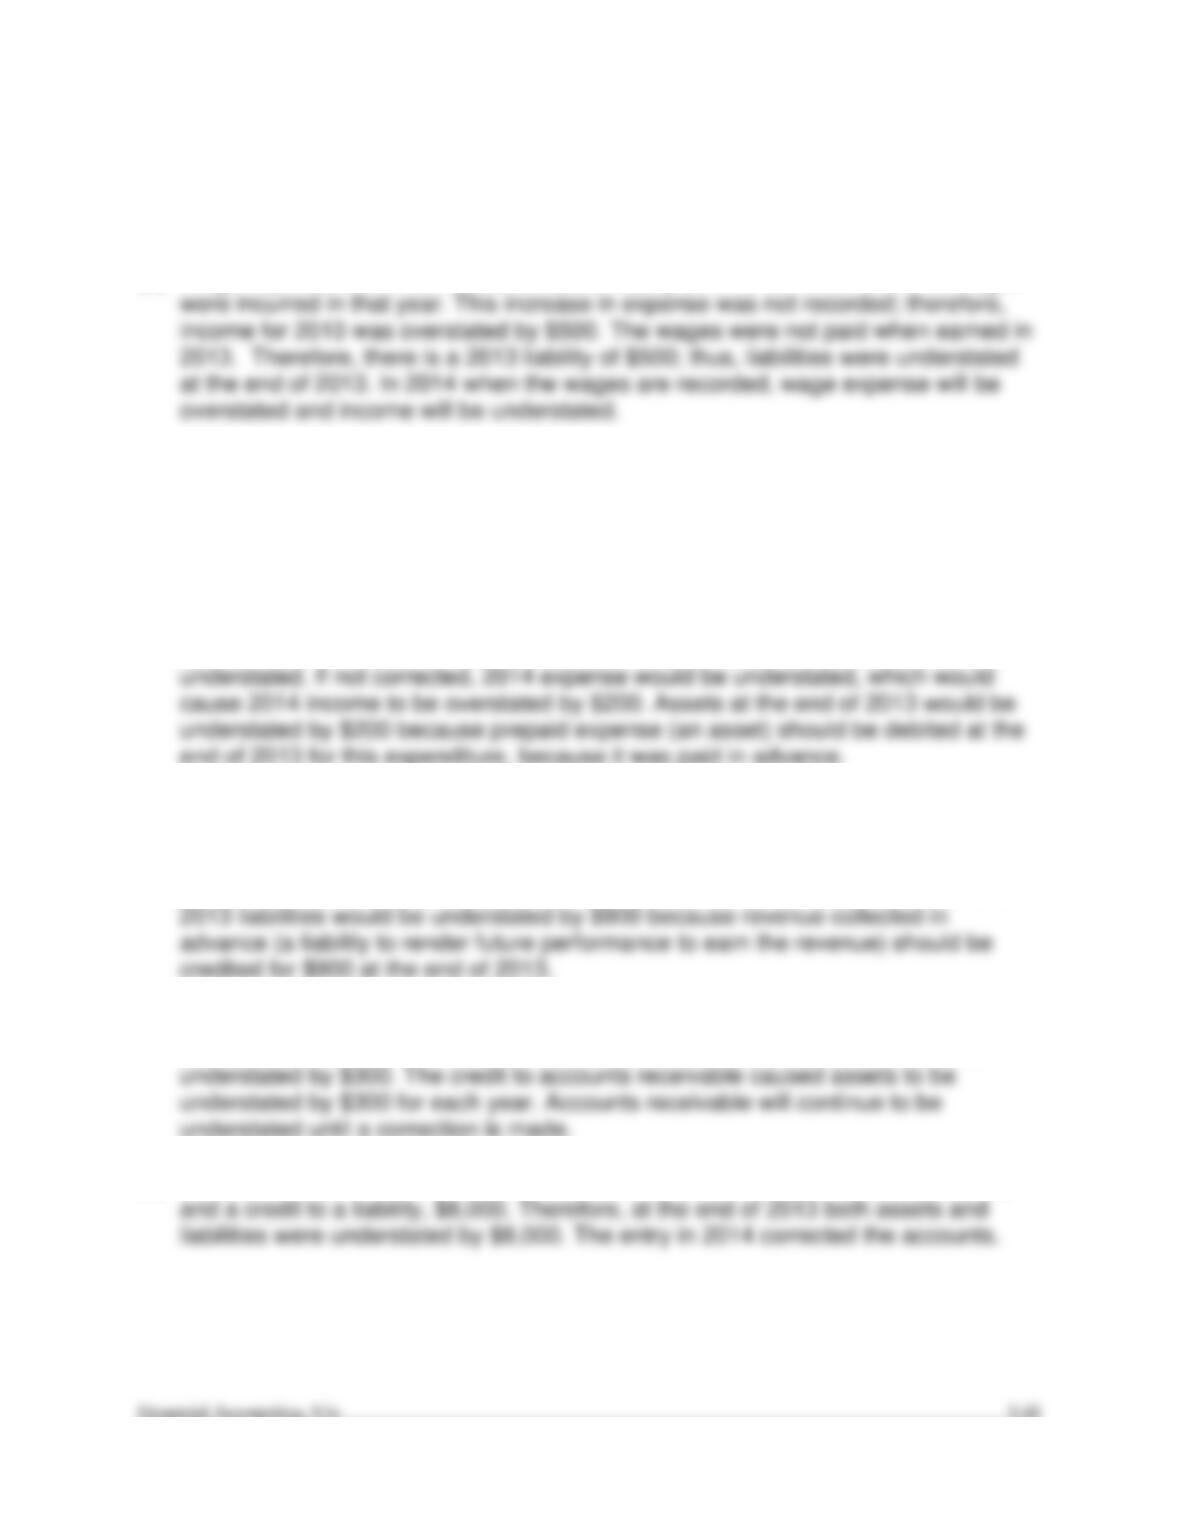
Net Income
Assets
Liabilities
Error
2013
2014
2013
2014
2013
2014
(1)
O
NE
O
O
NE
NE
$950
$950
$950
(2)
O
U
NE
NE
U
NE
500
$500
$500
(3)
U
O
U
NE
NE
NE
600
600
600
(4)
U
O
U
NE
NE
NE
200
200
200
(5)
O
U
NE
NE
U
NE
900
900
900
(6)
U
NE
U
U
NE
NE
300
300
300
(7)
NE
NE
U
NE
U
NE
CP5-6. (continued)
Explanation of analysis if not corrected:
(1) Given in problem (example).
(2) Wage expense should be increased (debited) by $500 in 2013 because the wages
(3) Revenues were understated by $600 in 2013, which caused 2013 income to be
understated by $600. Also accounts receivable was understated because the
amount of $600 will be collected in 2014; thus, assets were understated by $600 at
the end of 2013. Also, if not corrected, the $600 of revenue would be recorded in
2014, which would cause 2014 revenues, and hence income, to be overstated.
(4) The $200 expense should be recorded as 2014 expense. It was recorded in 2013;
therefore, 2013 expense was overstated which would cause 2013 income to be
(5) The $900 revenue should be recorded as revenue in 2014 because it was earned in
2014. Therefore, if not corrected, 2013 revenue and income would be overstated by
$900. Also, 2014 revenue and income would be understated by $900 because that
is the year that the $900 revenue was earned but was not recorded. At the end of
(6) This transaction should have been recorded as a credit to revenue of $300 instead
of a credit to accounts receivable. Therefore, revenue, and hence income, was
(7) This transaction should have been recorded in 2013 as a debit to Land (an asset)
CP5-7.
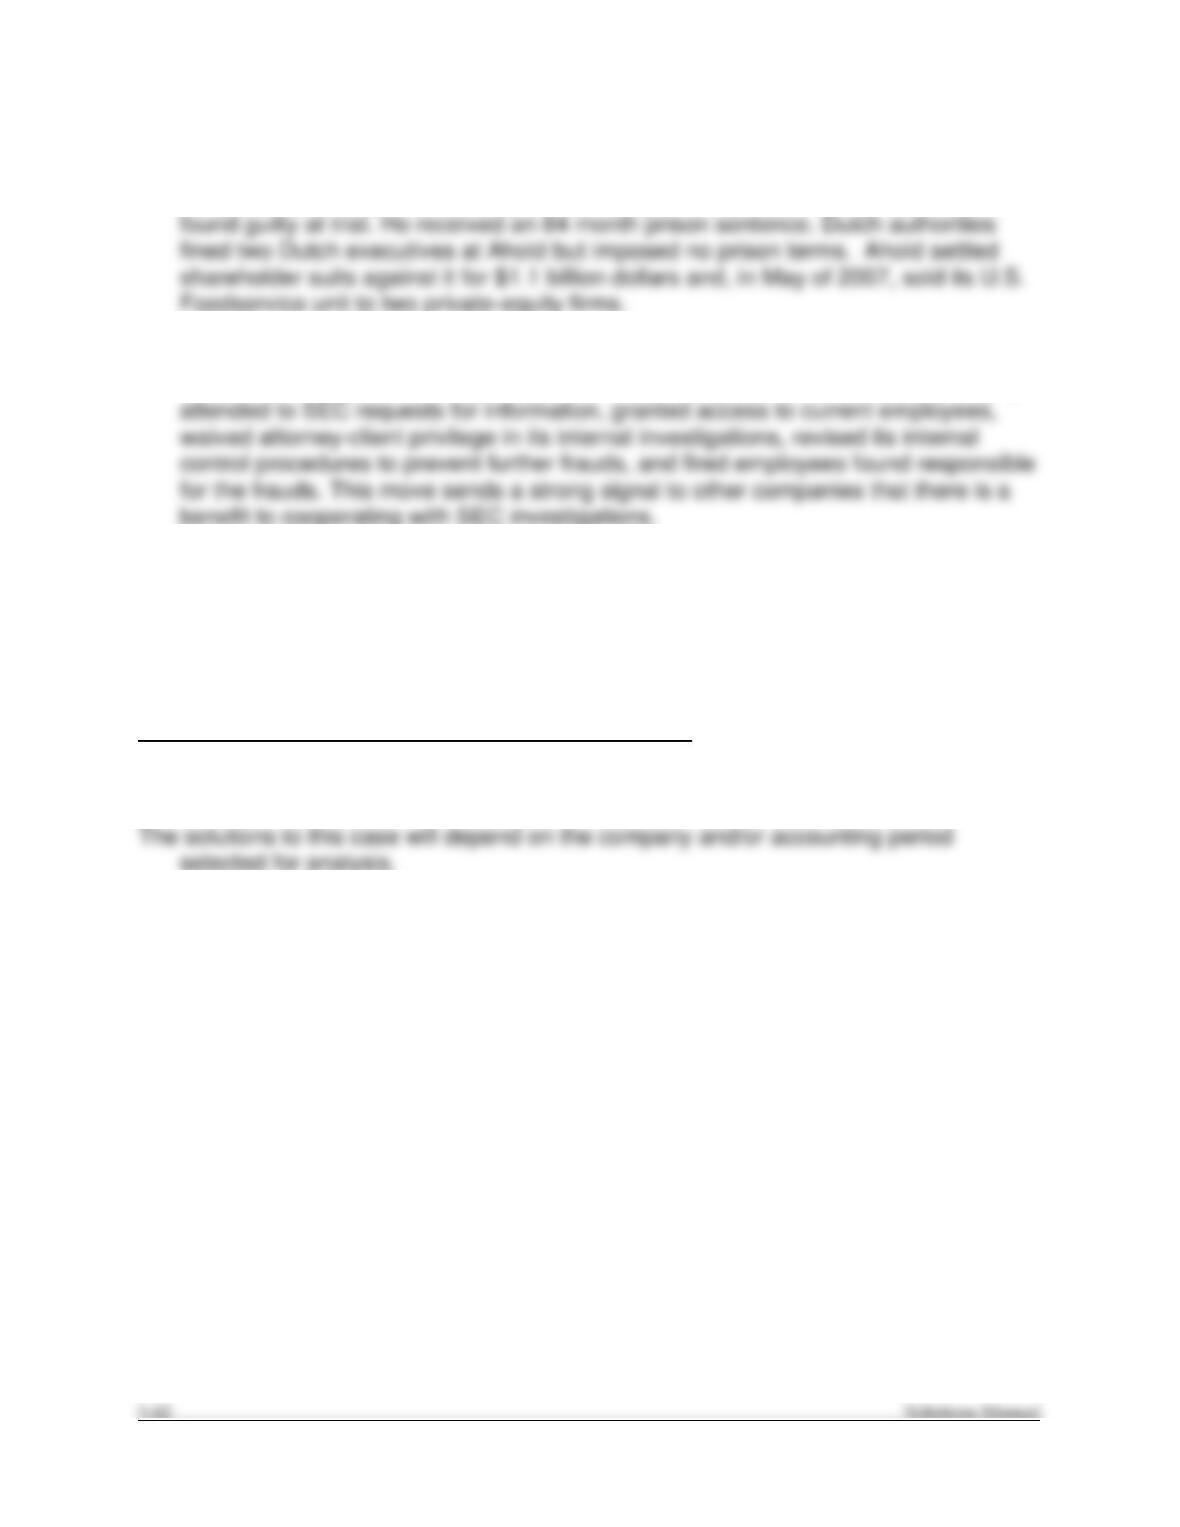
1. At the time this solution was prepared, three former top managers had pleaded
guilty to fraud charges and the chief marketing officer pleaded not guilty and was
2. In October 2004, the SEC chose not to impose a monetary fine on the company
because of its extensive cooperation with the investigation. The company promptly
3. Bonuses tied to performance measures such as accounting earnings tend to align
the managers’ interests with those of the shareholders. However, when companies
face a significant downturn, and bonuses will not be awarded, some dishonest
managers attempt to meet performance goals by falsifying accounting numbers.
FINANCIAL REPORTING AND ANALYSIS PROJECT
CP5-8.