Problem 5-25 (continued)
Contribution margin that must be realized on
outsourced units to earn target profit (a) ……
$15,000
Contribution margin per unit from supplier (b) .
$1.25
Unit sales needed from supplier to earn target
profit (a) ÷ (b) ……………………………………..
12,000
4b. This scenario is identical to requirement 4a except the target profit
changes from $14,000 to $16,500; hence, the required unit sales is
calculated as follows:
Fixed expenses plus target profit ($22,000 +
$15,000 +$16,500) ………………………………..
$53,500
Contribution margin from in-house production
(18,000 units × $2.00) …………………………...
36,000
Contribution margin that must be realized on
outsourced units to earn target profit …………
$17,500
Contribution margin that must be realized on
outsourced units to earn target profit (a) ……
Contribution margin per unit from supplier (b) .
$1.25
Unit sales needed from supplier to earn target
Problem 5-25 (continued)
4c. The net operating income is computed as follows:
Sales (35,000 units × $3.00)…………………
$105,000
Variable expenses (18,000 units × $1.00)
+ (17,000 units × $1.75) …………………..
47,750
Contribution margin …………………………...
57,250
Fixed expenses ($22,000 + $15,000) ……..
37,000
Net operating income ………………………….
$ 20,250
4d. The net operating income is computed as follows:
Sales (35,000 units × $3.00)…………………
49,370
Contribution margin …………………………...
55,630
Fixed expenses ($22,000 + $15,000) ……..
37,000
Net operating income ………………………….
$ 18,630
5. The net operating income is computed as follows:
Sales (35,000 units × $3.00)…………………
$105,000
Variable expenses (35,000 units × $1.75) ..
61,250
Contribution margin …………………………...
43,750
Fixed expenses ($15,000 × 2)……………….
30,000
Net operating income ………………………….
$ 13,750
Problem 5-26 (60 minutes)
1.
Profit
= Unit CM × Q − Fixed expenses
$0
= ($30 − $18) × Q − $150,000
$0
= ($12) × Q − $150,000
$12Q
= $150,000
Q
= $150,000 ÷ $12
Q
= 12,500 pairs
12,500 pairs × $30 per pair = $375,000 in sales
2. See the graph on the following page.
3. The simplest approach is:
Break-even sales …………………..
12,500 pairs
Actual sales ………………………….
12,000 pairs
Sales short of break-even ………..
500 pairs
500 pairs × $12 contribution margin per pair = $6,000 loss
Alternative solution:
Sales (12,000 pairs × $30.00 per pair) …..
Contribution margin …………………………..
Fixed expenses …………………………………
Net operating loss ……………………………..
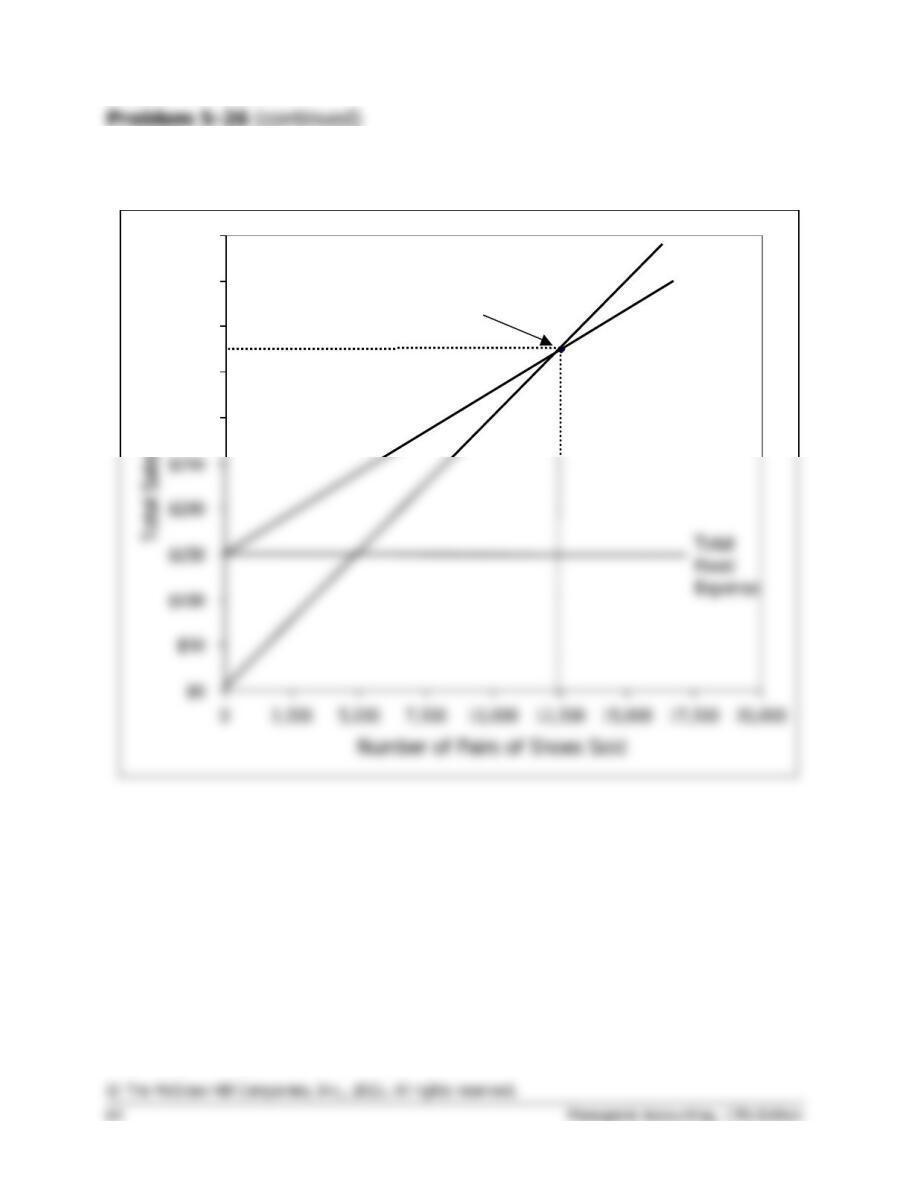
2. Cost-volume-profit graph:
$300
$350
$400
$450
$500
Break-even point:
12,500 pairs of shoes or
$375,000 total sales
Total Sales
Total
Expense
Problem 5-26 (continued)
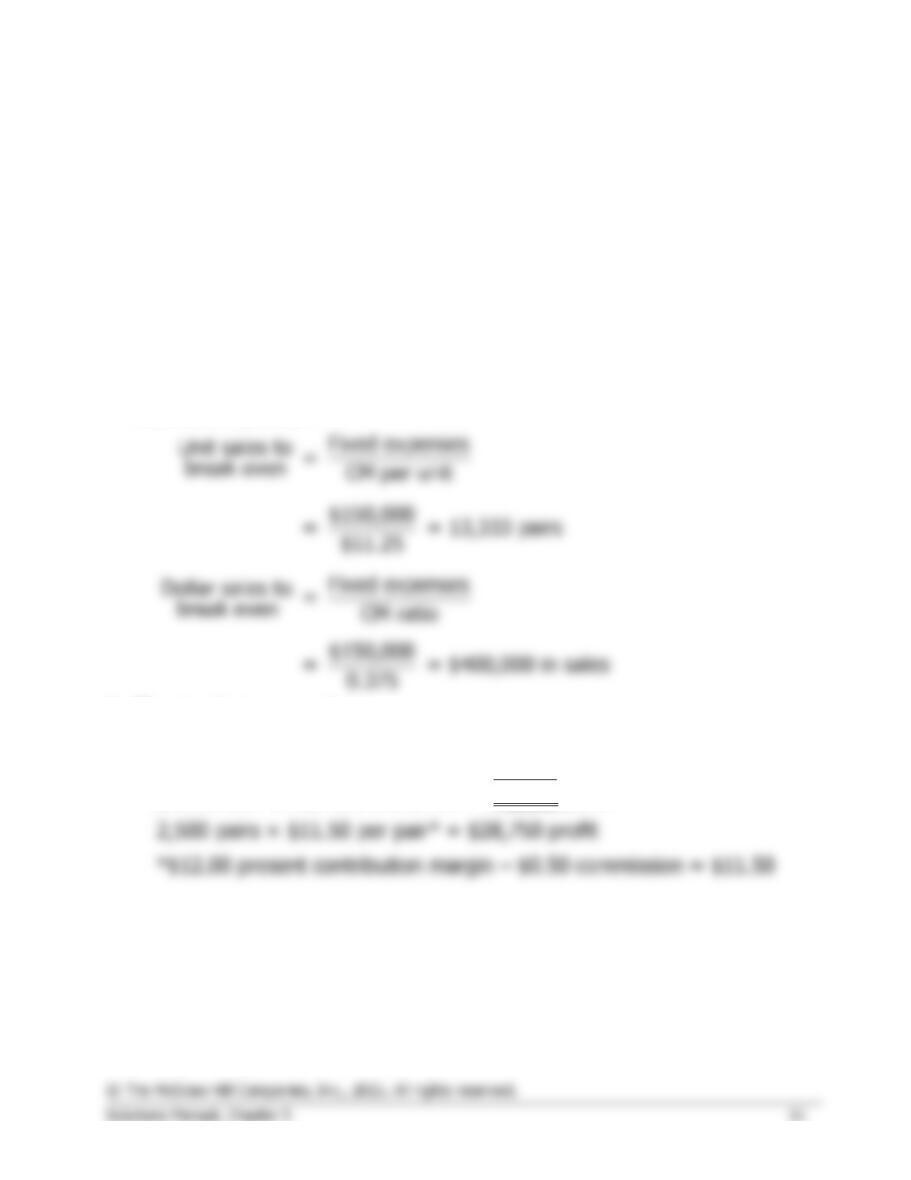
4. The variable expenses will now be $18.75 per pair, and the contribution
margin will be $11.25 per pair.
Profit
= Unit CM × Q − Fixed expenses
$0
= ($30.00 − $18.75) × Q − $150,000
$0
= ($11.25) × Q − $150,000
$11.25Q
= $150,000
Q
= $150,000 ÷ $11.25
Q
= 13,333 pairs (rounded)
13,333 pairs × $30.00 per pair = $400,000 in sales
Alternative solution:
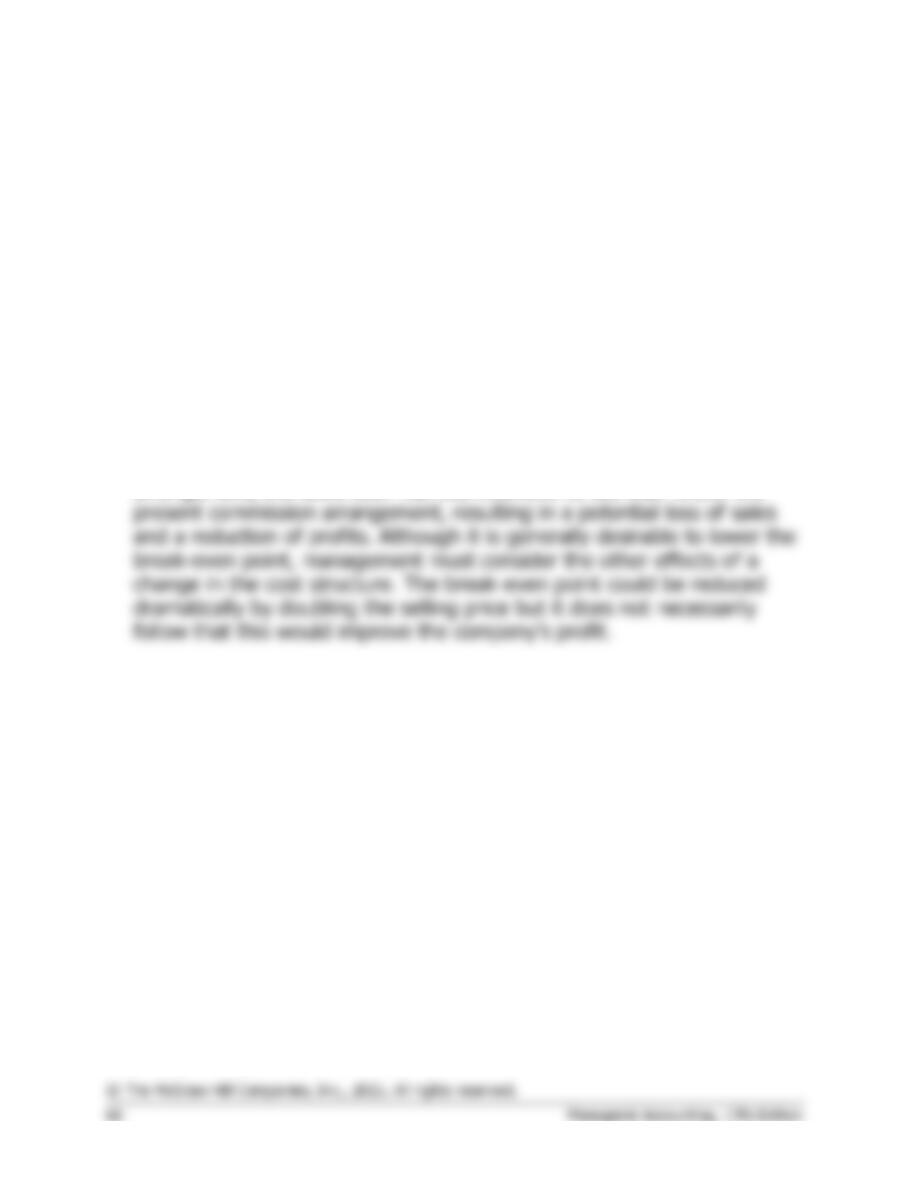
5. The simplest approach is:
Actual sales …………………………..
15,000 pairs
Break-even sales…………………….
12,500 pairs
Excess over break-even sales ……
2,500 pairs
2,500 pairs × $11.50 per pair* = $28,750 profit
*$12.00 present contribution margin – $0.50 commission = $11.50
Problem 5-26 (continued)
6. The new variable expenses will be $13.50 per pair.
Profit
= Unit CM × Q − Fixed expenses
$0
= ($30.00 − $13.50) × Q – ($150,000 + $31,500)
$0
= ($16.50) × Q − $181,500
$16.50Q
= $181,500
Q
= $181,500 ÷ $16.50
Q
= 11,000 pairs
11,000 pairs × $30.00 per pair = $330,000 in sales
Although the change will lower the break-even point from 12,500 pairs
to 11,000 pairs, the company must consider whether this reduction in
the break-even point is more than offset by the possible loss in sales
arising from having the sales staff on a salaried basis. Under a salary
Problem 5-27 (45 minutes)
1.
a.
Hawaiian
Fantasy
(20,000 units)
Tahitian
Joy
(5,000 units)
Total
Amount
%
Amount
%
Amount
%
Sales ……………………..
$300,000
100%
$500,000
100%
$800,000
100%
Variable expenses …….
180,000
60%
100,000
20%
280,000
35%
Contribution margin ….
$120,000
40%
$400,000
80%
520,000
65%
Fixed expenses ………..
475,800
Net operating income ..
$ 44,200
b.
Fixed expenses $475,800
Dollar sales to = = = $732,000
break even CM ratio 0.65
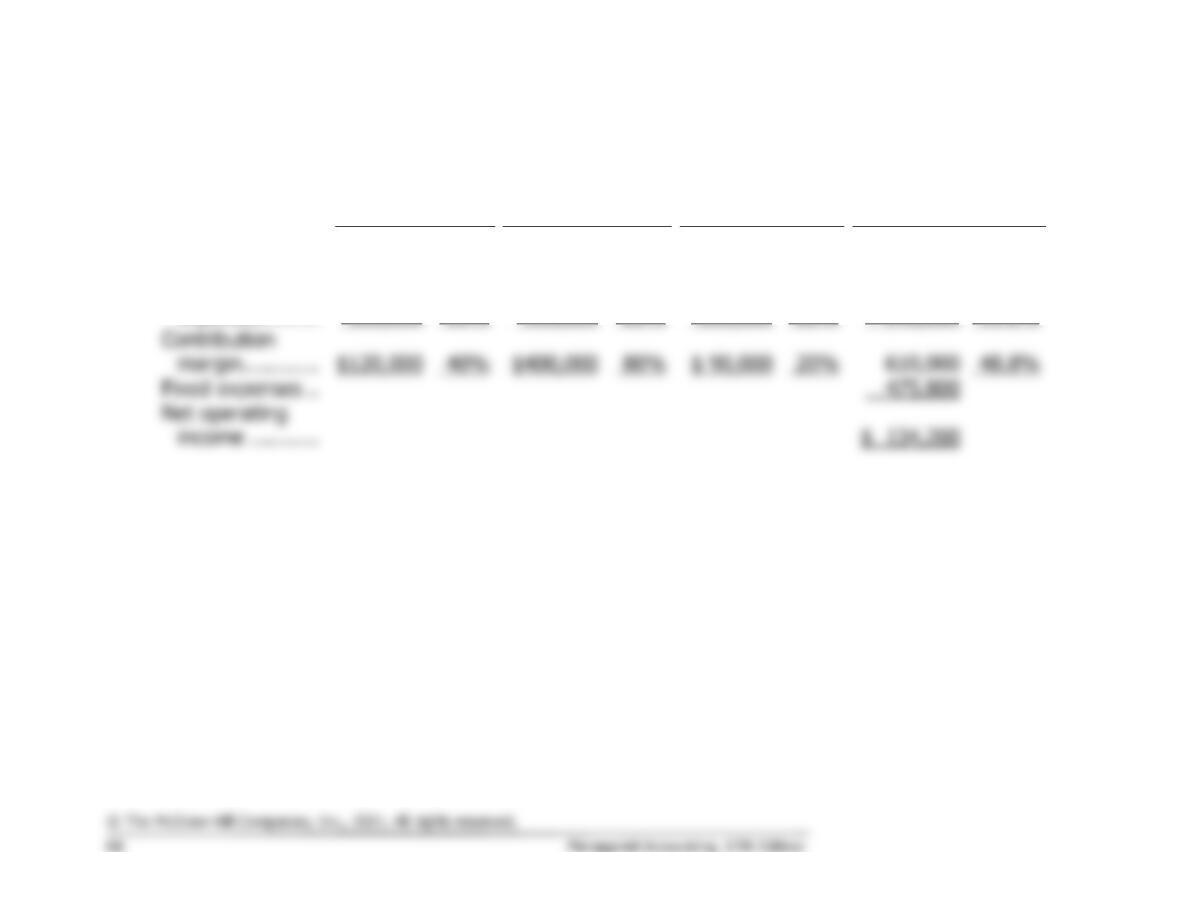
Margin of safety = Actual sales – Break-even sales
= $800,000 – $732,000 = $68,000
Problem 5-27 (continued)
2.
a.
Hawaiian
Fantasy
(20,000 units)
Tahitian
Joy
(5,000 units)
Samoan
Delight
(10,000 units)
Total
Amount
%
Amount
%
Amount
%
Amount
%
Sales ……………..
$300,000
100%
$500,000
100%
$450,000
100%
$1,250,000
100.0%
Contribution
$120,000
$400,000
$ 90,000
48.8%
Fixed expenses ..
Net operating
Variable
Problem 5-27 (continued)
b.
Fixed expenses $475,800
Dollar sales to = = = $975,000
break even CM ratio 0.488
Margin of safety = Actual sales – Break-even sales
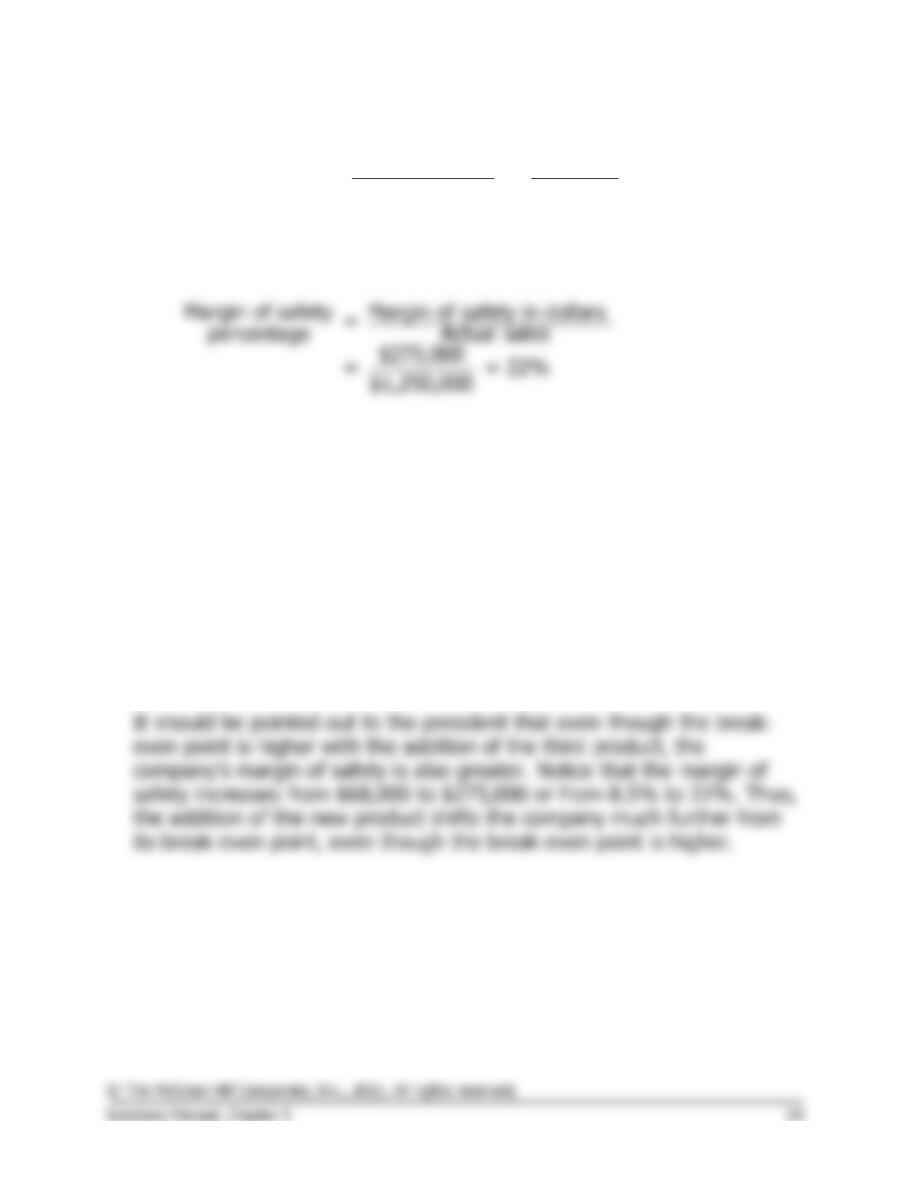
= $1,250,000 – $975,000 = $275,000
3. The reason for the increase in the break-even point can be traced to the
decrease in the company’s overall contribution margin ratio when the
third product is added. Note from the income statements above that this
ratio drops from 65% to 48.8% with the addition of the third product.
This product (the Samoan Delight) has a CM ratio of only 20%, which
causes the average contribution margin per dollar of sales to shift
downward.
This problem shows the somewhat tenuous nature of break-even
analysis when the company has more than one product. The analyst
must be very careful of his or her assumptions regarding sales mix,
including the addition (or deletion) of new products.
Problem 5-28 (60 minutes)
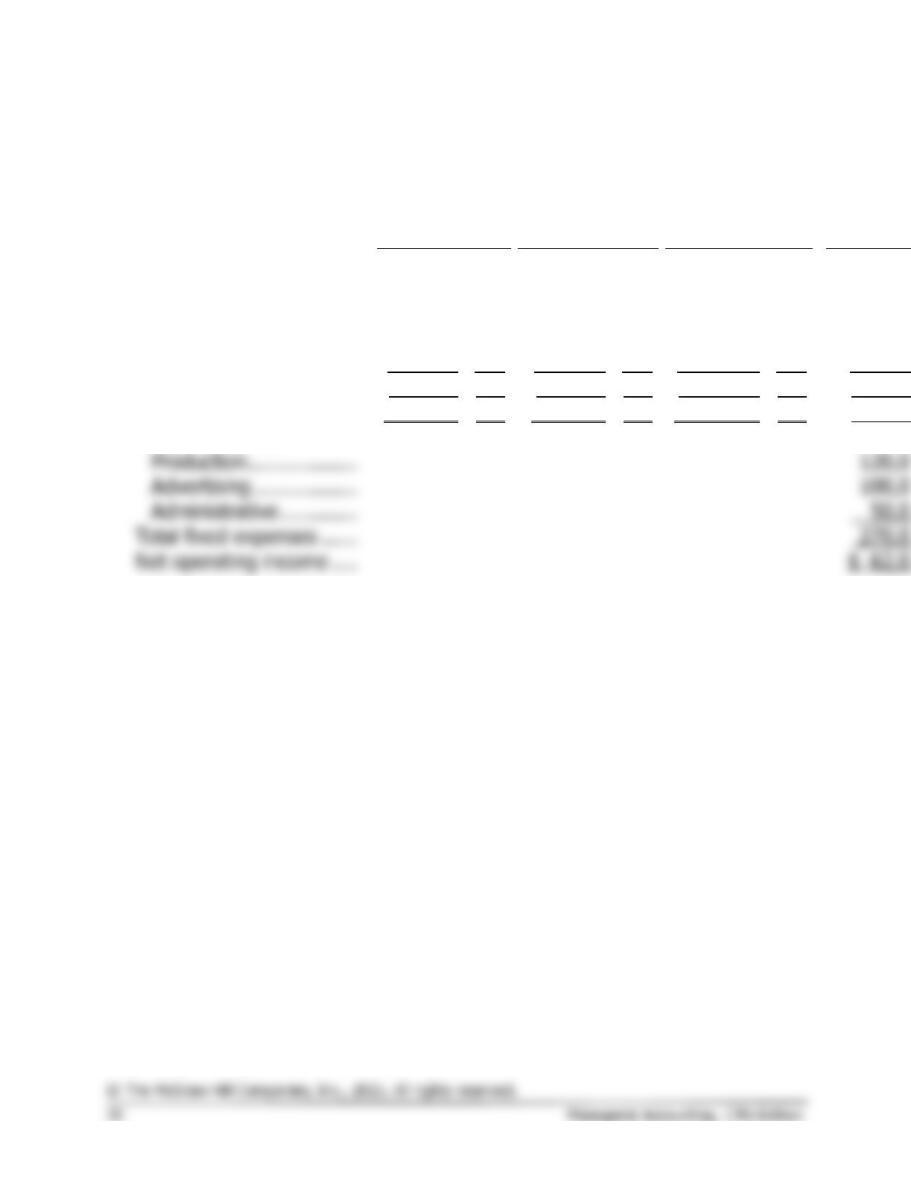
1. April’s Income Statement:
Standard
Deluxe
Pro
To
Amount
%
Amount
%
Amount
%
Amoun
Sales ……………………….
$80,000
100
$60,000
100
$450,000
100
$590,000
Variable expenses:
Production ………………
44,000
55
27,000
45
157,500
35
228,50
Selling ……………………
4,000
5
3,000
5
22,500
5
29,500
Total variable expenses ..
48,000
60
30,000
50
180,000
40
258,000
Contribution margin …….
$32,000
40
$30,000
50
$270,000
60
332,000
Fixed expenses:
Production ………………
Advertising ……………..
Total fixed expenses ……
Net operating income ….
Problem 5-28 (continued)
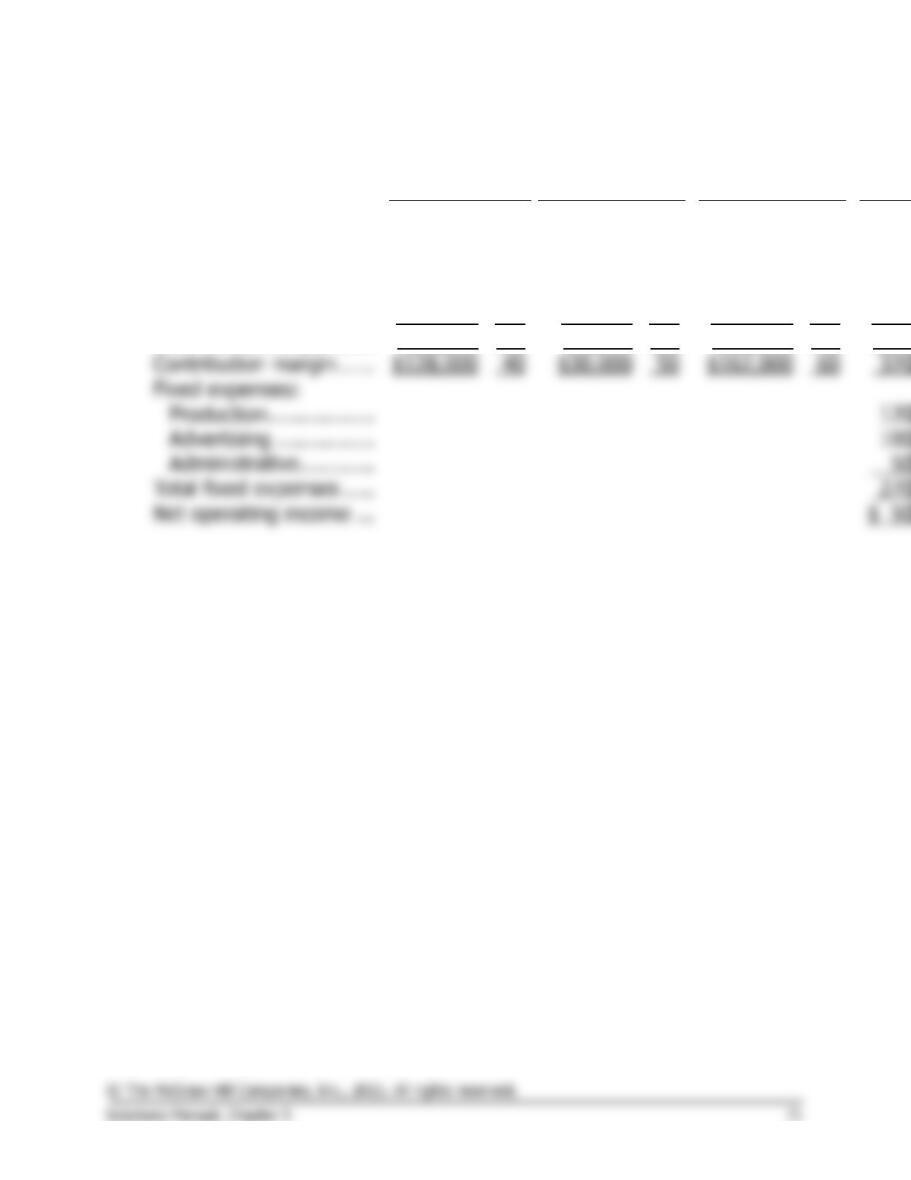
May’s Income Statement:
Standard
Deluxe
Pro
Amount
%
Amount
%
Amount
%
Amo
Sales ………………………
$320,000
100
$60,000
100
$270,000
100
$650,0
Variable expenses:
Production ……………..
176,000
55
27,000
45
94,500
35
297
Selling …………………..
16,000
5
3,000
5
13,500
5
32,5
Total variable expenses .
192,000
60
30,000
50
108,000
40
330
Fixed expenses:
Production ……………..
Advertising …………….
Administrative …………
Total fixed expenses …..
Net operating income …
Problem 5-28 (continued)
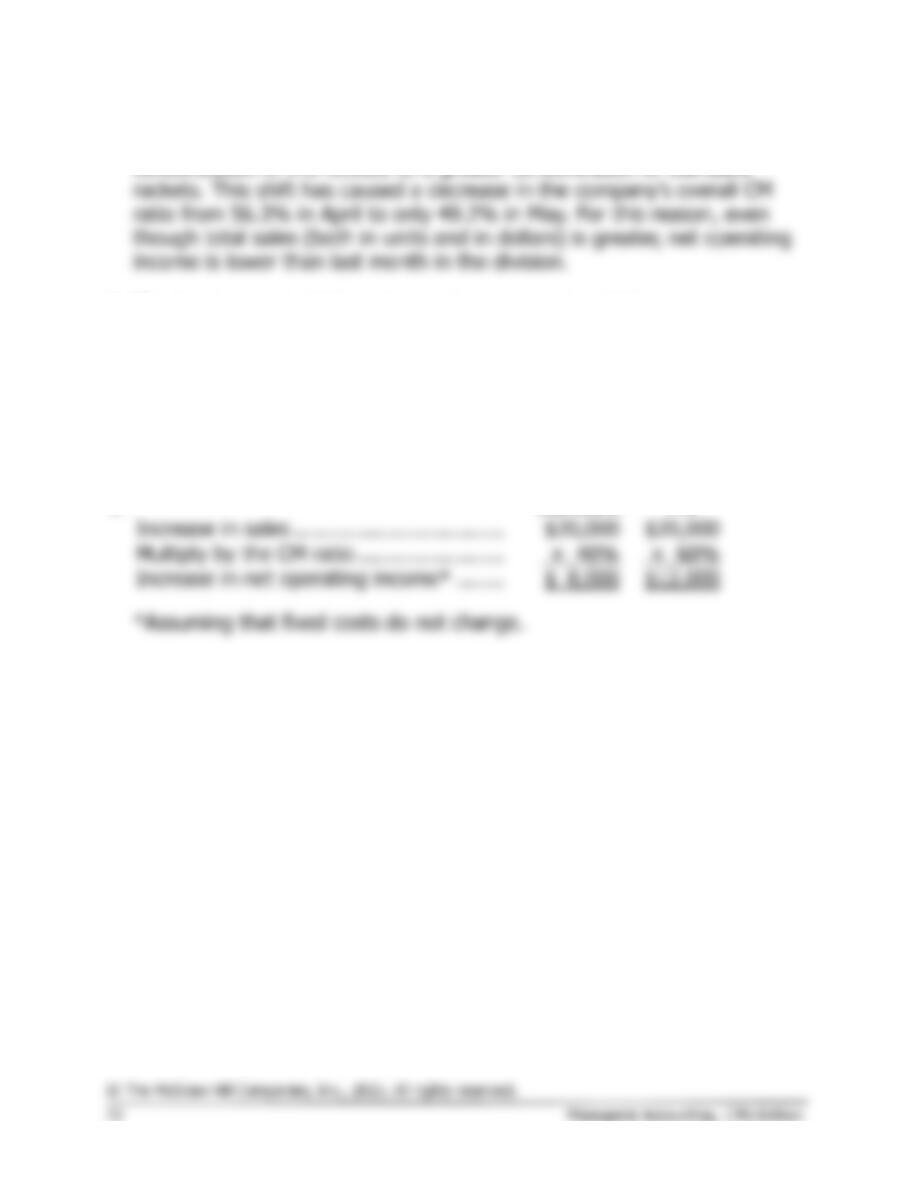
2. The sales mix has shifted over the last month from a greater
3. The break-even in dollar sales can be computed as follows:
4. May’s break-even point has gone up. The reason is that the division’s
overall CM ratio has declined for May as stated in (2) above. Unchanged
fixed expenses divided by a lower overall CM ratio would yield a higher
break-even point in sales dollars.
Problem 5-29 (60 minutes)
1. The income statements would be:
Present
Amount
Per Unit
%
Sales …………………….
$450,000
$30
100%
Variable expenses ……
315,000
21
70%
Contribution margin …
135,000
$ 9
30%
Fixed expenses ……….
90,000
Net operating income .
$ 45,000
Proposed
Amount
%
Sales …………………….
$450,000
Variable expenses* ….
180,000
Contribution margin …
270,000
Fixed expenses ……….
225,000
Net operating income .
$ 45,000
2. a. Degree of operating leverage:
Present:
Contribution margin
Degree of
=
operating leverage Net operating income
$135,000
= = 3
Contribution margin
Degree of
=
operating leverage Net operating income
$270,000
= = 6
Problem 5-29 (continued)
b. Dollar sales to break even:
Present:
Fixed expenses
Dollar sales to =
break even CM ratio
$90,000
= = $300,000
0.30
Proposed:
Fixed expenses
Dollar sales to =
break even CM ratio
$225,000
= = $375,000
0.60
c. Margin of safety:
Present:
Margin of safety = Actual sales – Break-even sales
= $450,000 – $300,000 = $150,000
Problem 5-29 (continued)
3. The major factor would be the sensitivity of the company’s operations to
cyclical movements in the economy. Because the new equipment will
increase the CM ratio, in years of strong economic activity, the company
will be better off with the new equipment. However, in economic
recession, the company will be worse off with the new equipment. The
fixed costs of the new equipment will cause losses to be deeper and
sustained more quickly than at present. Thus, management must decide
whether the potential for greater profits in good years is worth the risk
of deeper losses in bad years.
4. No information is given in the problem concerning the new variable
expenses or the new contribution margin ratio. Both of these items must
be determined before the new break-even point can be computed. The
computations are:
New variable expenses:
Problem 5-29 (continued)
The greatest risk is that the increases in sales and net operating income
predicted by the marketing manager will not happen and that sales will
remain at their present level. Note that the present level of sales is
$450,000, which is equal to the break-even level of sales under the new
marketing method. Thus, if the new marketing strategy is adopted and
sales remain unchanged, profits will drop from the current level of
$45,000 per month to zero.
It would be a good idea to compare the new marketing strategy to the
current situation more directly. What level of sales would be needed
under the new method to generate at least the $45,000 in profits the
company is currently earning each month? The computations are:
Problem 5-30 (60 minutes)
1.
Profit
= Unit CM × Q − Fixed expenses
$0
= ($40 − $16) × Q − $60,000
$0
= ($24) × Q − $60,000
$24Q
= $60,000
Q
= $60,000 ÷ $24
Q
= 2,500 pairs, or at $40 per pair, $100,000 in sales
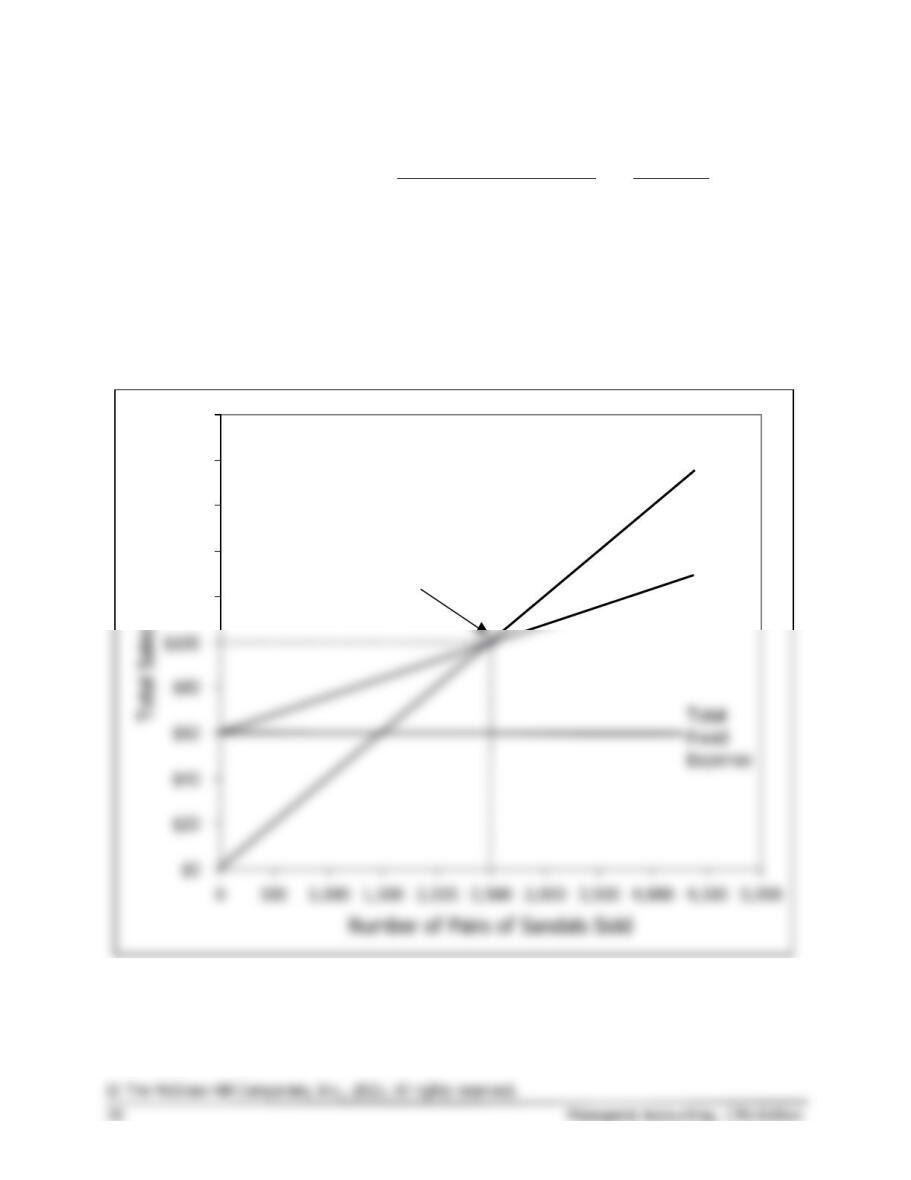
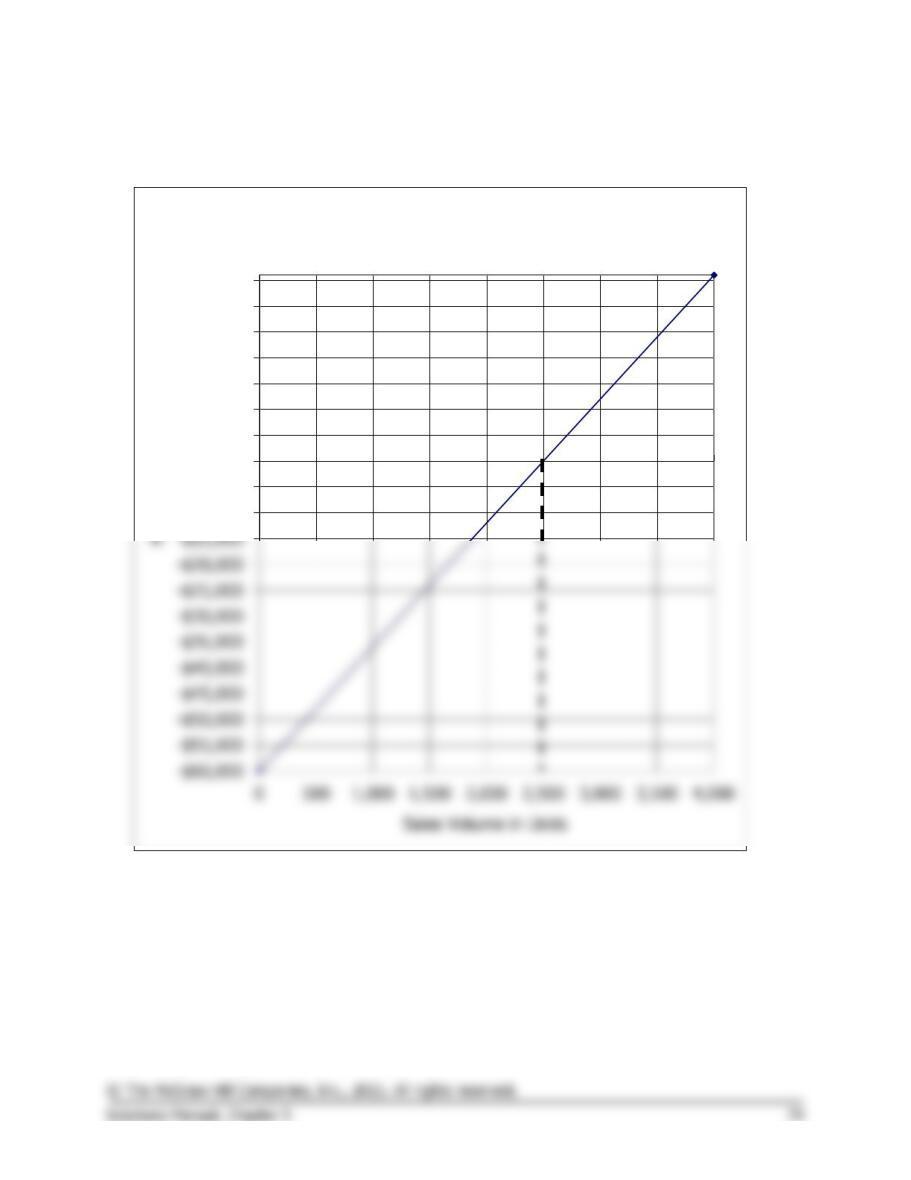
2. See the graphs at the end of this solution.
3.
Profit
= Unit CM × Q − Fixed expenses
$18,000
= $24 × Q − $60,000
$24Q
= $18,000 + $60,000
Q
= $78,000 ÷ $24
Q
= 3,250 pairs
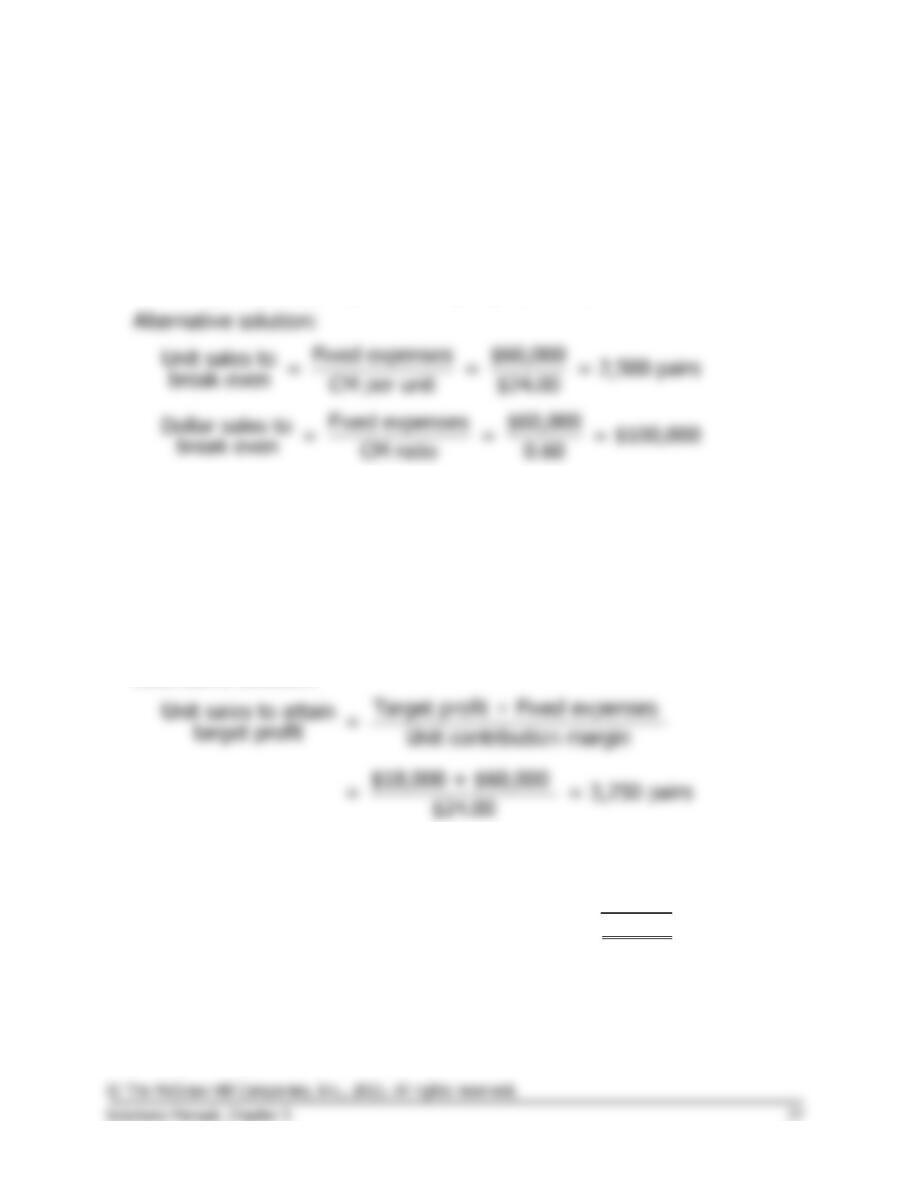
Alternative solution:
4.
Incremental contribution margin:
$25,000 increased sales × 60% CM ratio …..
$15,000
Incremental fixed salary cost …………………….
8,000
Increased net income ………………………………
$ 7,000
Yes, the position should be converted to a full-time basis.
Problem 5-30 (continued)
5.
a.
Contribution margin $72,000
Degree of = = = 6
operating leverage Net operating income $12,000
b. 6 × 50% sales increase = 300%
increase
in net operating income.
Thus, net operating income next year would be: $12,000 + ($12,000
× 300%) = $48,000.
2. Cost-volume-profit graph:
$120
$140
$160
$180
$200
Break-even point:
2,500 pairs of sandals or
$100,000 total sales
Total Sales
Total
Expense
Problem 5-30 (continued)
Profit graph:
Break-even point:
2,500 sandals
-$10,000
-$5,000
$0
$5,000
$10,000
$15,000
$20,000
$25,000
$30,000
$35,000
Profit Graph
Problem 5-31 (30 minutes)
1.
(1)
Dollars
(2)
Volume of output, expressed in units, % of capacity, sales,
or some other measure
(3)
Total expense line
(4)
Variable expense area
(5)
Fixed expense area
(6)
Break-even point
(7)
Loss area
(8)
Profit area
(9)
Sales line