Statement of Cash Flows Page 150 Chapter 5
ACTIVITY 49 ANALYSIS: RATIOS
Purpose: • Understand the information provided by cash flow ratios.
Cash Flow Ratios measure a company’s ability to generate cash.
Free Cash Flow reflects the amount of cash available for business activities after allowances for
investing and financing activity requirements to maintain productive capacity at current levels.
Adequate free cash flow allows for growth and financial flexibility
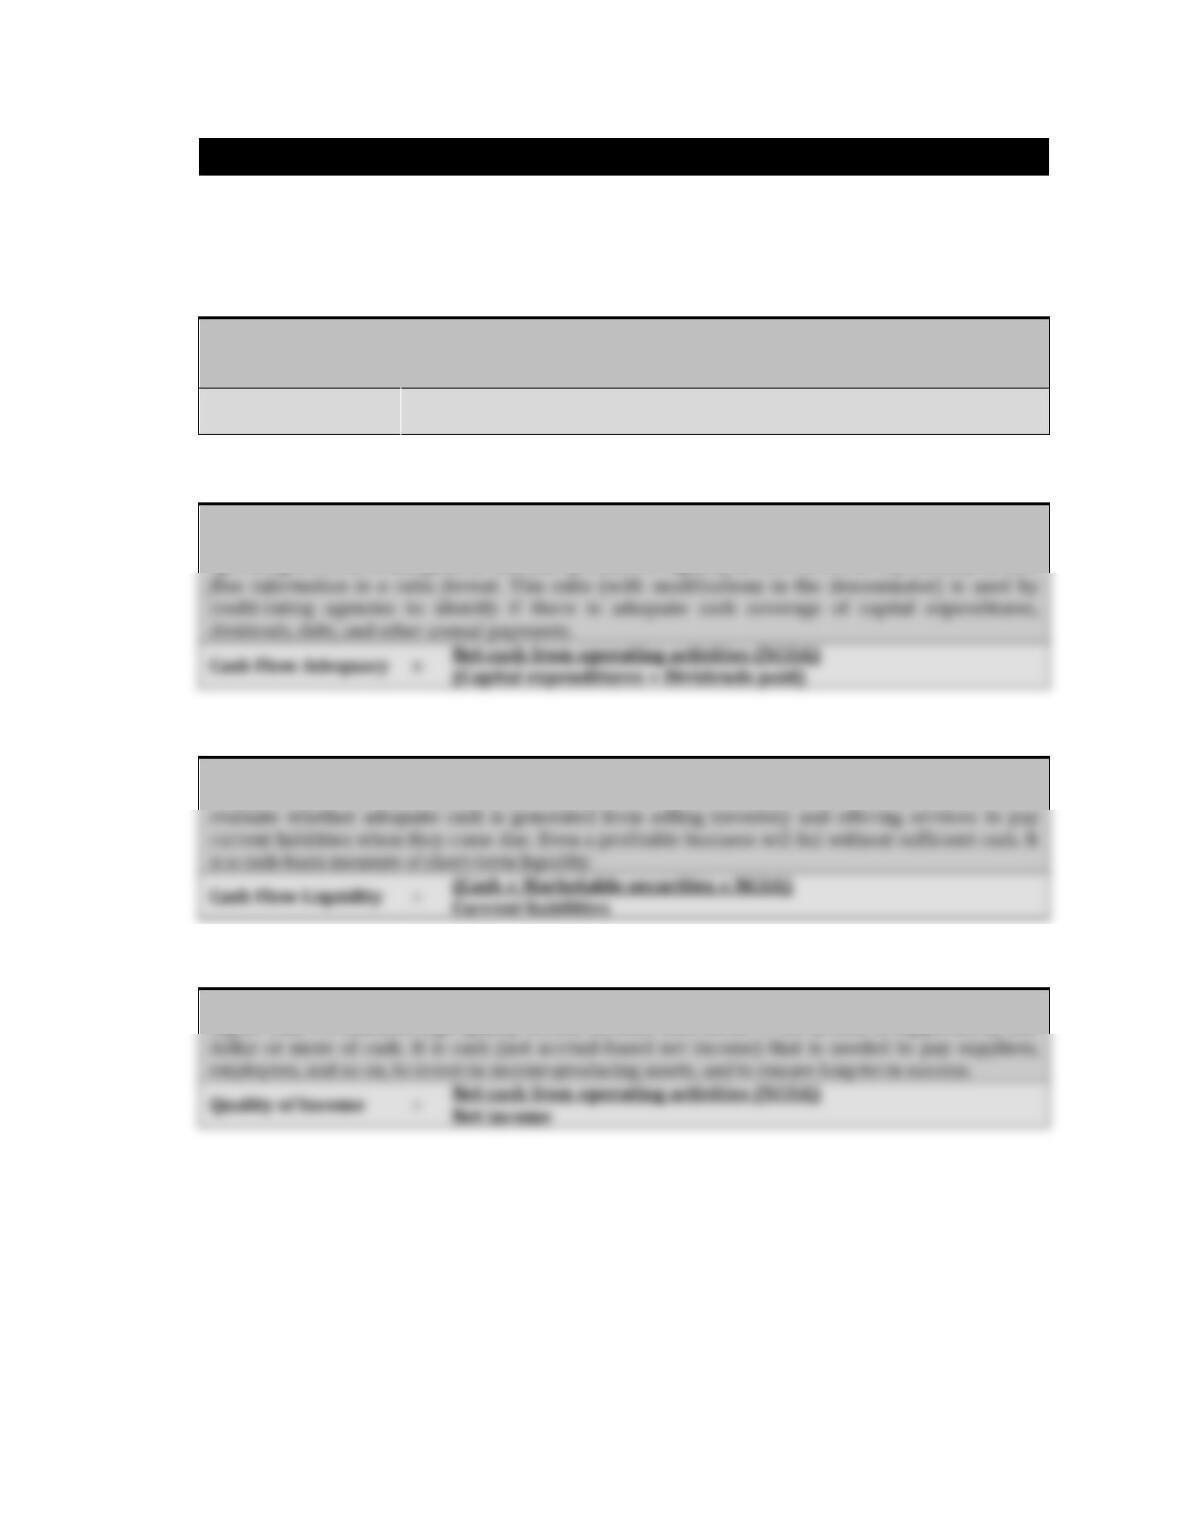
Free Cash Flow
=
NCOA – (Capital expenditures + Dividends paid)
The Cash-Flow-Adequacy ratio evaluates whether cash flow from operating activities is sufficient to
cover annual payment requirements. The above ratio is defined to evaluate whether net cash from
operating activities is adequate to maintain productive capacity at current levels. It presents free cash
evaluate whether adequate cash is generated from selling inventory and offering services to pay
is a cash-basis measure of short-term liquidity.
The Cash-Flow-Liquidity ratio compares cash resources to current liabilities. This ratio uses cash
and marketable securities (truly liquid current assets) and net cash from operating activities to
employees, and so on, to invest in income-producing assets, and to ensure long-term success.
The Quality-of-Income ratio compares cash flows from operating activities to net income. A ratio
higher than 1.0 indicates high-quality income because each dollar of net income is supported by one
credit-rating agencies to identify if there is adequate cash coverage of capital expenditures,
dividends, debt, and other annual payments.
Statement of Cash Flows Page 151 Chapter 5
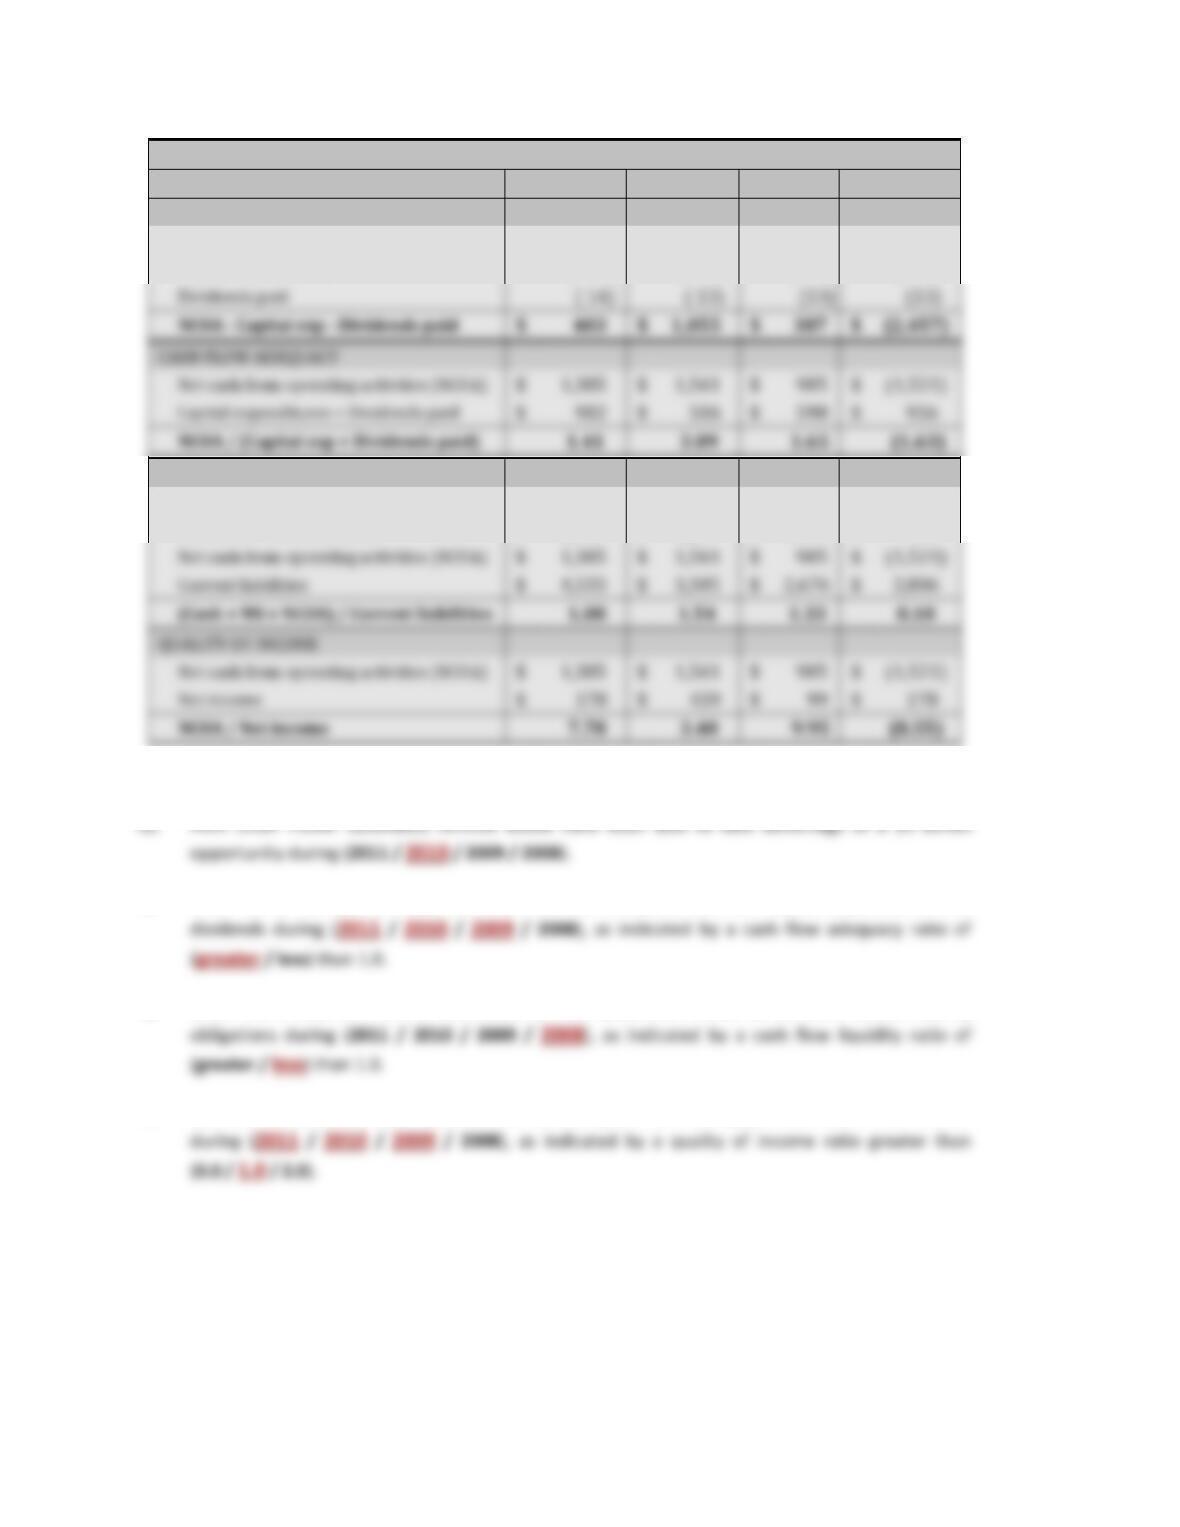
Southwest Airlines (LUV)—RATIOS
($ in millions)
2011
2010
2009
2008
FREE CASH FLOW
Net cash from operating activities (NCOA)
$
1,385
$
1,561
$
985
$
(1,521)
Capital expenditures
(968)
(493)
(585)
(923)
CASH FLOW LIQUIDITY RATIO
Cash and cash equivalents
$
829
$
1,261
$
1,114
$
1,368
Marketable securities (MS)
$
2,315
$
2,277
$
1,479
$
435
Net cash from operating activities (NCOA)
$
1,385
$
1,561
$
985
$
Current liabilities
$
4,533
$
3,305
$
2,676
$
2,806
QUALITY OF INCOME
Net cash from operating activities (NCOA)
$
$
1,561
$
985
$
Net income
$
178
$
$
$
178
Refer to the information above to answer the following questions.
Q2 CASH FLOW ADEQUACY: Southwest Airlines had adequate cash for capital expenditures and
Q3 CASH FLOW LIQUIDITY RATIO: Southwest Airlines lacked cash resources to cover current liability
Q4 QUALITY OF INCOME: Southwest Airlines had adequate cash to support each $1 of net income
Dividends paid
( 14)
CASH FLOW ADEQUACY
Net cash from operating activities (NCOA)
$
1,385
$
1,561
$
985
$
Capital expenditures + Dividends paid
$
982
$
$
598
$
936
Statement of Cash Flows Page 152 Chapter 5
Why? Support your response with at least two relevant observations.
Statement of Cash Flows Page 153 Chapter 5
ACTIVITY 50 ANALYSIS: TREND
Purpose: • Prepare a trend analysis for the statement of cash flows and
understand the information provided.
A trend analysis compares amounts of a more recent year to a base year. The base year is the earliest
year being studied. The analysis measures the percentage of change from the base year.
Refer to the Statement of Cash Flows and the trend analysis below to answer the following questions.
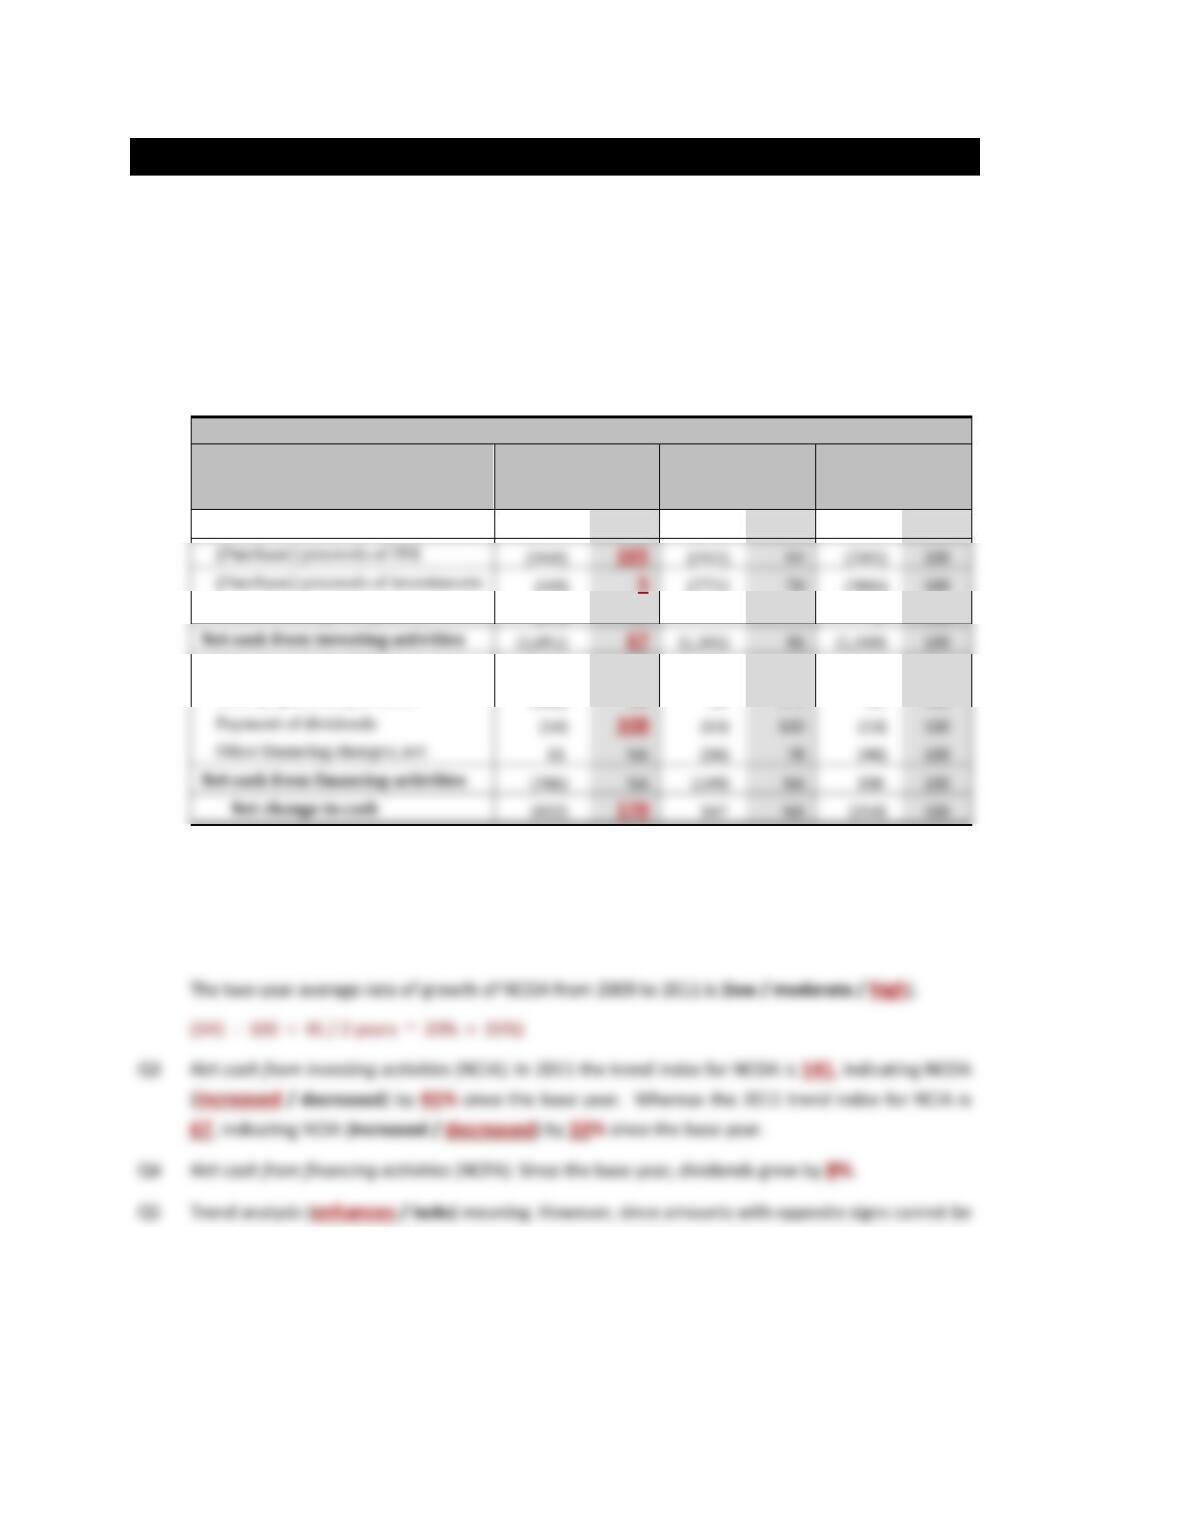
Q1 Complete the trend analysis for 2011. Divide each amount by the amount for the base year. Record
the resulting trend index in the shaded area. Use 2009 as the base year.
Southwest Airlines (LUV) STATEMENT OF CASH FLOWS Trend Analysis
2011
2010
2009
($ in millions)
$
Trend
Index
$
Trend
Index
$
Trend
Index
Net cash from operating activities
1,385
141
1,561
158
985
100
(48)
(772)
78
(986)
100
Other investing changes, net
(35)
NA
–
–
2
100
Net cash from investing activities
100
Issue (payment) of debt
(577)
NA
(155)
NA
369
100
Issue (repurchase) of stock
(186)
NA
55
275
20
100
Payment of dividends
100
100
Other financing changes, net
NA
100
Net cash from financing activities
(766)
NA
NA
100
Net change in cash
(432)
NA
100
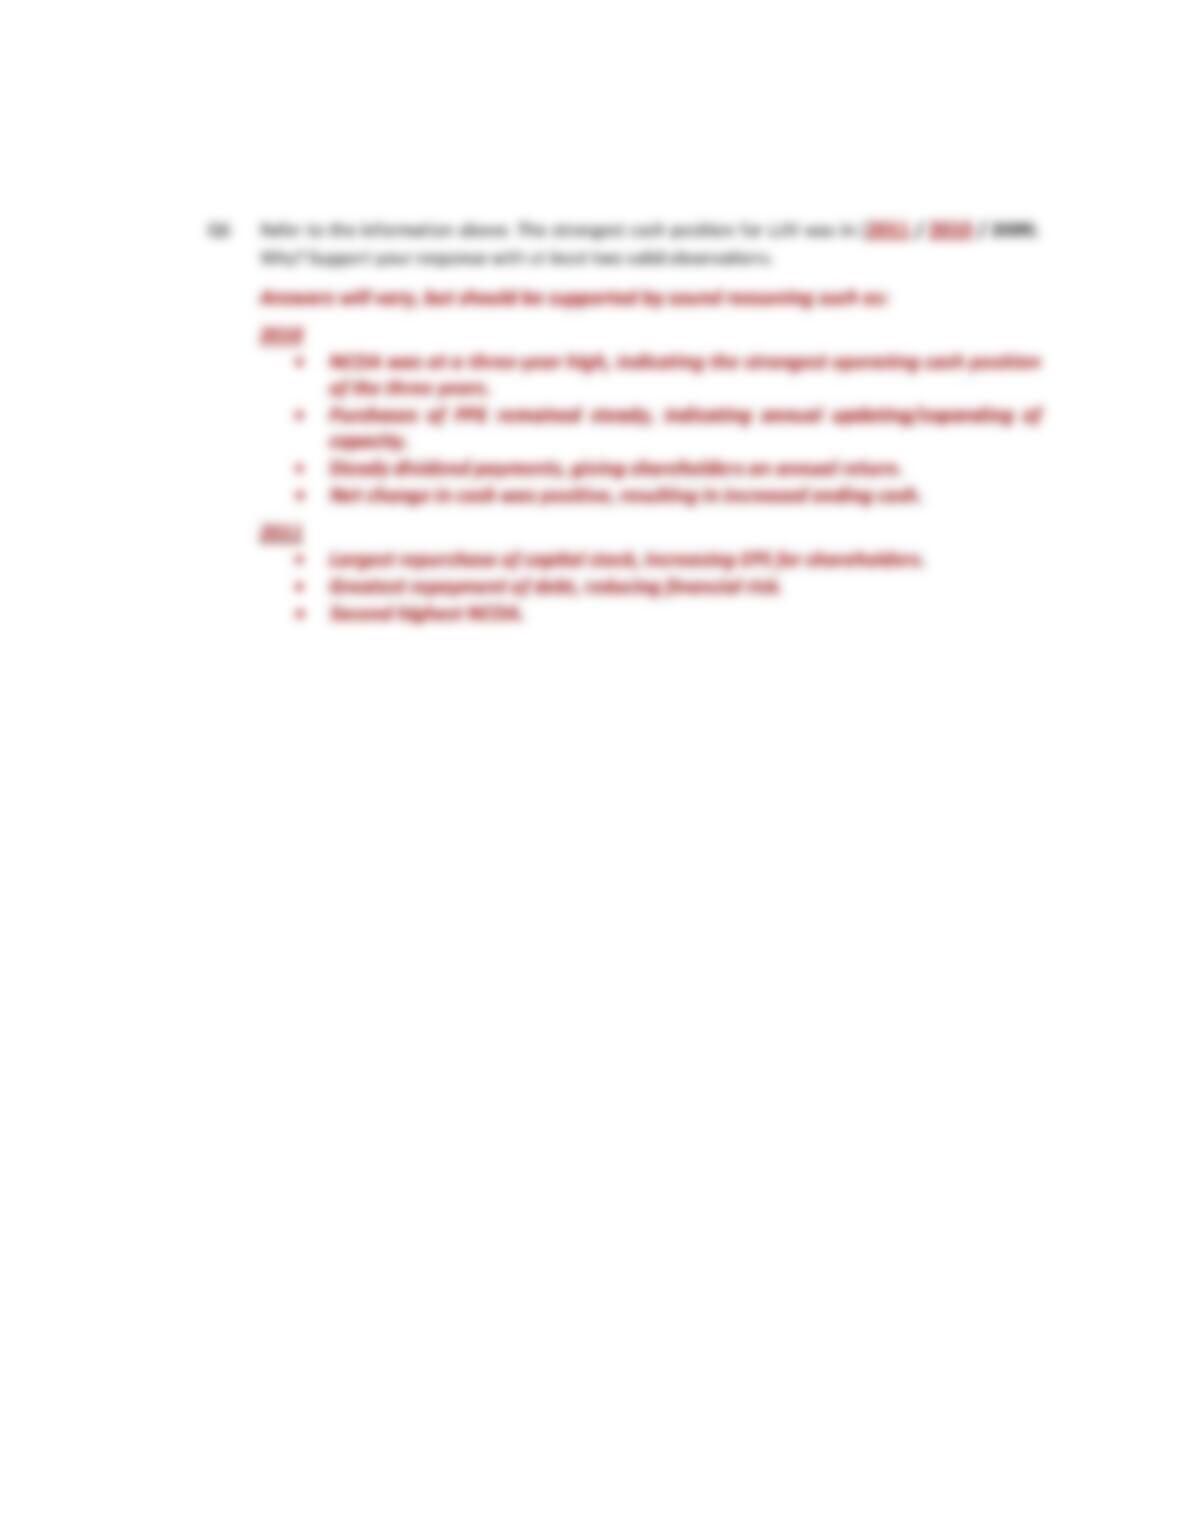
Q2 Net cash from operating activities (NCOA): The annual rate of growth in NCOA can be compared
among companies.
Assume less than 5% is low, 5 to 15% is moderate, and more than 15% is high.
accurately compared and division by zero is not applicable, sometimes a trend analysis of the
statement of cash flows is less meaningful than for the other financial statements.
(Purchase) proceeds of PPE
(493)
84
(585)
100
(Purchase) proceeds of investments
Statement of Cash Flows Page 154 Chapter 5
Statement of Cash Flows Page 155 Chapter 5
ACTIVITY 51 ANALYSIS: COMMON–SIZE STATEMENTS
Purpose: • Prepare common-size statements using the statement of cash flow and understand
the information provided.
The Common-Size Statement of Cash Flows Statement compares all amounts to Cash from Operating
Activities (NCOA) of that same year. The analysis measures each item as a percentage of NCOA.
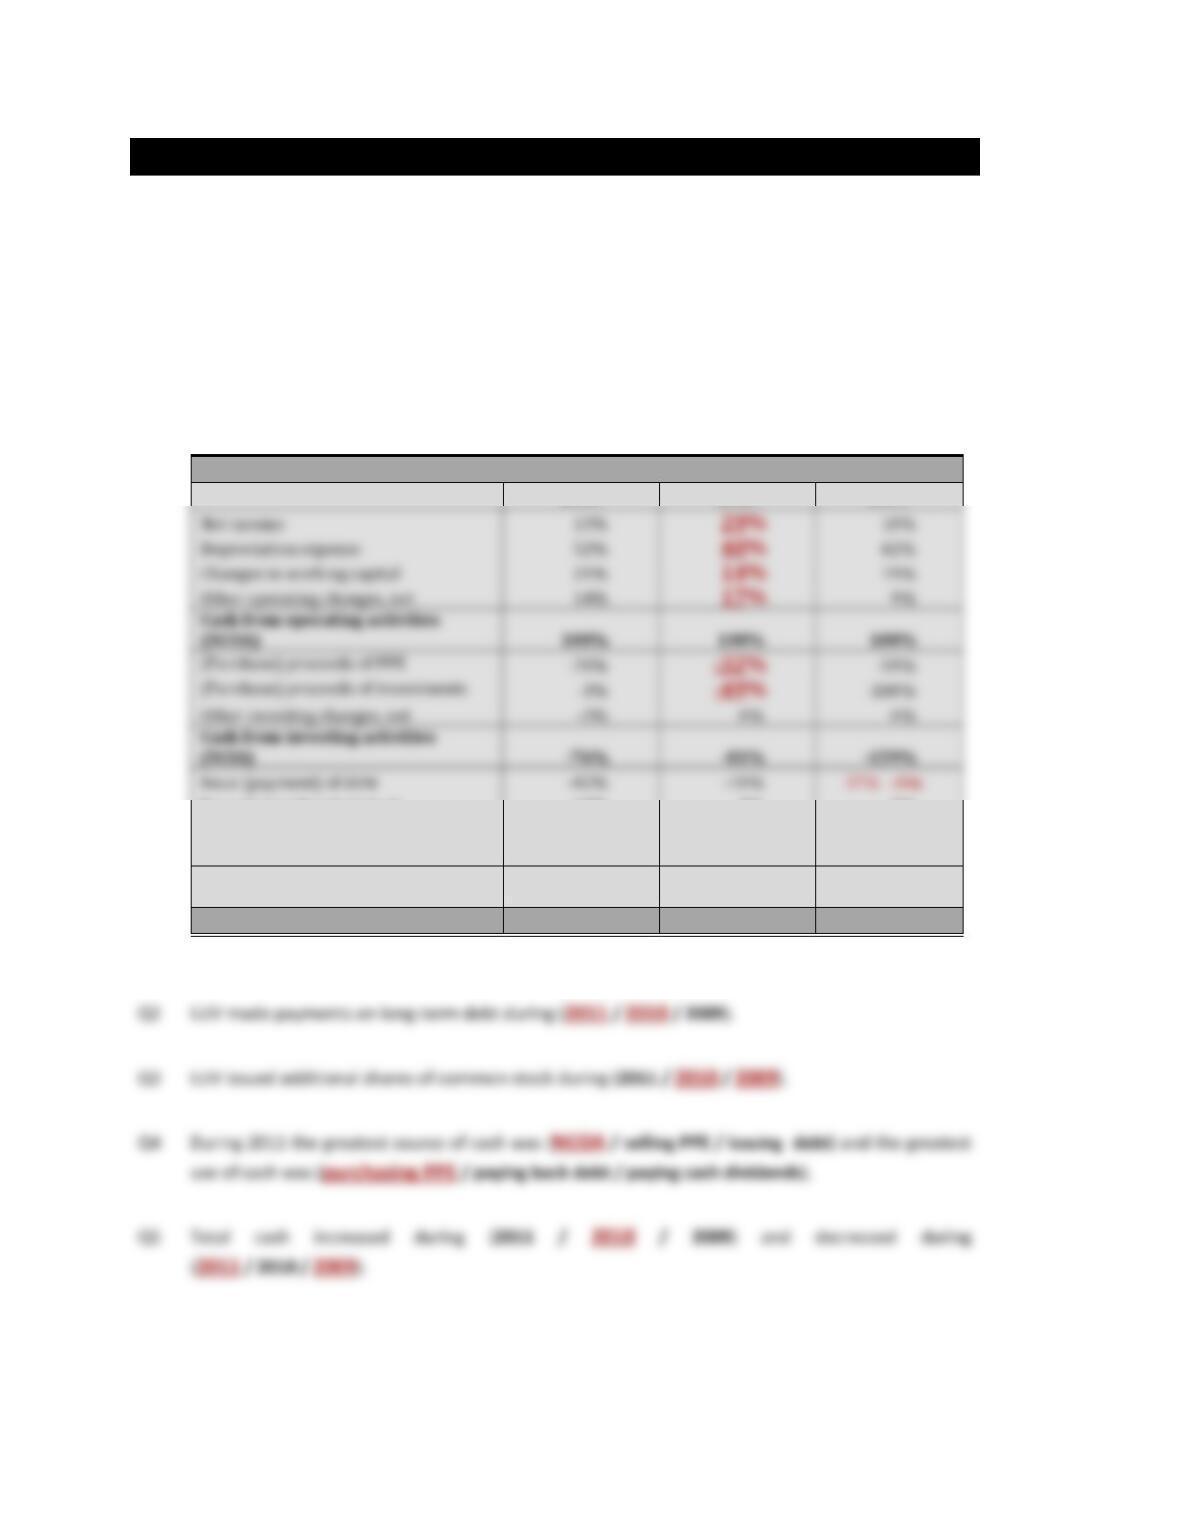
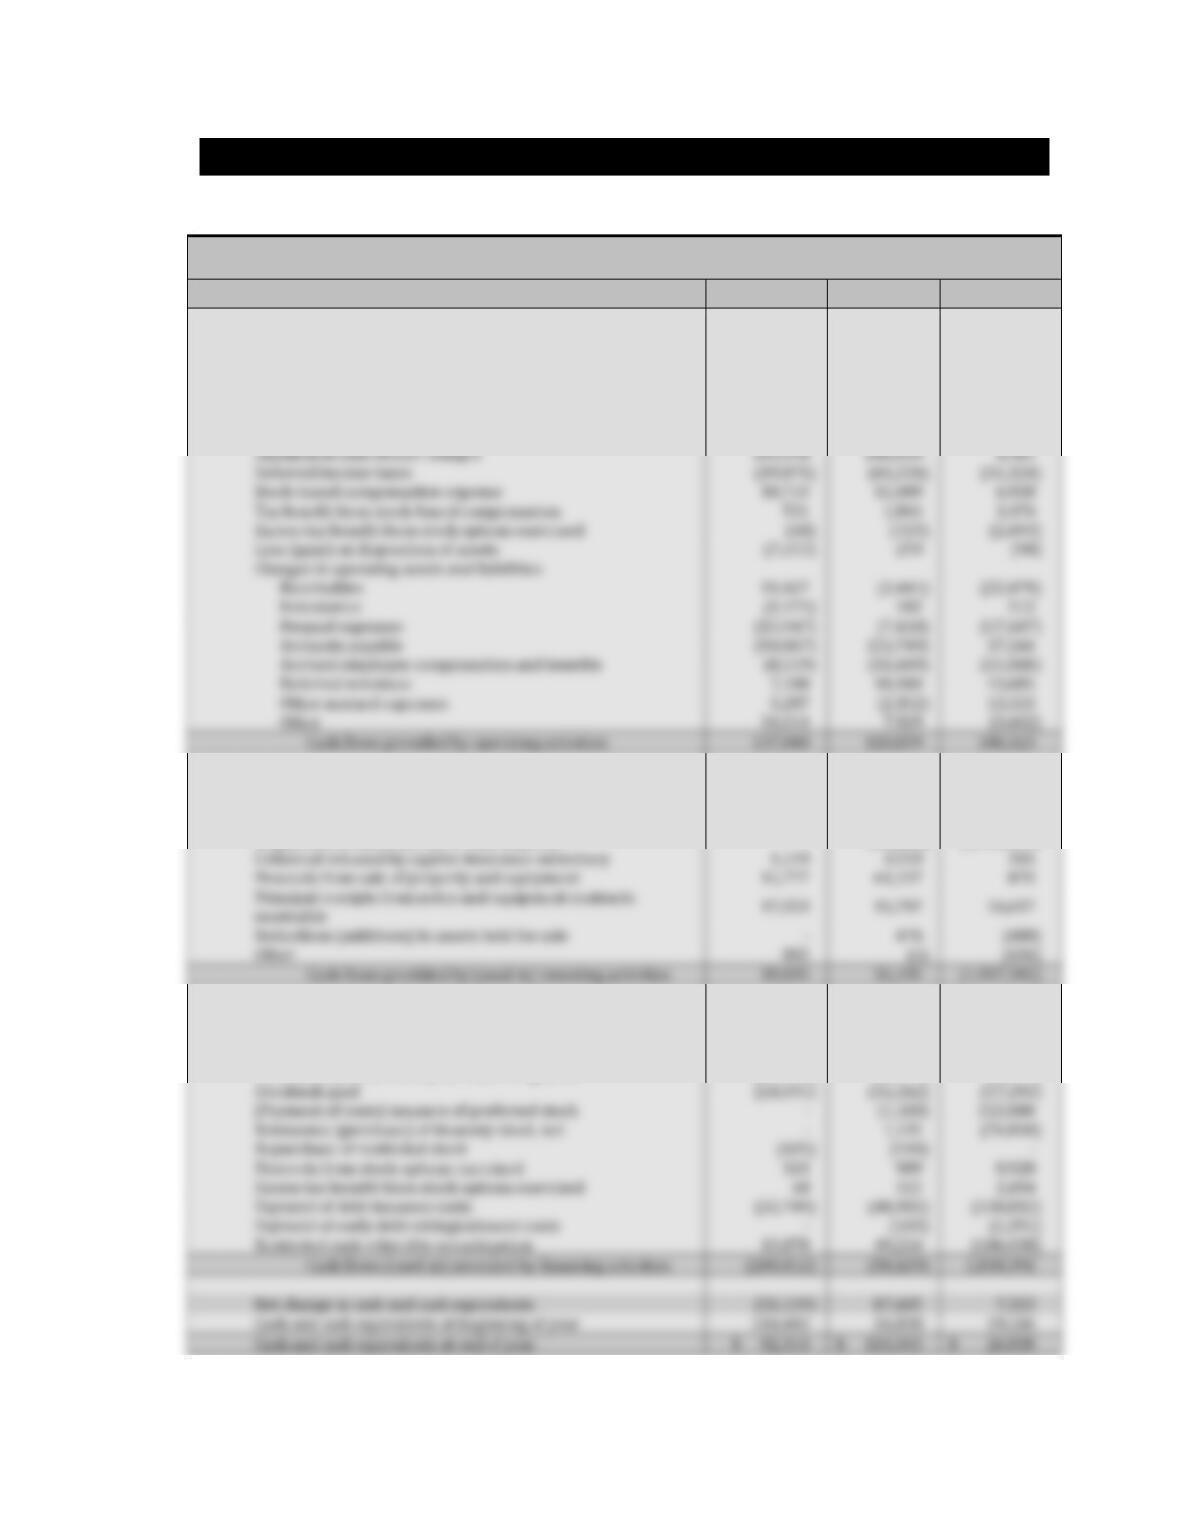
Refer to the common-size statement of cash flows below to answer the following questions.
Q1 Complete the common-size statements for 2010 by dividing each amount on the Statement of Cash
Flows by the amount of NCOA of the same year.
Southwest Airlines (LUV) STATEMENT OF CASH FLOWS Common-Size
2011
2010
2009
Issue (repurchase) of stock
-13%
3%
2%
Payment of dividends
–1%
–1%
–1%
Other financing changes, net
1%
-2%
-5%
Cash from financing activities
(NCFA)
–55%
–10%
33%
Net Change in cash
–31%
9%
-26%
Net income
Depreciation expense
Changes in working capital
Other operating changes, net
9%
(NCOA)
–70%
-3%
Other investing changes, net
–3%
0%
0%
Cash from investing activities
(NCIA)
–76%
–81%
Issue (payment) of debt
-42%
-10%
Statement of Cash Flows Page 156 Chapter 5
ACTIVITY 52 ANALYSIS OF DINE EQUITY
Purpose: • Understand and interpret amounts reported on the statement of cash flows.
DineEquity (DIN)
STATEMENT OF CASH FLOWS
($ in thousands) For the years ended December 31,
Year 9
Year 8
Year 7
Cash flows from operating activities:
Net (loss) income
$
31,409
$
(154,459
)
$
(480
)
Adjustments to reconcile net (loss) income to cash flows provided by
operating activities:
Depreciation and amortization
65,379
112,017
31,829
(Gain) loss on extinguishment of debt
(45,678
)
(15,242
)
2,223
Loss on derivative financial instrument
–
–
62,131
Cash flows from investing activities:
Additions to property and equipment
(15,372
)
(31,765
)
(11,871
)
(Additions) reductions to long-term receivables
–
(4,743
)
1,538
Acquisition of business, net of cash acquired
–
(10,261
)
(1,943,567
)
Collateral released by captive insurance subsidiary
1,549
Proceeds from sale of property and equipment
15,777
receivable
Reductions (additions) to assets held for sale
–
(688
)
Other
)
(636
)
Cash flows provided by (used in) investing activities
18,835
(1,937,392
)
Cash flows from financing activities:
Proceeds from issuance of long-term debt
10,000
405,502
2,296,216
Repayment of long-term debt
(173,777
)
(425,300
)
(268,199
)
Principal payments on capital lease obligations
(16,160
)
(5,879
)
(5,364
)
Dividends paid
(24,091
)
(33,362
)
)
Reissuance (purchase) of treasury stock, net
–
)
Repurchase of restricted stock
)
)
Proceeds from stock options exercised
8,928
Excess tax benefit from stock options exercised
2,694
Payment of debt issuance costs
(52,749
)
(48,902
)
)
Payment of early debt extinguishment costs
–
)
(1,291
)
Restricted cash related to securitization
15,878
(186,038
)
Cash flows (used in) provided by financing activities
)
(58,429
)
1,838,391
Net change in cash and cash equivalents
(32,129
)
7,322
Cash and cash equivalents at beginning of year
19,516
Impairment and closure charges
Deferred income taxes
(19,875
)
(65,226
)
)
Stock-based compensation expense
10,710
6,958
Tax benefit from stock-based compensation
3,476
Excess tax benefit from stock options exercised
)
)
(2,693
)
Loss (gain) on disposition of assets
)
)
Changes in operating assets and liabilities:
Receivables
11,607
)
)
Inventories
)
Prepaid expenses
)
(7,418
)
)
Accounts payable
(14,867
)
(23,749
)
37,266
Accrued employee compensation and benefits
)
(11,609
)
)
Deferred revenues
7,180
43,685
Other accrued expenses
5,287
(2,152
)
13,553
Other
34,014
(3,602
)
Cash flows provided by operating activities
110,839
106,323
Statement of Cash Flows Page 157 Chapter 5
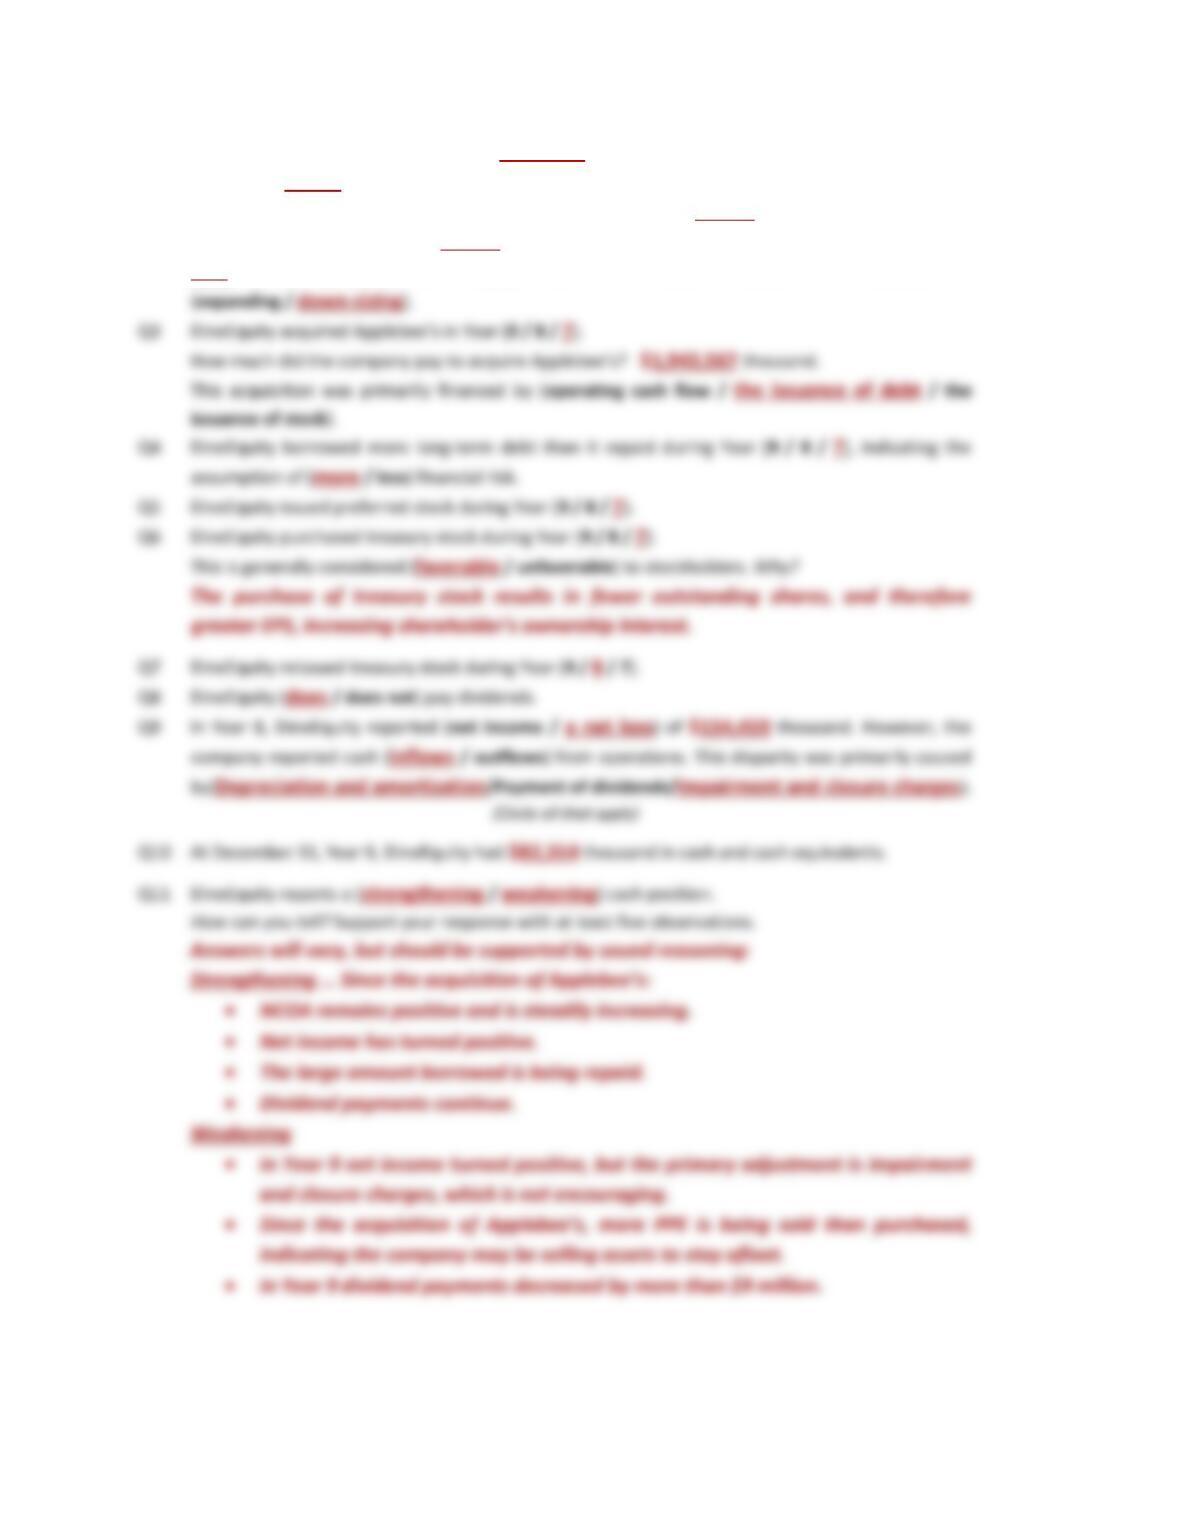
Q1 In Year 8 the primary source of cash is (operating / investing / financing) activities, which typically
indicates a (strong / weak) cash position.
Q2 In Year 8, DineEquity purchased property and equipment for $31,765 thousand in cash and sold
property and equipment for $61,137 thousand in cash. Therefore, the company (purchased /
sold) more property and equipment, which could indicate this business is
Statement of Cash Flows Page 158 Chapter 5
ACTIVITY 53 ANALYSIS OF DELL
Purpose: • Understand and interpret amounts reported on the statement of cash flows.
Dell (DELL)
STATEMENT OF CASH FLOWS
($ in millions) Fiscal Year Ended
January 28,
January 29,
January 30,
2011
2010
2009
Cash flows from operating activities:
Net income
$
2,635
$
1,433
$
2,478
Adjustments to reconcile net income to net cash provided by operating
activities:
Depreciation and amortization
970
852
769
Stock-based compensation
332
312
418
Provision for doubtful accounts
382
429
310
Cash flows from investing activities:
Investments:
Purchases
(1,360
)
(1,383
)
(1,584
)
Maturities and sales
1,358
1,538
Capital expenditures
(444
)
(367
)
)
Proceeds from sale of facility and land
18
16
44
Acquisition of business, net of cash received
)
(3,613
)
)
Purchase of financing receivables
)
–
Cash flows from financing activities:
Repurchase of common stock
(800
)
–
(2,867
)
Issuance of common stock under employee plans
12
2
79
Issuance (payment) of commercial paper, net
(176)
76
100
Proceeds from issuance of debt
3,069
2,058
1,519
Repayments of debt
(1,630
)
)
(237
)
Other
2
)
–
Effect of exchange rate changes on cash and cash equivalents
)
174
)
Change in cash and cash equivalents
3,278
2,283
588
Cash and cash equivalents at beginning of the year
10,635
8,352
7,764
$
435
$
434
800
Interest paid
$
188
$
151
74
Deferred income taxes
)
)
86
Other
26
102
34
(707
)
(660
)
480
(709
)
(1,085
)
)
(248
)
(183
)
309
516
(225
)
)
(151
)
2,833
(3,117
)
551
135
421
)
Statement of Cash Flows Page 159 Chapter 5
Q1 Review operating activities and comment on your observations.
Q2 Review investing activities and comment on your observations.
Q3 Review financing activities and comment on your observations.
How can you tell? Support your response with at least five observations.
Answer can go either way, but should be supported by sound reasoning:
Statement of Cash Flows Page 160 Chapter 5
ACTIVITY 54 TEST YOUR UNDERSTANDING
Purpose: • Understand and interpret amounts reported on the statement of cash flows.
Q1 The primary source of cash for an established company with a strong cash position should be
Q2 a. OPERATING ACTIVITIES report cash transactions that typically affect
b. INVESTING ACTIVITIES report cash transactions that typically affect
c. FINANCING ACTIVITIES report cash transactions that typically affect
Key: CA current asset; LTA long-term asset; CL current liability; LTL long-term liability; SE
stockholders’ equity.
Q3 a. Of the following accounts, circle those that are used to compute net income:
b. Decision makers compare “net income” to “net cash from operating activities.” To make
these two amounts more comparable, it is preferable to report the same account
information on both the income statement and the operating activity section of the
statement of cash flows.
1. Because interest revenue, interest expense, and dividend revenue are reported on the
income statement, the cash received/paid for these items is reported in the
Q4 a. For a note receivable, receiving repayment of principal is a(n)
Statement of Cash Flows Page 161 Chapter 5
Q5 Answer the questions that follow by referring to the statement of cash flow information below.
COMPANY
($ in millions)
Ford (F)
Royal Caribbean
Cruises (RCL)
United Airlines
(UAL)
Net cash from Operating
$ 22,764
$ 634
$ (160)
Net cash from Investing
$ (17,169)
$ (1,784)
$ (1,969)
Net cash from Financing
$ (2,976)
$ 1,700
$ 2,138
a. The company that appears to be borrowing money to finance operating activities is
c. The company that appears to be using amounts from operating activities to purchase
property, plant, and equipment, repay debt, and pay dividends is
d. The company that appears to have the weakest cash position is
Q6 a. List three transactions that result in a cash inflow for investing activities.
b. List three transactions that result in a cash outflow from financing activities.
Statement of Cash Flows Page 162 Chapter 5
Q7 What does the statement of cash flows reveal about a company that the income statement does
not?
Q8 Who can use the information on the statement of cash flows? For what purpose?