Chapter 5
5.1 The credit analyst is concerned with the ability of the borrower to
repay interest and principal on loans. Questions raised in a credit analysis
5.2 Financial ratios can serve as screening devices, indicate areas of
potential strength or weakness, and reveal matters that need further
investigation. But financial ratios do not provide answers in and of
5.3 Liquidity ratios measure a firm’s ability to meet cash needs as they
arise. Activity ratios measure the liquidity of specific assets and the
5.4 The Du Pont System helps the analyst see how the firm’s decisions
and activities over the course of an accounting period interact to produce an
overall return to the firm’s shareholders. By reviewing the relationships of a
series of financial ratios, the analyst can identify strengths and weaknesses
5.5
Current Ratio
725,000
475,000
1.53 times
Quick Ratio
400,000
475,000
0.84 times
Average Collection Period
275,000
Inventory Turnover
1,200,000
325,000
3.69 times
Fixed Asset Turnover
1,500,000
420,000
3.57 times
Total Asset Turnover
1,500,000
1,145,000
1.31 times
Debt Ratio
875,000
1,145,000
76.4 %
Times Interest Earned
200,000
2.78 times
Gross Profit Margin
300,000
Net Profit Margin
76,800
1,500,000
5.1 %
Return on Total Assets
76,800
1,145,000
6.7 %
Return on Equity
76,800
270,000
28.4 %
Capital asset efficiency is in good shape, as evidenced by an improving and
above average fixed asset turnover. The efficient management of fixed assets
approximately offsets the poor inventory turnover, and the total asset
turnover is only slightly weaker than the industry.
The return on investment, which has declined and is below the industry
average, reflects decreasing profitability and the overstocking of inventory.
Return on equity is above the industry average and is trending upward.
Although the high debt ratio improves the return on equity, it also increases
risk. The increased use of financial leverage has more than offset the
decrease in profitability:
Net Profit
Margin
x
Total Asset
Turnover
=
Return on
Investment
5.6 Luna’s current ratio has increased and is above the industry average,
the average collection period has shortened and is less than the industry
average, and the inventory turnover ratio has improved; the ratios indicate
that Luna has no obvious problems with liquidity or the management of
5.7
(a) FIFO
(b) LIFO
Gross profit margin
53.3
3
%
25.8
3
%
Operating profit margin
33.3
3
%
5.8
3
%
Net profit margin
19.9
3
%
2.0
6
%
Current ratio
1.6
1
1.1
0
Quick ratio
0.7
7
0.7
7
4
the future. The difference in profit margins has resulted from a “paper”
profit recorded under the FIFO method.
Ending inventory is undervalued when LIFO is used during inflation. The
FIFO valuation is a better reflection of the current market price of Rare
Metals, Inc.’s inventory. As a result the current ratio of 1.61 is a more
accurate representation than 1.10. The quick ratios are identical because
inventory has been eliminated from the calculation, and inventory is the only
difference in the numbers being compared.
(d) Yes, cash flow from operating activities will differ due to the
difference in taxes paid. Assuming that the inventory method is the only
5.8
(a) XYZ is more liquid than ABC. XYZ’s current and quick ratios are
both above one and the cash-flow liquidity ratio is close to one, indicating
the company should be able to pay current liabilities as they come due.
ABC’s liquidity ratios are all below one. It appears that ABC must find
ABC generates higher operating and net profits than XYZ, and therefore has
higher return on assets and equity ratios. The return on equity ratio is
extremely high due to the fact that ABC uses a significant amount of debt
(76%) and is generating sufficient returns to cover the cost of the debt.
XYZ, while not as profitable, is translating their profits into cash much
better than ABC.
(b)
ABC
XYZ
Stock Price
EPS
$41
$4.59
$35
$1.19
PE Ratio
8.9
29.4
The PE ratio indicates the value being placed by the stock market on a
5.9
Current
Quick
Net Wk. Capital
Debt
(a)
D
N
N
I
(b)
N
N
N
N
(c)
I
I
I
D
D
D
D
N
(e)
D
N
D
I
(f)
N
N
N
N
(g)
I
I
I
I
(h)
I
I
I
D
(i)
N
N
N
D
(j)
N
D
N
N
(k)
D
D
N
I
(l)
I
N
N
D
The instructor might want to discuss why a firm would make a specific
5.10
(a)
Debt
Equity
Debt Ratio*
40+10
90+10
= 50%
40
90+10
= 40%
4.8+1.5
= 2.86 x
18
= 3.75x
Operating Profit
Interest Expense
Earnings before tax
Net Income
Shares Outstanding
800,000
1,000,000
Earnings per share
$8.78
$7.92
Return on Equity
7,020
50,000
= 14.04%
7,920
60,000
= 13.20%
100,000
14.04
10.80
= 1.3
13.20
10.80
= 1.2
7
(b) Use of debt would increase the debt ratios from 44% to 50%, while
equity financing would reduce the debt ratio to 40%. Interest coverage
would decline from 3.1 times to 2.86 times if debt is employed; times
interest earned would increase to 3.75 times with stock financing. Earnings
per share would be higher with the debt financing. The financial leverage
index is greater than 1, indicating the successful use of financial leverage
under either alternative, but is higher with debt financing.
5.11 At first glance, it appears that Walmart has poor short-term liquidity.
The current, quick and cash flow liquidity ratios are all below 1.0. This
means the firm does not have as many current assets or liquid items to cover
current liabilities. The quick ratio is especially low due to the large amount
of inventories Walmart must have to stock its stores. The cash flow liquidity
ratio is decreasing as a result of cash flow from operations decreasing from
2013 to 2014.
5.12 Republic Airways has a risky capital structure. The overall debt has
decreased slightly to 83.2% and long-term debt remains stable at 77%. The
interest (accrual-based and cash-based) and fixed charge coverage ratios are
low, but have improved from 2012 to 2013. An increase in operating profit
may have contributed to an increase in cash flow from operations. Cash flow
Operating profit has improved, but net profit has declined. Since revenues
have decreased, the company has been more efficient in managing their
operating expenses. The lower net profit could be caused by large interest
expense. Cash flow margin and cash return on assets have improved over the
past year which is positive and a result of the increasing cash flow from
5.13 Writers of the 2016 annual report will probably want to emphasize
rebounding in 2016 from an abnormal year in 2015. They will want to point
out reasons for the improvement in 2016, showing how the company is
5.14 There is no solution presented for this problem since students will
choose different industries. Having students share what they have learned
from their research can lead to interesting discussions.
5.15 There is no solution presented for this problem since students will
Case 5.1
(a) and (b)
2013
2012
2011
Ind.
Avg.*
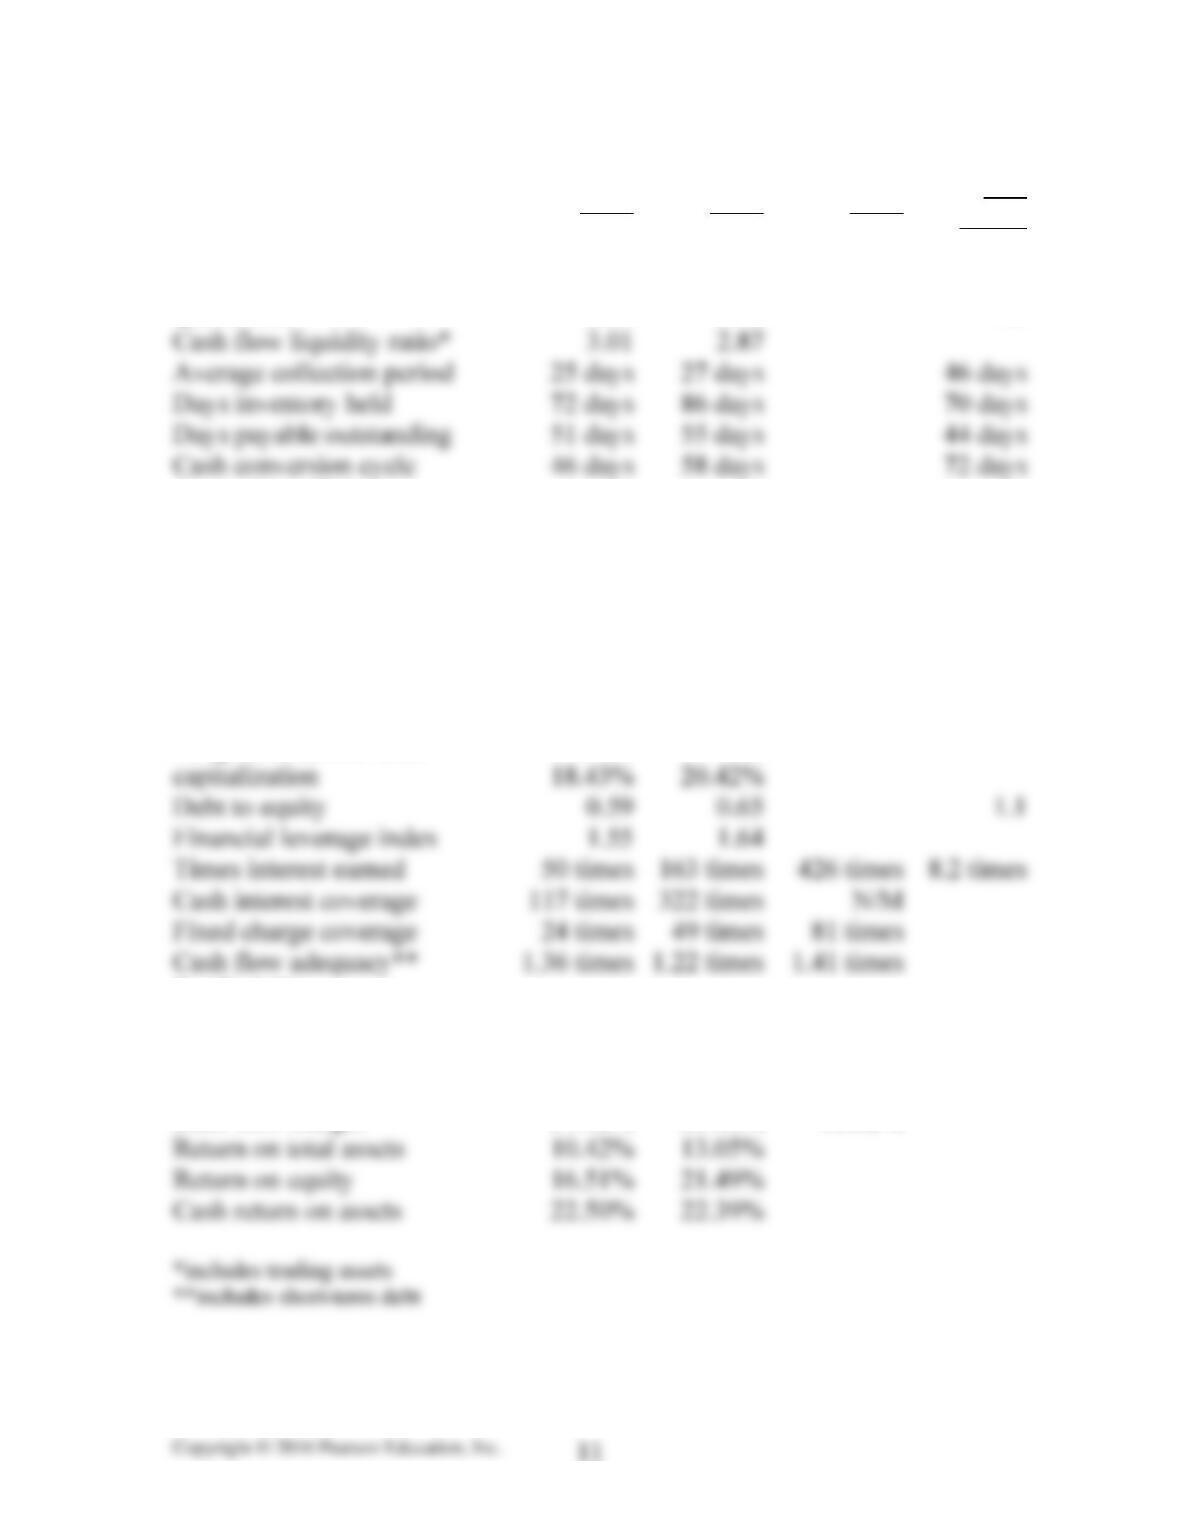
Short-term liquidity
Current ratio
2.36
2.43
2.2
Quick ratio
2.06
2.06
1.2
Cash flow liquidity ratio*
3.01
2.87
Average collection period
25 days
Days inventory held
Days payable outstanding
Cash conversion cycle
58 days
Operating efficiency
Accounts receivable turnover
14.71
13.92
8.0
Inventory turnover
5.08
4.26
5.2
Accounts payable turnover
7.14
6.68
8.3
Fixed asset turnover
1.68
1.91
15.2
Total asset turnover
.57
.63
1.5
Leverage
Debt ratio
36.92%
39.30%
49.7%
18.43%
20.42%
Debt to equity
1.1
Financial leverage index
Times interest earned
Cash interest coverage
N/M
Fixed charge coverage
Cash flow adequacy**
Long-term debt to total
Profitability
Gross profit margin
59.80%
62.15%
62.51%
28.7%
Operating profit margin
23.32%
27.44%
32.37%
1.6%
Net profit margin
18.25%
20.63%
23.97%
Cash flow margin
39.42%
35.40%
38.82%
Return on total assets
10.42%
13.05%
Return on equity
16.51%
21.49%
Cash return on assets
22.50%
22.39%
2013
2012
2011
Ind.
Avg.
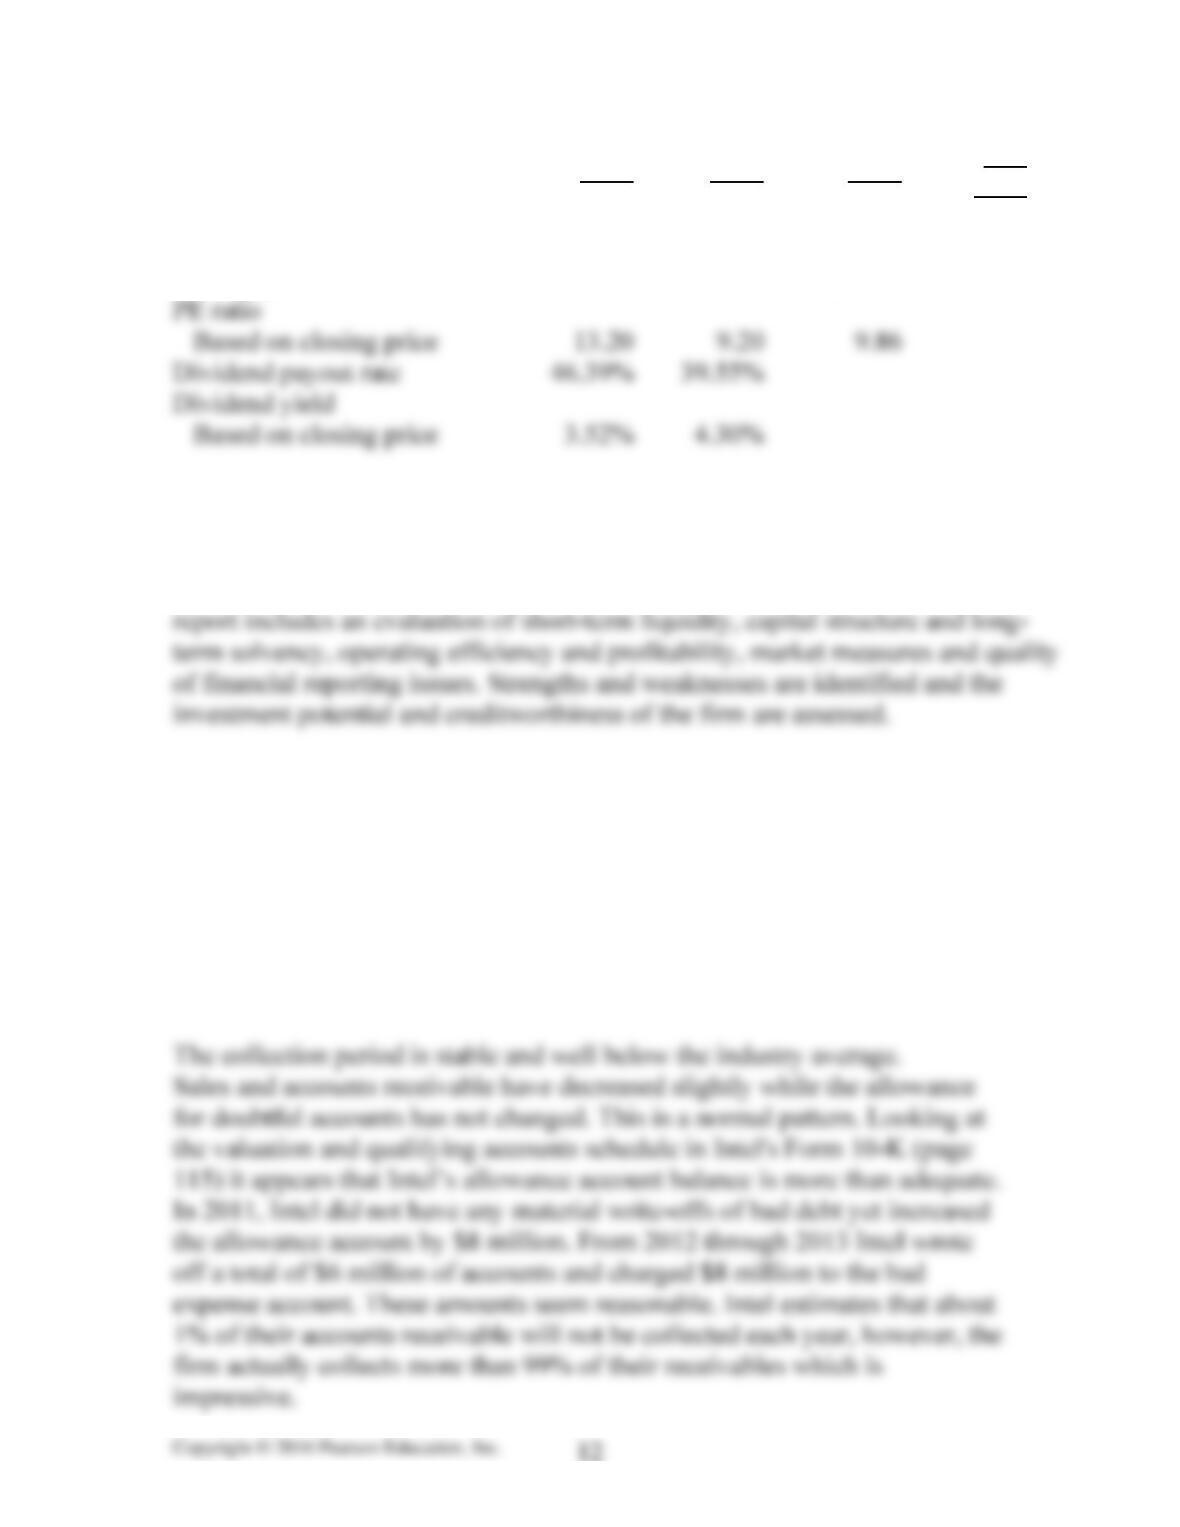
Market measures
Earnings per share
$1.94
$2.20
$2.46
Closing price
$25.60
$20.23
$24.25
* Industry average is from The Risk Management Association, Annual
Statement Studies, 2013; NAICS 334413
(c) As requested, an evaluation of Intel has been completed. The following
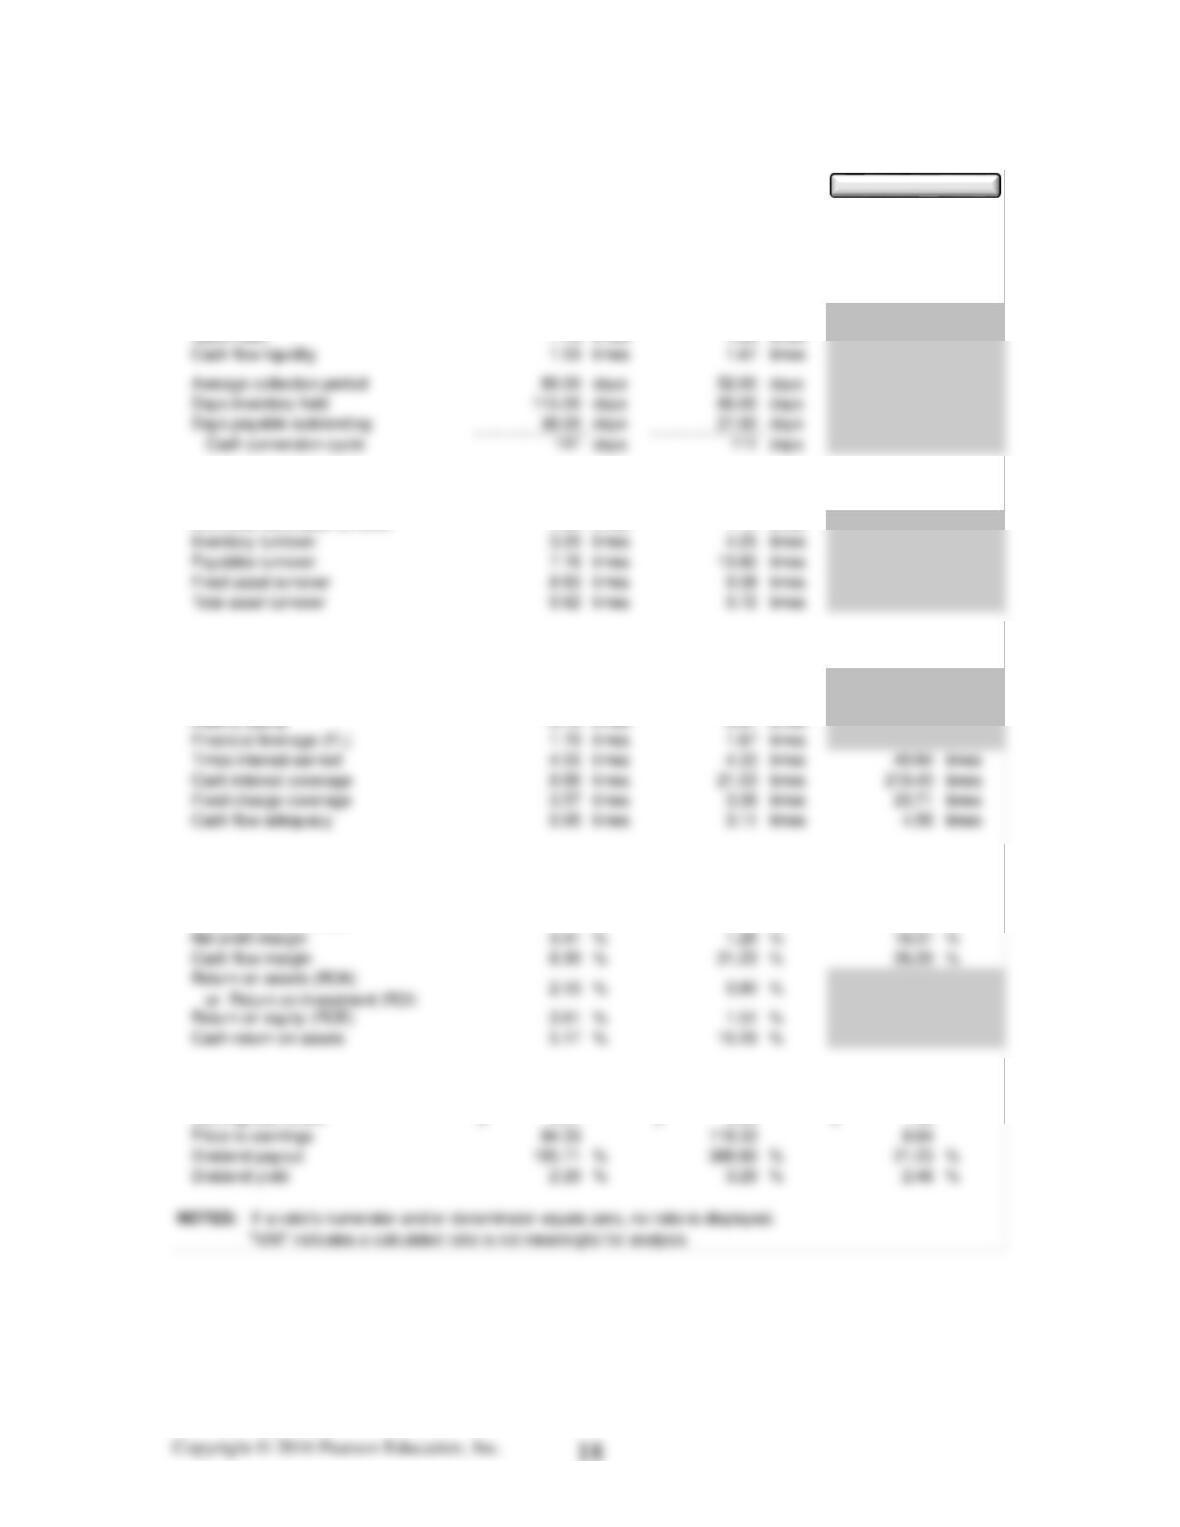
Short-term Liquidity
Intel’s short-term liquidity is impressive. The current and quick ratios are
both above two and higher than the industry average. The cash-flow
liquidity ratio increased due to the increases in liquid assets and increasing
cash from operations. Intel has a significant amount of cash and short-term
investments and, therefore, should not have problems paying debt as it
comes due. This company has no problem generating cash from operations
as evidenced by the statement of cash flows.
Days inventory held has decreased significantly and is now just two days
above the industry average. It is important for Intel to decrease inventory
days because of the rapid obsolescence of products in the high technology
industry.
Days payable outstanding has decreased indicating Intel is paying suppliers
faster, but still takes longer than the competition. It is possible that Intel, due
to its excellent short-term liquidity, is better able than its competitors to
obtain more favorable credit terms from its suppliers.
Operating Efficiency
As discussed under short-term liquidity, Intel’s inventory turnover is better
in 2013 compared to 2012 and the firm is paying accounts payable faster.
new facility in Arizona which is currently not being used. The lack of
generation of sales after such a large investment is of concern.
Capital structure and long-term solvency
Intel has less debt than the competition. Cash and short-term investments
can easily cover all of Intel’s current liabilities and current assets cover 94%
of total liabilities.
Profitability
Revenues for Intel decreased in both 2013 and 2012 by 1.2%. Operating
costs increased in both years resulting in decreasing operating profit. Intel
has four segments for reporting purposes: the PC Client Group (PCCG), the
Data Center Group (DCG), the Other Intel Architecture segment (OIA) and
the Software and Services segment (SSG).
The decrease in revenues in 2012 was partially due to the fact that 2012 was
a 52 week year and 2011 was a 53 week year. In addition, volume was
decreasing due to the shift away from PCs to consumer demand for tablets.
The gross profit margin, stable in 2011 and 2012, decreased in 2013. The
Management Discussion and Analysis (MDA) explains that the decrease in
gross profit margin was a result of higher factory start-up costs primarily for
the next-generation 14nm process technology. To a lesser extent, lower
overall revenue from the OIA segment, primarily in the phone and mobile
component businesses and netbook group, as well as lower PCCG and DCG
platform revenue contributed to the decrease. These decreases were partially
offset by higher ISG platform revenue, lower PCCG and DCG platform unit
costs, and lower excess capacity charges. Higher (or lower) revenues caused
by volume increases (or decreases) result in higher (lower) gross profit
margins when firms have fixed costs. As a manufacturer Intel would have
significant fixed costs included in their cost of sales.
Intel is spending more on research and development costs (R&D) in 2012
and 2013 as they transition to new markets. Investments are being made
primarily in smartphones and tablets, as well as rewarding employees with
higher salaries in 2013, while in 2012 investments focused on not only
smartphones and tablets, but also, Ultrabook devices, and data centers.
Higher process development costs for 14nm process technology, higher
compensation expenses, costs of acquisitions, and higher costs related to the
development of 450mm wafer technology contributed to the 2012 R&D
increases. (pg. 37 of Form 10-K)
Intel has net overall gains from equity investments in all three years.
Although the amounts are insignificant they are growing each year as market
conditions improve. Interest and other, net, is a combination of
miscellaneous items including interest income and interest expense. Interest
income is stable year to year, however, interest expense has increased all
years as a result of the long-term debt taken out to repurchase the firm’s
common stock. (See Note 22, pg. 94 of the Form 10-K for detail of this
account.)
Net profit margin followed the downward trend of operating profit margin.
Return on assets and return on equity have declined due to the decreasing
profits and increasing assets and equity. To continue to be successful, Intel
must maintain good control of expenses, while continuing to develop cutting
edge products. In addition, Intel must be prepared to transition quickly when
changes in the technology market occur. With PCs and older technology
Market Measures
Earnings per share decreased all three years due to declining revenues and
increasing operating expenses. The stock price which dropped in 2012 has
rebounded in 2013. The PE ratio indicates investors are viewing Intel more
favorably in 2013.
Quality of Financial Reporting
Intel has disclosed key information as required in their annual report and
Form 10-K. Overall, the quality of financial reporting is good.
Strengths
Strong cash flow from operations
Solid short-term liquidity
Weaknesses
Reliance on three customers
Investment potential
Intel generates excellent cash flow, but needs to work on increasing
Creditworthiness
Intel’s solid short-term and long-term solvency combined with strong cash
flow from operations and an average debt ratio make this company a good
credit risk.
Case 5.2 (a)
Liquidity Ratios:
Current ratio 2.31 times 2.25 times
Activity Ratios:
Accounts receivable turnover 4.60 times 7.15 times
Leverage Ratios:
Debt ratio 41.14 % 40.22 %
Long–term debt to total capitalization 21.54 % 21.20 %
Profitability Ratios:
Gross profit margin 39.83 % 38.00 % 41.46 %
Operating profit margin 5.75 % 4.71 % 22.80 %
Market Ratios:
Earnings per share 0.21$ 0.09$ 1.46$
Applied Materials (AMAT / NASDAQ)
Summary of Financial Statement Ratios
Results for the Years Ending
Oct 27, 2013
Oct 28, 2012
Oct 30, 2011
Show Formulas
(b) Analysis of Applied Materials – 2013
Applied Materials (AMAT) manufactures equipment, and provides services
and software to the global semiconductor, flat panel display, solar
Short-term liquidity
AMAT’s current and quick ratios are above two and increasing. The cash
flow liquidity ratio decreased in 2013 due to a decrease in cash from
operating activities (CFO) caused by increasing accounts receivable and
Selected Income Statement Growth Rates:
Sales growth rate (13.88) %(17.10) %
Gross profit growth rate (9.72) %(24.01) %
NOTES: “N/M” indicates a calculated rate is not meaningful for analysis
2013 vs. 2012
2012 vs. 2011
Applied Materials (AMAT / NASDAQ)
Additional Ratio Analysis
Growth Rate Comparisons Between
Inventory days held increased twenty-nine days and at 115 days, seems high.
If this is a temporary increase due to demand and not stockpiling that may
result in obsolete products, the ratio should decrease in 2014. AMAT is
taking 21 days longer to pay suppliers. At 48 days this is not a problem and
is a good way for AMAT to keep money earning a return until absolutely
needed for paying bills. The cash conversion cycle is high at 147 days as a
result of increases in average collection period and days inventory held,
offset by the longer days payable.
Operating efficiency
The accounts receivable, inventory and accounts payable turnovers were
discussed under short-term liquidity. Fixed asset turnover has decreased due
Capital structure and long-term solvency
AMAT’s debt structure is good and ratios are stable with approximately half
of the debt short-term and half of the debt long-term. The only significant
borrowing was in 2011 to support the acquisition of Varian. Most cash
inflows are obtained from operations and short-term investments each year;
however, both of these sources have decreased in dollar amount from 2011
to 2013.