Problem 5-28A (continued)
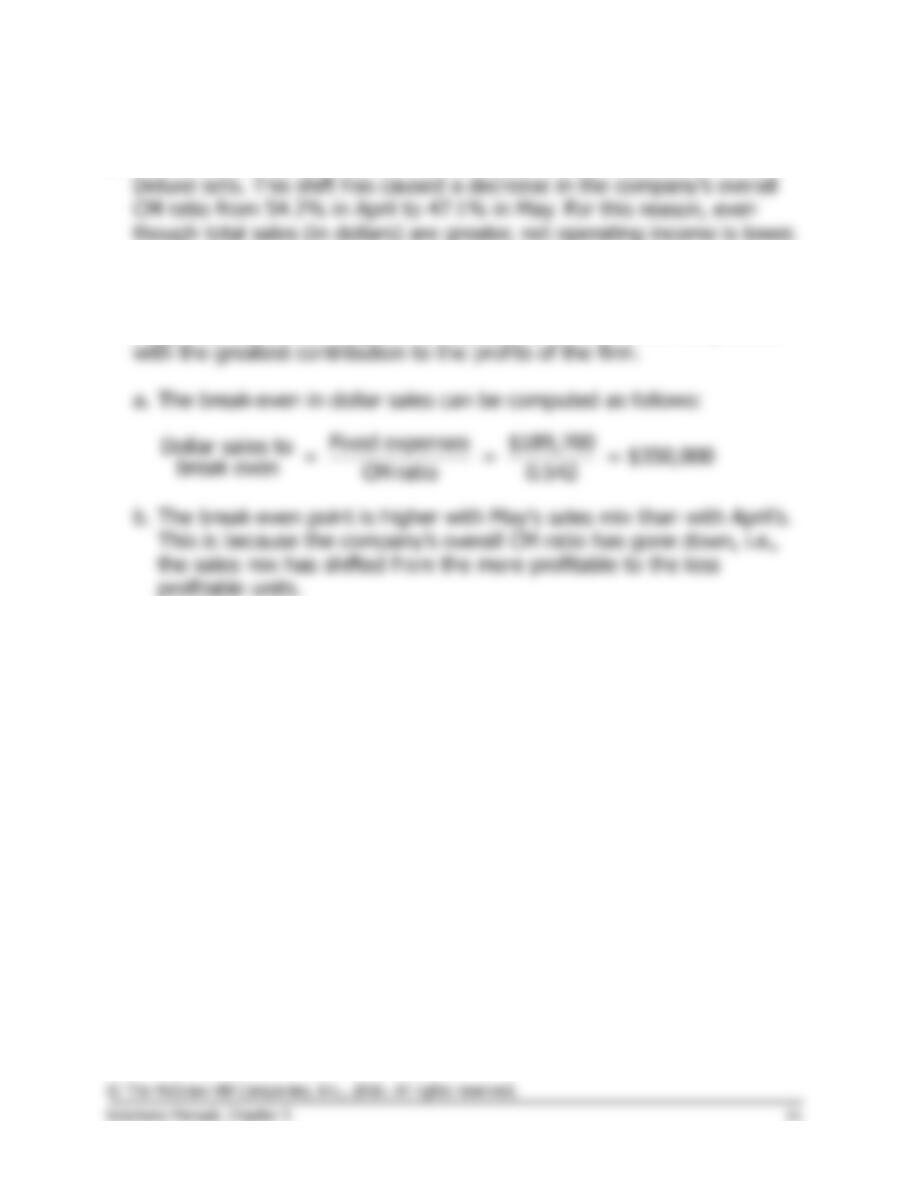
2. The sales mix has shifted over the last year from Standard sets to
3. Sales commissions could be based on contribution margin rather than
on sales price. A flat rate on total contribution margin, as the text
suggests, might encourage the salespersons to emphasize the product
Problem 5-29A (60 minutes)
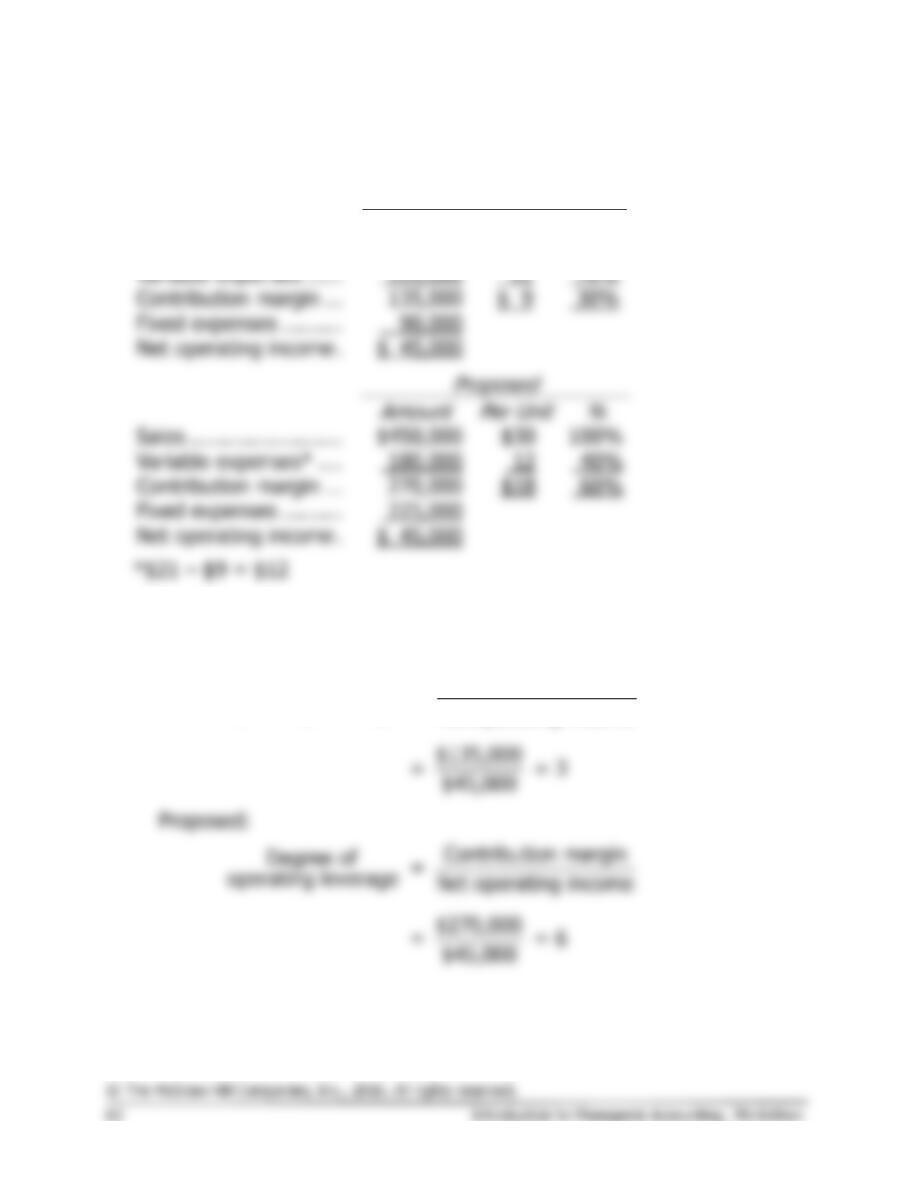
1. The income statements would be:
Present
Amount
Per Unit
%
Sales …………………….
$450,000
$30
100%
Amount
%
Net operating income .
$ 45,000
2. a. Degree of operating leverage:
Present:
Contribution margin
Degree of
=
operating leverage Net operating income
Problem 5-29A (continued)
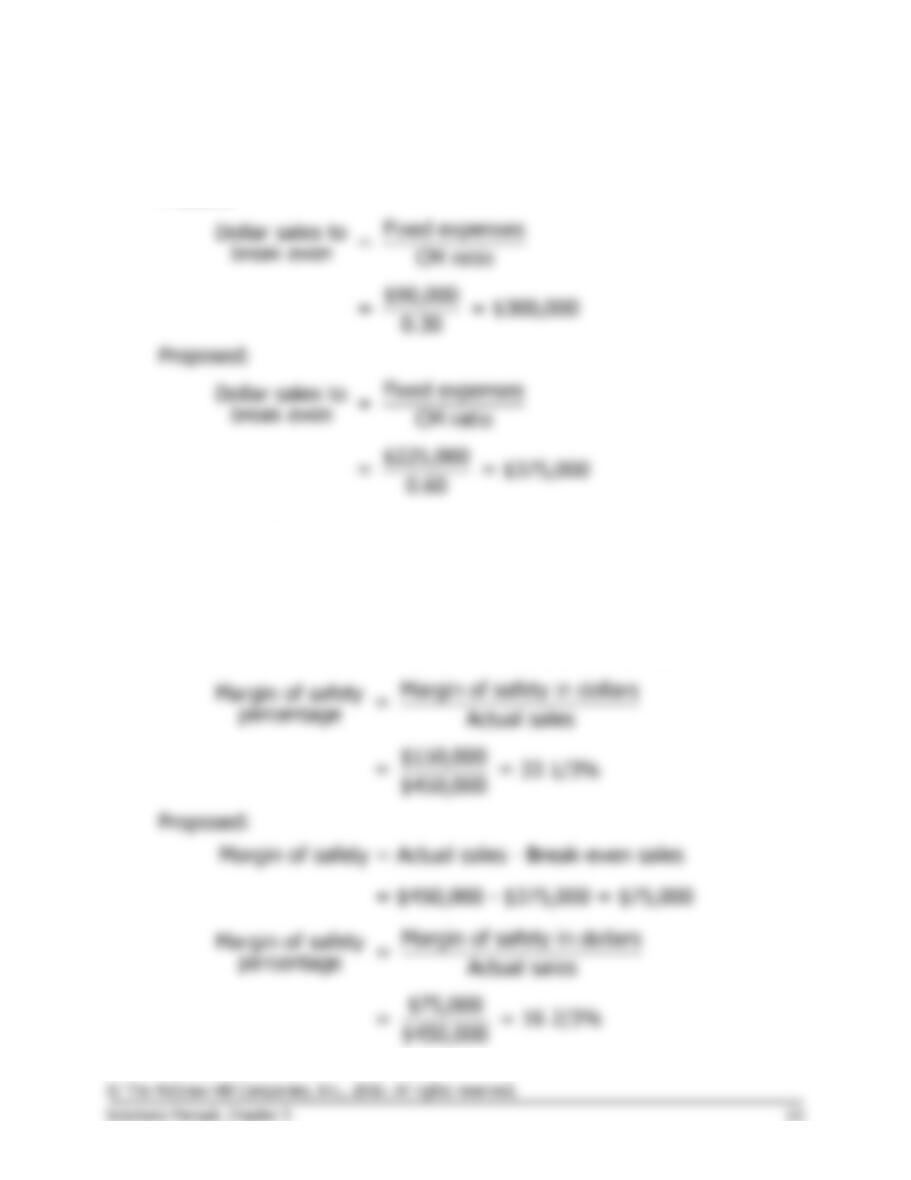
b. Dollar sales to break even:
Present:
c. Margin of safety:
Present:
Margin of safety = Actual sales – Break-even sales
= $450,000 – $300,000 = $150,000
Problem 5-29A (continued)
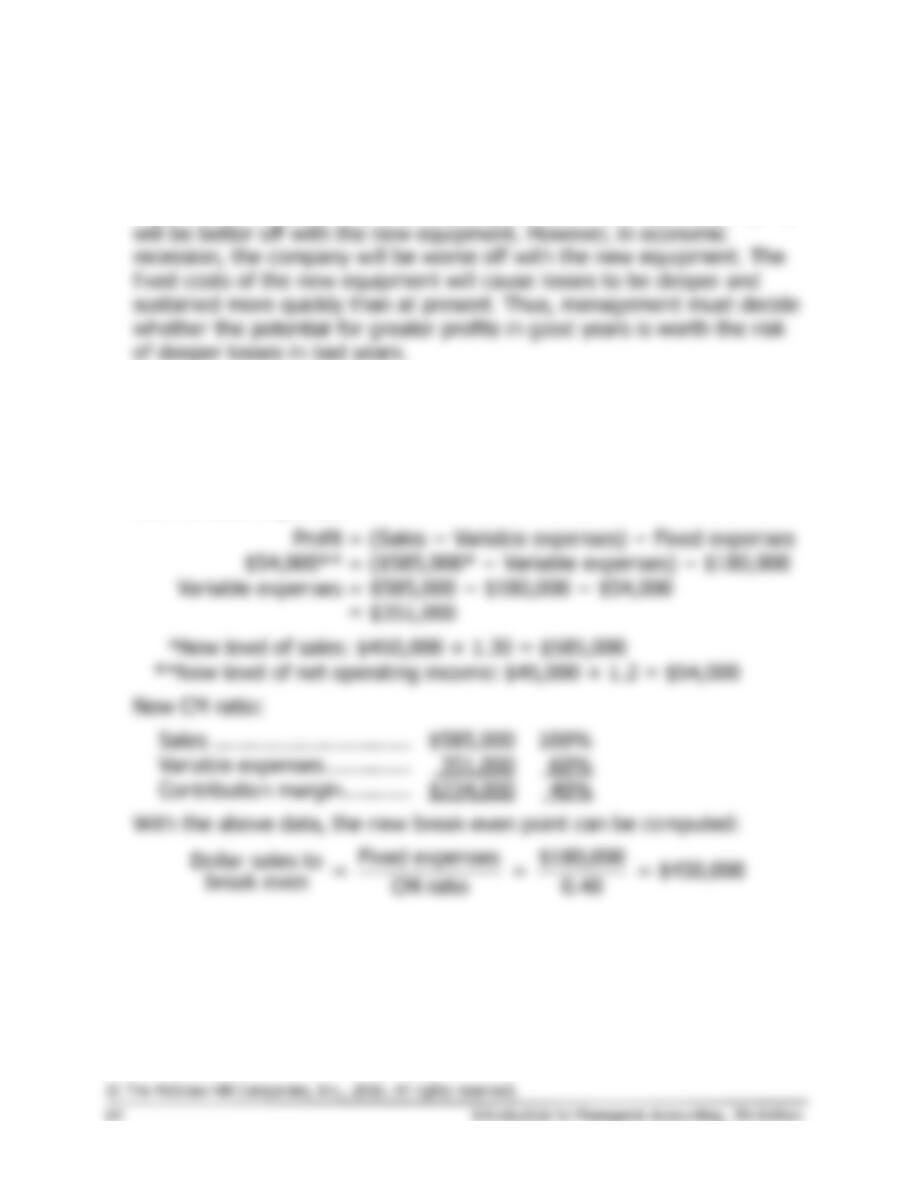
3. The major factor would be the sensitivity of the company’s operations to
cyclical movements in the economy. Because the new equipment will
increase the CM ratio, in years of strong economic activity, the company
4. No information is given in the problem concerning the new variable
expenses or the new contribution margin ratio. Both of these items must
be determined before the new break-even point can be computed. The
computations are:
New variable expenses:
Problem 5-29A (continued)
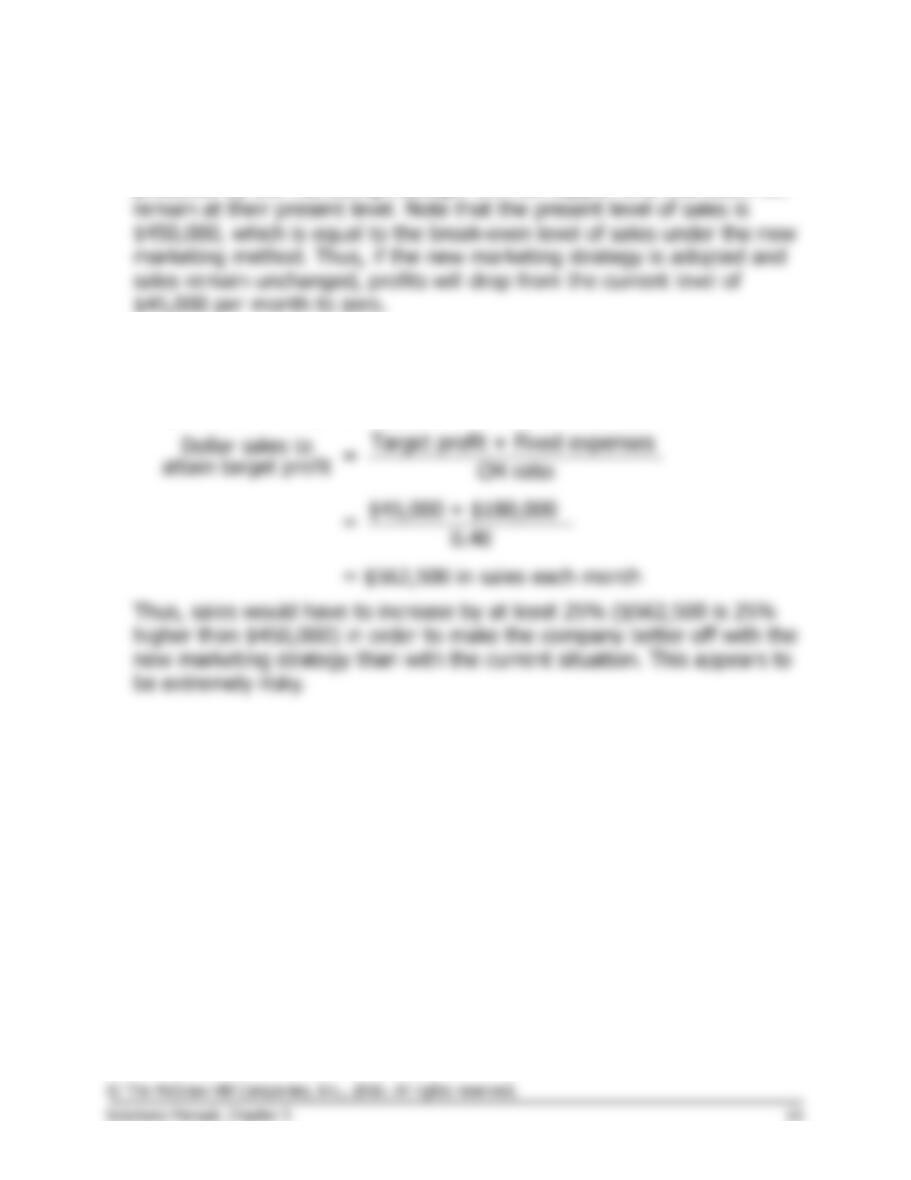
The greatest risk is that the increases in sales and net operating income
predicted by the marketing manager will not happen and that sales will
It would be a good idea to compare the new marketing strategy to the
current situation more directly. What level of sales would be needed
under the new method to generate at least the $45,000 in profits the
company is currently earning each month? The computations are:
Problem 5-30A (60 minutes)
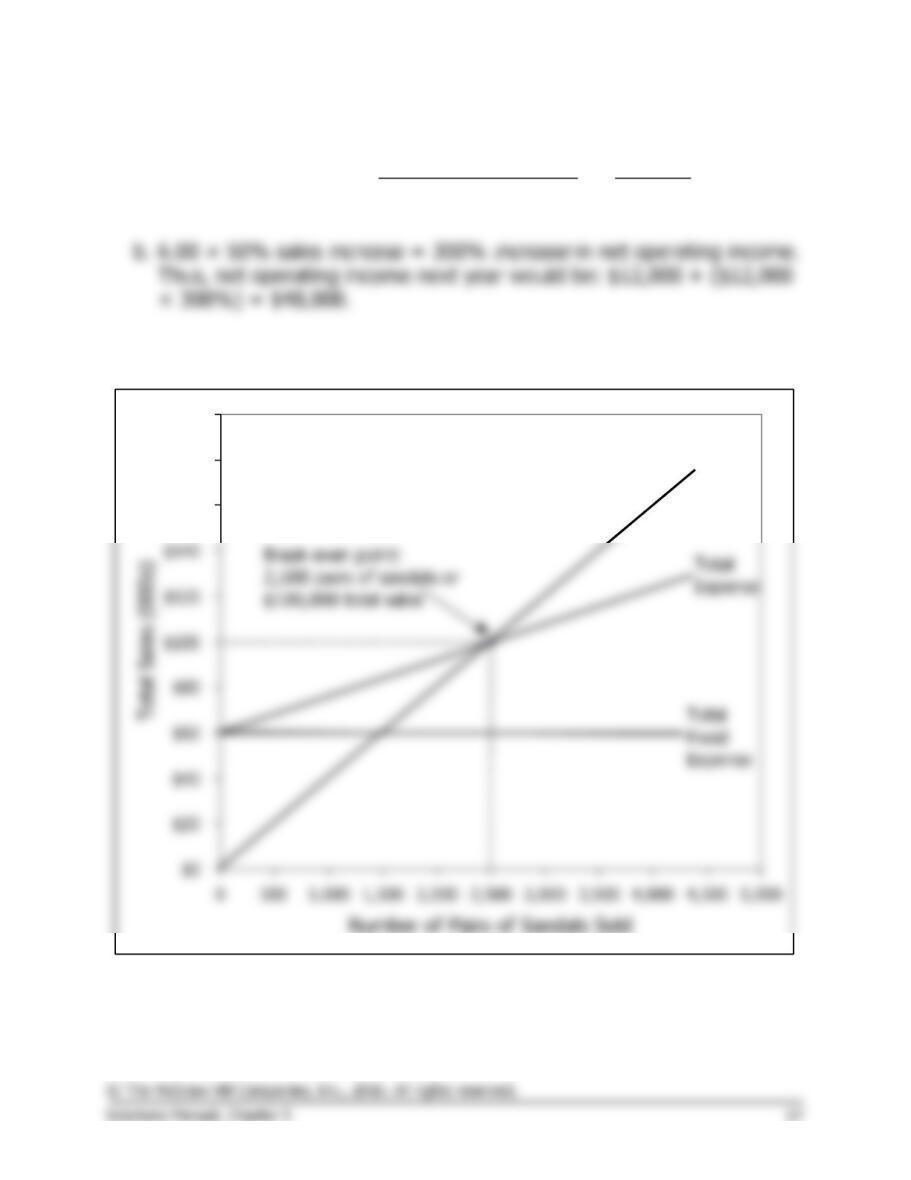
2. See the graphs at the end of this solution.
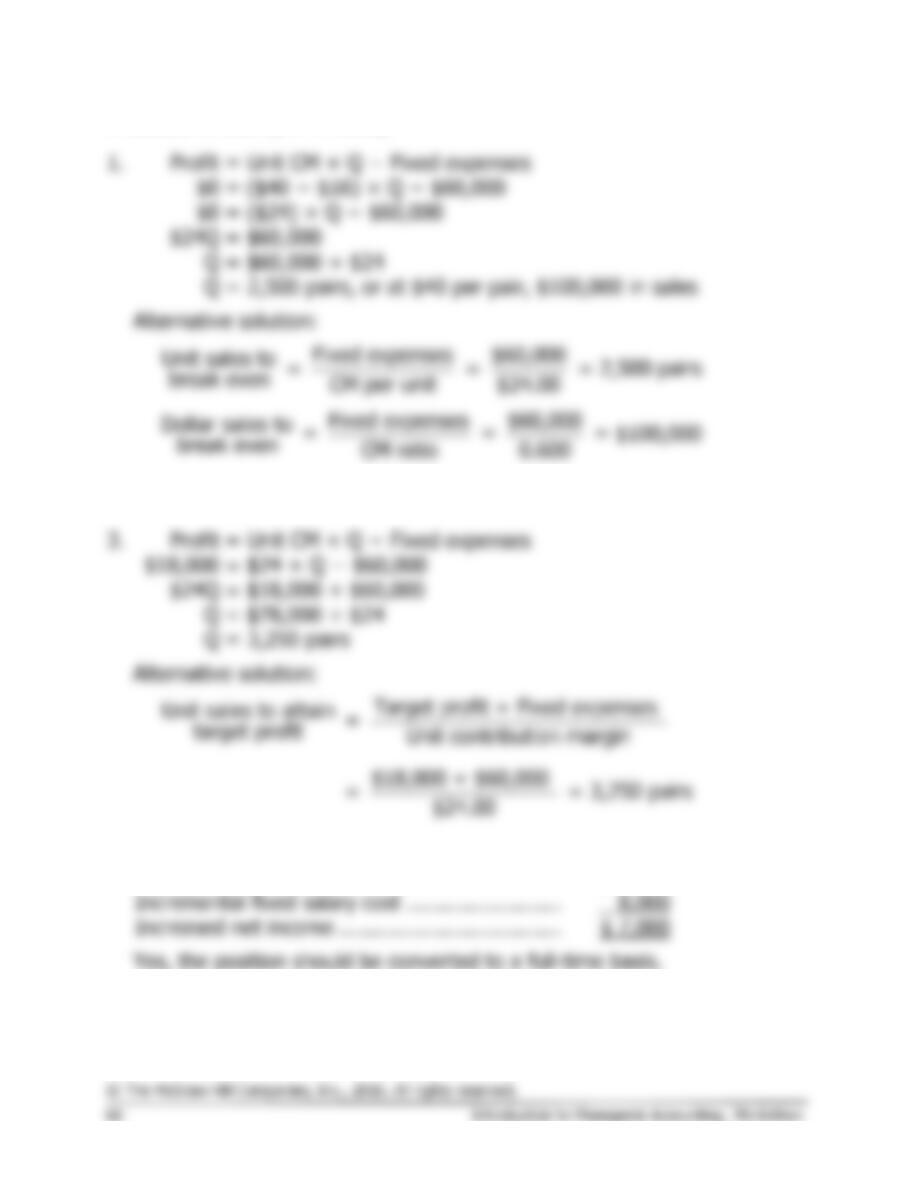
4.
Incremental contribution margin:
$25,000 increased sales × 60% CM ratio …..
$15,000
Problem 5-30A (continued)
5.
a.
Contribution margin $72,000
Degree of = = = 6
operating leverage Net operating income $12,000
2. Cost-volume-profit graph:
$160
$180
$200
Total Sales
Problem 5-30A (continued)
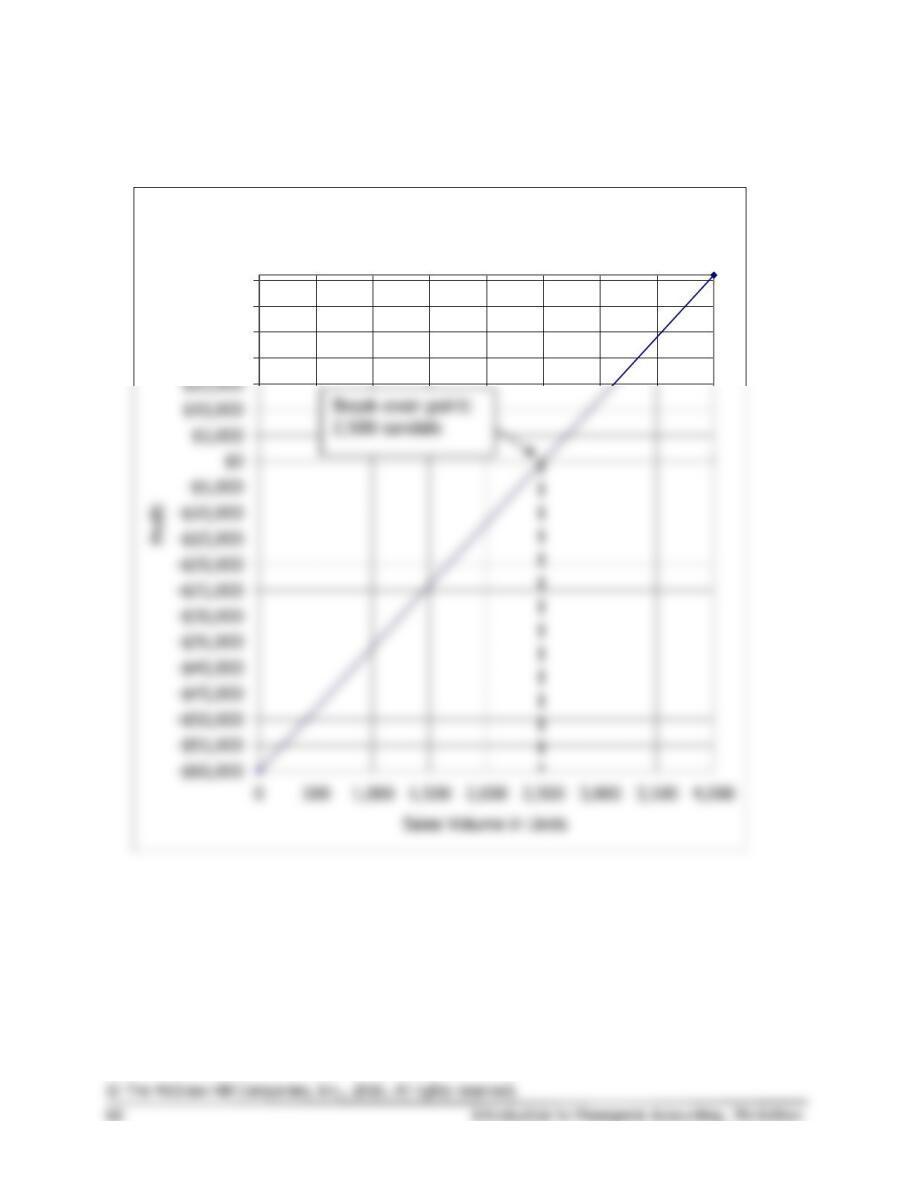
Profit graph:
$20,000
$25,000
$30,000
$35,000
Profit Graph
Problem 5-31A (30 minutes)
1.
(1)
Dollars
(5)
Fixed expense area
(6)
Break-even point
(7)
Loss area
(8)
Profit area
(2)
Volume of output, expressed in units, % of capacity, sales,
Problem 5-31A (continued)
2.
a.
Line 3:
Remain unchanged.
Line 9:
Have a steeper slope.
Break-even point:
Decrease.
b.
Line 3:
Have a flatter slope.
Line 9:
Remain unchanged.
Break-even point:
Increase.
d.
Line 3:
Remain unchanged.
Line 9:
Remain unchanged.
Break-even point:
Remain unchanged.
e.
Line 3:
Shift downward and have a steeper slope.
Line 9:
Have a steeper slope.
g.
Line 3:
Shift upward.
Line 9:
Remain unchanged.
Break-even point:
Probably change, but the direction is uncertain.
Case (75 minutes)
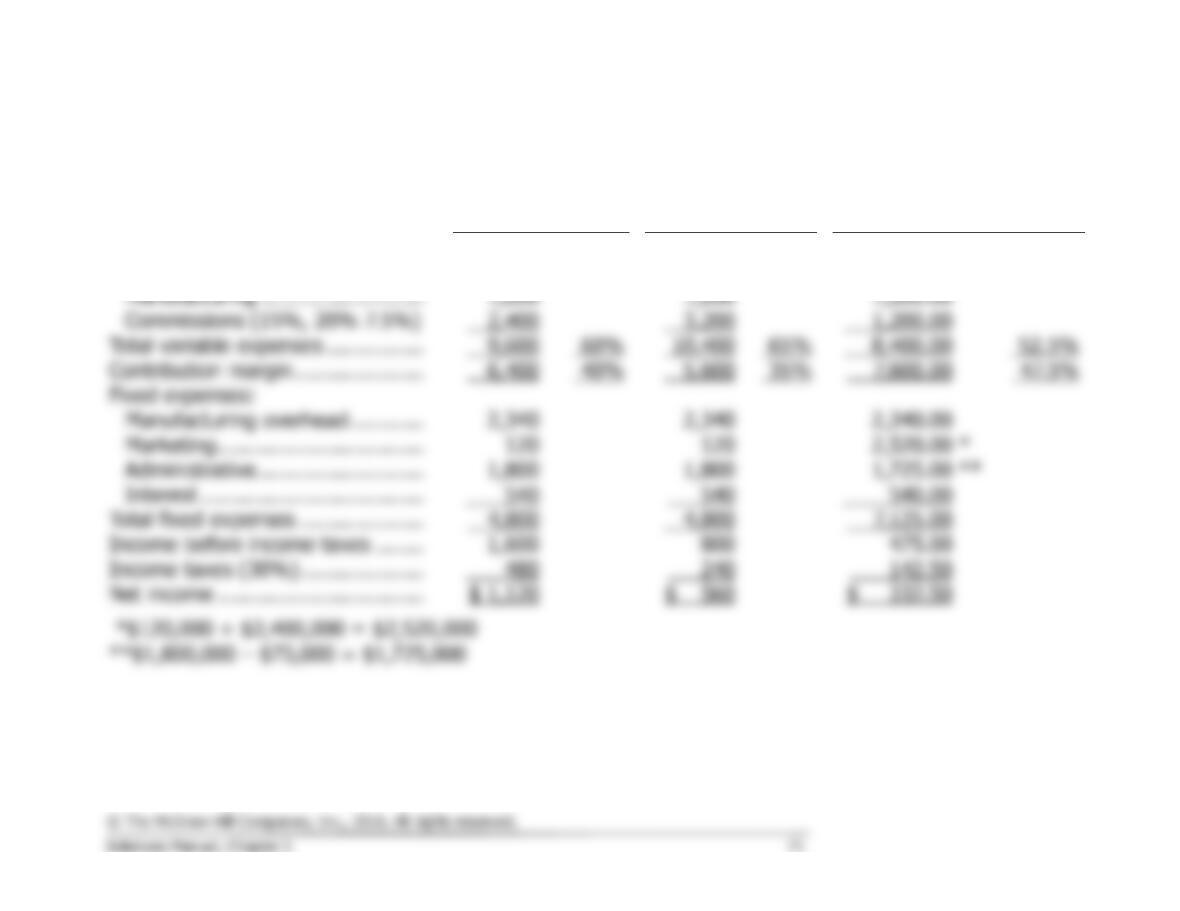
Before proceeding with the solution, it is helpful first to restructure the data into contribution format for
each of the three alternatives. (The data in the statements below are in thousands.)
15% Commission
20% Commission
Own Sales Force
Sales ……………………………………
$16,000
100%
$16,000
100%
$16,000.00
100.0%
Variable expenses:
2,400
1,200.00
Total variable expenses …………….
9,600
8,400.00
Contribution margin …………………
6,400
47.5%
Fixed expenses:
Total fixed expenses ………………..
4,800
Income before income taxes ……..
**$1,800,000 – $75,000 = $1,725,000
Case (continued)
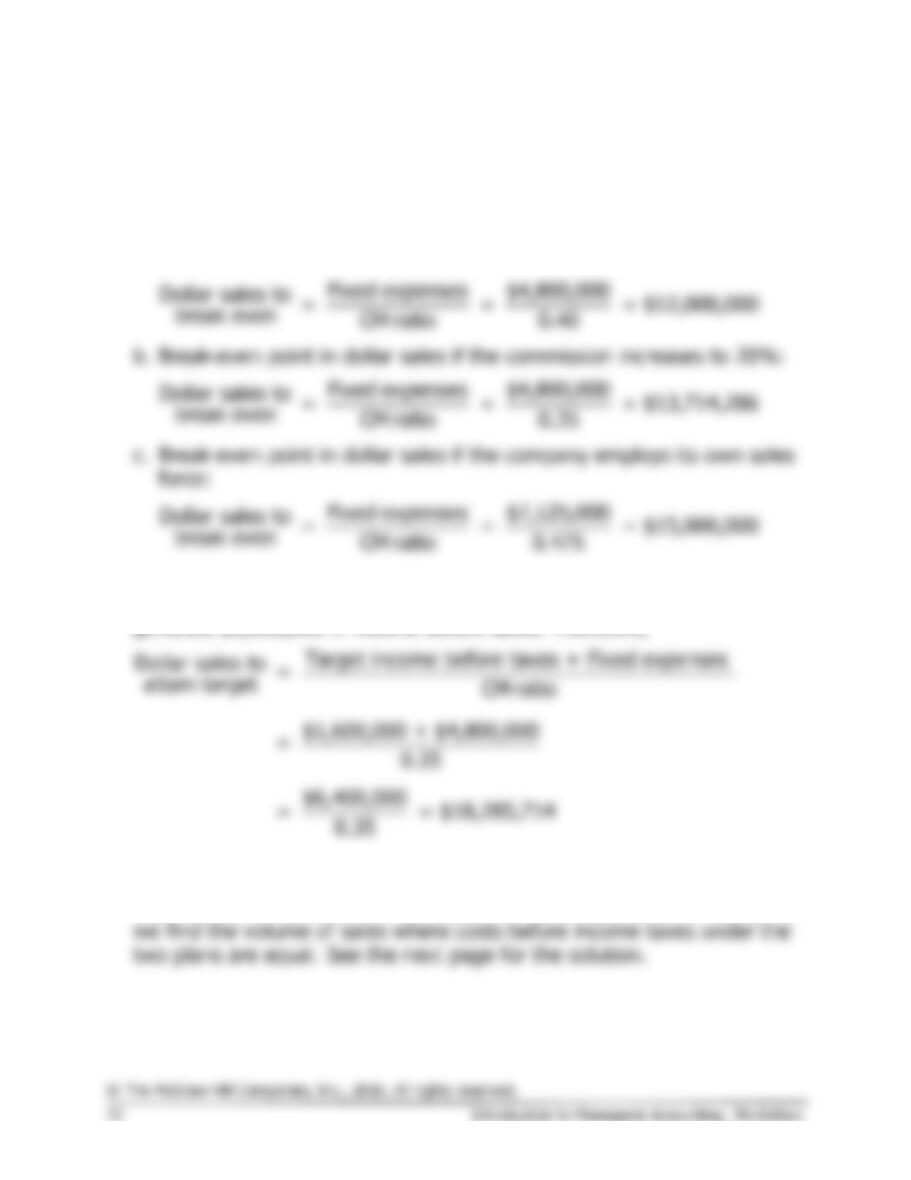
1. When the income before taxes is zero, income taxes will also be zero
and net income will be zero. Therefore, the break-even calculations can
be based on the income before taxes.
a. Break–even point in dollar sales if the commission remains 15%:
2. In order to generate a $1,120,000 net income, the company must
3. To determine the volume of sales at which net income would be equal
under either the 20% commission plan or the company sales force plan,
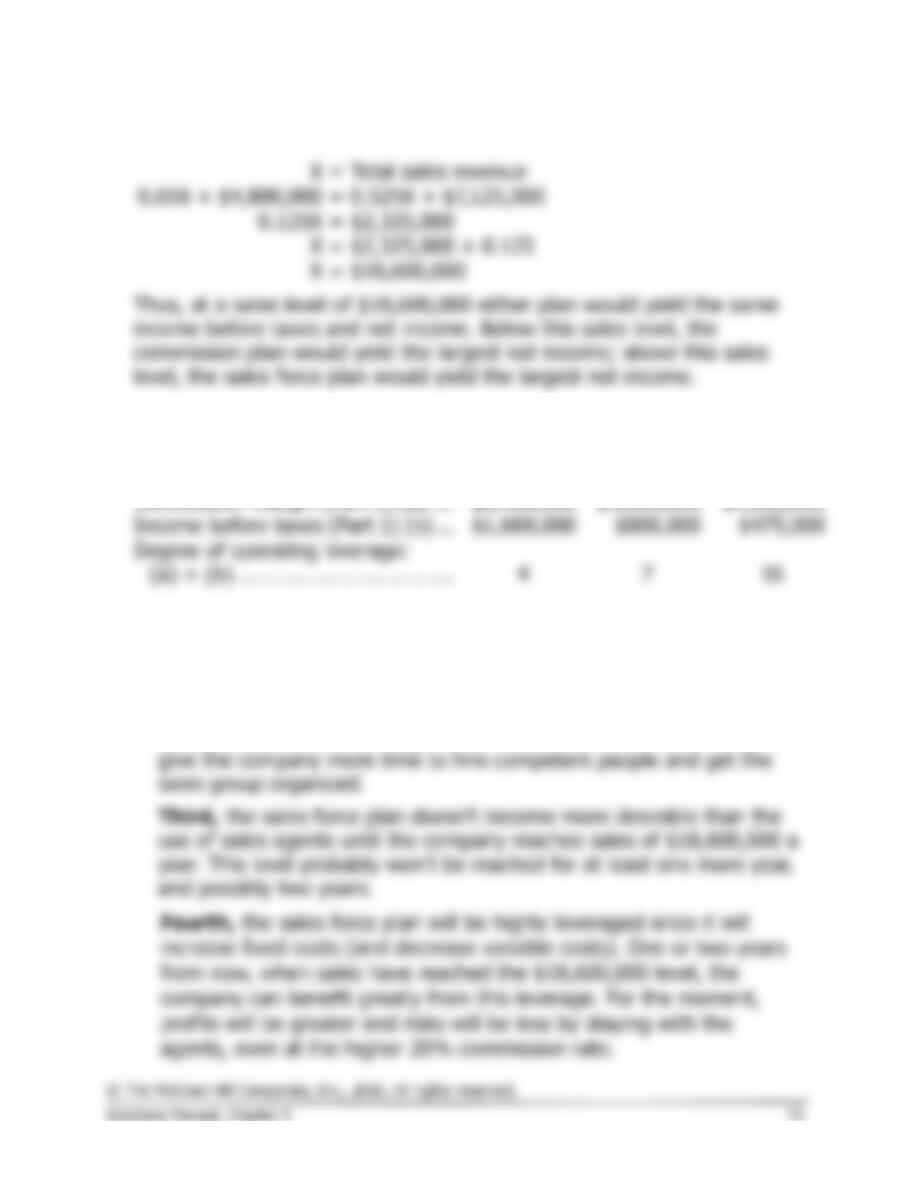
Case (continued)
Total sales revenue
0.525X + $7,125,000
$2,325,000
$2,325,000 ÷ 0.125
4. a., b., and c.
15%
Commission
20%
Commission
Own
Sales Force
Contribution margin (Part 1) (a) ….
Income before taxes (Part 1) (b) …
5. We would continue to use the sales agents for at least one more year,
and possibly for two more years. The reasons are as follows:
First, use of the sales agents would have a less dramatic effect on
net income.
Second, use of the sales agents for at least one more year would
Analytical Thinking (60 minutes)
Note: This is a problem that will challenge the very best students’ conceptual
and analytical skills. However, working through this case will yield substantial
dividends in terms of a much deeper understanding of critical management
accounting concepts.
1. The overall break-even sales can be determined using the CM ratio.
Velcro
Metal
Nylon
Total
Sales ……………………….
$165,000
$300,000
$340,000
$805,000
Variable expenses ………
Contribution margin …….
$160,000
$240,000
Fixed expenses…………..
Net operating income ….
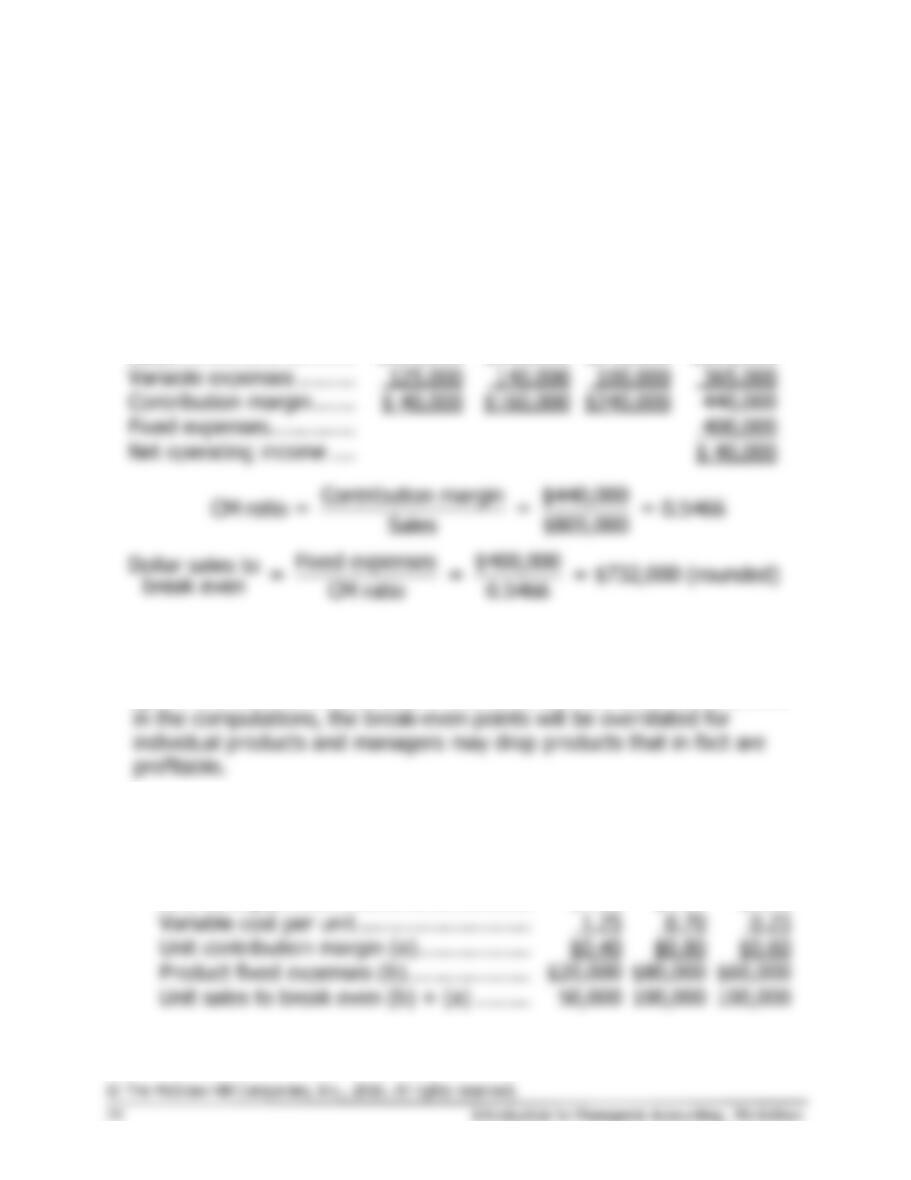
2. The issue is what to do with the common fixed cost when computing
the break-evens for the individual products. The correct approach is to
ignore the common fixed costs. If the common fixed costs are included
a. The break-even points for each product can be computed using the
contribution margin approach as follows:
Velcro
Metal
Nylon
Unit selling price ……………………………..
$1.65
$1.50
$0.85
Variable cost per unit ……………………….
Unit contribution margin (a) ………………
Product fixed expenses (b)………………..
Unit sales to break even (b) ÷ (a) ………
50,000
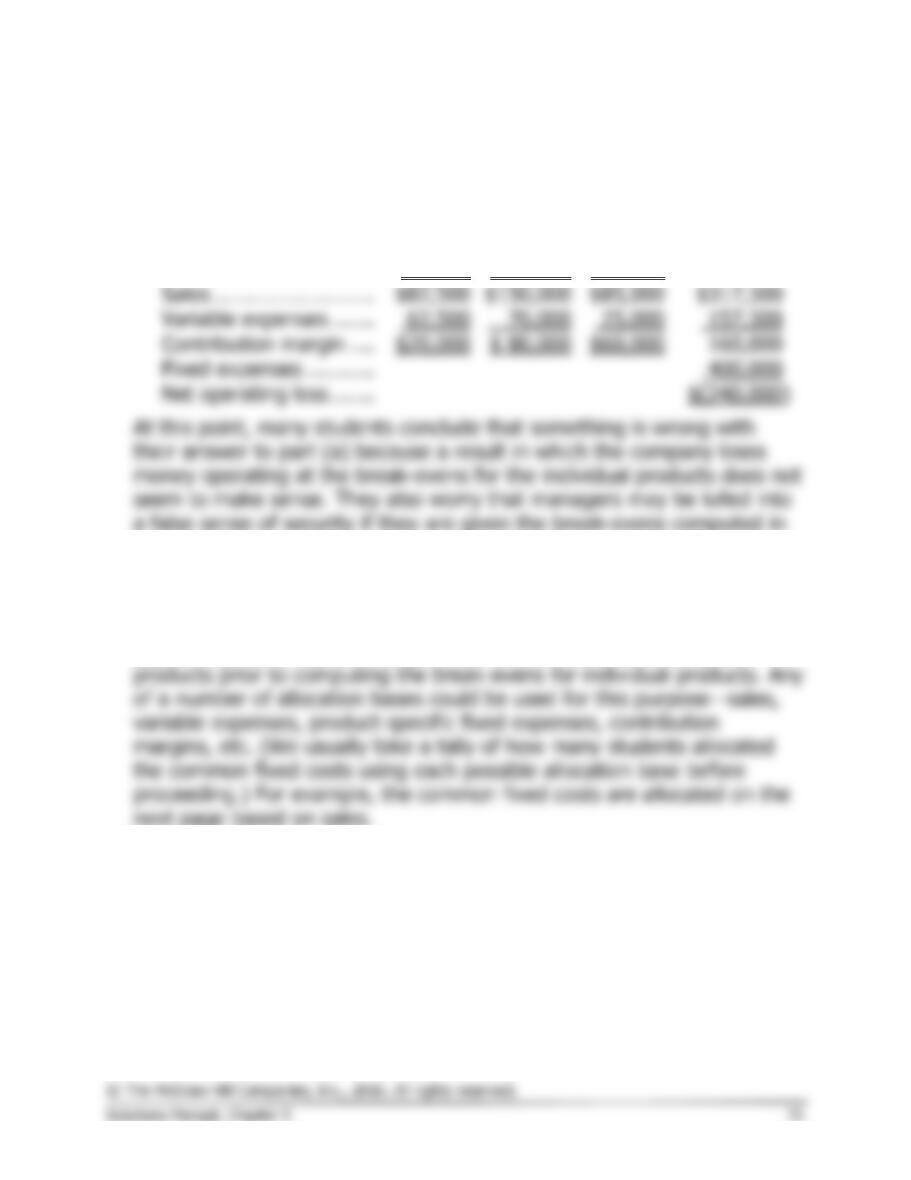
Analytical Thinking (continued)
b. If the company were to sell exactly the break-even quantities
computed above, the company would lose $240,000—the amount of
the common fixed cost. This can be verified as follows:
Velcro
Metal
Nylon
Total
Unit sales ……………….
50,000
100,000
100,000
Sales ……………………..
$82,500
$85,000
Variable expenses …….
Contribution margin ….
Fixed expenses ………..
Net operating loss …….
part (a). Total sales at the individual product break-evens is only
$317,500, whereas the total sales at the overall break-even computed in
part (1) is $732,000.
Many students (and managers, for that matter) attempt to resolve this
apparent paradox by allocating the common fixed costs among the