Wild and Shaw, Financial & Managerial Accounting, 8e Solutions Manual: Chapter 5
343
Exercise 5-15A (20 minutes)
Periodic Inventory
Ending
Inventory
Cost of
Goods Sold
a. Specific Identification
(50 x $2.80) + (10 x $2.00) ……………………………….
$160.00
$2,540.00 [Goods Available] – $160.00 [Ending Inventory] …….
$2,380.00
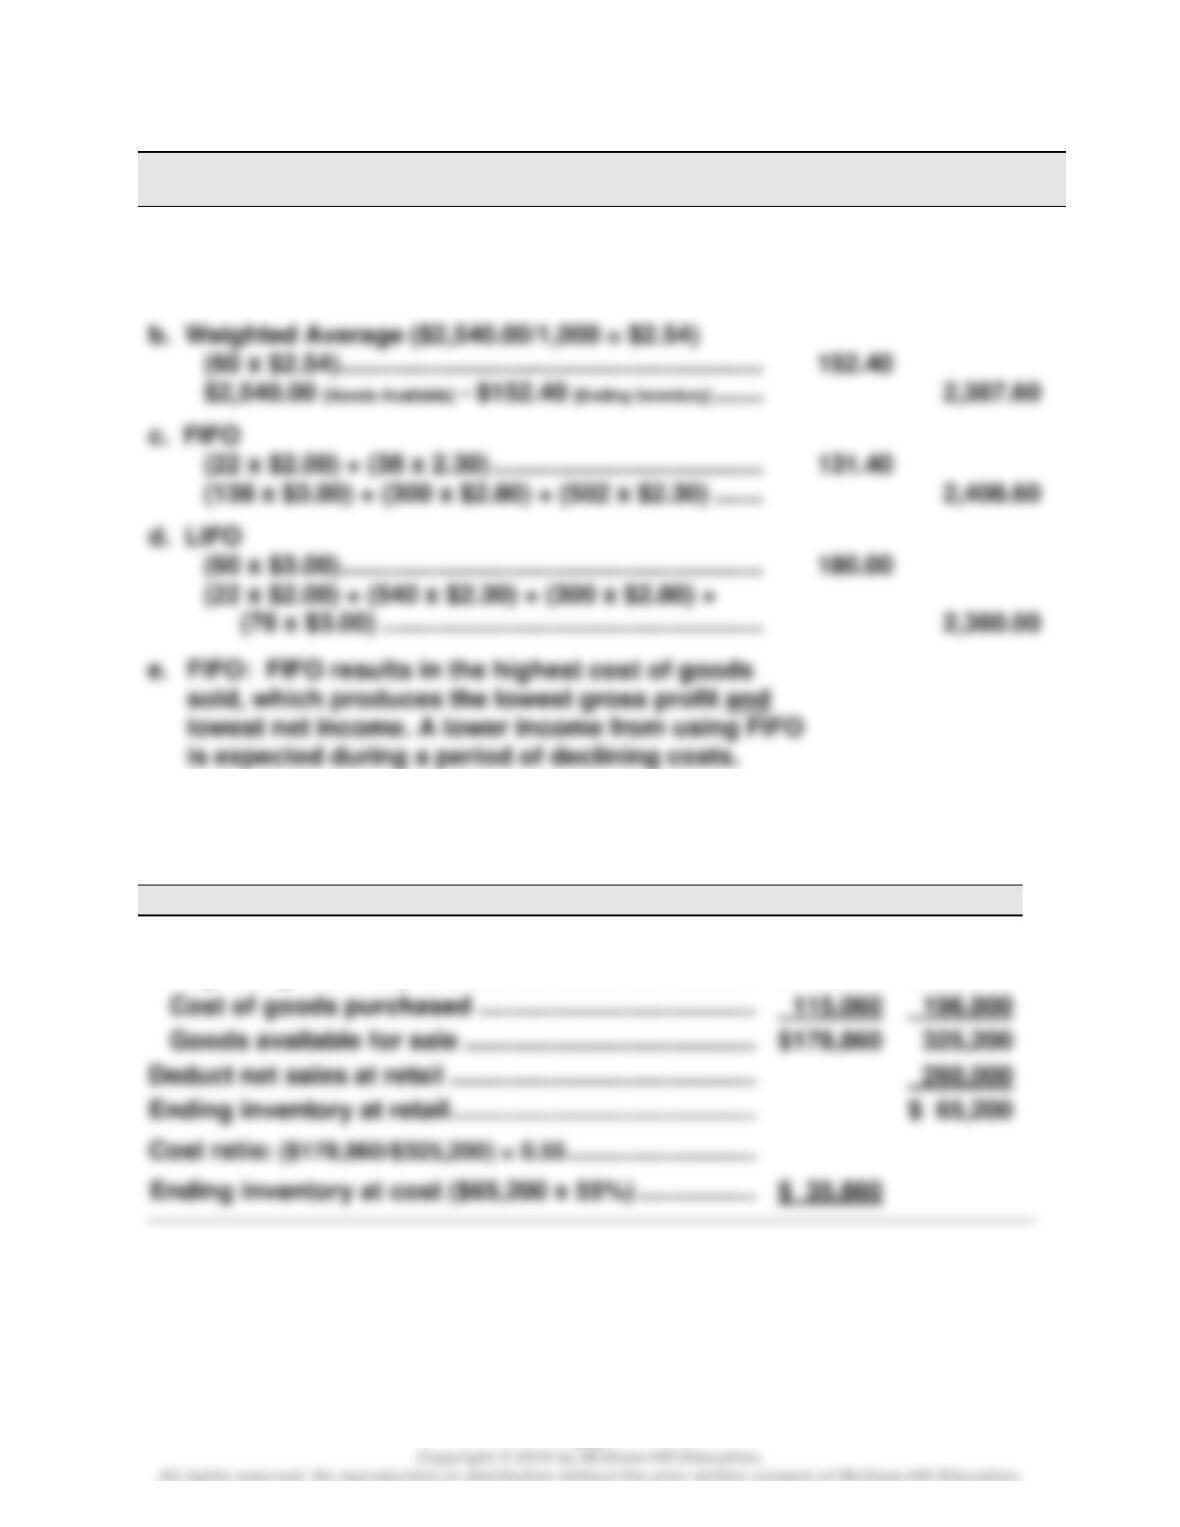
(60 x $2.54)…………………………………………………….
$2,540.00 [Goods Available] – $152.40 [Ending Inventory] …….
c. FIFO
(138 x $3.00) + (300 x $2.80) + (502 x $2.30) …….
(60 x $3.00)…………………………………………………….
Exercise 5-16B (20 minutes)
At Cost
At Retail
Goods available for sale
Beginning inventory ……………………………………………
$ 63,800
$128,400
Cost of goods purchased ……………………………………
Goods available for sale ……………………………………..
$178,860
Wild and Shaw, Financial & Managerial Accounting, 8e Solutions Manual: Chapter 5
344
Exercise 5-17B (20 minutes)
Goods available for sale
Beginning inventory, January 1 …………………………..
$ 225,000
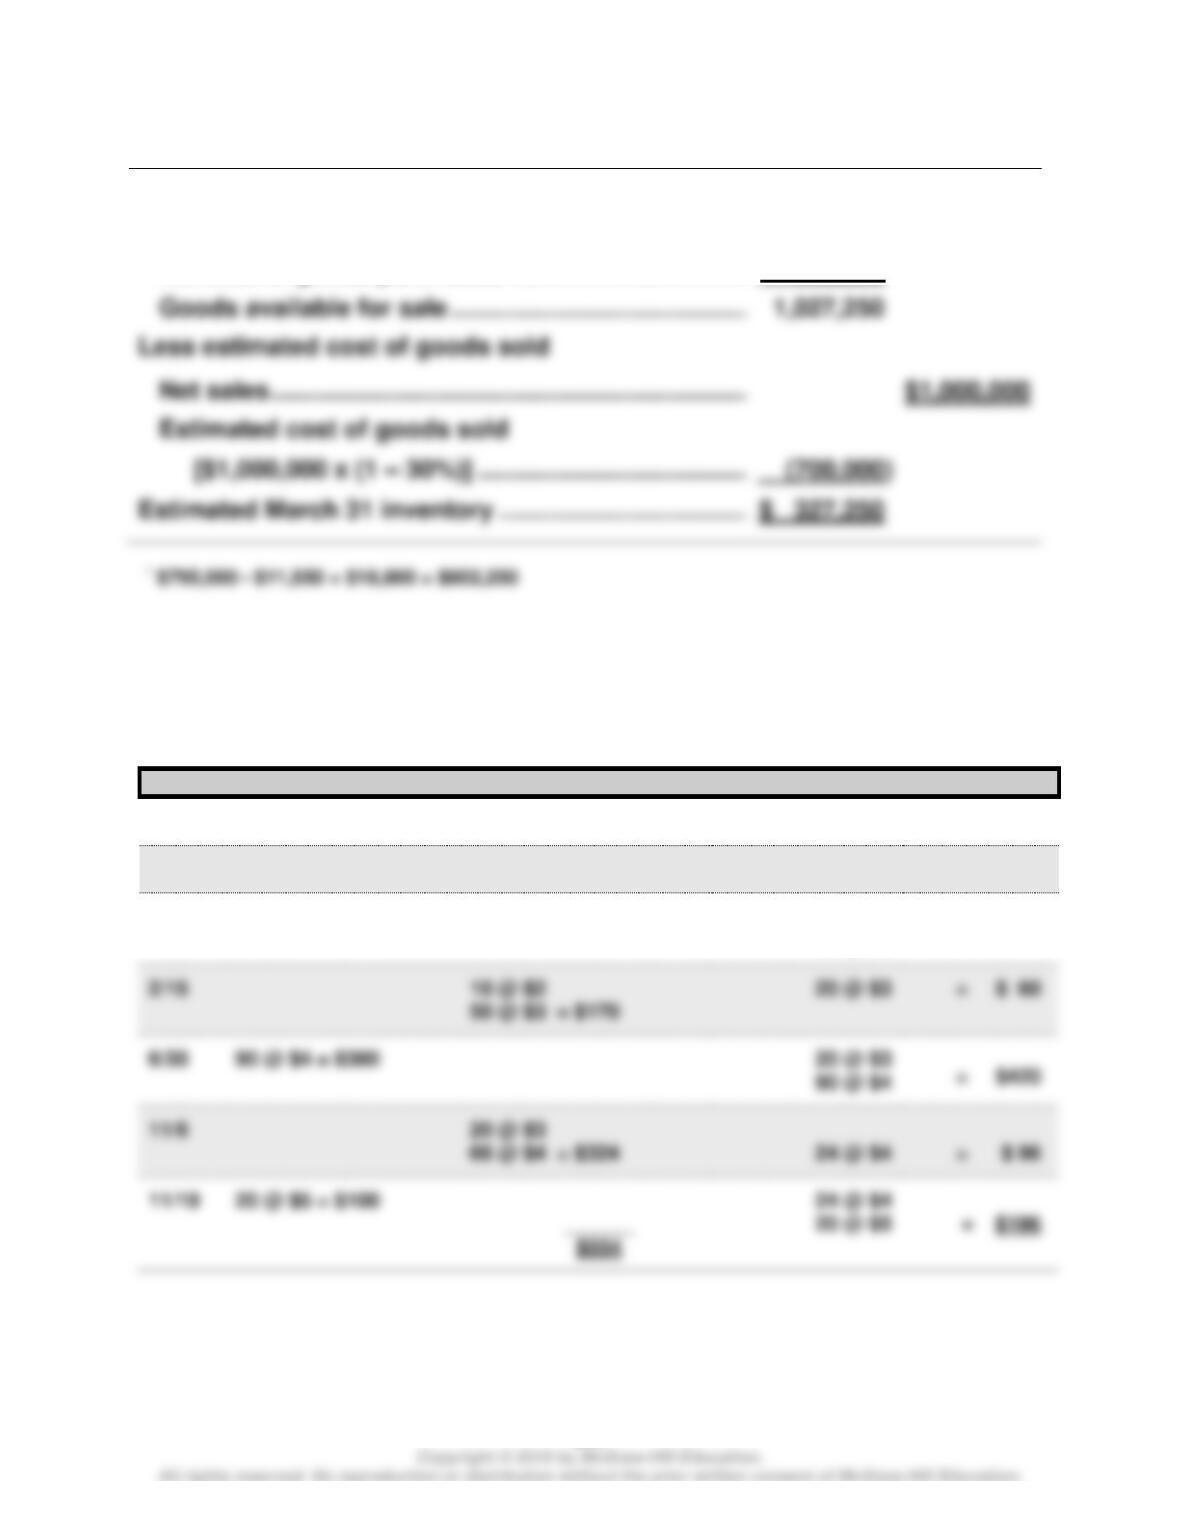
Net cost of goods purchased* ………………………………..
802,250
Net sales ……………………………………………………………….
Exercise 5-18 (20 minutes)
a. FIFO—Perpetual
Date
Goods Purchased
Cost of Goods Sold
Inventory Balance
1/1
40 @ $2
= $ 80
1/3
30 @ $2 = $ 60
10 @ $2
= $ 20
2/14
70 @ $3 = $210
10 @ $2
= $230
70 @ $3
2/15
10 @ $2
50 @ $3 = $170
6/30
90 @ $4 = $360
20 @ $3
= $420
90 @ $4
11/6
20 @ $3
11/19
20 @ $5 = $100
24 @ $4
______
20 @ $5
$554
345
Exercise 5-18 (Concluded)
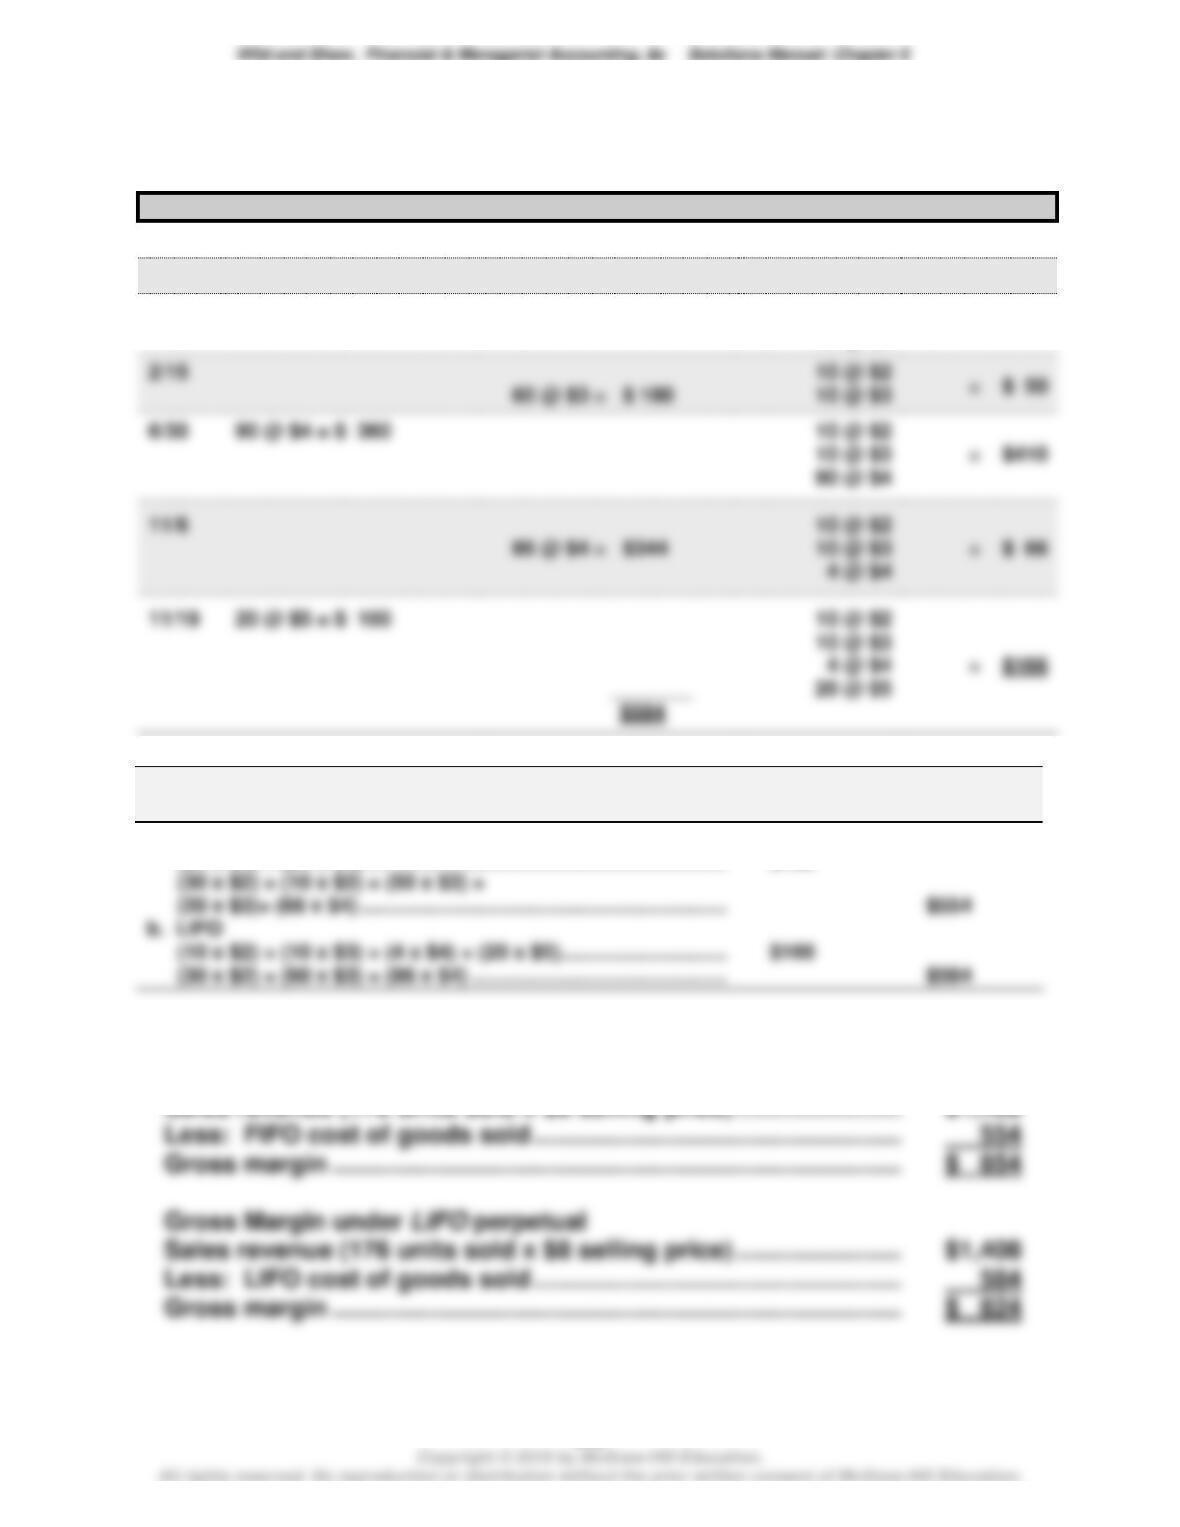
b. LIFO—Perpetual
Date
Goods Purchased
Cost of Goods Sold
Inventory Balance
1/1
40 @ $2
= $ 80
1/3
30 @ $2 = $ 60
10 @ $2
= $ 20
2/14
70 @ $3 = $ 210
10 @ $2
= $230
70 @ $3
2/15
10 @ $2
60 @ $3 = $ 180
10 @ $3
6/30
90 @ $4 = $ 360
10 @ $2
10 @ $3
11/6
86 @ $4 = $344
10 @ $3
11/19
20 @ $5 = $ 100
10 @ $2
10 @ $3
Ending Cost of
Alternate Solution Format Inventory Goods Sold
a. FIFO
(20 x $5) + (24 x $4) ……………………………………………………….. $196
c. Gross Margin Computations
Gross Margin under FIFO perpetual
Sales revenue (176 units sold x $8 selling price) ………………………
$1,408
346
Exercise 5-19A (20 minutes)
Ending Cost of
Periodic Inventory System Inventory Goods Sold
Instructor note: The assignment reports there are 220 units available for sale
and that 176 units are sold. Thus, we see that 44 units remain in inventory.
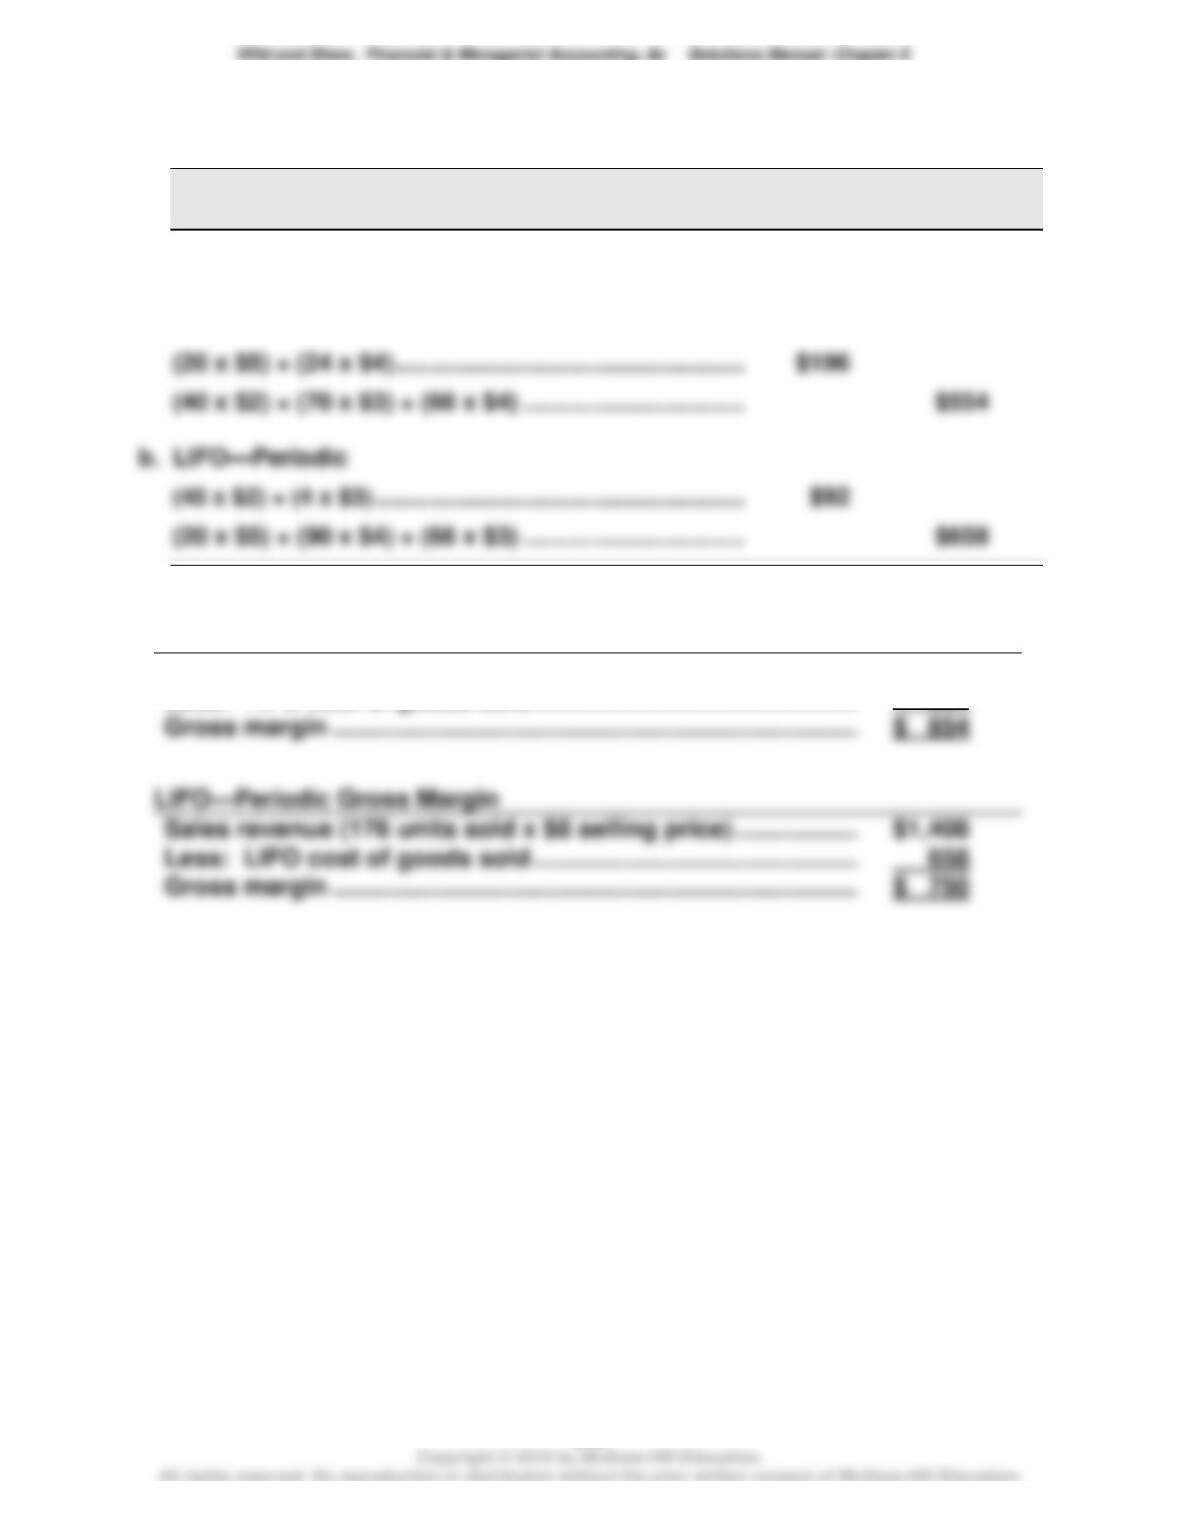
a. FIFO—Periodic
c.
FIFO—Periodic Gross Margin
Sales revenue (176 units sold x $8 selling price) ………………
$1,408
Less: FIFO cost of goods sold ………………………………………..
554
Gross margin ………………………………………………………………….
$ 854
Sales revenue (176 units sold x $8 selling price) ………………
$1,408
Less: LIFO cost of goods sold ………………………………………..
658
Wild and Shaw, Financial & Managerial Accounting, 8e Solutions Manual: Chapter 5
347
PROBLEM SET A
Problem 5-1A (40 minutes)
1. Compute cost of goods available for sale and units available for sale
Beginning inventory ………………………..
100 units @ $50.00
$ 5,000
400 units @ $55.00
120 units @ $60.00
200 units @ $62.00
Units available …………………………………
820 units
2. Units in ending inventory
Units available (from part 1) ………………………..
820 units
580 units
3a. FIFO perpetual
Date
Goods Purchased
Cost of Goods Sold
Inventory Balance
Mar. 1
100 @ $50.00 = $ 5,000
320 @ $55.00 = $17,600
Wild and Shaw, Financial & Managerial Accounting, 8e Solutions Manual: Chapter 5
348
Problem 5-1A (Continued)
3b. LIFO perpetual
Date
Goods Purchased
Cost of Goods Sold
Inventory Balance
Mar. 1
100 @ $50.00 = $ 5,000
Mar. 5
400@ $55.00= $22,000
100 @ $50.00
400 @ $55.00 = $27,000
Mar. 9
400 @ $55.00 = $22,000
120 @ $60.00
200 @ $62.00 = $23,600
Mar. 29
160 @ $62.00 = $ 9,920
120 @ $60.00
3c. Weighted Average perpetual
Date
Goods Purchased
Cost of Goods Sold
Inventory Balance
Mar. 1
100 @ $50.00 = $ 5,000
Mar. 5
400@ $55.00= $22,000
100 @ $50.00
400 @ $55.00 = $27,000
(avg. = $54.00)
(avg. = $54.00)
120 @ $60.00 = $11,520
120 @ $60.00
200 @ $62.00 = $23,920
(avg. = $59.80)
240 @ $59.80 = $14,352
349
Problem 5-1A (Concluded)
3d. Specific Identification
Cost of goods sold— 80 units from beginning inventory
340 units from March 5 purchase
4.
FIFO
LIFO
Weighted
Average
Specific
Identifi-
cation
Sales* ………………………………..
$50,900
$50,900
$50,900
$50,900
Wild and Shaw, Financial & Managerial Accounting, 8e Solutions Manual: Chapter 5
350
Problem 5-2A (40 minutes)
1. Compute cost of goods available for sale and units available for sale
Beginning inventory ………………………
100 units @ $50.00
$ 5,000
Units available ……………………………….
2. Units in ending inventory
Units available (from part 1) ……………………….
820 units
580 units
3.
Periodic Inventory
Ending
Inventory
Cost of
Goods Sold
a. FIFO
(200 x $62.00) + (40 x $60.00) …………………………...
$14,800.00
(100 x $50.00) + (400 x $55.00) + (80 x $60.00) …..
$31,800.00
(100 x $50.00) + (140 x $55.00) ………………………….
$12,700.00
c. Weighted average ($46,600/820 = $56.83)
(240 x $56.83) ………………………………………………….
$13,639.20
(20 x $50)+(60 x $55)+(80 x $60)+(80 x $62) ……….
$14,060.00
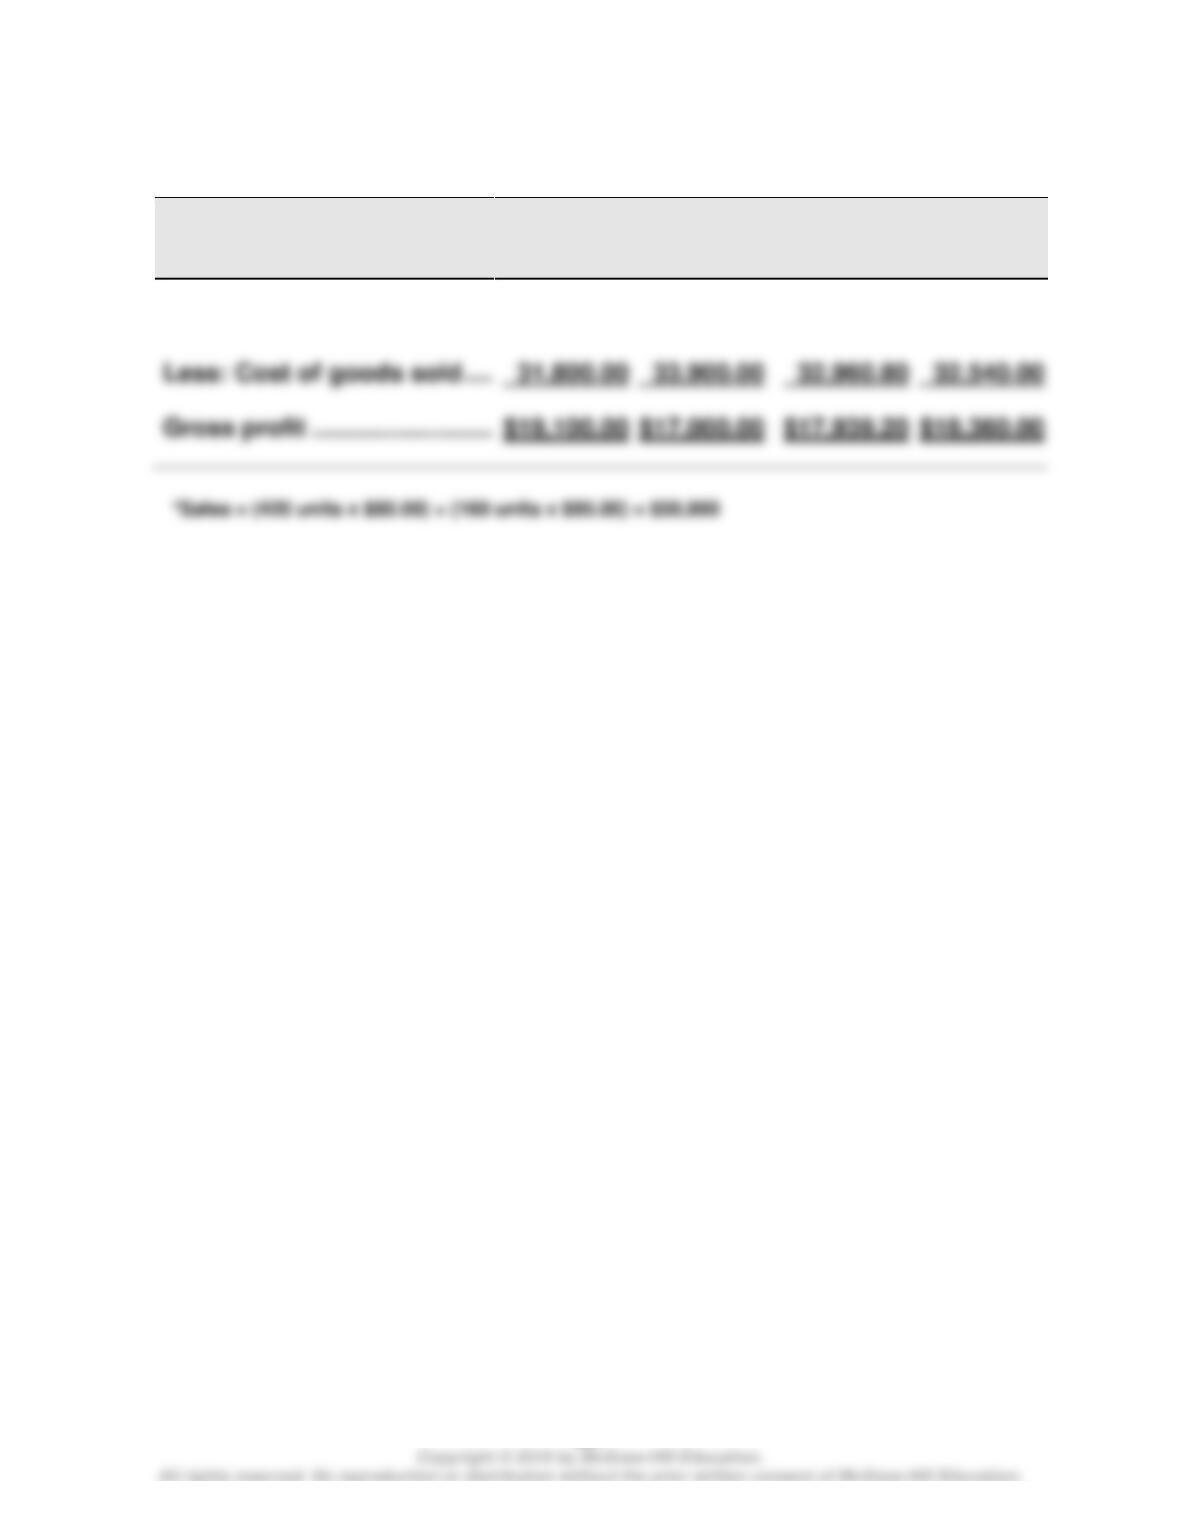
Wild and Shaw, Financial & Managerial Accounting, 8e Solutions Manual: Chapter 5
351
Problem 5-2A (Concluded)
4.
FIFO
LIFO
Weighted
Average
Specific
Identifi-
cation
Sales* ………………………………..
$50,900.00
$50,900.00
$50,900.00
$50,900.00
Less: Cost of goods sold ……
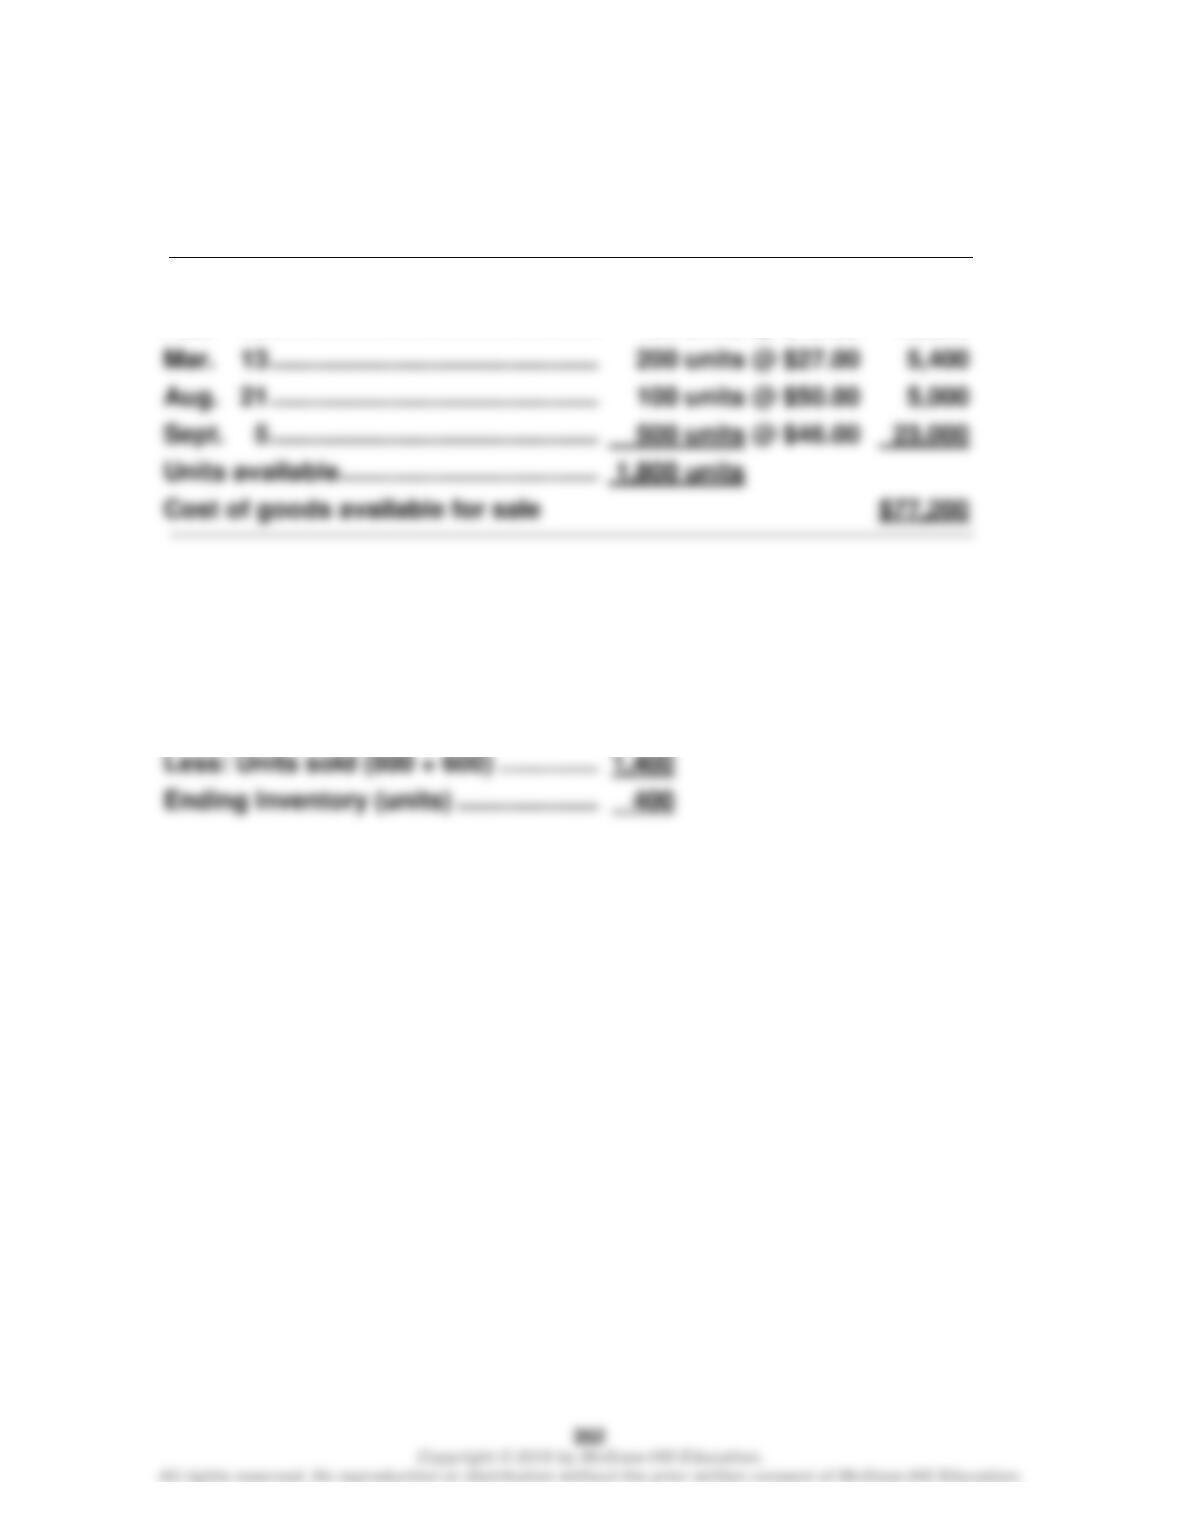
Wild and Shaw, Financial & Managerial Accounting, 8e Solutions Manual: Chapter 5
Problem 5-3A (40 minutes)
1. Calculate cost of goods available for sale and units available for sale
Beginning inventory ………………………..
600 units @ $45.00
$27,000
Feb. 10 ………………………………………….
400 units @ $42.00
16,800
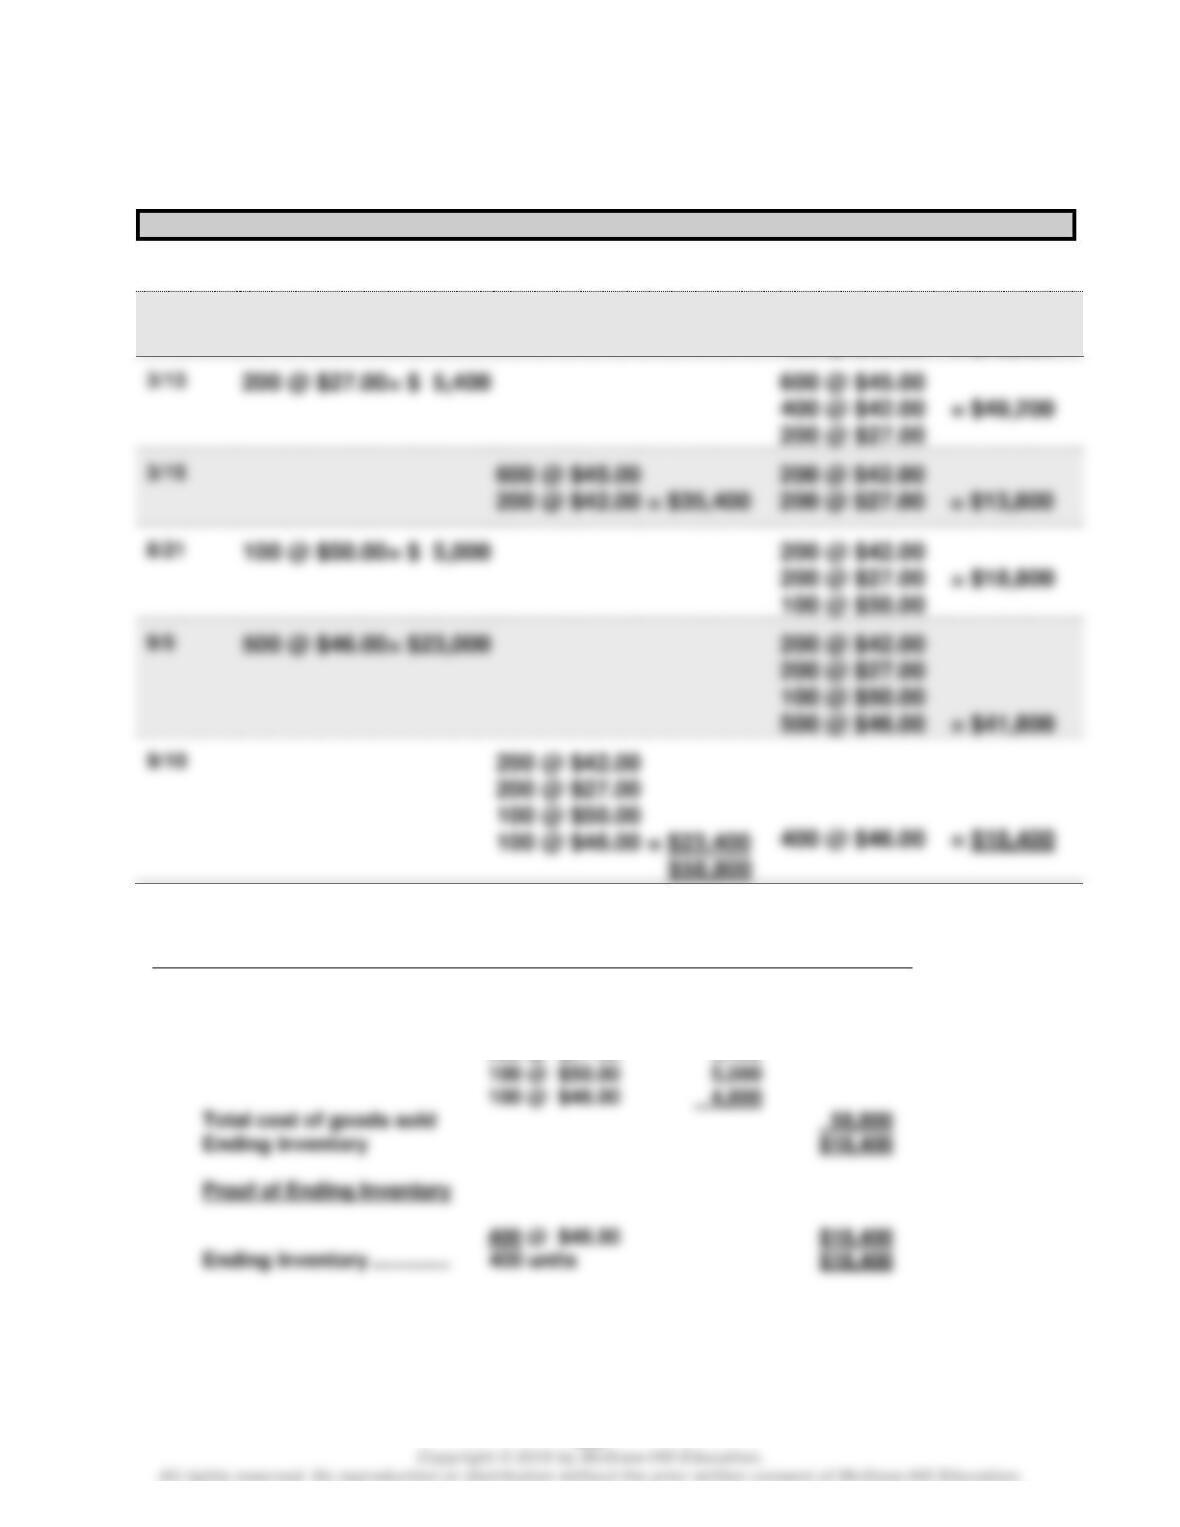
200 units @ $27.00
Aug. 21 ………………………………………….
100 units @ $50.00
500 units @ $46.00
Units available …………………………………
2. Units in ending inventory
Units available (from part 1) ………………………..
1,800
Wild and Shaw, Financial & Managerial Accounting, 8e Solutions Manual: Chapter 5
353
Problem 5-3A (Continued)
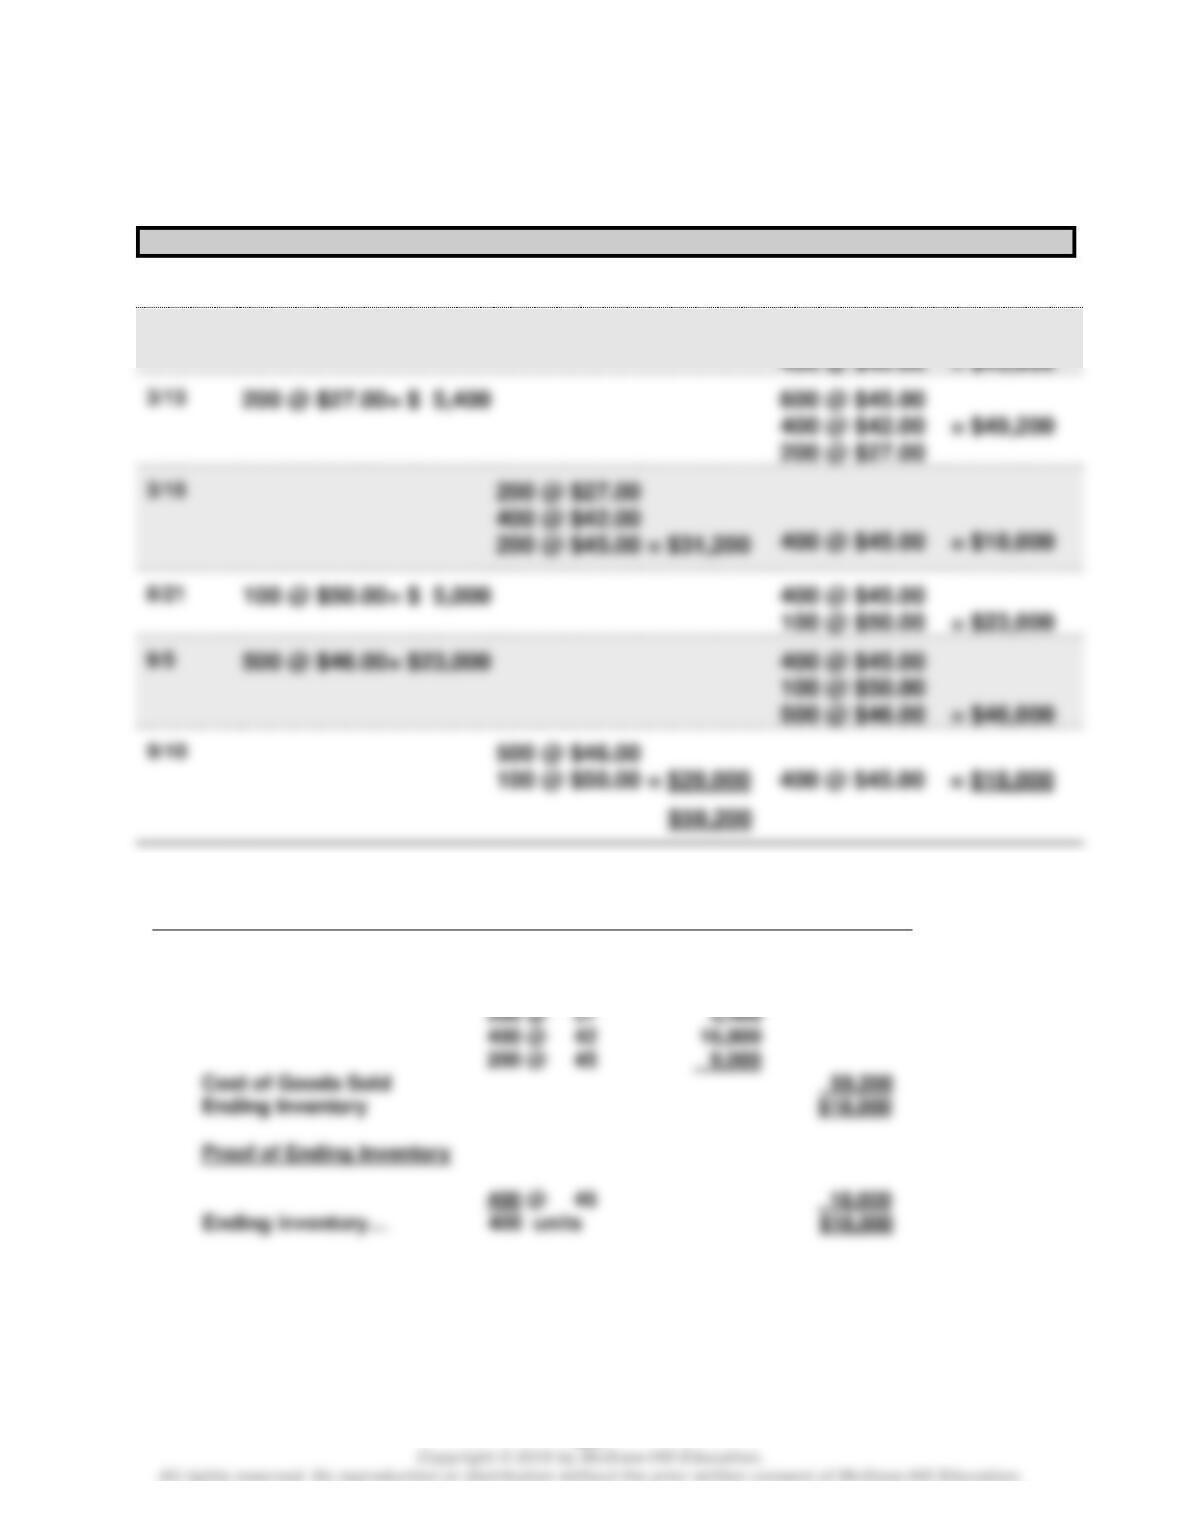
3a. FIFO perpetual
Date
Goods Purchased
Cost of Goods Sold
Inventory Balance
1/1
600 @ $45.00 = $27,000
2/10
400 @ $42.00= $16,800
600 @ $45.00
400 @ $42.00 = $43,800
400 @ $42.00 = $49,200
200 @ $27.00
200 @ $42.00 = $35,400
200 @ $27.00 = $13,800
200 @ $27.00 = $18,800
100 @ $50.00
100 @ $50.00
500 @ $46.00 = $41,800
100 @ $50.00
FIFO Alternate Solution Format
Cost of goods available for sale
$77,200
Less: Cost of sales
600 @ $45.00
$27,000
400 @ $42.00
16,800
200 @ $27.00
5,400
100 @ $50.00
5,000
100 @ $46.00
4,600
Total cost of goods sold
Ending Inventory
$18,400
Proof of Ending Inventory
$18,400
Wild and Shaw, Financial & Managerial Accounting, 8e Solutions Manual: Chapter 5
354
Problem 5-3A (Continued)
3b. LIFO perpetual
Date
Goods Purchased
Cost of Goods Sold
Inventory Balance
1/1
600 @ $45.00 = $27,000
2/10
400 @ $42.00= $16,800
400 @ $42.00 = $49,200
200 @ $45.00 = $31,200
100 @ $50.00= $ 5,000
400 @ $45.00
100 @ $50.00
500 @ $46.00
600 @ $45.00
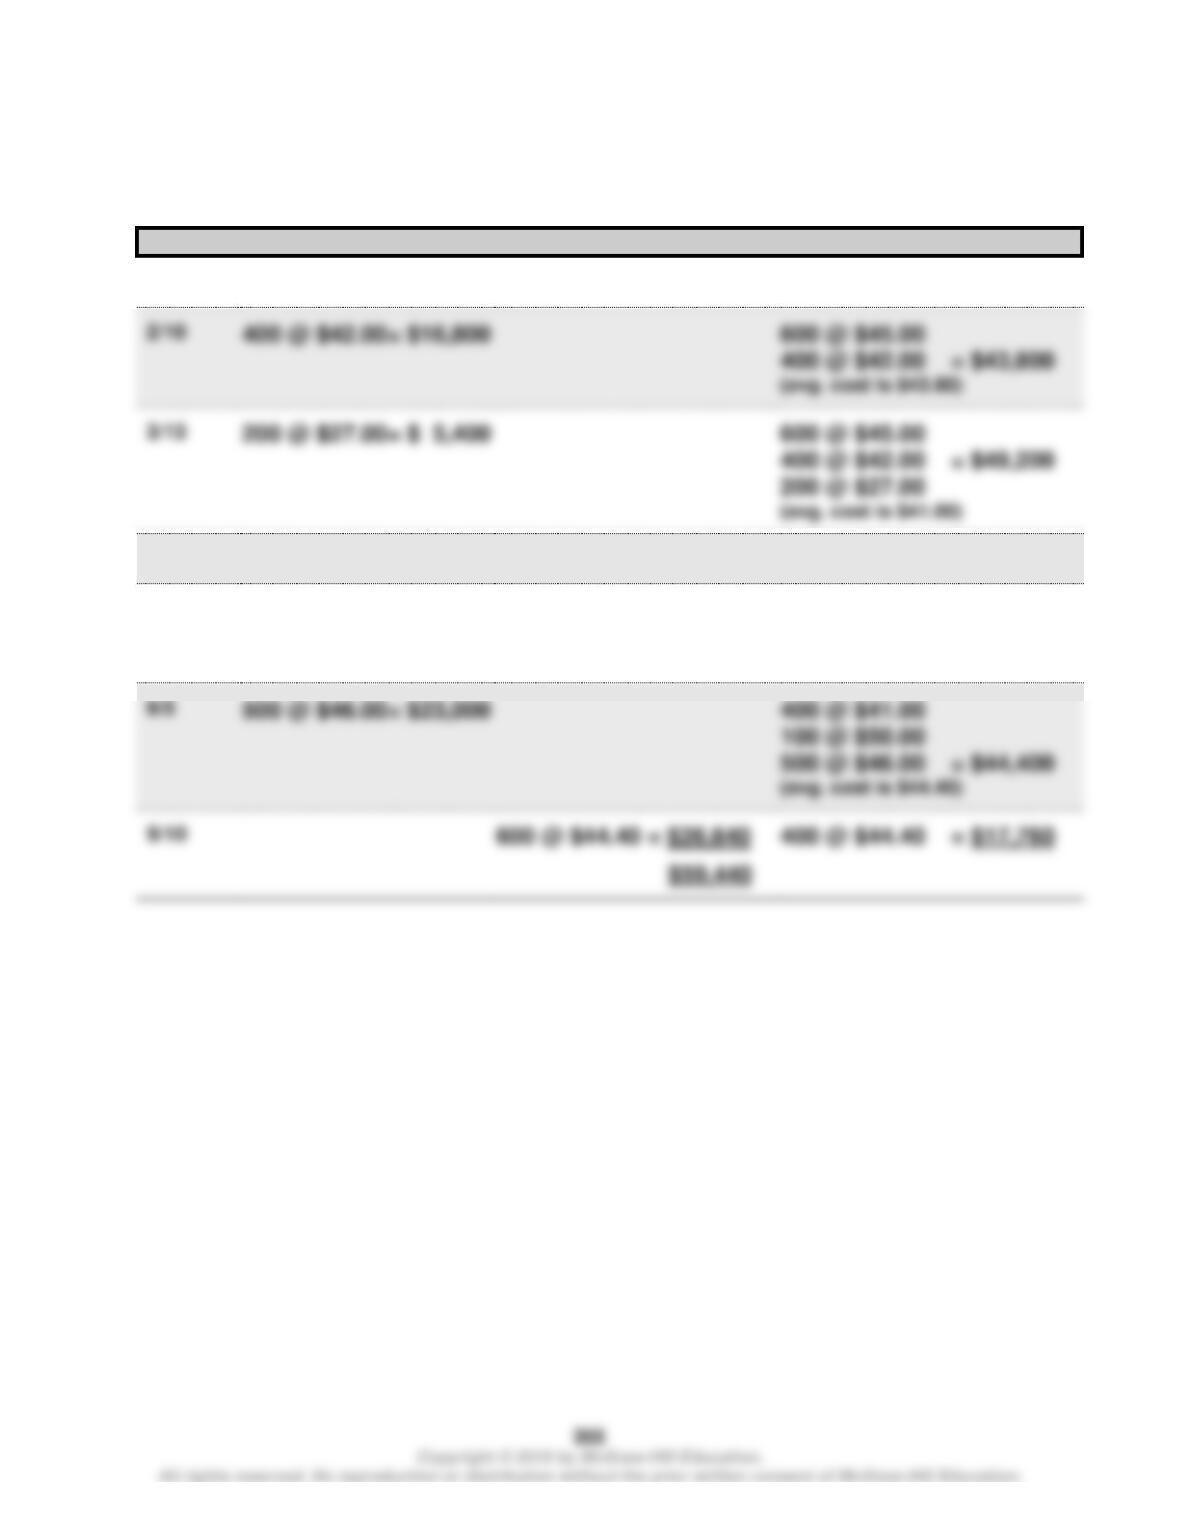
LIFO alternate solution format
Cost of goods available for sale
$77,200
Less: Cost of sales
500 @ $46
$23,000
100 @ 50
5,000
200 @ 27
5,400
400 @ 42
200 @ 45
Cost of Goods Sold
Ending Inventory
$18,000
Proof of Ending Inventory
Wild and Shaw, Financial & Managerial Accounting, 8e Solutions Manual: Chapter 5
Problem 5-3A (Continued)
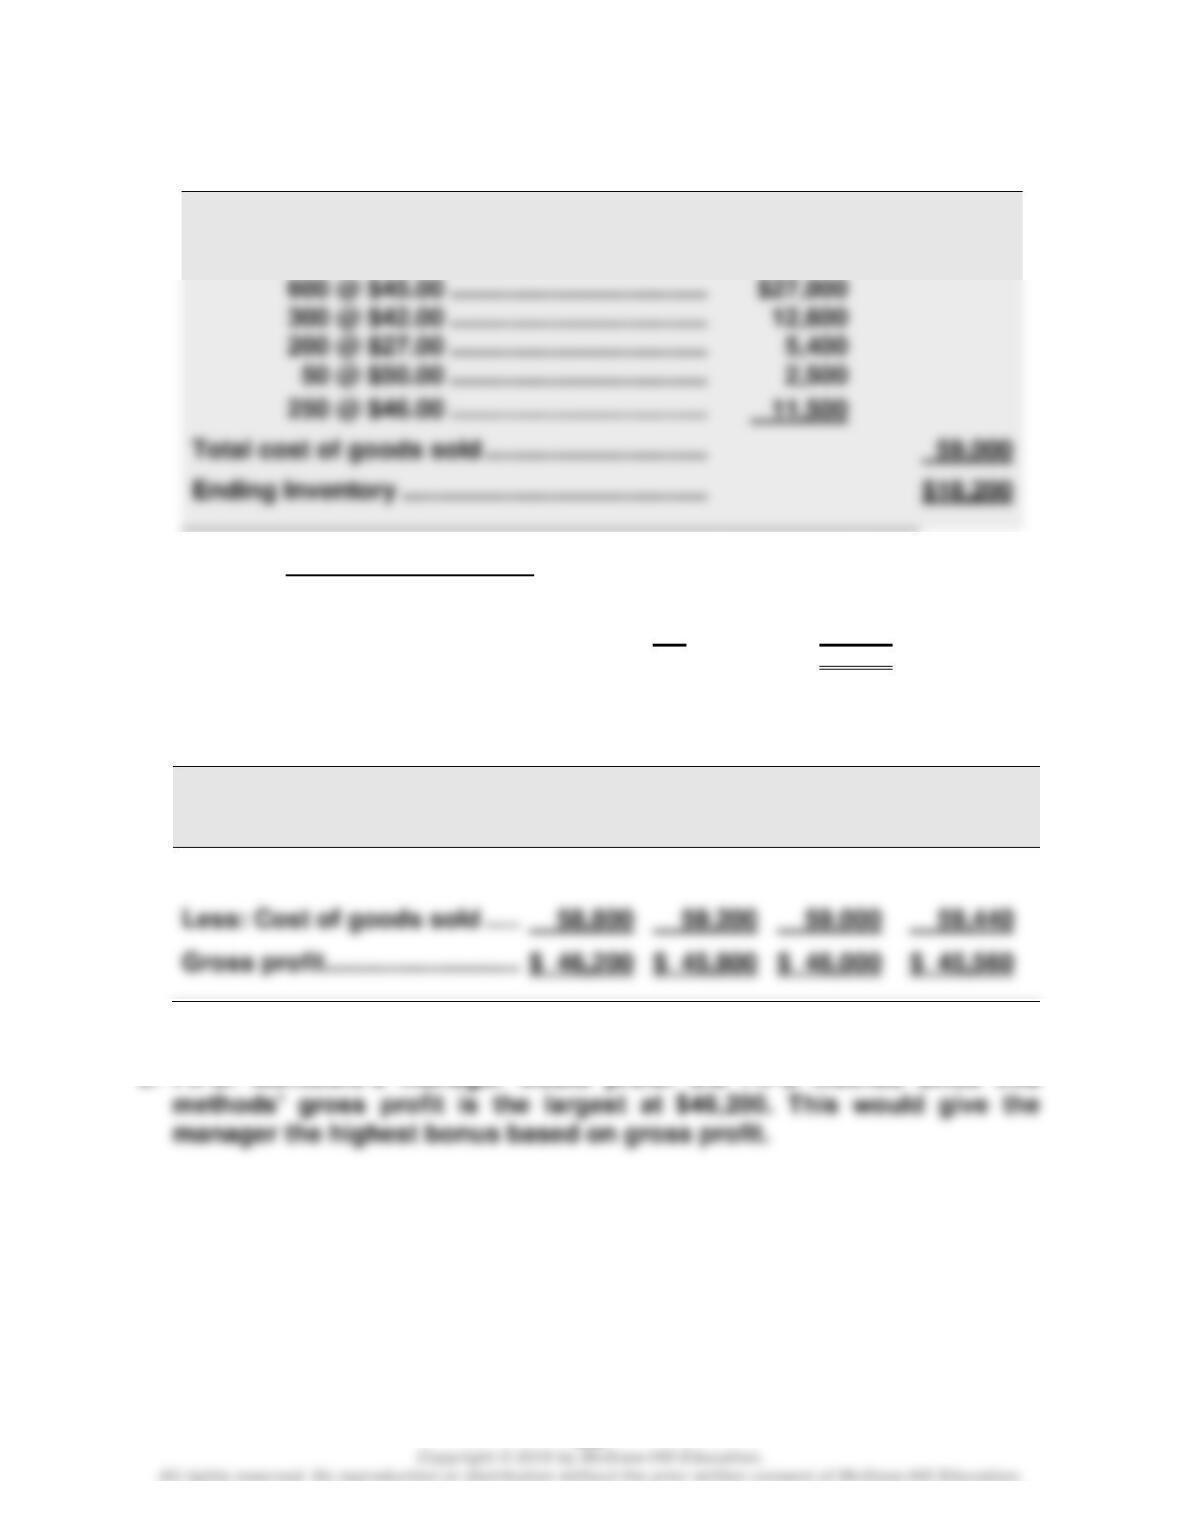
3c. Weighted Average
Date
Goods Purchased
Cost of Goods Sold
Inventory Balance
1/1
600 @ $45.00 = $27,000
2/10
400 @ $42.00= $16,800
600 @ $45.00
400 @ $42.00 = $43,800
(avg. cost is $43.80)
(avg. cost is $41.00)
3/15
800 @ $41.00 = $32,800
400 @ $41.00 = $16,400
8/21
100 @ $50.00= $ 5,000
400 @ $41.00
100 @ $50.00 = $21,400
(avg. cost is $42.80)
100 @ $50.00
500 @ $46.00 = $44,400
Wild and Shaw, Financial & Managerial Accounting, 8e Solutions Manual: Chapter 5
356
Problem 5-3A (Continued)
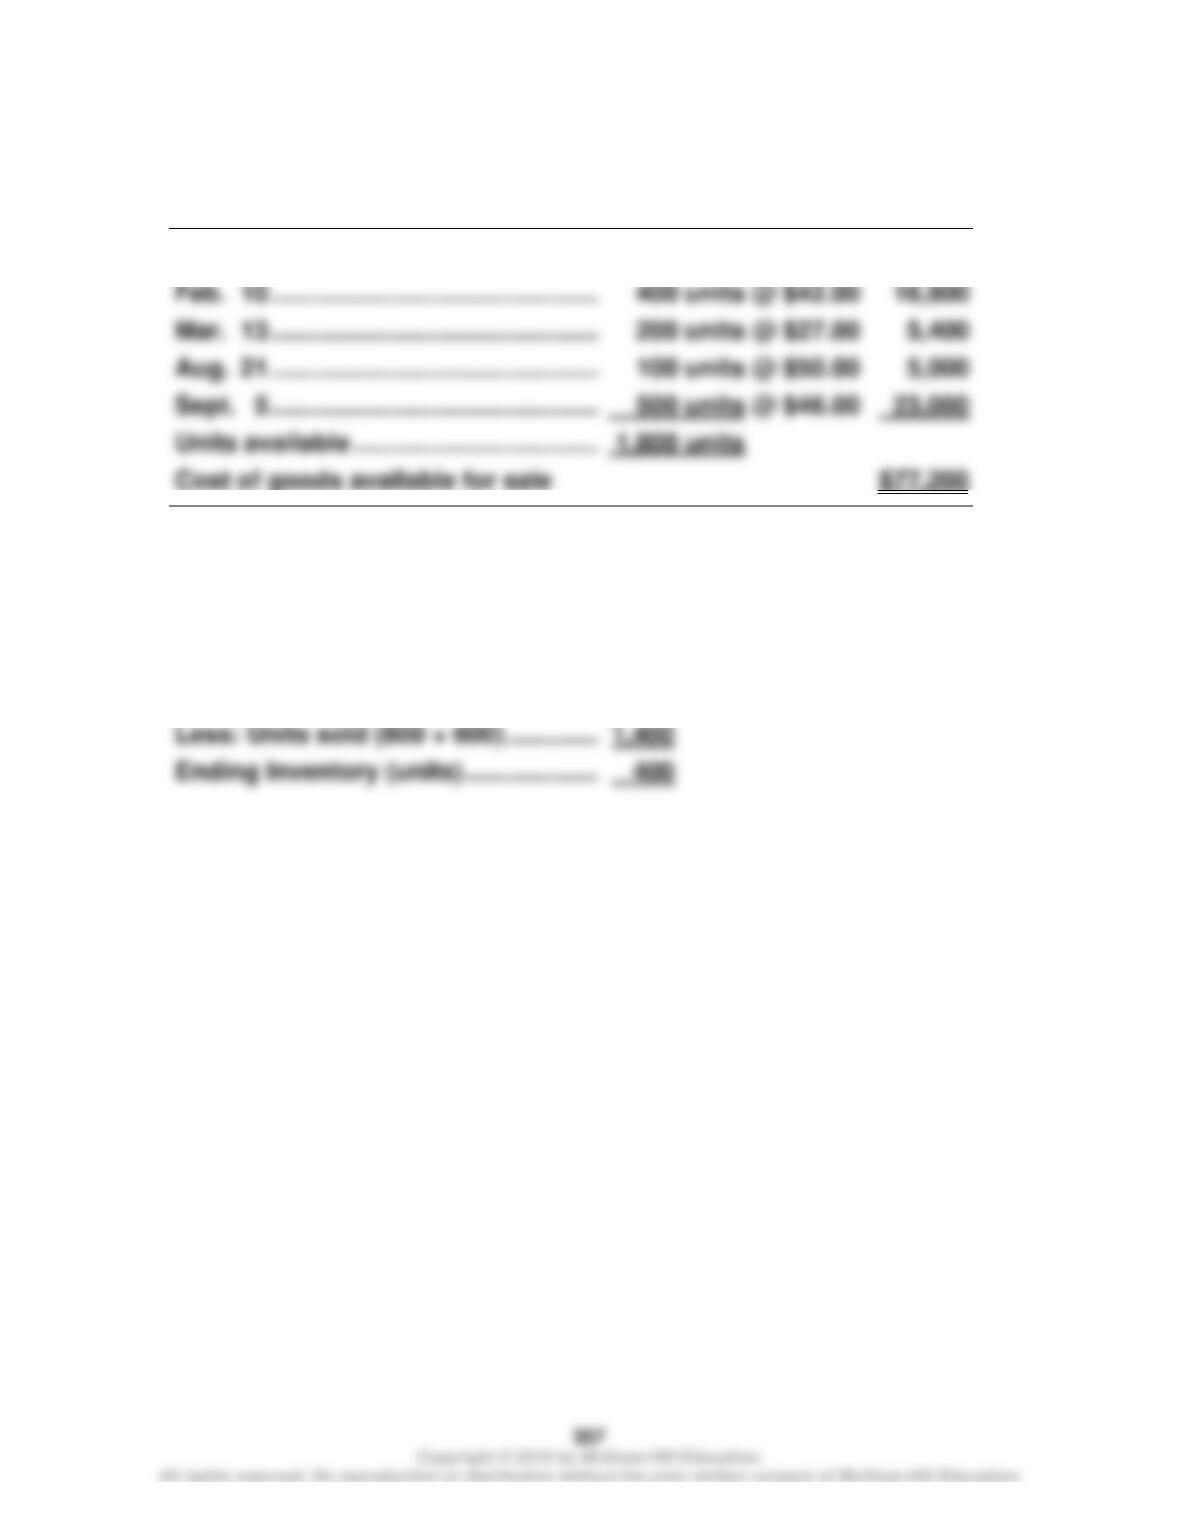
3d. Specific Identification
Cost of goods available for sale ……………….
$77,200
Less: Cost of Goods Sold
600 @ $45.00 ……………………………….
300 @ $42.00 ……………………………….
200 @ $27.00 ……………………………….
250 @ $46.00 ……………………………….
Total cost of goods sold …………………………..
Proof of Ending Inventory
100 @ $42
$ 4,200
50 @ $50
$ 2,500
250 @ $46
11,500
Ending Inventory……….
400 units
$18,200
4.
FIFO
LIFO
Specific
Identifi-
cation
Weighted
Average
Sales (1,400 x $75) ……………..
$105,000
$105,000
$105,000
$105,000
Less: Cost of goods sold ……
5. FIFO. Montoure’s manager would prefer the FIFO method since this
Wild and Shaw, Financial & Managerial Accounting, 8e Solutions Manual: Chapter 5
Problem 5-4A (40 minutes)
1. Calculate cost of goods available for sale and units available for sale
Beginning inventory ………………………
600 units @ $45.00
$27,000
400 units @ $42.00
200 units @ $27.00
Aug. 21 ………………………………………….
100 units @ $50.00
500 units @ $46.00
2. Units in ending inventory
Units available (from part 1) ……………………….
1,800
1,400
Wild and Shaw, Financial & Managerial Accounting, 8e Solutions Manual: Chapter 5
Problem 5-4A (Concluded)
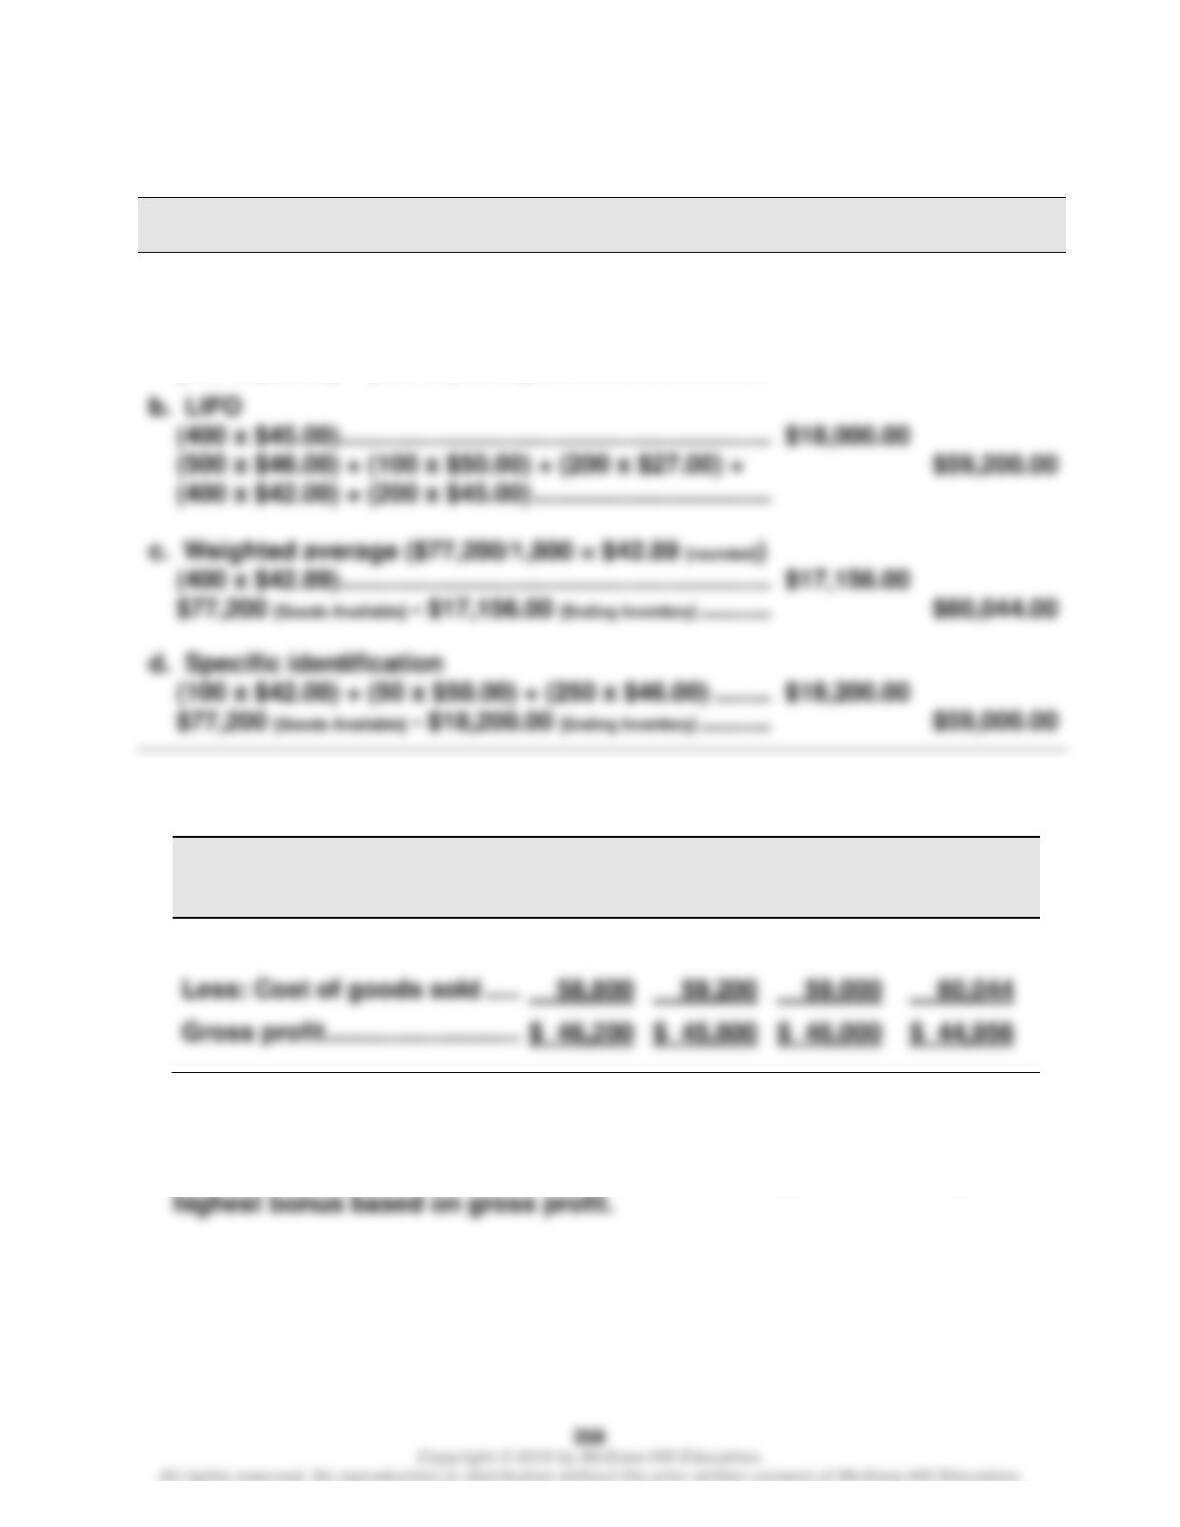
3.
Periodic Inventory
Ending
Inventory
Cost of
Goods Sold
a. FIFO
(400 x $46.00)………………………………………………………
$18,400.00
(600 x $45.00) + (400 x $42.00) + (200 x $27.00) +
(100 x $50.00) + (100 x $46.00) ……………………………..
$58,800.00
(400 x $45.00)………………………………………………………
$18,000.00
(400 x $42.00) + (200 x $45.00) ……………………………..
(400 x $42.89)………………………………………………………
$17,156.00
(100 x $42.00) + (50 x $50.00) + (250 x $46.00) ………
$18,200.00
4.
FIFO
LIFO
Specific
Identifi-
cation
Weighted
Average
Sales (1,400 x $75) ……………..
$105,000
$105,000
$105,000
$105,000
5. FIFO. The manager would prefer the FIFO method since this methods’
gross profit is the largest at $46,200. This would give the manager the
Wild and Shaw, Financial & Managerial Accounting, 8e Solutions Manual: Chapter 5
359
Problem 5-5A (50 minutes)
Per Unit
Total
Total
LCM Applied
to Items
Inventory Items
Units
Cost
Market
Cost
Market
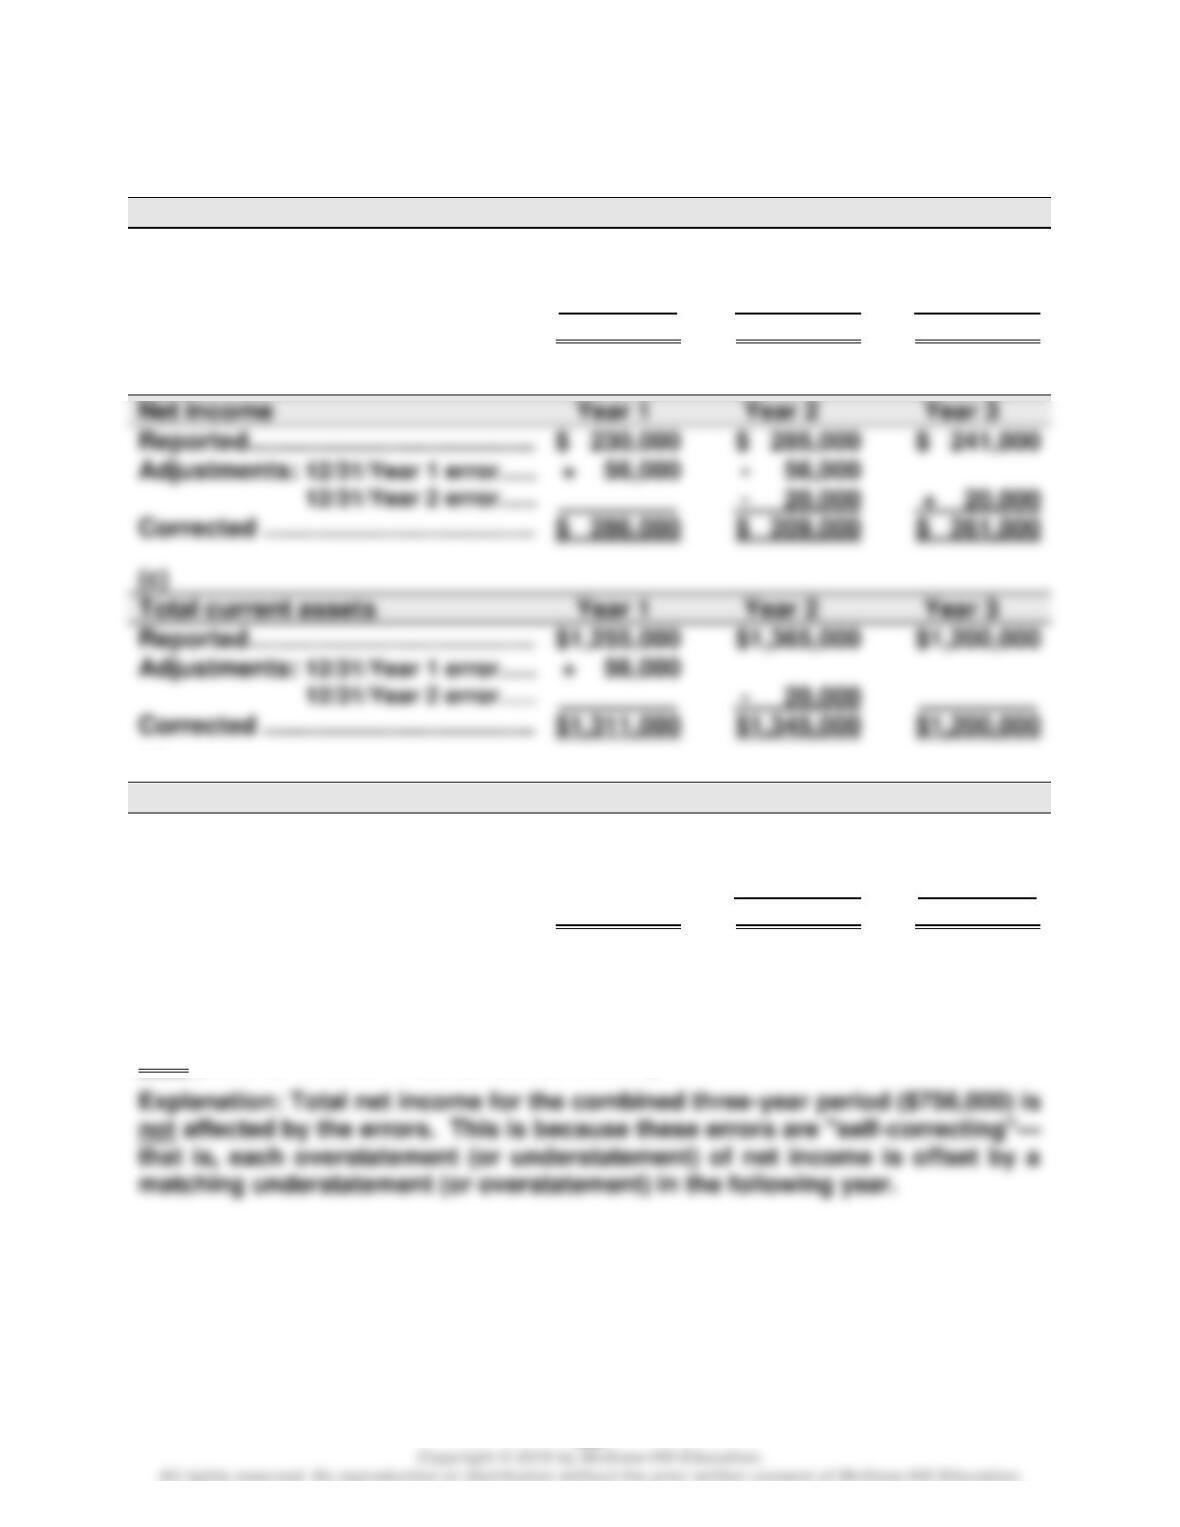
Car audio equipment
Speakers…………………
345
$ 90
$ 98
$ 31,050
$ 33,810
$ 31,050
Stereos ……………………
260
111
Amplifiers ……………….
326
Subwoofers …………….
204
10,608
Security equipment
Alarms …………………….
480
150
Locks………………………
291
Cameras …………………
212
310
65,720
68,264
Tripods ……………………
185
Stabilizers ……………….
170
16,490
17,850
1. Lower of cost or market for inventory applied separately = $273,054
2.
Dec 31
Cost of Goods Sold ……………………………………………..
19,723
Wild and Shaw, Financial & Managerial Accounting, 8e Solutions Manual: Chapter 5
360
Problem 5-6A (35 minutes)
Part 1
(a)
Cost of goods sold
Year 1
Year 2
Year 3
Reported …………………………………….
$ 615,000
$ 957,000
$ 780,000
Adjustments: 12/31/Year 1 error ………
– 56,000
+ 56,000
12/31/Year 2 error ………
.
+ 20,000
– 20,000
Corrected …………………………………..
$ 559,000
$1,033,000
$ 760,000
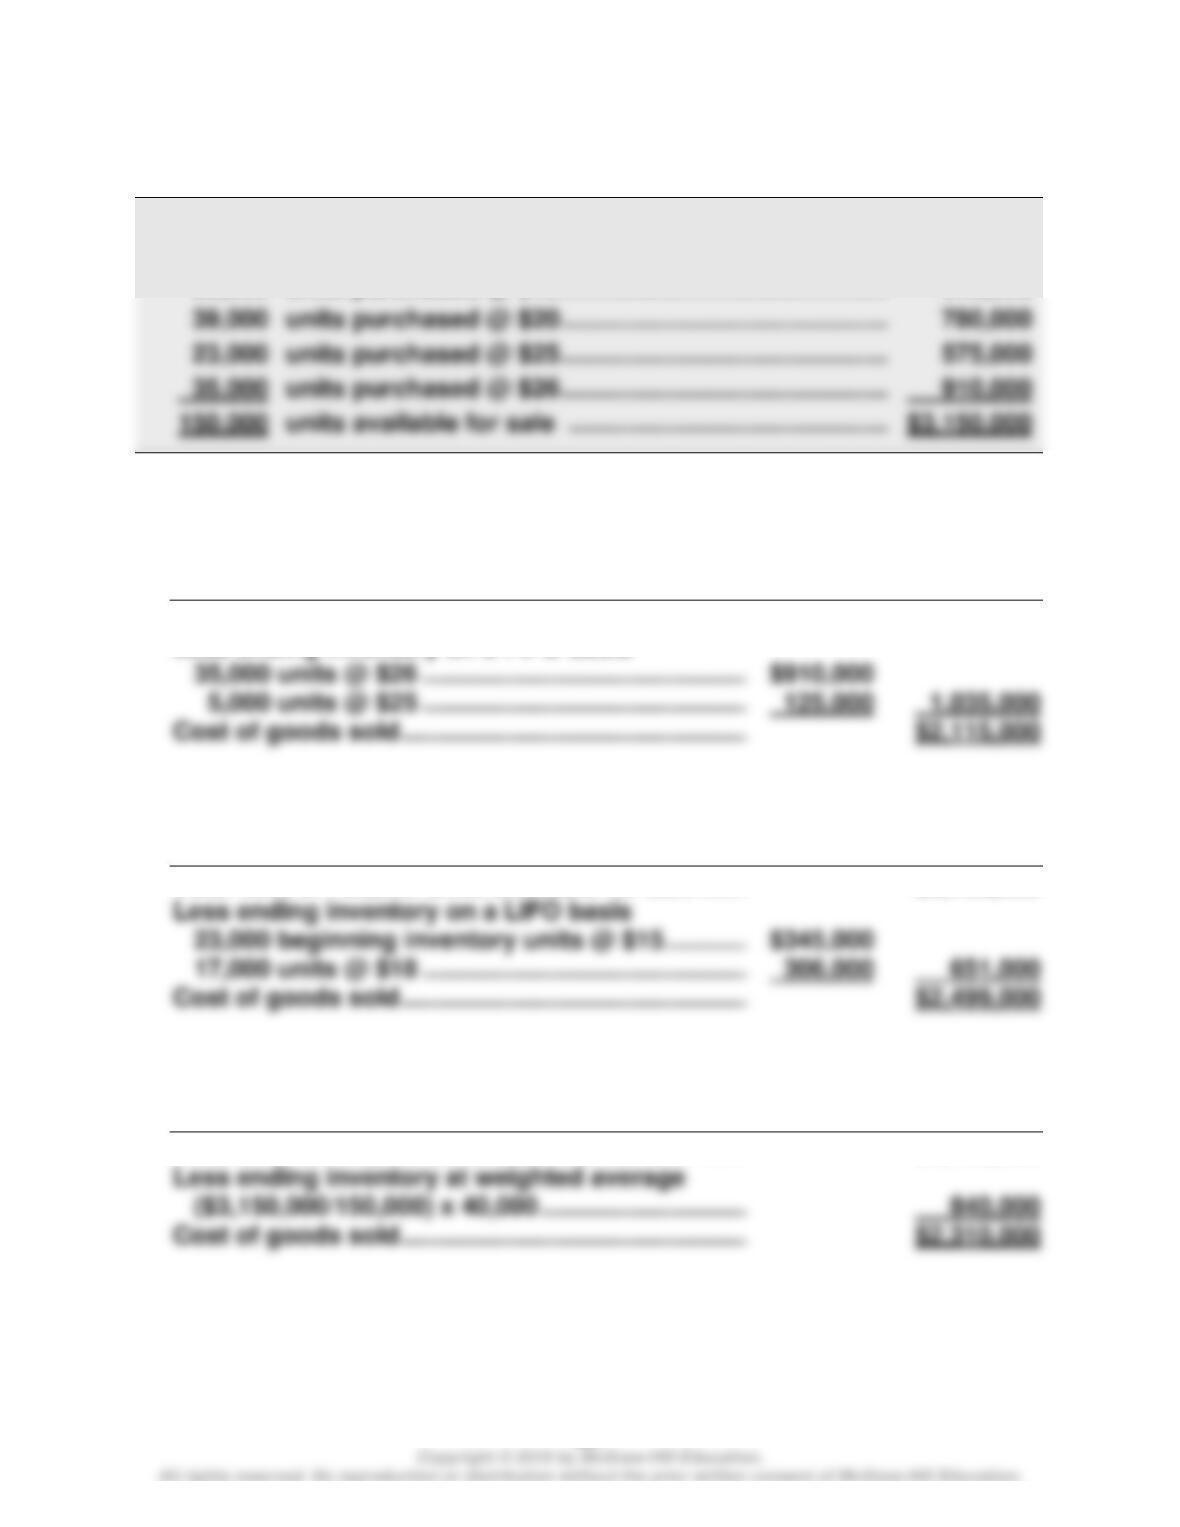
(b)
Net income
Year 1
Year 2
Year 3
Reported …………………………………….
$ 230,000
$ 285,000
$ 241,000
Adjustments: 12/31/Year 1 error ………
+ 56,000
12/31/Year 2 error ………
.
– 20,000
+ 20,000
Corrected …………………………………..
$ 286,000
$ 209,000
$ 261,000
(c)
Total current assets
Year 1
Year 2
Year 3
Reported …………………………………….
$1,255,000
$1,365,000
$1,200,000
Adjustments: 12/31/Year 1 error ………
+ 56,000
12/31/Year 2 error ………
.
– 20,000
.
Corrected …………………………………..
$1,311,000
$1,345,000
$1,200,000
(d)
Equity
Year 1
Year 2
Year 3
Reported …………………………………….
$1,387,000
$1,530,000
$1,242,000
Adjustments: 12/31/Year 1 error ………
+ 56,000
12/31/Year 2 error ………
_________
– 20,000
.
Corrected …………………………………..
$1,443,000
$1,510,000
$1,242,000
Part 2
Zero (there is no error in combined net income).
Wild and Shaw, Financial & Managerial Accounting, 8e Solutions Manual: Chapter 5
361
Problem 5-7AA (25 minutes)
Part 1
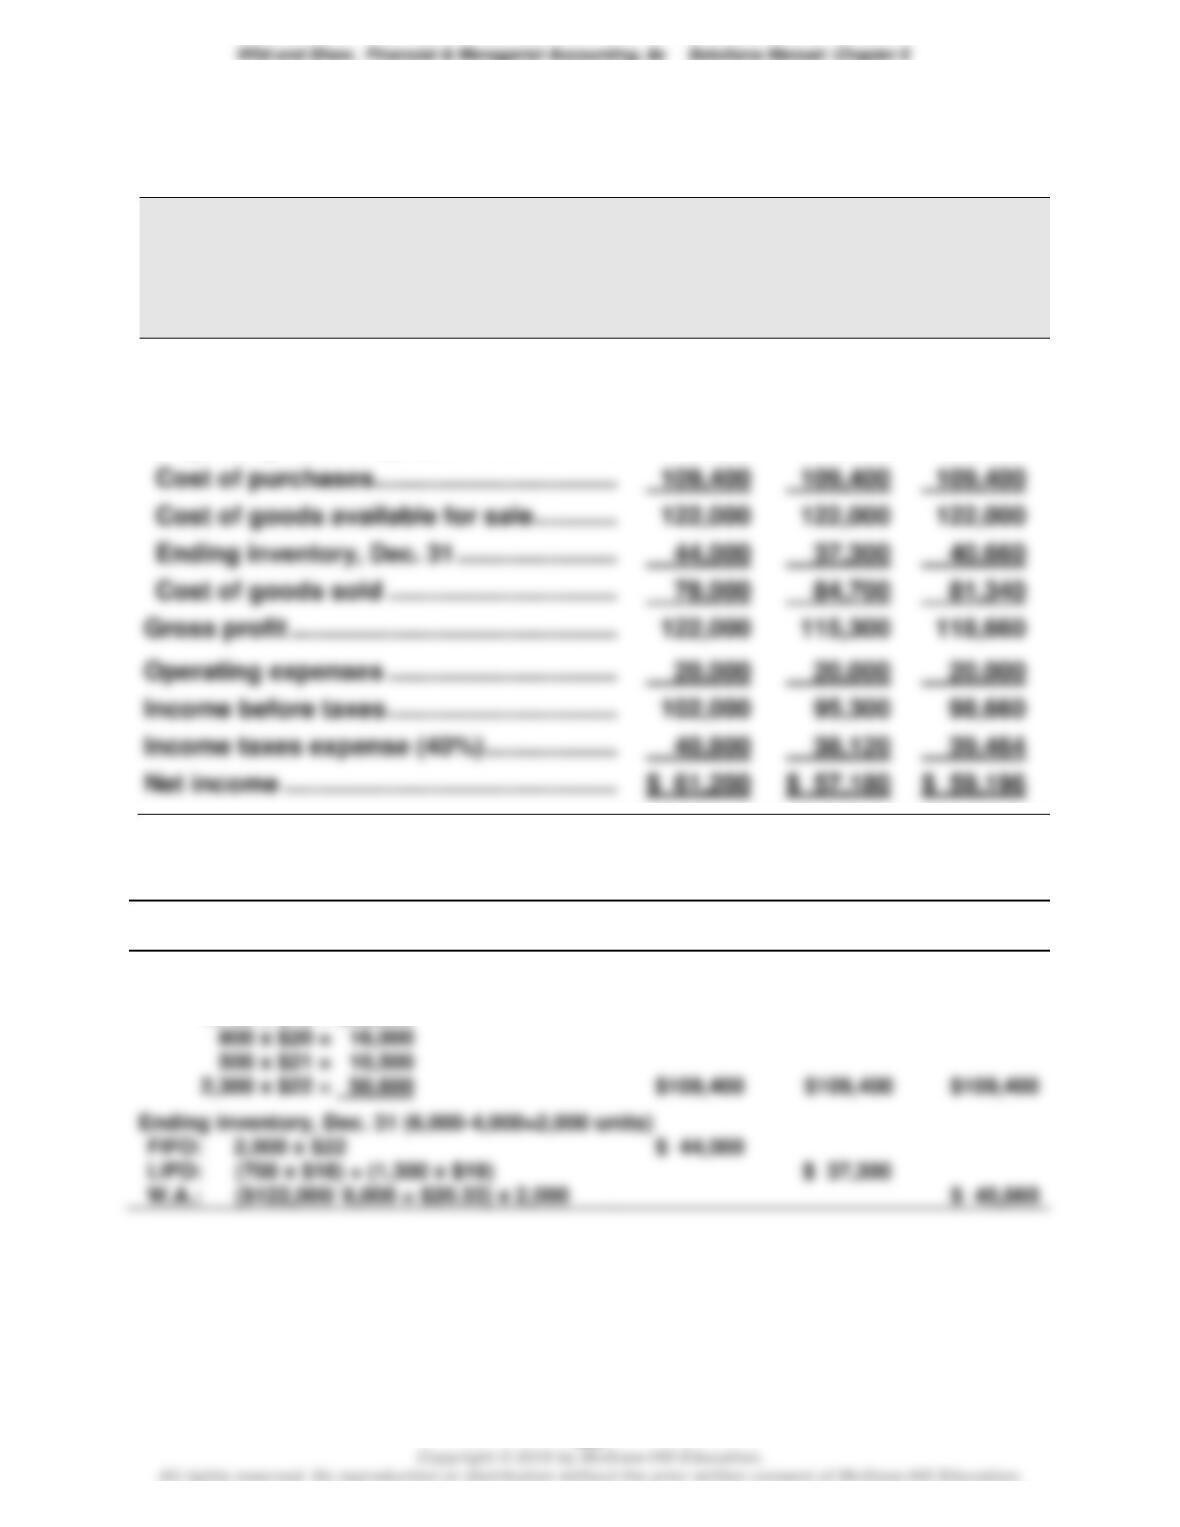
Number and total cost of units available for sale
23,000 units in beginning inventory @ $15 …………………….. $ 345,000
30,000 units purchased @ $18 ……………………………………….. 540,000
Part 2
a. FIFO periodic
Total cost of 150,000 units available for sale ……………….
$3,150,000
Less ending inventory on a FIFO basis
b. LIFO periodic
Total cost of 150,000 units available for sale ……………….
$3,150,000
Less ending inventory on a LIFO basis
c. Weighted average periodic
Total cost of 150,000 units available for sale ……………….
$3,150,000
362
Problem 5-8AA (50 minutes)
Part 1
QP CORP.
Income Statements Comparing FIFO, LIFO, and Weighted Average
For Year Ended December 31
FIFO
LIFO
Weighted
Average
Sales ……………………………………………………..
$200,000
$200,000
$200,000
Cost of goods sold
Beginning inventory, Jan. 1 …………………..
12,600
12,600
12,600
Cost of purchases…………………………………
109,400
109,400
109,400
Cost of goods available for sale …………….
44,000
37,300
40,660
20,000
20,000
20,000
40,800
38,120
39,464
Supporting calculations
FIFO
LIFO
Weighted
Average
Beginning inventory, Jan. 1 (700 x $18). ……….
$ 12,600
$ 12,600
$ 12,600
Purchases
1,700 x $19 = $32,300
800 x $20 = 16,000
500 x $21 = 10,500
Ending inventory, Dec. 31 (6,000-4,000=2,000 units)
(700 x $18) + (1,300 x $19)
($122,000/ 6,000 = $20.33) x 2,000