What SUP, Inc.
Equipment Depreciation Summary
Asset
Date
Acquired
Cost
Deprec.
Method
2017
Deprec.
2017
Acc.
Deprec.
2018
Deprec.
2018 Acc.
Deprec.
2019
Deprec.
2019 Acc.
Deprec.
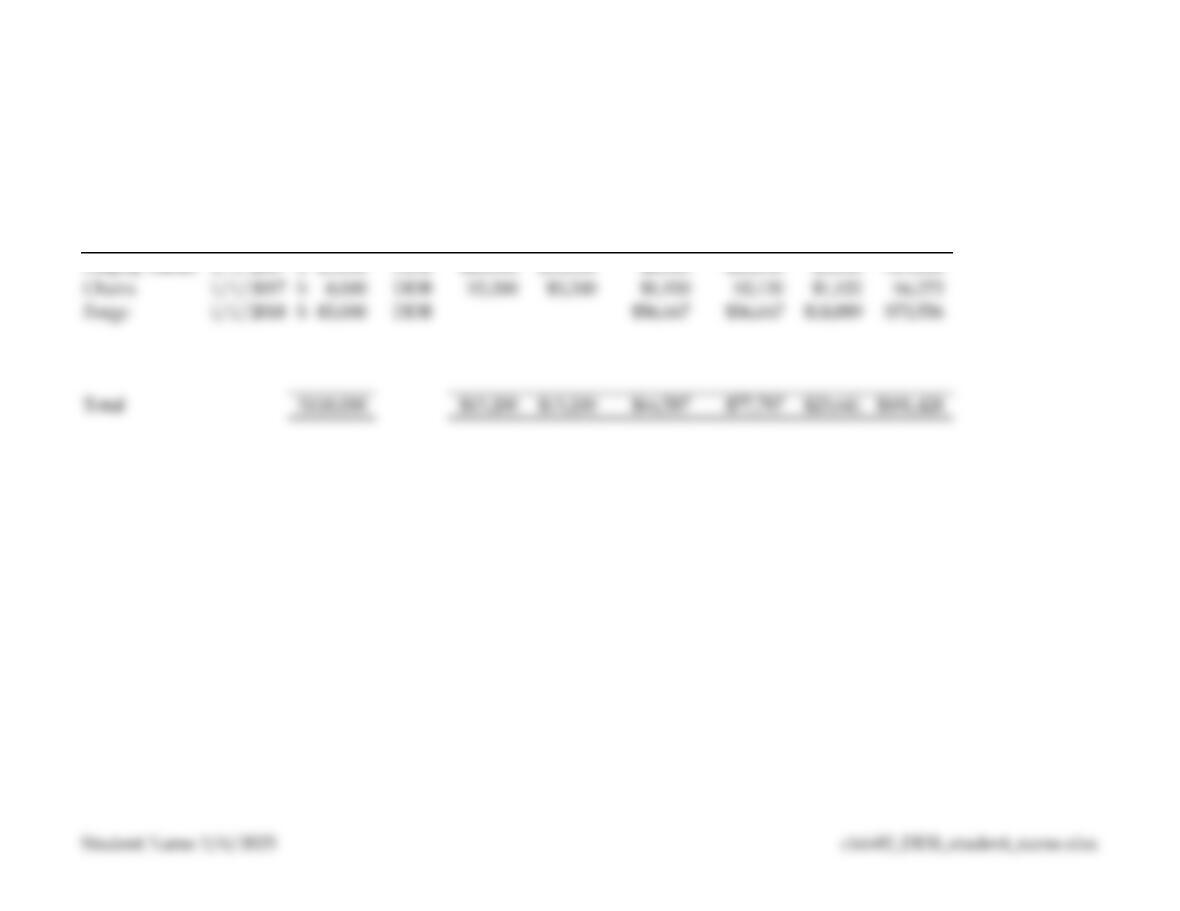
Display Racks 1/1/2017 25,000$ DDB $10,000 $10,000 $6,000 $16,000 $3,600 $19,600
Chairs 1/1/2017 8,000$ DDB $3,200 $3,200 $1,920 $5,120 $1,152 $6,272
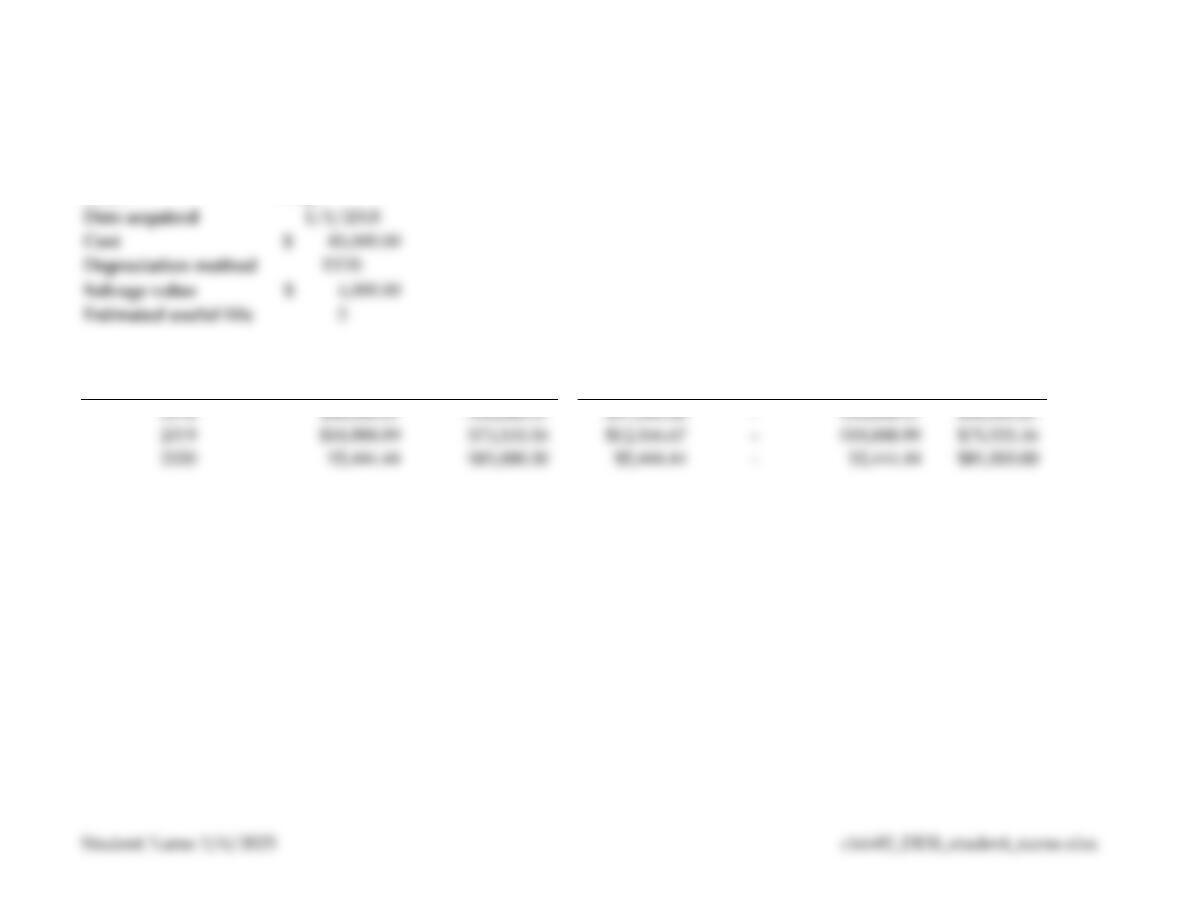
Forge 1/1/2018 85,000$ DDB $56,667 $56,667 $18,889 $75,556
What SUP, Inc. Depreciation Schedule
Asset #
1001
Asset
Display Racks
Year
Depreciation
Expense
Accumulated
Depreciation
Straight-Line
Test
Switch
Depreciation
Expense
Accumulated
Depreciation
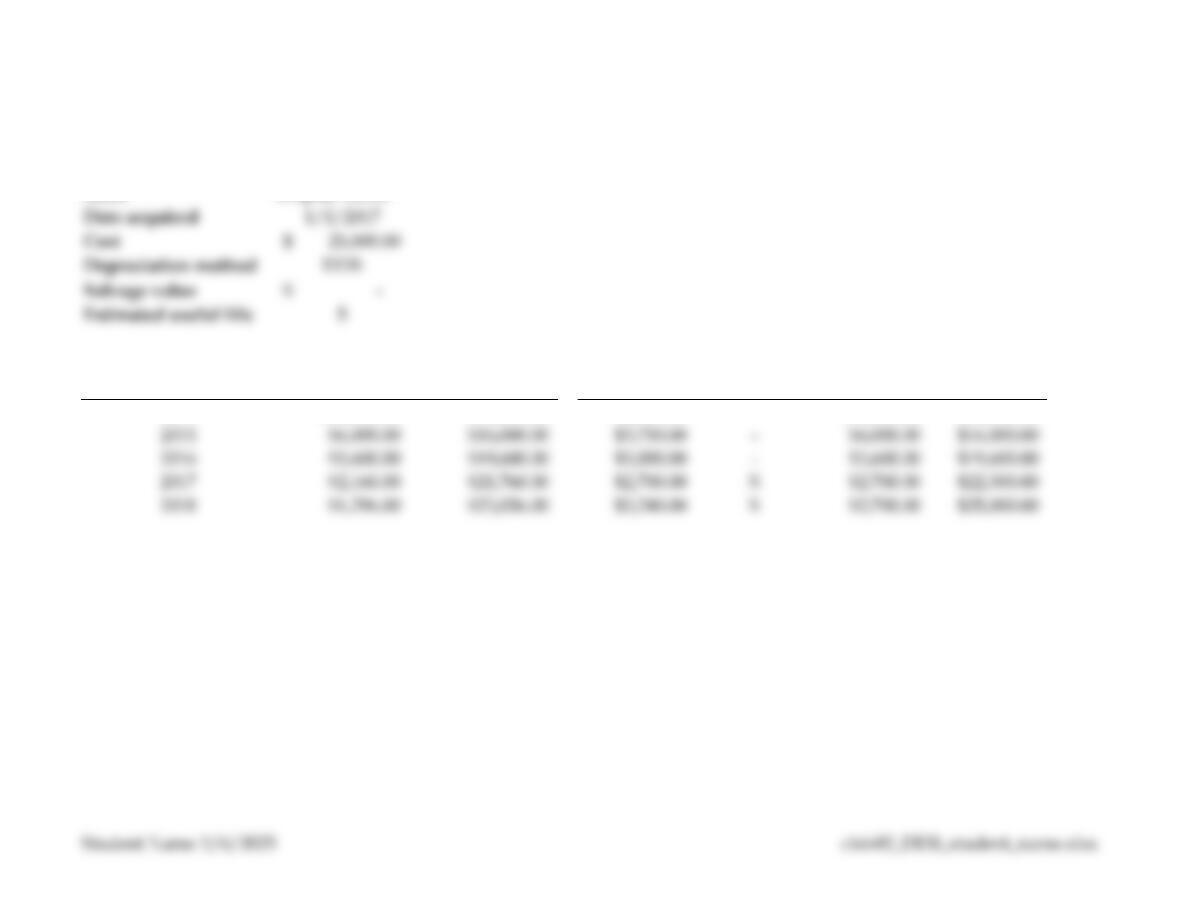
2014 $10,000.00 $10,000.00 $5,000.00 – $10,000.00 $10,000.00
2015 $6,000.00 $16,000.00 $3,750.00 – $6,000.00 $16,000.00
2016 $3,600.00 $19,600.00 $3,000.00 – $3,600.00 $19,600.00
2017 $2,160.00 $21,760.00 $2,700.00 X $2,700.00 $22,300.00
2018 $1,296.00 $23,056.00 $3,240.00 X $2,700.00 $25,000.00
What SUP, Inc. Depreciation Schedule
Asset #
1002
Asset
Chairs
Year
Depreciation
Expense
Accumulated
Depreciation
Straight-Line
Test
Switch
Depreciation
Expense
Accumulated
Depreciation
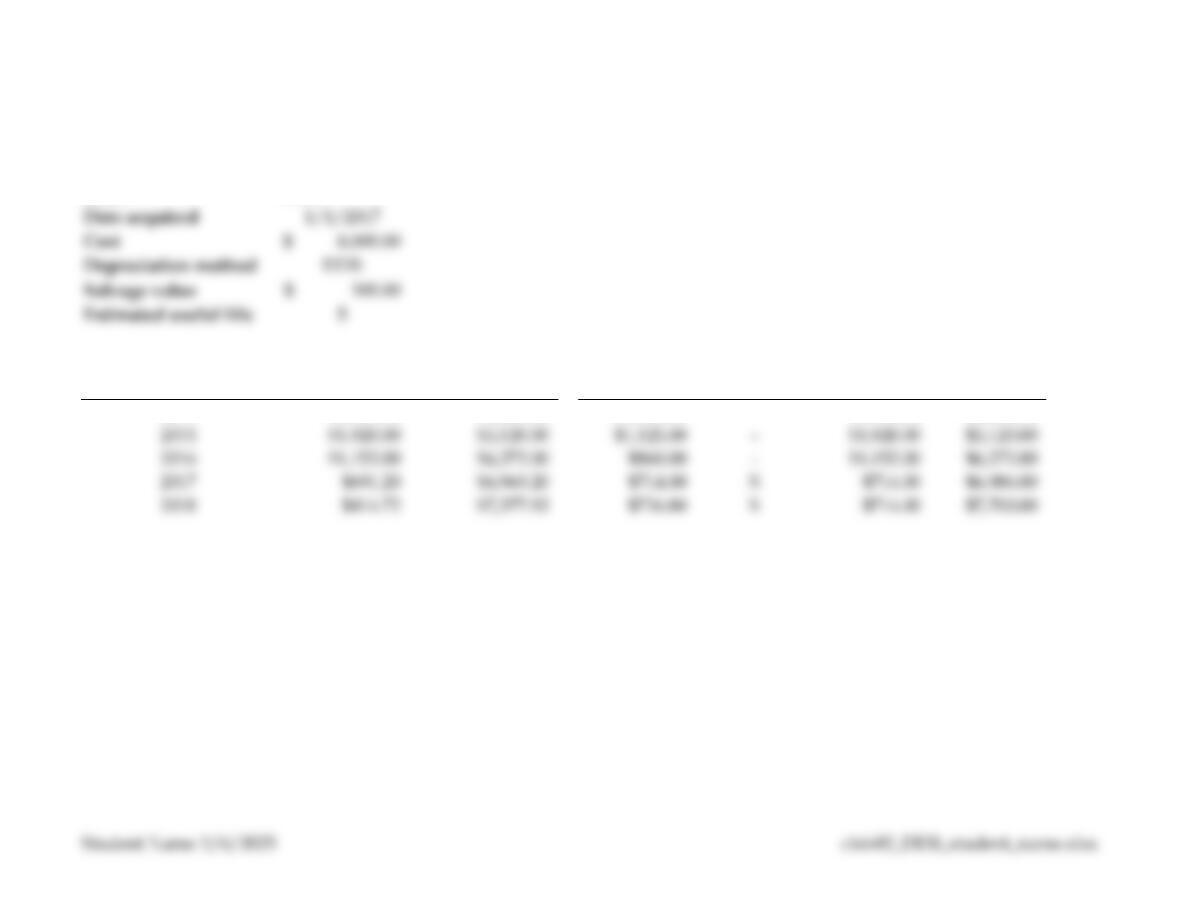
2014 $3,200.00 $3,200.00 $1,540.00 – $3,200.00 $3,200.00
2015 $1,920.00 $5,120.00 $1,125.00 – $1,920.00 $5,120.00
2016 $1,152.00 $6,272.00 $860.00 – $1,152.00 $6,272.00
2017 $691.20 $6,963.20 $714.00 X $714.00 $6,986.00
2018 $414.72 $7,377.92 $736.80 X $714.00 $7,700.00
What SUP, Inc. Depreciation Schedule
Asset #
1003
Asset
Forge
Year
Depreciation
Expense
Accumulated
Depreciation
Straight-Line
Test
Switch
Depreciation
Expense
Accumulated
Depreciation