1.
1.
1.
2.
Chapter 4, SE 1.
O
Current liability
Property, plant, and equipment
Chapter 4, SE 3.
FINANCIAL REPORTING AND ANALYSIS
Full disclosure
Chapter 4, SE 2.
CHAPTER 4—Solutions
193
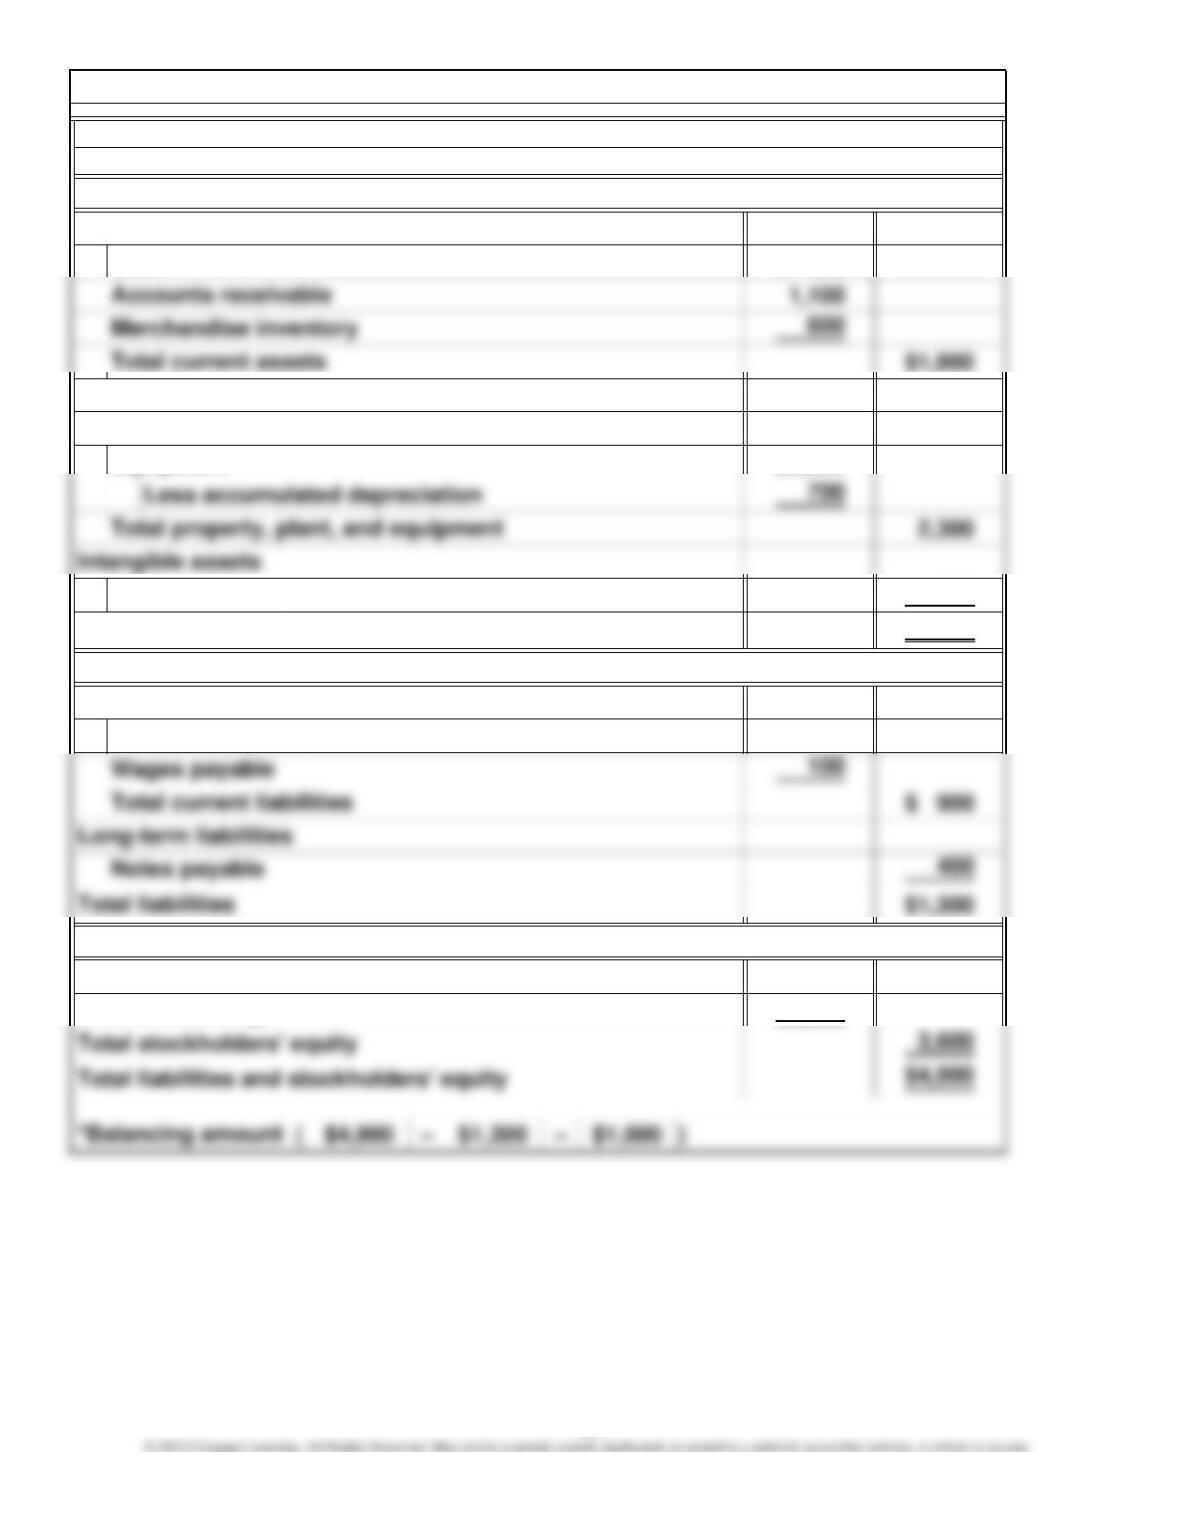
$ 200
500
$3,000
200
$4,900
$ 800
$1,000
2,600
Franchise
Common stock
Accounts payable
Total assets
Current liabilities
Current assets
Retained earnings
Cash
Chapter 4, SE 4.
Stockholders’ Equity
Liabilities
Balance Sheet
Assets
May 31, 2011
Property, plant, and equipment
Investments
Equipment
*
194
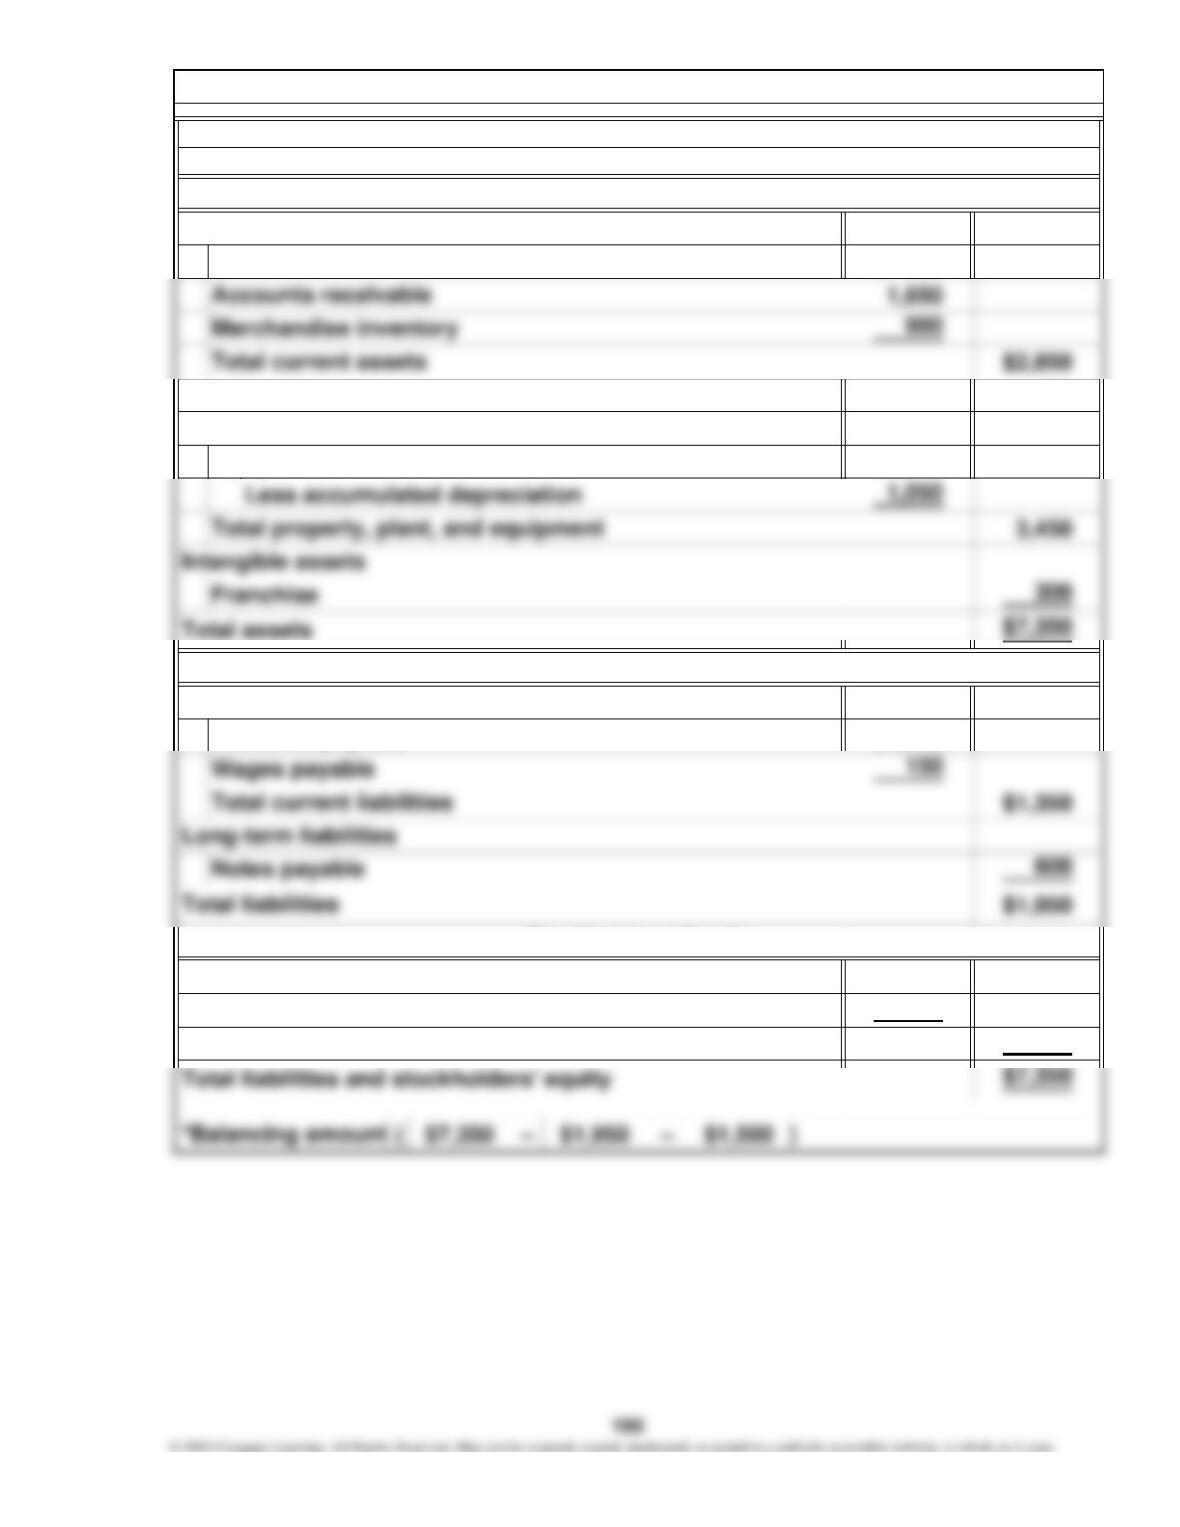
$ 300
750
$4,500
$1,200
$1,500
3,900
5,400
Accounts payable
Current liabilities
Balance Sheet
Assets
Retained earnings
July 31, 2011
Cash
Stockholders’ Equity
Chapter 4, SE 5.
Liabilities
Total stockholders’ equity
Investments
Current assets
Equipment
Property, plant, and equipment
Common stock
*
1.
2.
7.
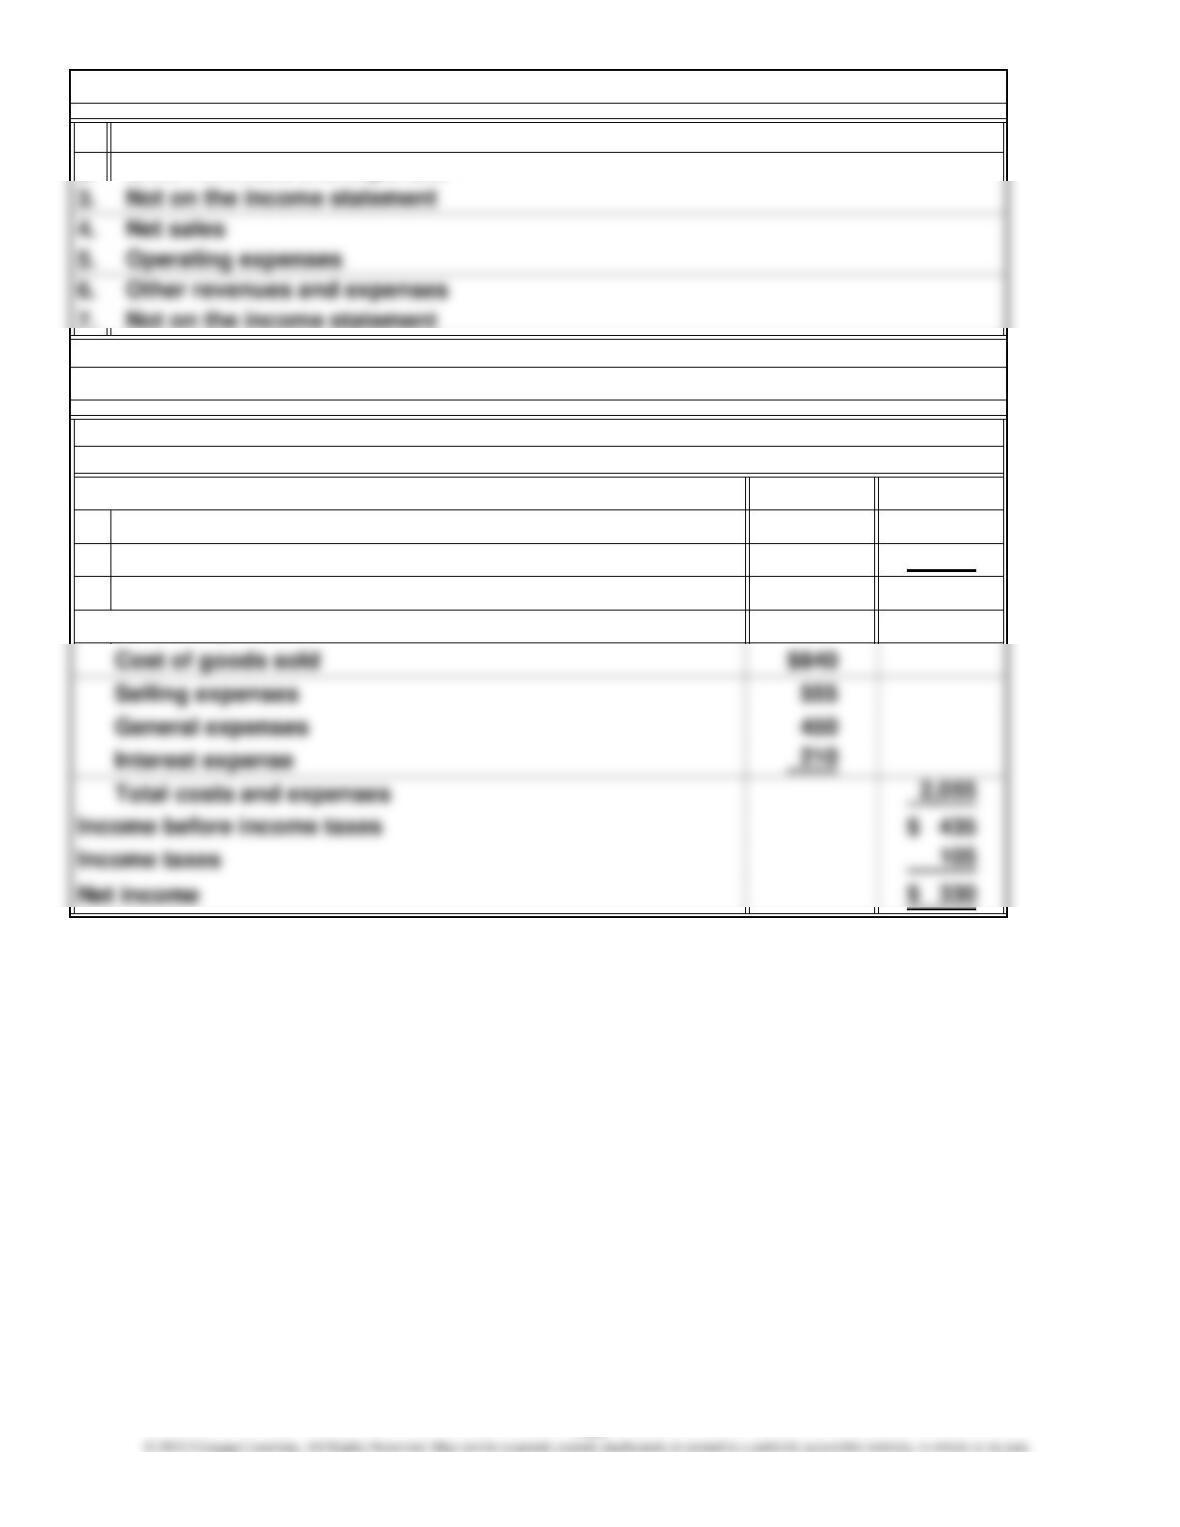
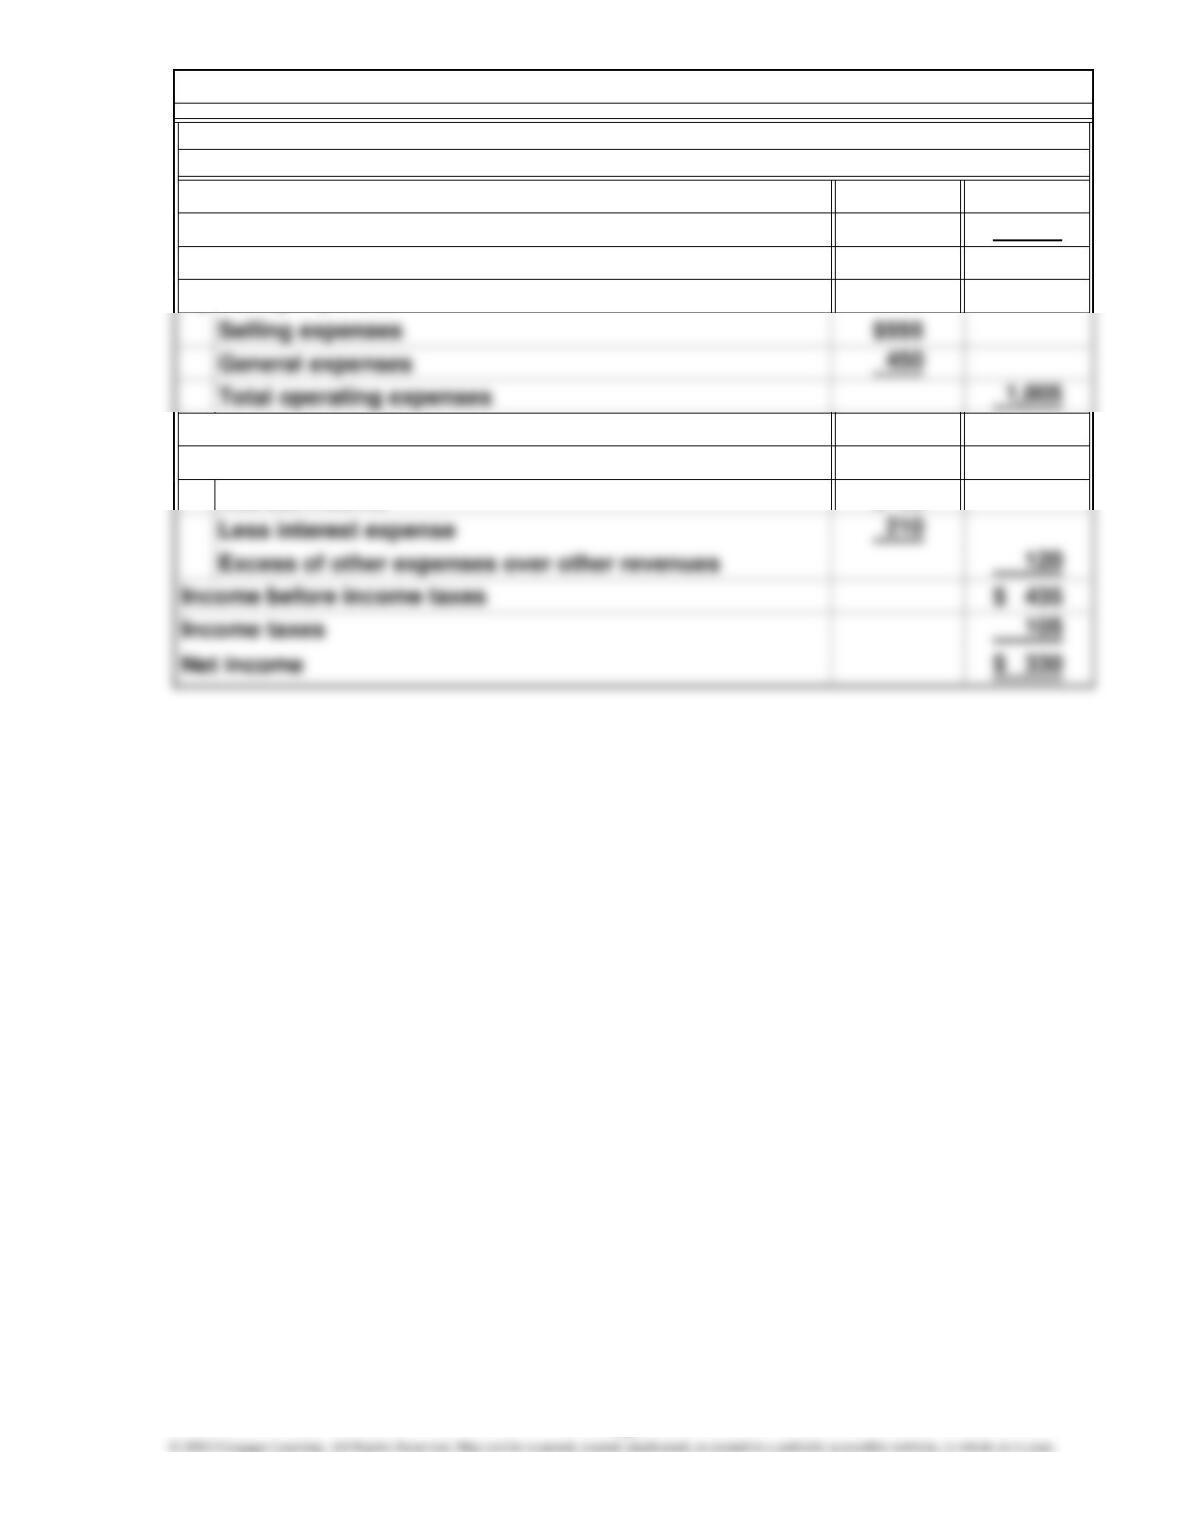
Net sales $2,400
Interest income 90
Total revenues $2,490
Other revenues and expenses
Income Statement
For the Year Ended May 31, 2011
Costs and expenses
Revenues
Operating expenses
Chapter 4, SE 6.
Chapter 4, SE 7.
196
$2,400
840
$1,560
$ 555
Interest income $ 90
Income from operations
Other revenues and expenses
Income Statement
For the Year Ended May 31, 2011
Net sales
Cost of goods sold
Gross margin
Chapter 4, SE 8.
Operating expenses
197
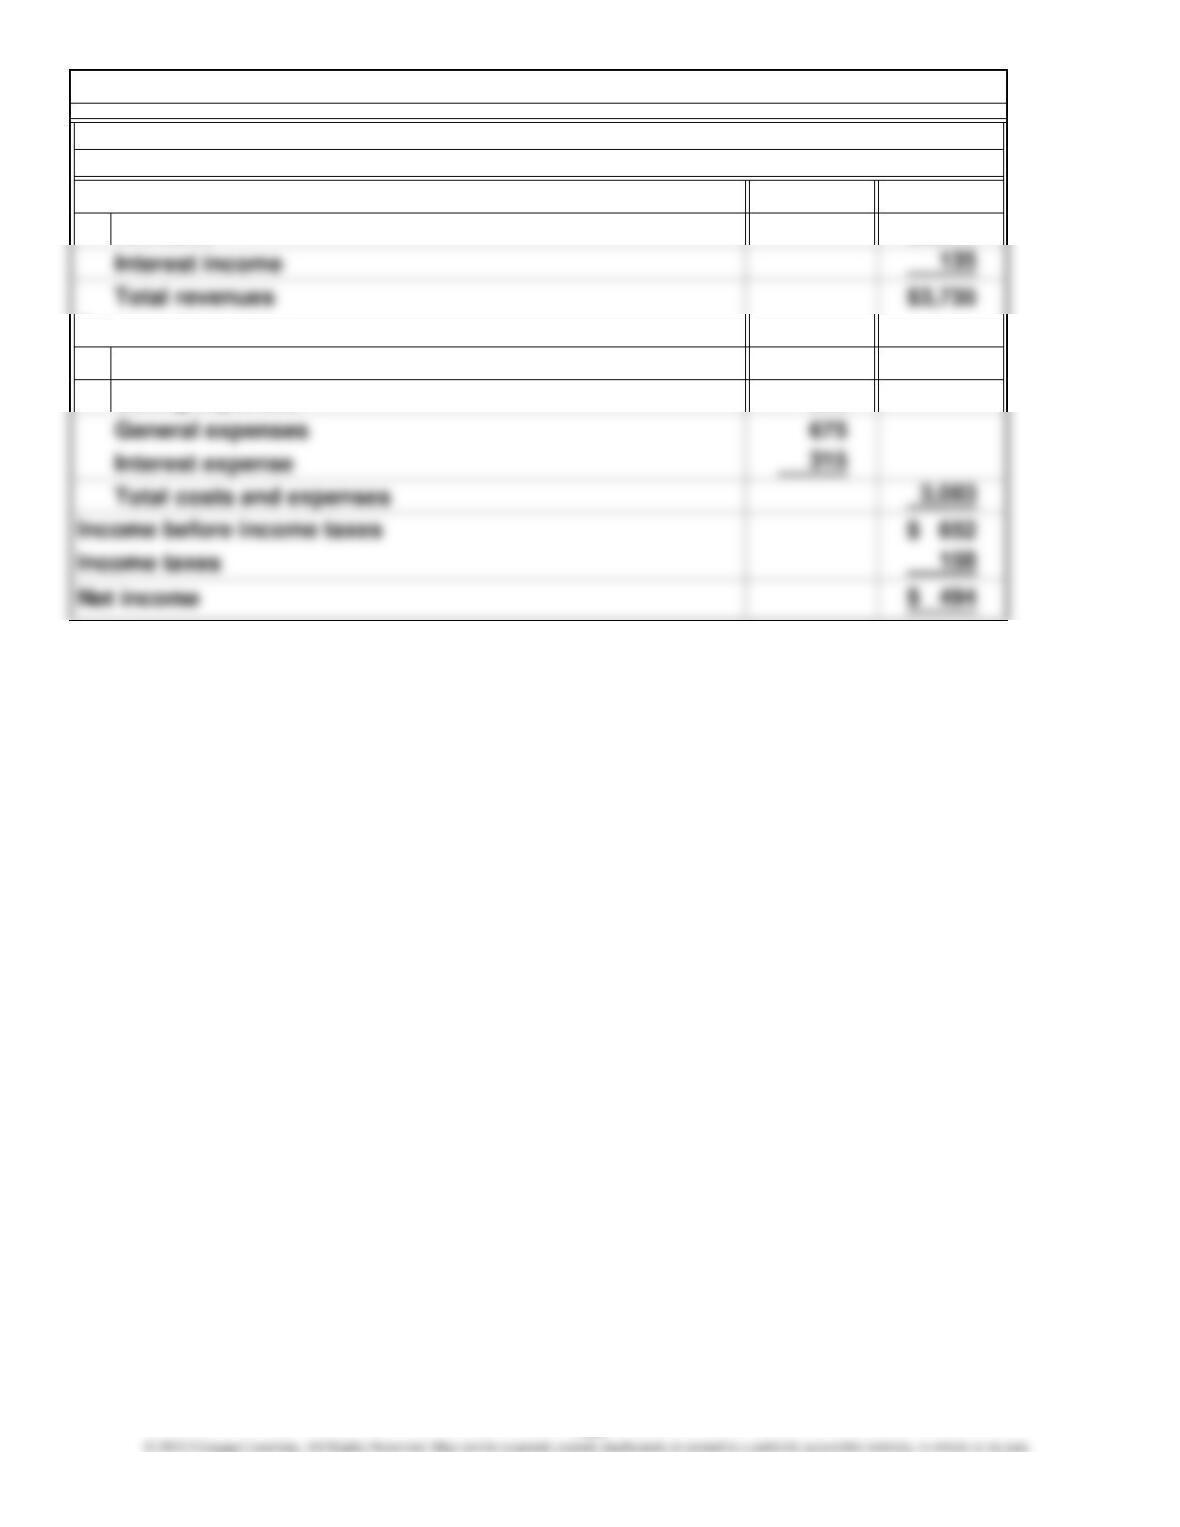
Net sales $3,600
Cost of goods sold $1,260
Selling expenses 833
Chapter 4, SE 9.
Costs and expenses
Revenues
Income Statement
For the Year Ended July 31, 2011
198
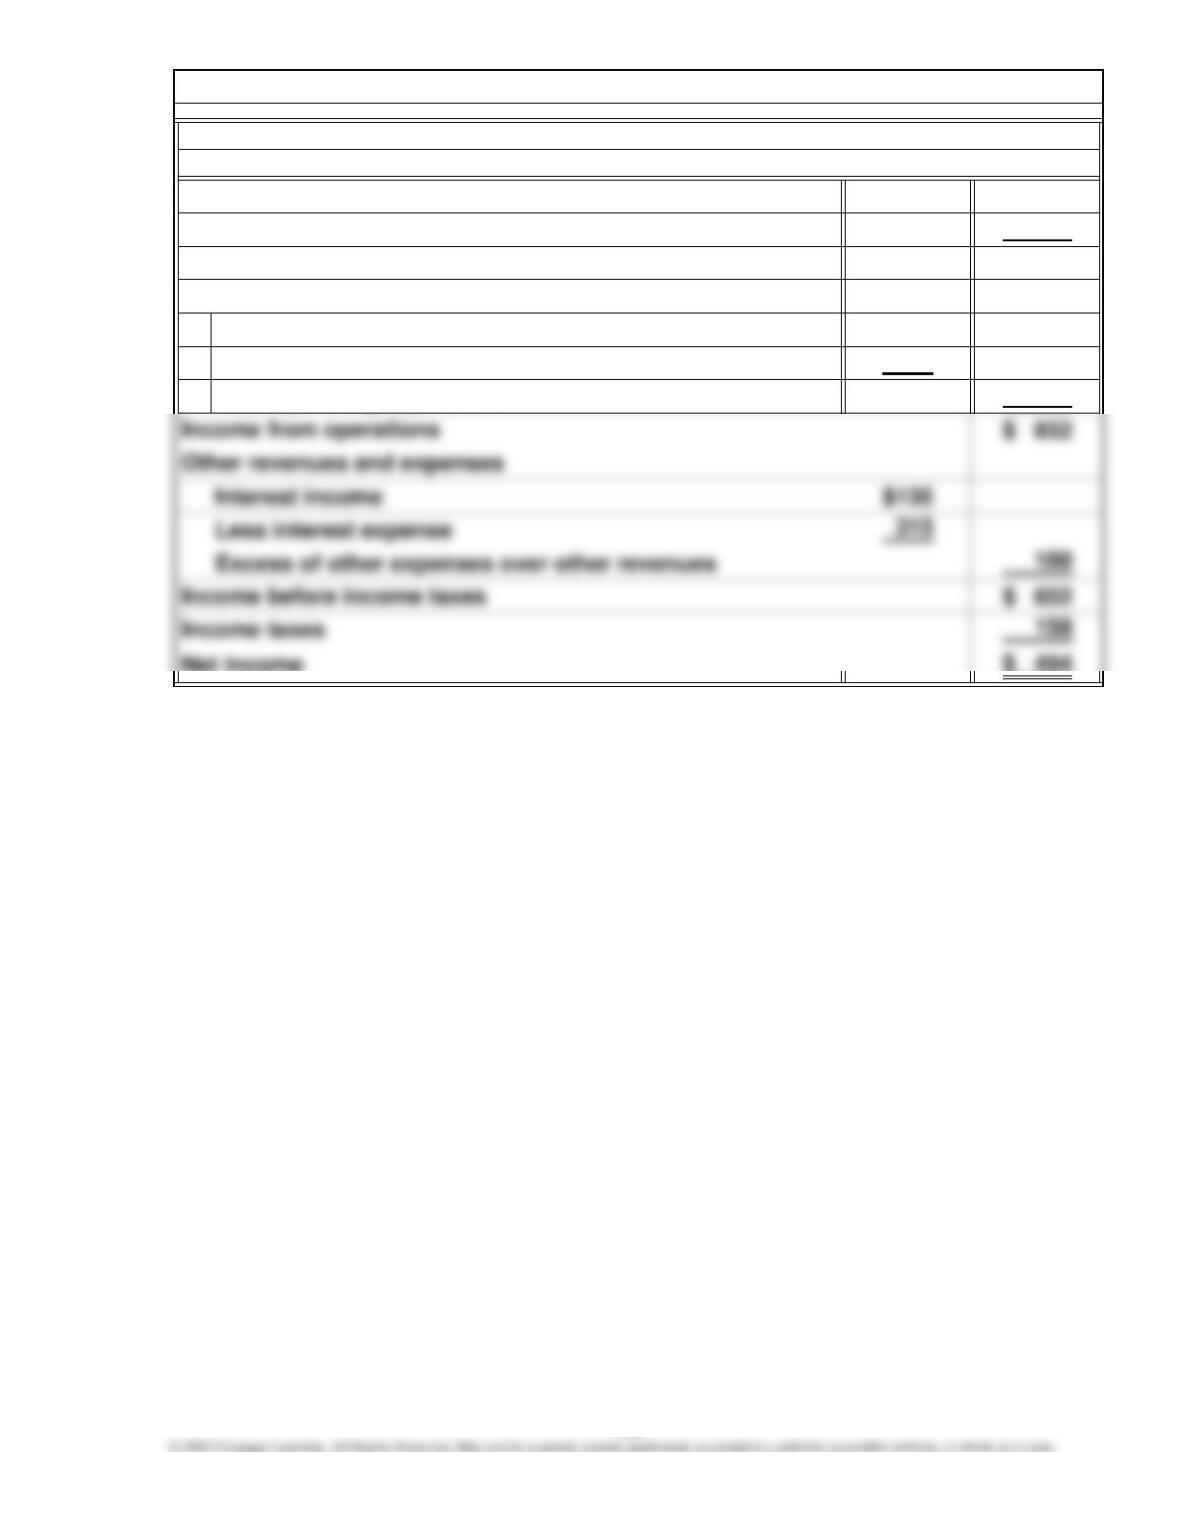
$3,600
1,260
$2,340
Selling expenses $833
General expenses 675
Total operating expenses 1,508
$ 494
Chapter 4, SE 10.
Operating expenses
Income Statement
For the Year Ended July 31, 2011
Net sales
Cost of goods sold
Net income
Gross margin
199
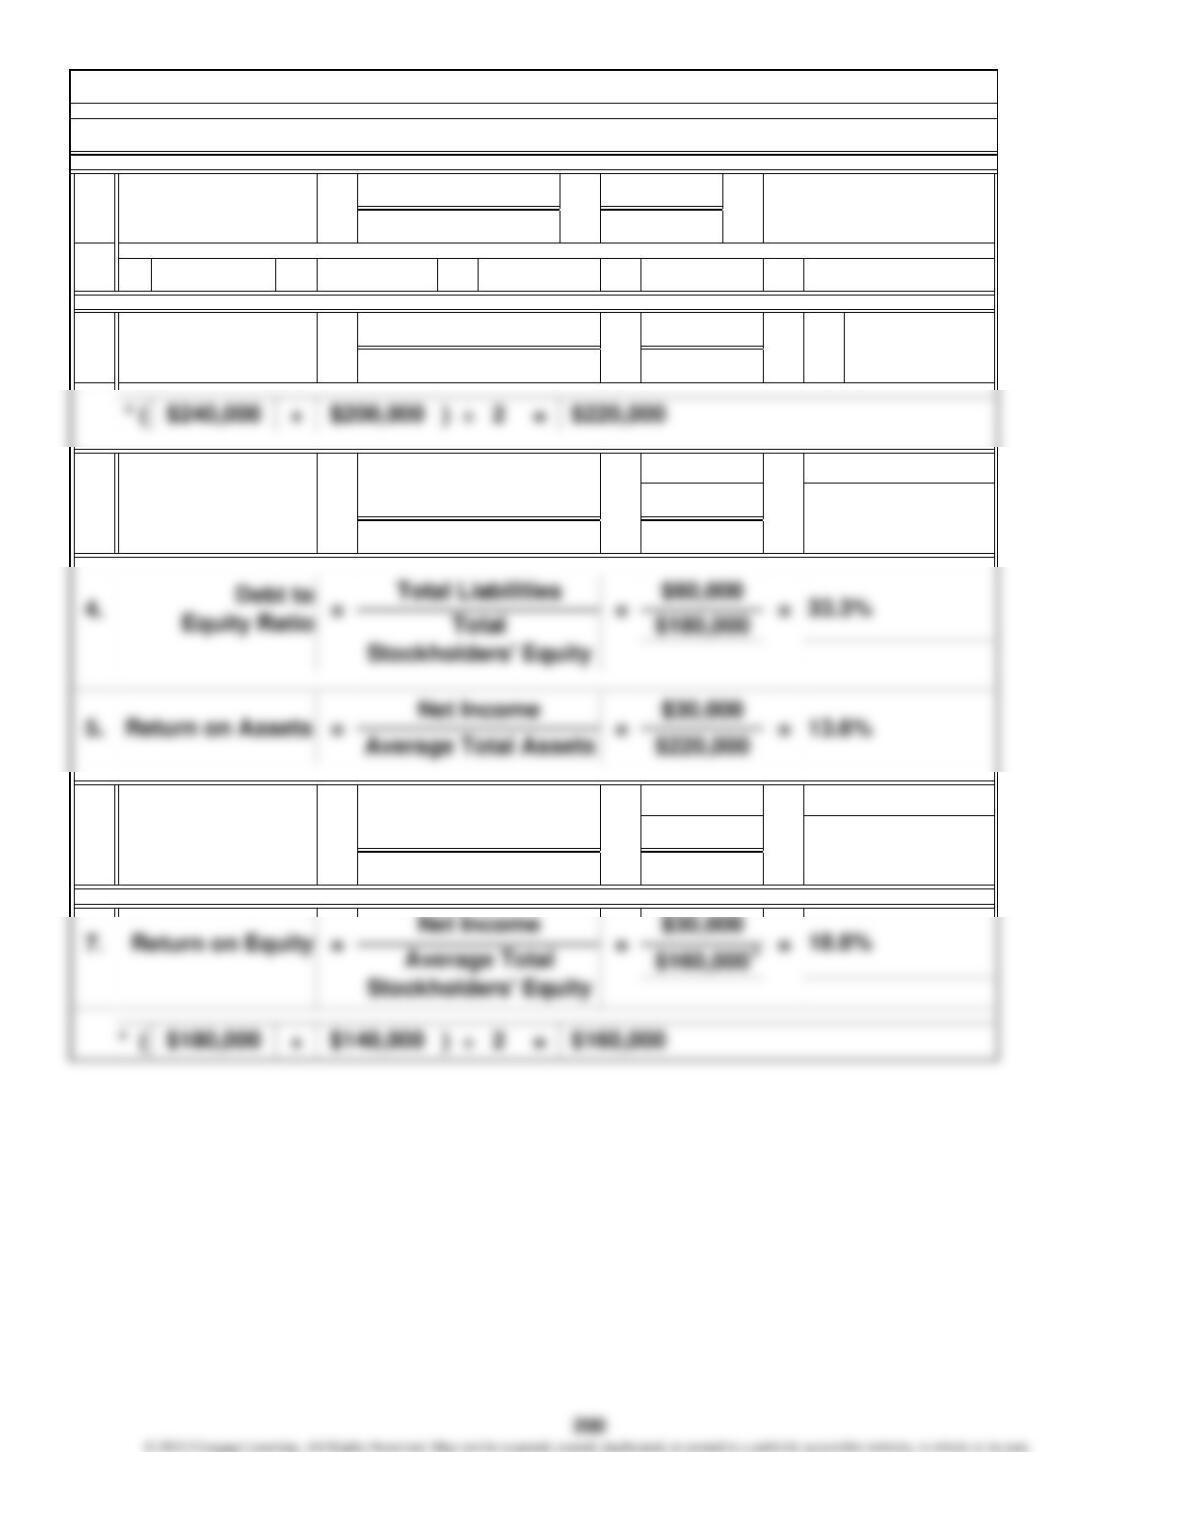
*– – – =
Cash Flows from
Operating Activities
$220,000
3. =
Average Total Assets
1.0
=
Cash Flows from
Operating Activities $30,000 13.6%
=
Cash Return
on Assets
6. =
Cash Flow Yield
Asset Turnover $220,000
Profit Margin Net Income
Net Income
Chapter 4, SE 11.
=
$260,000
=$30,000
$140,000
Financial ratios computed
= 11.5%
Net Sales
1. $260,000
=
Net Sales =
$10,000$80,000 $30,000
$260,000 times
Average Total Assets
2. = 1.2
$30,000
$30,000 =
=
*
*
× = Return on Assets
×=
Chapter 4, SE 12.
16.8%
Profit Margin Asset Turnover
8.0%
2.1 times
1.
2.
3.
4.
Chapter 4, E 1.
Illegal acts, such as stealing $1,000, are important to management even though
The balance sheet provides information about a company’s resources (assets)
for a multimillion-dollar business, it might not be important to the auditors. It
would not be material to the overall fairness of the financial statements.
To record depreciation expense, it is necessary to estimate the useful life of
Consistency in accounting applies only to the use of the accounting principles
for presenting the financial information. It does not apply to the conditions that
202
1.
2.
3.
4.
When calculating ratios to measure performance, analysts need benchmarks
The statement is false because neither measure is better than the other. How-
ever, the return on assets ratio is a more comprehensive measure of profit-
pects of profitability. Income from operations measures the income from a com-
Neither measure is better than the other because both measure different as-
They are classified as investments because doing so helps users of financial
Chapter 4, E 2.
statements assess the performance of the company using such measures as
1. 12.
1.
1. 9.
2. 10.
Chapter 4, E 5.
a
g
d
Chapter 4, E 3.
h
a
c
Chapter 4, E 4.
Cost-benefit
204
$12,480
8,000
$ 3,200
$28,000
5,600 22,400
Chapter 4, E 6.
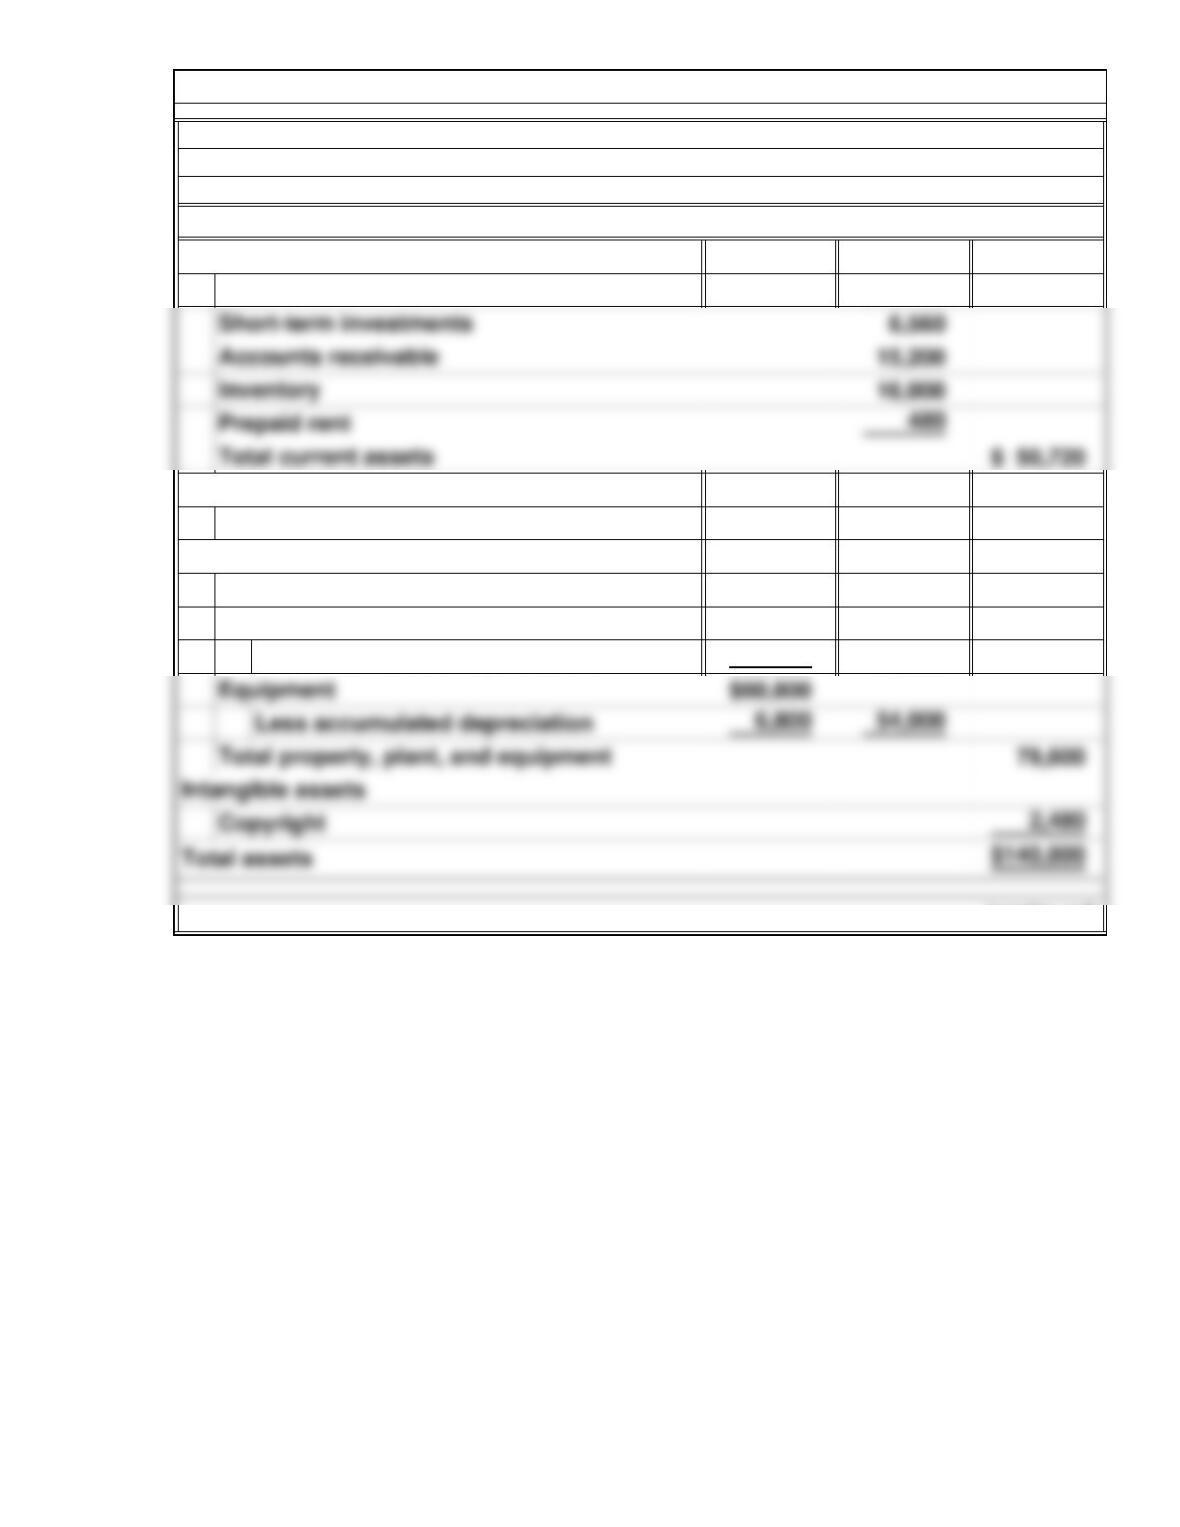
Current assets
Mamba, Inc.
(continued)
Investment in corporate securities
Less accumulated depreciation
Property, plant, and equipment
Building
Land
Investments
Balance Sheet
December 31, 2011
Assets
Cash
205
© 2012 Cengage Learning. All Rights Reserved. May not be scanned, copied, duplicated, or posted to a publicly accessible website, in whole or in part.
$20,400
$140,800
1. 8.
2. 9.
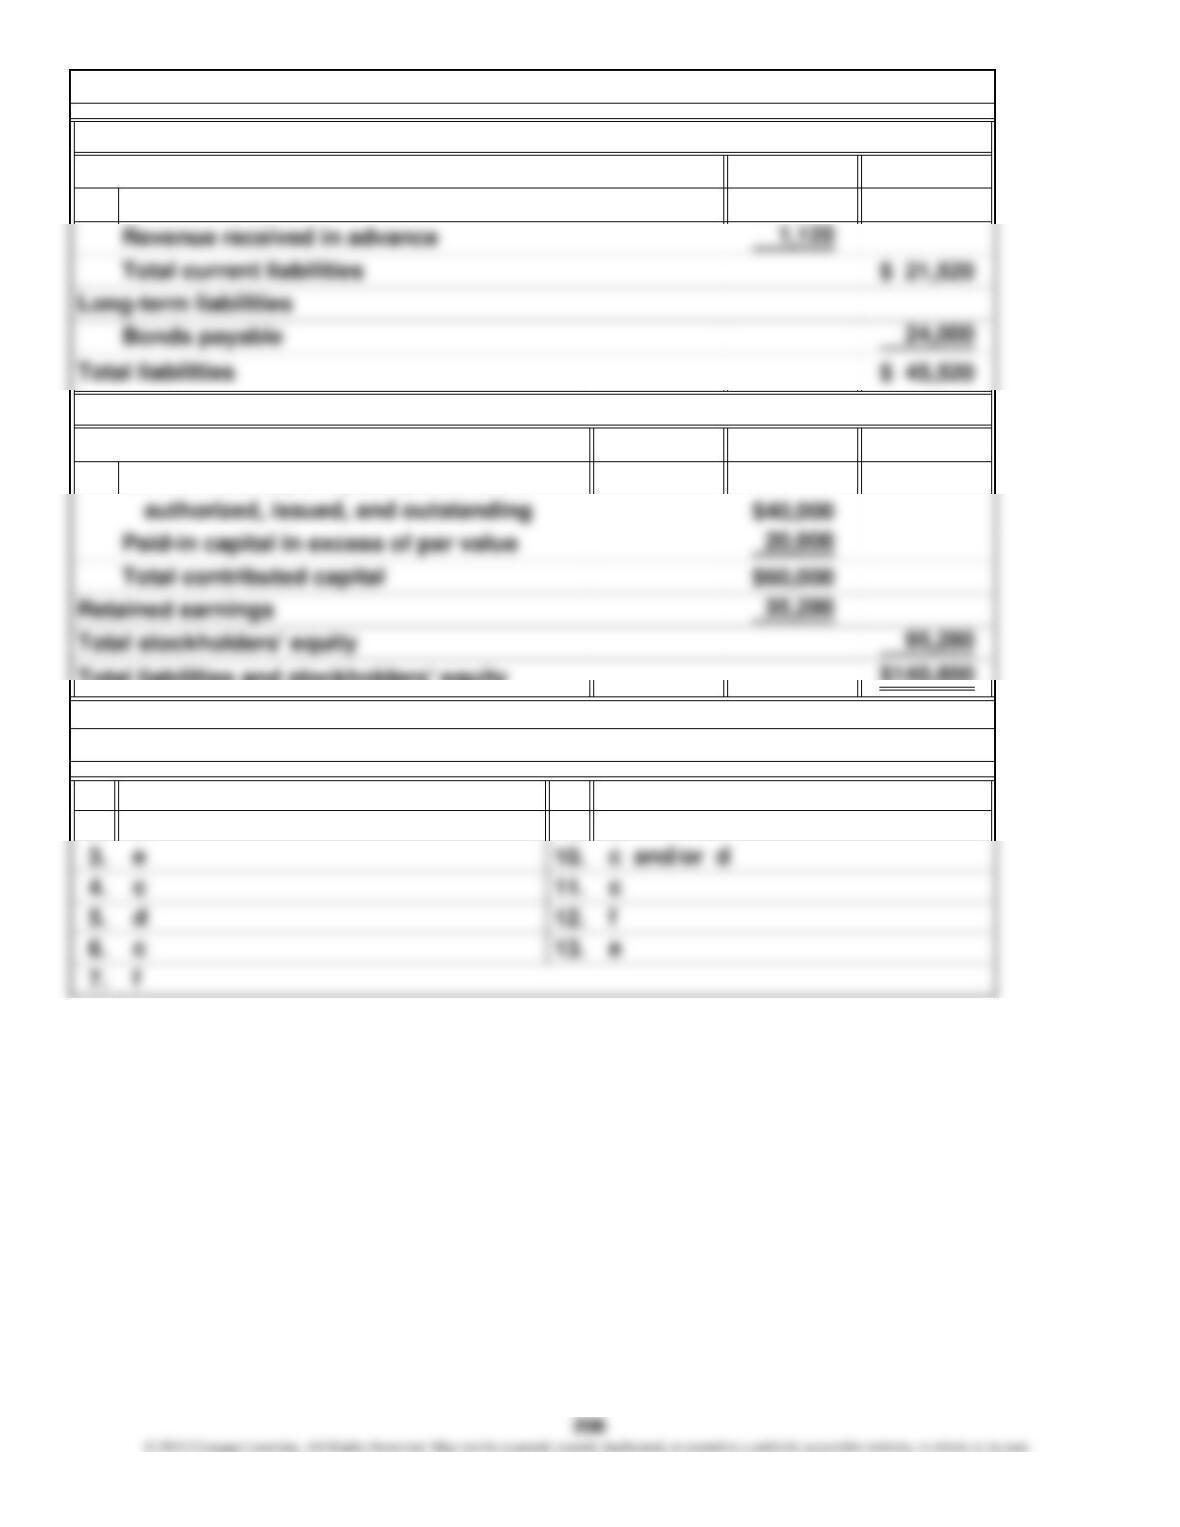
Accounts payable
Common stock, $10 par, 4,000 shares
Contributed capital
Stockholders’ Equity
Current liabilities
Chapter 4, E 6. (Continued)
Total liabilities and stockholders’ equity
Liabilities
Chapter 4, E 7.
c and/or d
c
a
b
$405,000
3,000
$408,000
$ 1.06
$405,000
220,000
$185,000
$ 1.06
2.
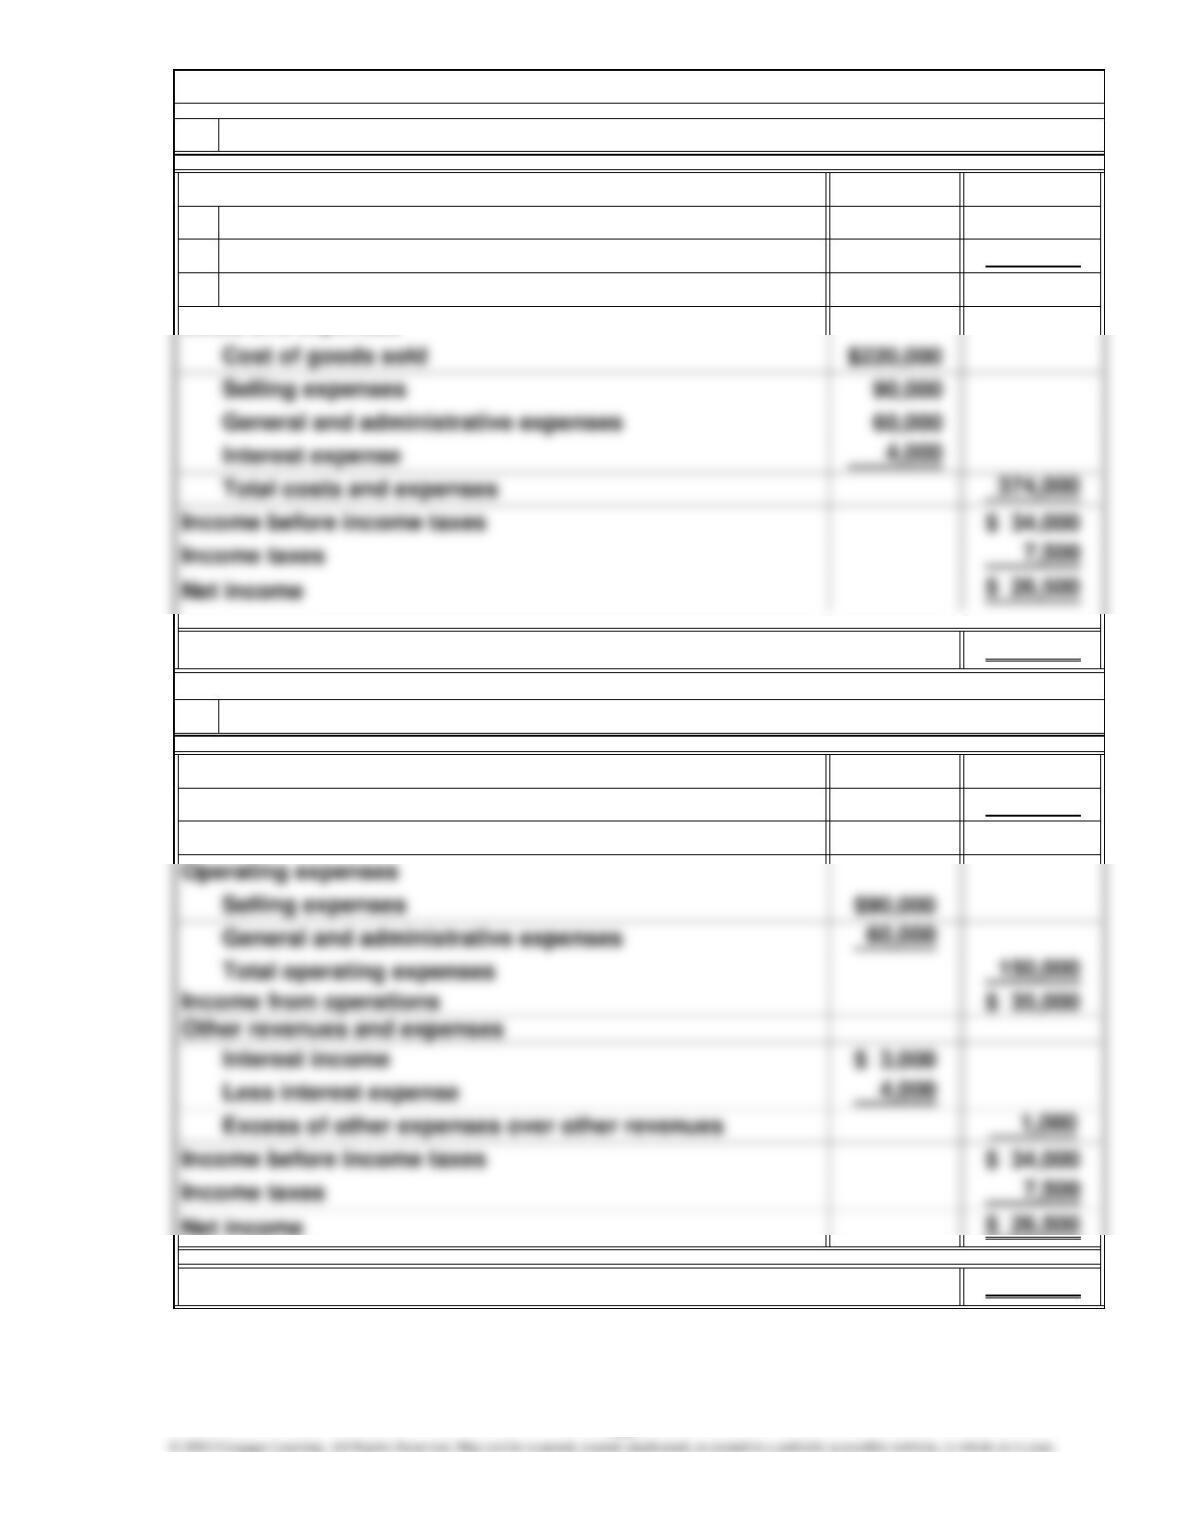
Multistep income statement prepared
Earnings per share
Chapter 4, E 8.
Revenues
1. Single-step income statement prepared
Total revenues
Interest income
Net sales
Costs and expenses
Net sales
Cost of goods sold
Gross margin
Earnings per share
207
$1,197,132
777,080
$ 420,052
$ 115,624
Interest income $ 5,720
Less interest expense 13,560
Excess of other expenses over other revenues 7,840
$ 8.38
Other revenues and expenses
Chapter 4, E 9.
Income from operations
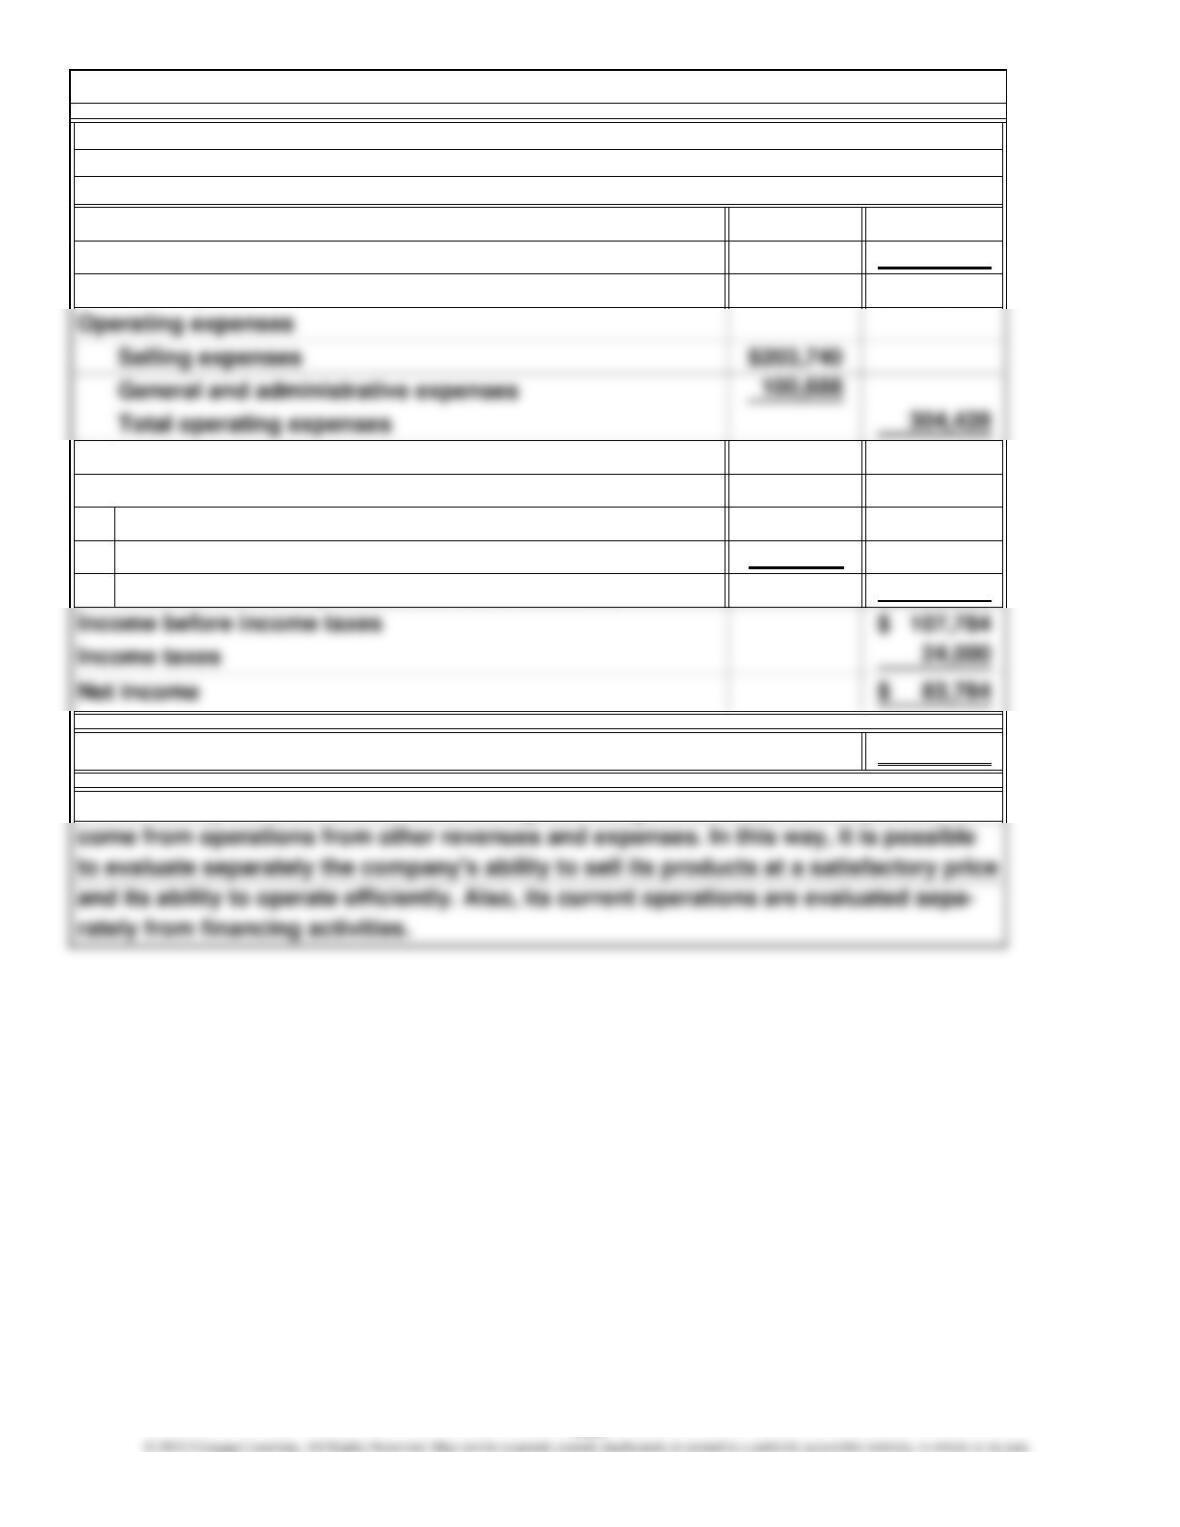
For the Year Ended December 31, 2011
Income Statement
The multistep income statement lists the gross margin from sales and separates in-
Earnings per share
Pasica, Inc.
Net sales
Cost of goods sold
Gross margin
208
Net Sales
Average Total Assets
Net Sales
Average Total Assets
Return on
Assets
Net Income
3.
2.
Chapter 4, E 10.
Financial ratios computed
1. Profit Margin =
Asset Turnover
=
=
Net Income
Cash Flows from Operating Activitie
s
=
Net Income
Chapter 4, E 10. (Continued)
4. Cash Flow Yield =
$43,000 = 67.7%
$63,500
6. Debt to
Equity Ratio
Total Liabilities
Total Stockholders’ Equity
*
210
=
=Debt to
Equity Ratio
6.
31.4%
Total
Stockholders’ Equity
$110,000
$350,000
Total Liabilities =
Profitability measures computed
1.
=
$60,000
Profit Margin Net Income =
Net Sales
Return
on Assets
Chapter 4, E 11.
7.2%
=
Net Income
$830,000
= 14.6%
Average Total Assets =
$60,000
3. = $410,000
1.
2.
3.
4.
5.
Charging items of small unit value as an expense rather than incurring the cost
Valuing inventory at lower of cost or market is a generally accepted application
If a company changes its method of accounting for inventory, it must disclose
Not disclosing the fire loss in a note to the 2011 financial statements is a viola-
User Insight: Accounting convention explained
of capitalizing and depreciating them is an acceptable application of the materi-
The change in inventory methods is a violation of the consistency convention.
costs.
has determined that the benefits of the new reporting system outweigh the
This is an acceptable application of the cost-benefit convention if management
Chapter 4, P 1.