6e Statement of Stockholders’ Equity Page 108 Chapter 4
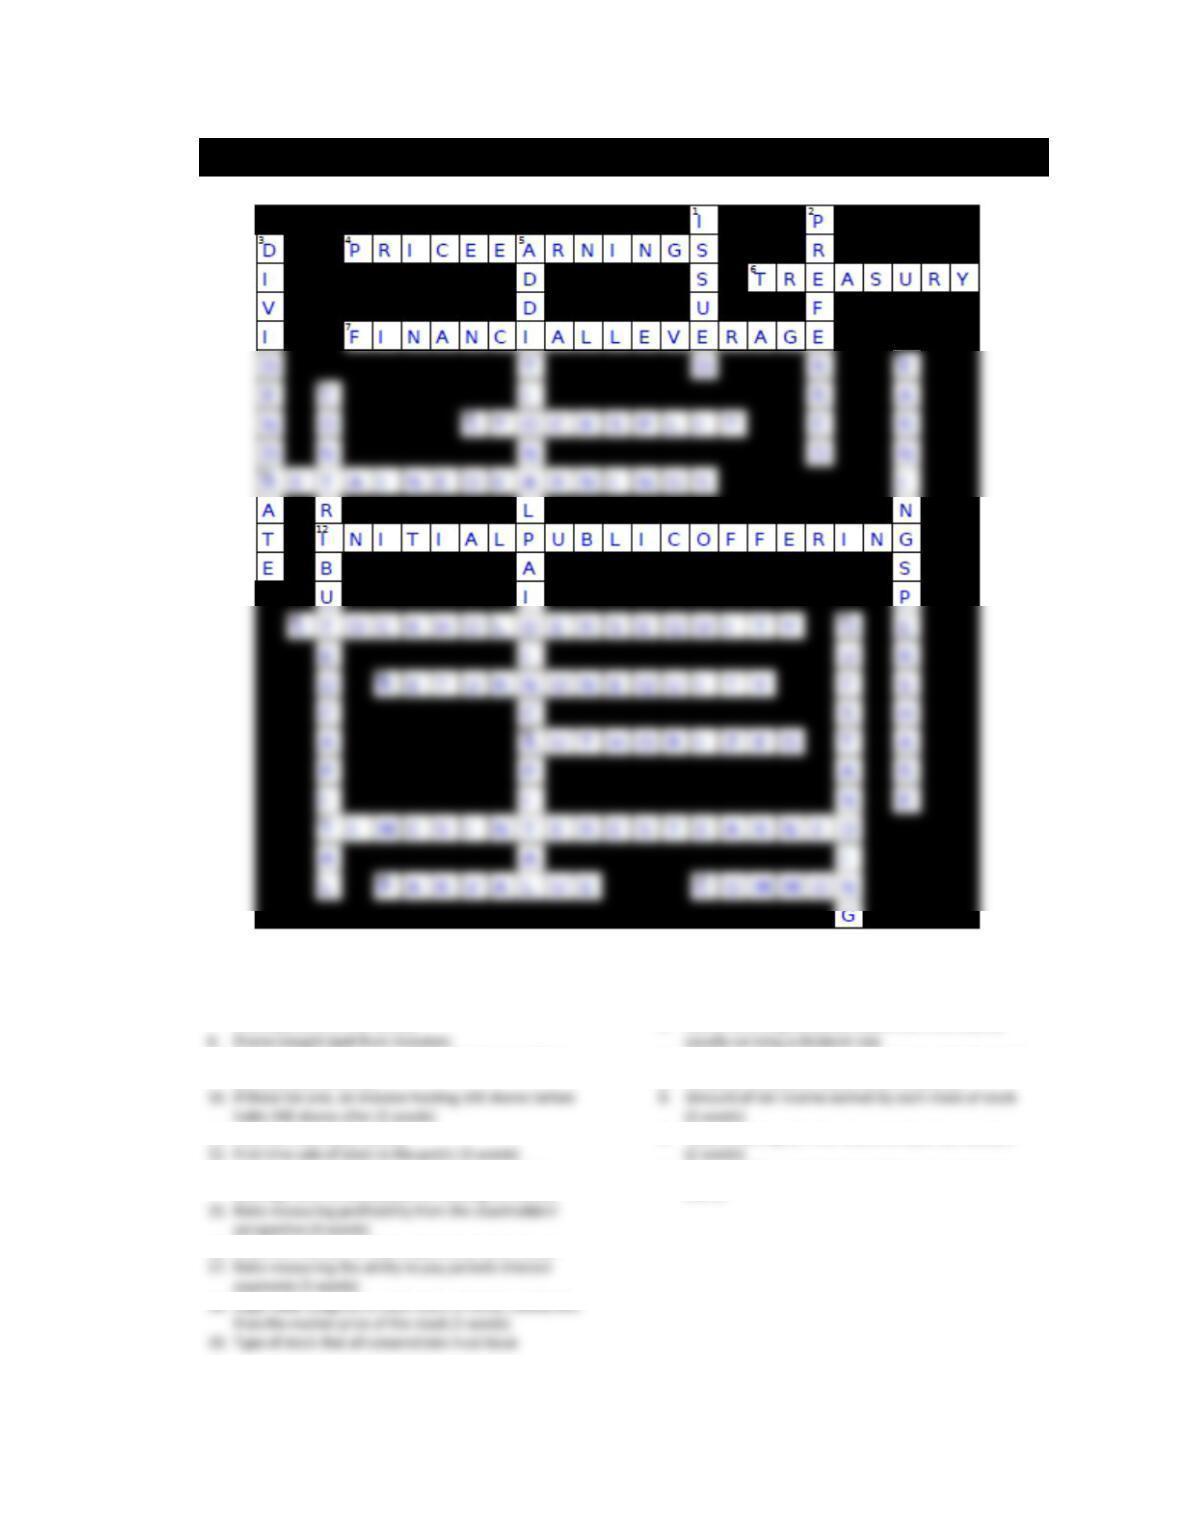
ACTIVITY 34 CROSSWORD PUZZLE FOR CHAPTER 4
Across
4. Ratio measuring how expensive a company’s stock price
is compared to EPS (2 words)
7. Solvency ratio that measures how debt boosts ROA to
increase ROE (2 words)
11. Internal financing (2 words)
13. Statement reporting changes in shares outstanding,
earnings, and the distribution of earnings (2 words)
16. Maximum number of shares permitted to be issued
Down
1. Shares sold to investors
2. Shares receiving dividends before common shares;
3. Per share amount of dividends paid annually (2 words)
5. Amounts received in excess of par (4 words)
9. Total amount paid-in for shares of stock by investors
14. Shares held by investors; issued shares less treasury
shares
6e Statement of Stockholders’ Equity Page 109 Chapter 4
ACTIVITY 35 STATEMENT OF STOCKHOLDERS’ EQUITY—TYPES OF STOCK
Purpose: • Identify three types of stock.
• Identify the number of shares authorized, issued, and outstanding.
• Compute the total cost of contributed capital and the average cost per share.
The Statement of Stockholders’ Equity provides information about changes in a company’s stockholders’
equity, including contributed capital and retained earnings. It helps investors understand the structure of
a company’s ownership.
• Contributed capital (CC) includes amounts paid-in (contributed) by stockholders to purchase the
stock of a corporation. There are two types of stock: common stock and preferred stock. Each
corporation must issue common stock, whereas preferred stock is optional.
• When originally issued, amounts received from investors are recorded in two separate accounts—
the Par Value account and an Additional Paid-in-Capital account. Par Value is a legal value assigned
to each share of stock upon incorporation, which must be recorded separately in the financial
statements. Additional Paid-in-Capital (APIC) is the amount received in excess of par.
Par Value + Additional Paid-in-Capital = Total Issue Price of Stock
Refer to the Statement of Stockholders’ Equity for American Eagle Outfitters, Inc. and accompanying notes
on page 107 to answer the following questions.
Upon incorporation, a company is authorized (by the state of incorporation) to issue a designated
number of shares to investors. Sometimes corporations buy back shares of stock that have been issued;
these are referred to as Treasury Stock. Shares outstanding are the total number of shares actually held
by investors at a given time, equaling shares issued less shares of treasury stock.
Shares issued – Treasury shares = Shares outstanding
6e Statement of Stockholders’ Equity Page 110 Chapter 4
Why does the average cost of issued common shares differ from the average cost of treasury
shares?
6e Statement of Stockholders’ Equity Page 111 Chapter 4
ACTIVITY 36 STATEMENT OF STOCKHOLDERS’ EQUITY
Purpose: • Interpret an increase and decrease in Stockholders’ Equity.
• Understand preferred and common stock dividends.
• Compute shares outstanding after a stock split.
Retained earnings (RE) are net income earned by the company since its incorporation and not yet
distributed as dividends. It is increased by net income, the earnings of this accounting period, and
decreased by dividends, a distribution of earnings.
Beginning Retained Earnings + Net Income – Dividends = Ending Retained Earnings
Refer to the Statement of Stockholders’ Equity for American Eagle Outfitters (AEO), Inc. and accompanying
notes presented on page 107 to answer the following questions.
Q1 For fiscal year ended on January 28, 2012 for AEO:
business assets owned by shareholders.
Q3 Assume that AEO issued 1 million shares of preferred stock with a dividend rate of $5 per share.
Q4 a. A company has 170 million common shares outstanding.
Assume there is a two-for-one stock split, after the stock split there would be
wealth.
c. Under International Financial Reporting Standards (IFRS), preferred stock would be classified
6e Statement of Stockholders’ Equity Page 112 Chapter 4
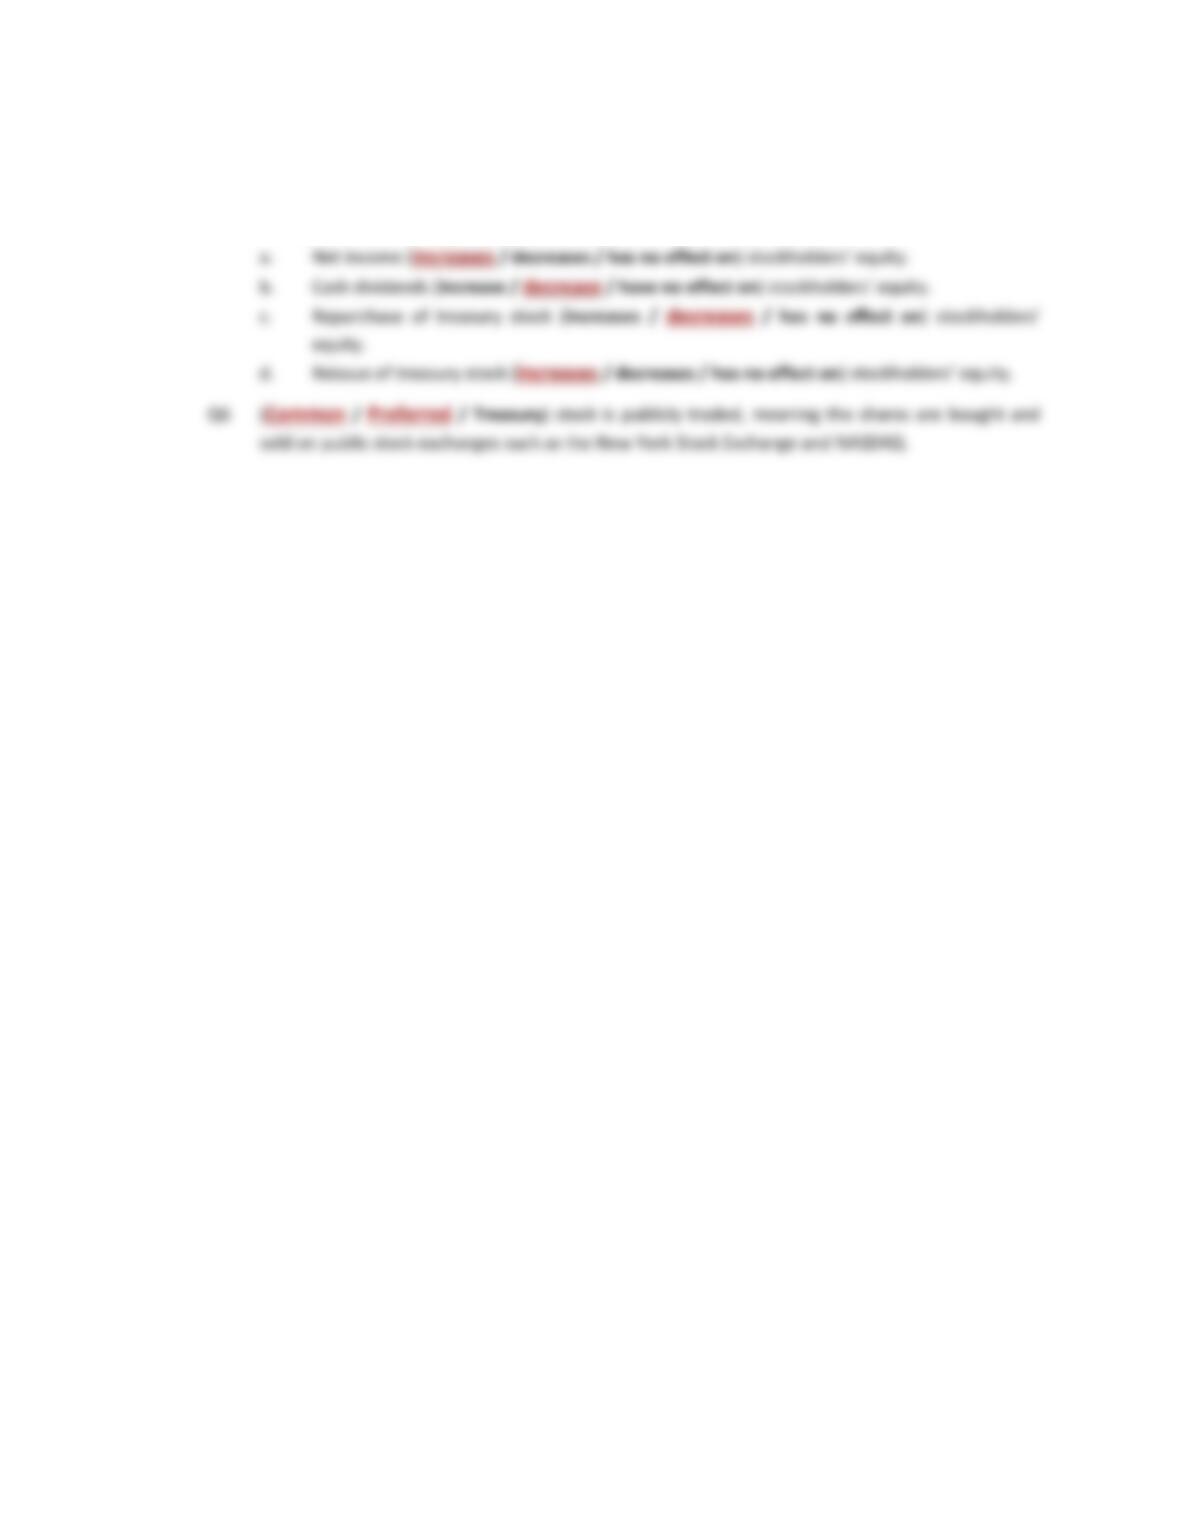
Q5 For each of the following events, identify the effect on stockholders’ equity.
6e Statement of Stockholders’ Equity Page 113 Chapter 4
ACTIVITY 37 RATIO ANALYSIS: EARNINGS PER SHARE
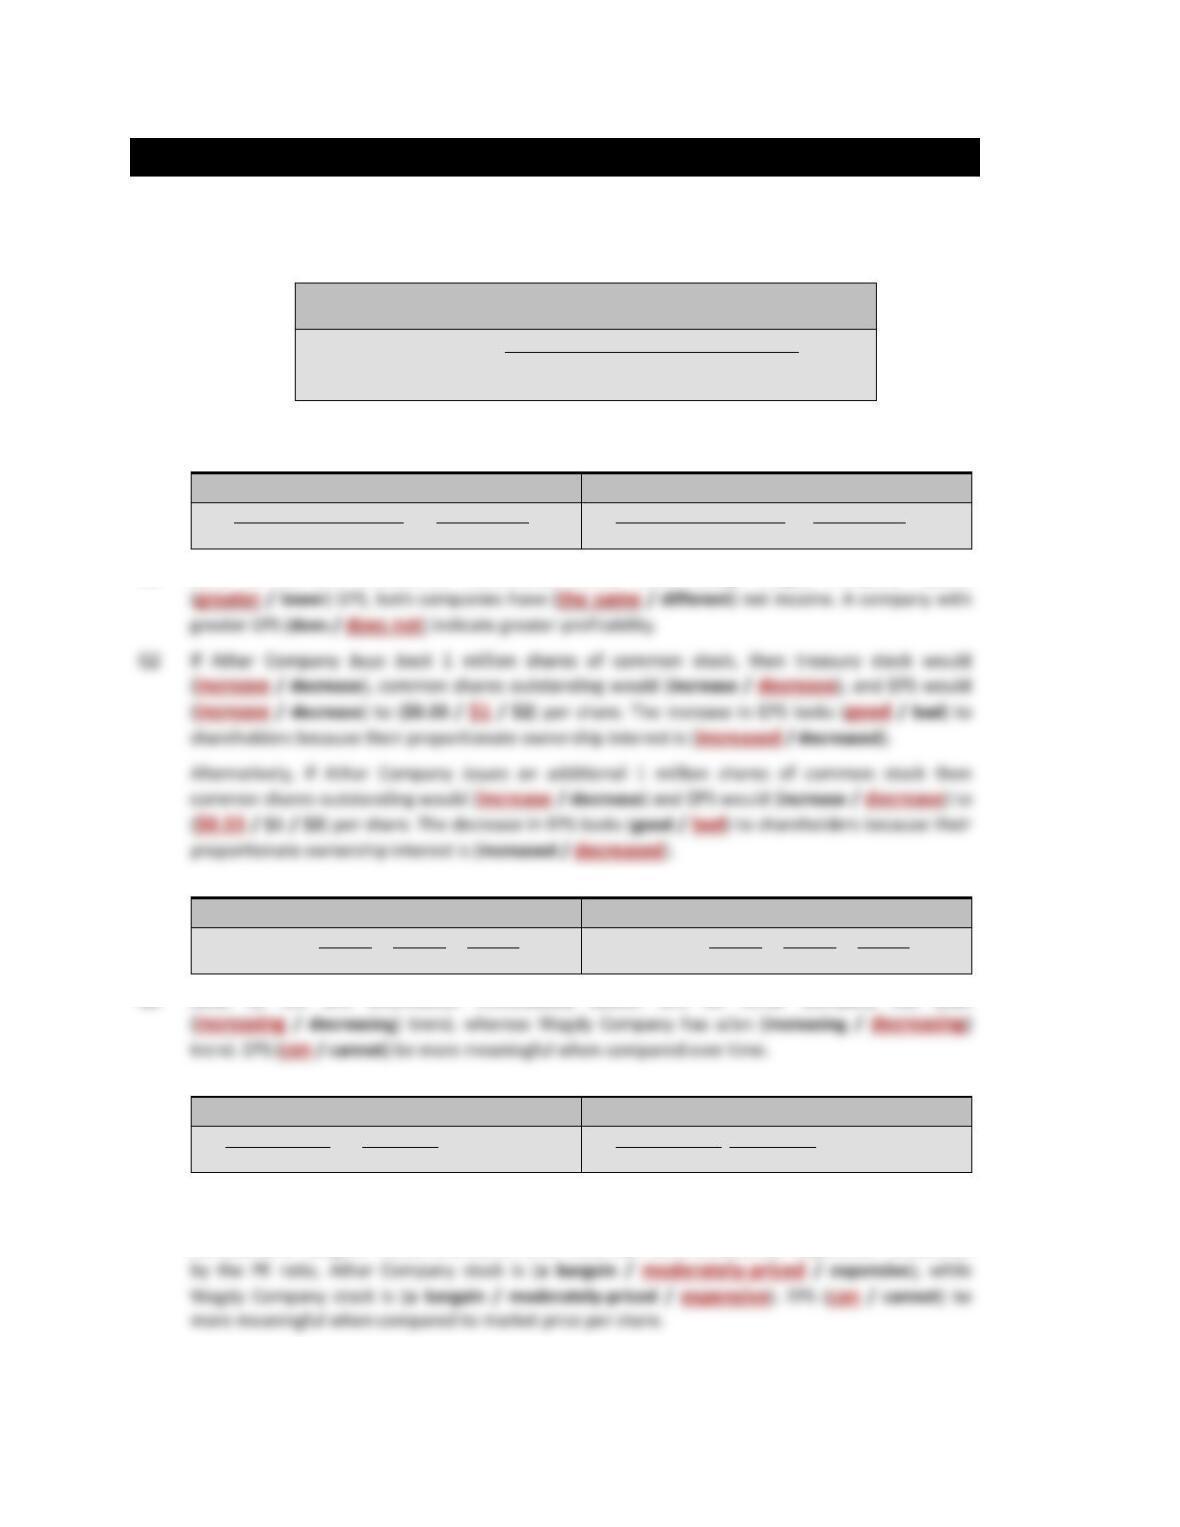
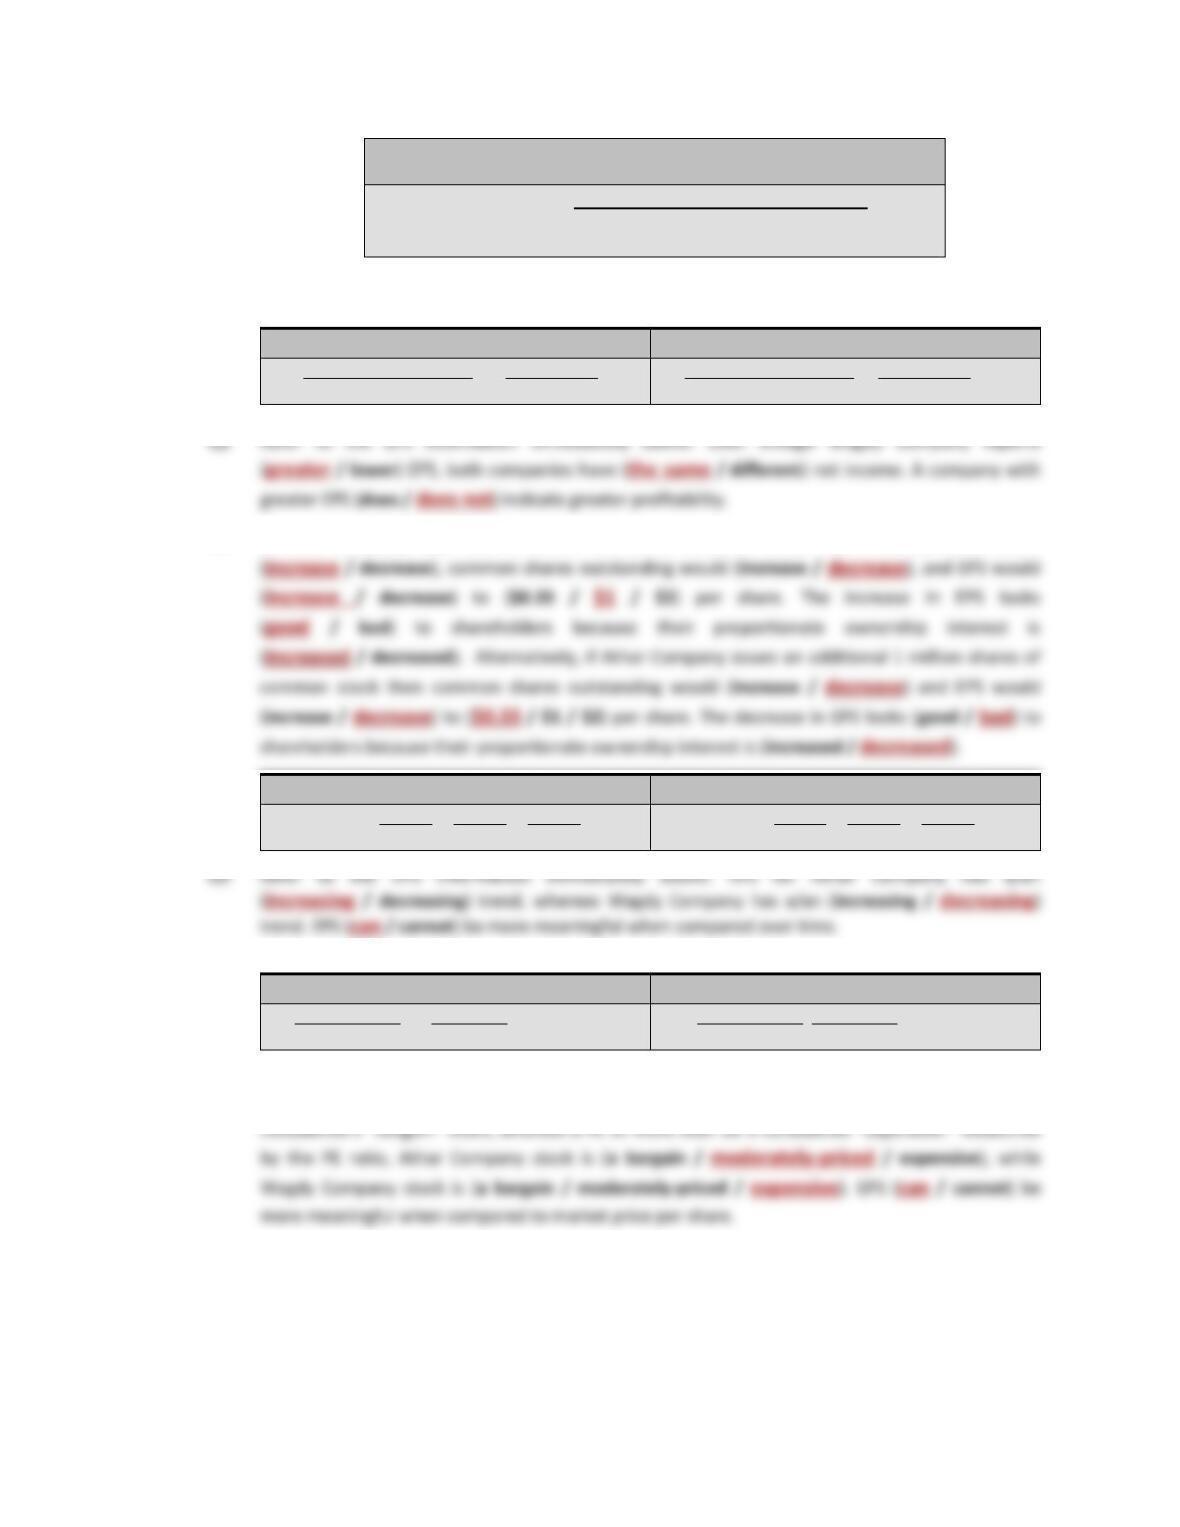
Purpose: • Understand that EPS cannot be used to compare profitability among companies.
• Compute how treasury stock affects EPS.
• Identify EPS trends and compare EPS to Market Price to enhance meaning.
Earnings per Share (EPS) indicates the amount of net income
earned by each individual share of stock held by investors.
EPS
=
Net income – Preferred dividends
Average number of
common shares outstanding
Use the EPS information below for Athar and Wagdy Companies to answer the following questions.
Athar Company EPS = $0.50
Wagdy Company EPS = $2.00
Net income = $1,000,000
Avg. # of CShares OS 2,000,000
Net income = $1,000,000
Avg. # of CShares OS 500,000
Q1 Refer to the EPS information immediately above. Even though Wagdy Company reports
Athar Company EPS = $0.50
Wagdy Company EPS = $2.00
Year 1 Year 2 Year 3
EPS $0.10 $0.20 $0.50
Year 1 Year 2 Year 3
EPS $8 $4 $2
Q3 Refer to the EPS information immediately above. EPS for Athar Company has a/an
Athar Company EPS = $0.50
Wagdy Company EPS = $2.00
Market Price = $6/share = PE Ratio
EPS $0.50 of 12
Market Price $60/share = PE Ratio
EPS $2.00 of 30
Q4 Refer to the EPS and the Market Price information immediately above. The PE Ratio measures how
expensive a stock is; how much investors are willing to pay for each $1 of EPS. A PE below 10 is
considered a “bargain” stock, whereas a PE of more than 20 is considered “expensive.” Measured
6e Statement of Stockholders’ Equity Page 114 Chapter 4
Earnings per Share (EPS) indicates the amount of net income
earned by each individual share of stock held by investors.
EPS
=
Net income – Preferred dividends
Average number of
common shares outstanding
Use the EPS information below for Athar and Wagdy Companies to answer the following questions.
Athar Company EPS = $0.50
Wagdy Company EPS = $2.00
Net income = $1,000,000
Avg. # of CShares OS 2,000,000
Net income = $1,000,000
Avg. # of CShares OS 500,000
Q2 If Athar Company buys back 1 million shares of common stock, then treasury stock would
Athar Company EPS = $0.50
Wagdy Company EPS = $2.00
Year 1 Year 2 Year 3
EPS $0.10 $0.20 $0.50
Year 1 Year 2 Year 3
EPS $8 $4 $2
Athar Company EPS = $0.50
Wagdy Company EPS = $2.00
Market Price = $6/share = PE Ratio
EPS $0.50 of 12
Market Price $60/share = PE Ratio
EPS $2.00 of 30
Q4 Refer to the EPS and the Market Price information immediately above. The PE Ratio measures how
expensive a stock is; how much investors are willing to pay for each $1 of EPS. A PE below 10 is
ACTIVITY 38 RATIO ANALYSIS: FINANCIAL LEVERAGE
Purpose: • Understand how debt affects financial leverage and ROE.
• Compute ROS, Asset Turnover, ROA, Financial Leverage, ROE, and the Debt Ratio.
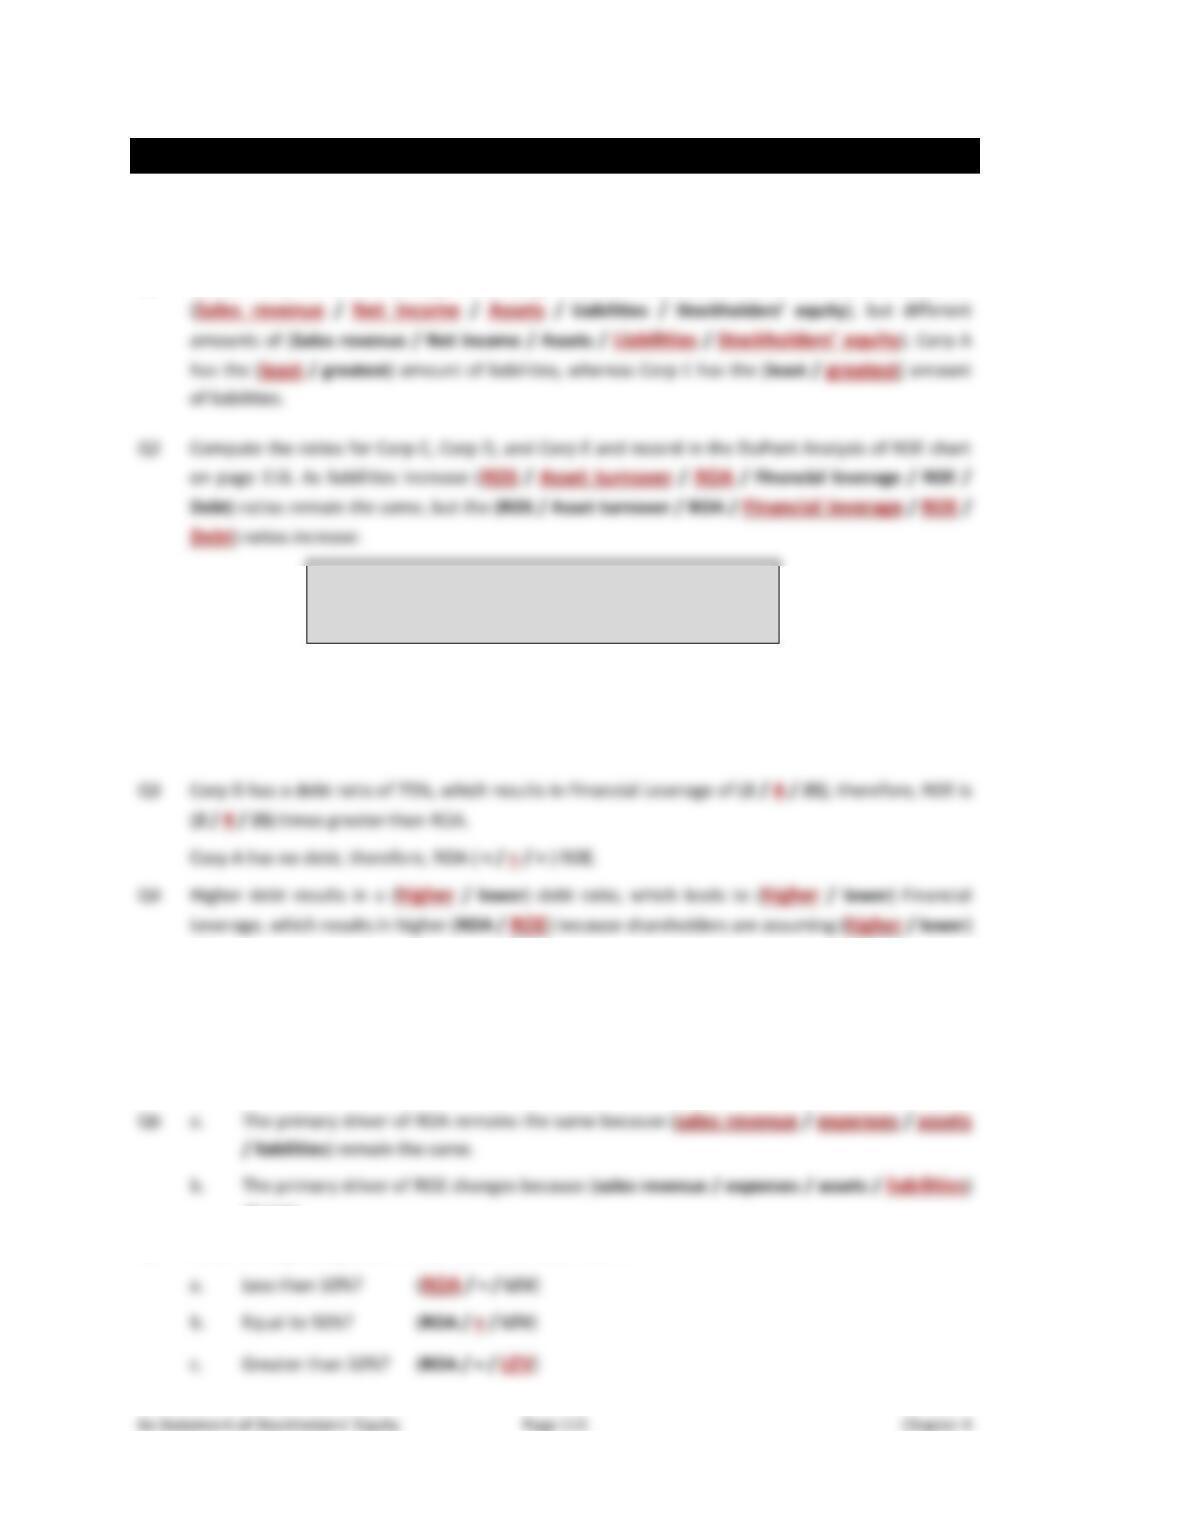
Q1 Review Corporations A through E on page 113. All corporations have the same amount of
Financial Leverage Ratio = Assets / SE
Debt Ratio = Liabilities / Assets
Because A = L + SE you can convert:
Financial Leverage Ratio = 1 / (1 – Debt Ratio)
risk.
Q5 In the Primary Driver chart on the previous page:
a. Circle the Primary Driver of ROA as either ROS or Asset Turnover.
b. Circle the Primary Driver of ROE as either ROA, Financial Leverage, or of equal (=)
contribution.
change.
Q7 What is the primary driver of ROE when the debt ratio is:
DUPONT ANALYSIS of ROE
Formula
CORP A
CORP B
CORP C
CORP D
CORP E
Sales revenue
$ 100
$ 100
$ 100
$ 100
$ 100
Net income
10
10
10
10
10
Assets
100
100
100
100
100
Liabilities
0
25
50
75
96
Stockholders’ equity
$ 100
$ 75
$ 50
$ 25
$ 4
Assets
Assets
PRIMARY DRIVER CHART
Primary
Driver
CORP A
CORP B
CORP C
CORP D
CORP E
6e Statement of Stockholders’ Equity Page 117 Chapter 4
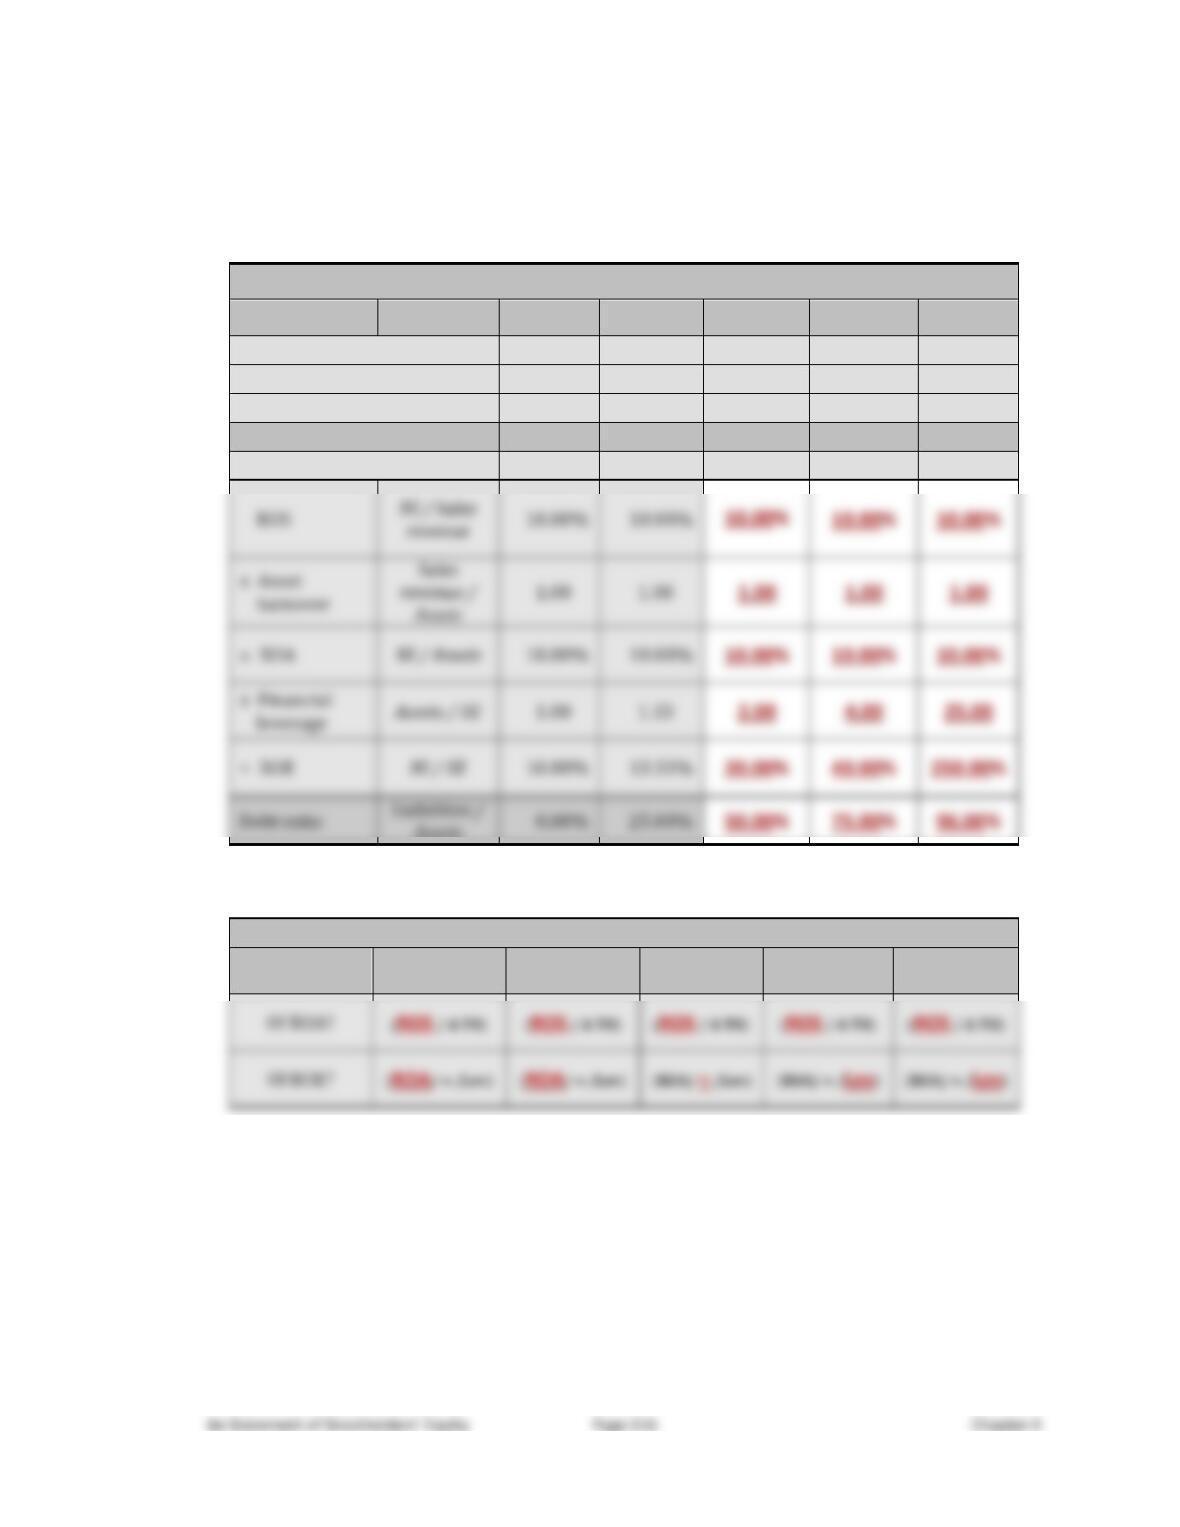
ACTIVITY 39 FINANCIAL LEVERAGE OF THREE COMPANIES
Purpose: • Understand how debt affects financial leverage and ROE.
• Compute Financial Leverage and ROE.
$ in Millions
Formula
YHOO
12/31/2011
COST
8/29/2011
CAT
12/31/2011
Sales revenue
4,984
88,915
60,138
Net income
1,049
1,462
4,928
Assets
14,783
26,761
81,446
Liabilities
2,242
14,759
68,563
Stockholders’ equity
12,541
12,002
12,883
ROS
NI / Sales Revenue
21.05%
1.64%
8.19%
x Asset turnover
Sales Revenue / Assets
0.3371
3.3226
0.7384
Debt ratio
Liabilities / Assets
15.17%
55.15%
84.18%
*Small rounding error.
Refer to the financial information above for Yahoo! Inc. (YHOO), Costco Wholesale Corporation (COST),
and Caterpillar Inc. (CAT) to answer the following questions.
Q1 Which company offers products to members in a range of merchandise categories that have been
Q5 In the Primary Driver chart above:
a. Circle the Primary Driver of ROA as either ROS or Asset Turnover.
b. Circle the Primary Driver of ROE as either ROA, Financial Leverage, or of approximately equal
(=) contribution.
7.096%
5.46%
6.05%
1.1788
6e Statement of Stockholders’ Equity Page 118 Chapter 4
Q6 Using only the financial information above, which company would you prefer to invest in?
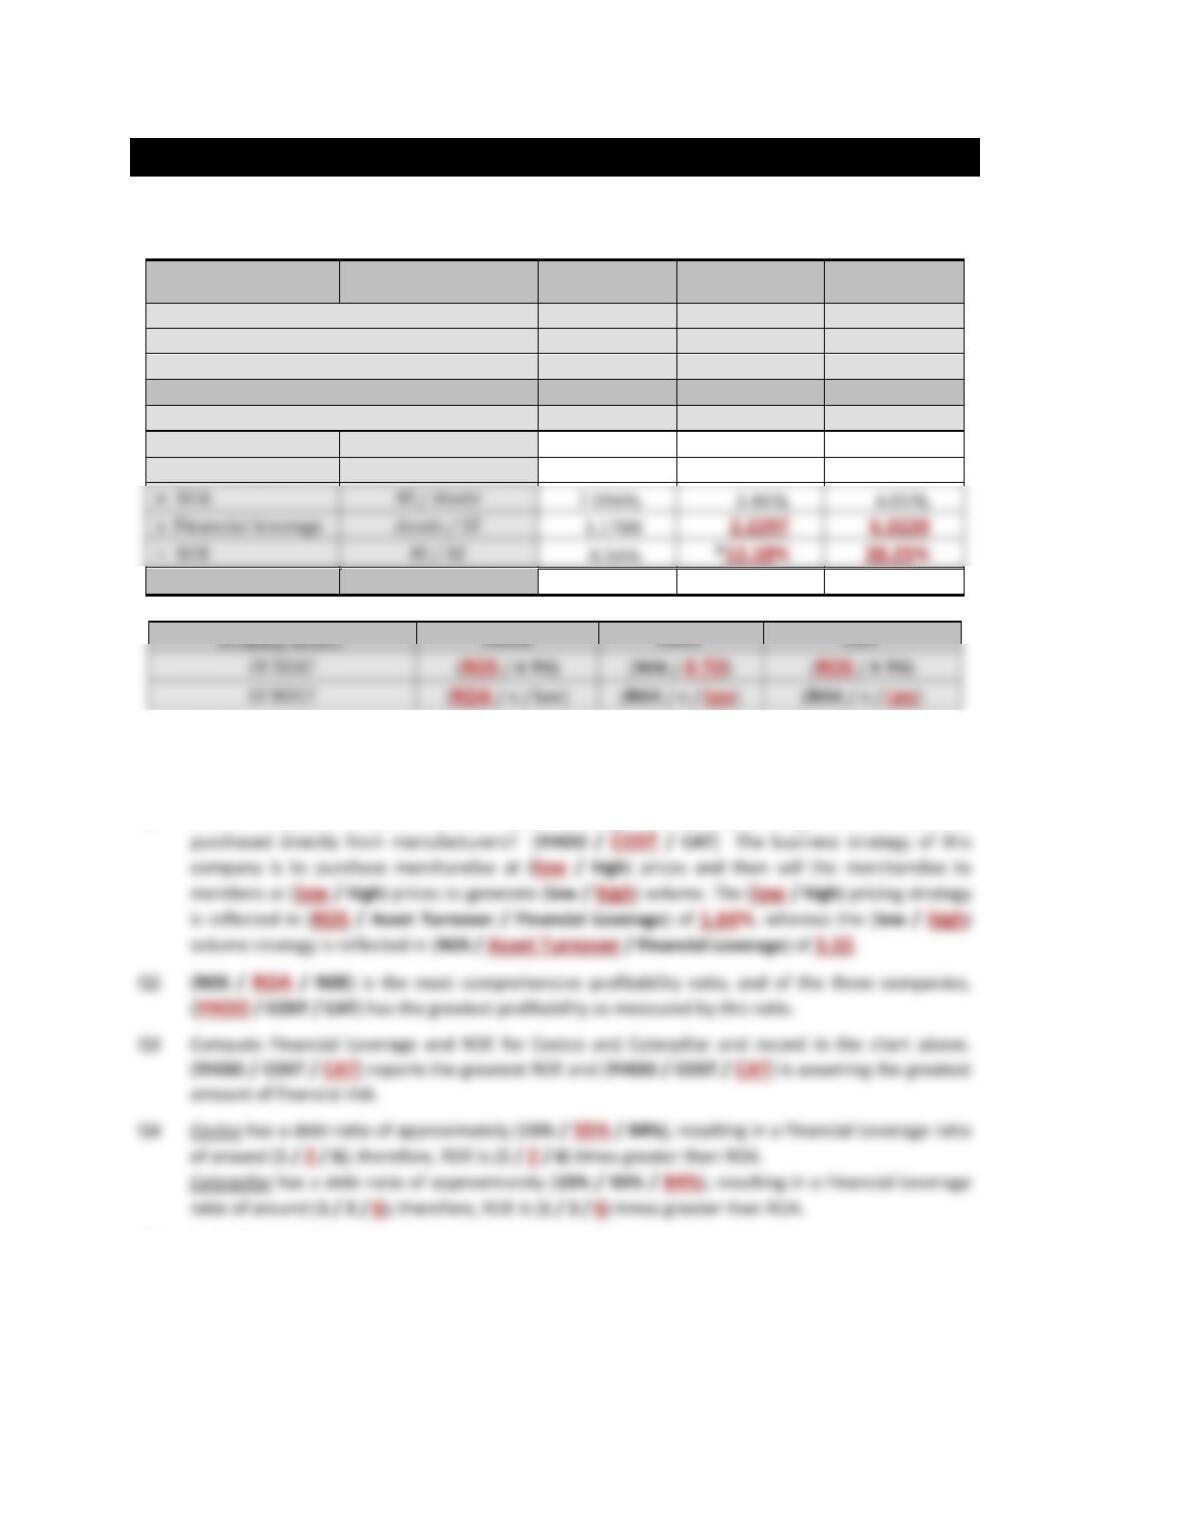
ACTIVITY 40 RATIO ANALYSIS
Purpose: • Review a number of ratios to better evaluate a company.
• Understand that the expected range of ratios varies by industry.
• Understand that comparing a ratio to industry norms enhances meaning.
Ratios reveal relationships.
Below are ratios with explanations introduced in this chapter. See Appendix B for additional ratios.
Financial Leverage is similar to the debt ratio, in the sense that the more debt a company has, the
higher the Financial Leverage. It measures how debt “boosts” return on assets to increase return on
equity.
Financial Leverage
=
Total assets
Stockholders’ equity
The Return on Equity (ROE) ratio measures how effectively stockholders’ equity is used to produce
net income. ROA x Financial Leverage = ROE
ROE
=
Net income
Stockholders’ equity
Times Interest Earned indicates a company’s ability to earn (cover) its periodic interest payments.
Times Interest Earned
=
Operating income
Interest expense
Earnings per Share (EPS) is the amount of net income (loss) earned by each individual share of stock
held by investors.
EPS
=
Net income – Preferred dividends
Average number of common shares outstanding
The Dividend Rate is the amount of dividends paid annually for each share of stock held by investors.
Dividend Rate
=
Annual common stock dividends paid
Investors use the Price Earnings (PE) ratio to measure how “expensive” a company’s stock is
compared to EPS. Regrettably, it does not explain why a stock is expensive or cheap.
Market price per share
EPS
6e Statement of Stockholders’ Equity Page 120 Chapter 4
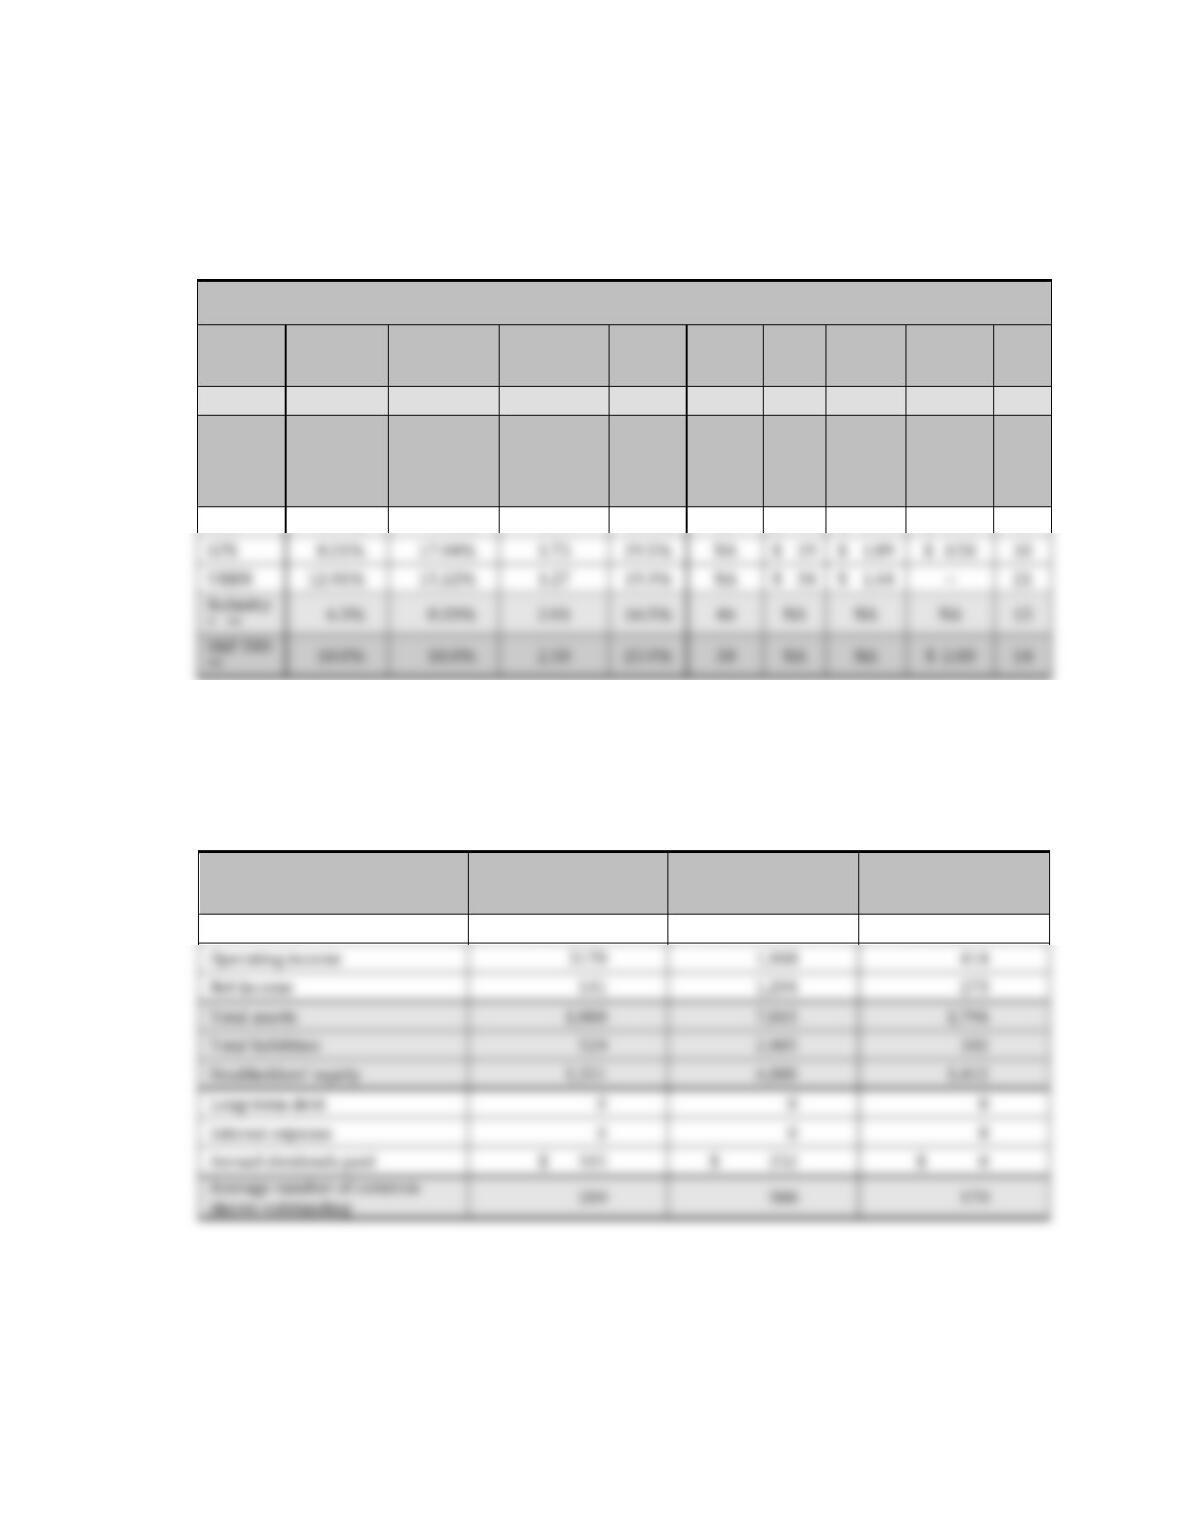
Below are ratios and selected financial information for three companies within the Retail Apparel industry:
American Eagle Outfitters, Inc. (AEO), GAP Inc. (GPS), and Urban Outfitters Inc.(URBN).
RATIOS for the fiscal year ended January 29, 2011
RATIO
ROS
ROA x
Financial
Leverage
= ROE
Times
Interest
Earned
Market
Price
EPS
Dividend
Rate
PE
Ratio
Type
Profit
Profit
Solvency
Profit
Solvency
Invest
Profit
Invest
Invest
Formula
NI /
Sales
Revenue
NI /
Total Assets
Total Assets/
SE
NI / SE
Operating
Income /
Interest
Expense
NA
NI –
Preferred
Div / Avg #
of CShares
OS
Annual Div
paid / Avg #
of CShares
OS
Market
Price /
EPS
AEO
4.75%
7.50%
1.39
10.4%
NA
$ 14
$ 0.91
$ 0.44
15
* Industry Averages for Apparel Stores—Industry and S&P 500 ratio averages from moneycentral.msn.com
** There are no official rules governing how these ratios are calculated. Therefore, the ratio formulas used may
differ from the formulas in the text.
For the fiscal year ended
January 29, 2011
(In Millions)
American Eagle
Outfitters (AEO)
Gap
(GPS)
Urban Outfitters
(URBN)
Sales revenue
$ 2,968
$ 14,664
$ 2,274
Operating income
Net income
Total assets
Total liabilities
Long-term debt
Interest expense
Annual dividends paid
GPS
8.21%
17.04%
1.73
29.5%
NA
$ 1.89
$ 0.50
10
URBN
1.27
19.3%
NA
$ 34
$ 1.64
21
6e Statement of Stockholders’ Equity Page 121 Chapter 4
Refer to the ratios and selected financial information for three companies within the Retail Apparel
Industry: American Eagle Outfitters, Inc. (AEO), GAP Inc. (GPS), and Urban Outfitters Inc. on the previous
page to answer the following questions.
Apparel Store Industry.
S&P 500.
Bargain PE < PE Ratio of 10 to 20 < Expensive PE
6e Statement of Stockholders’ Equity Page 122 Chapter 4
6e Statement of Stockholders’ Equity Page 123 Chapter 4
ACTIVITY 41 TEST YOUR UNDERSTANDING
Purpose: • Identify reasons for change in cash, total liabilities, and stockholders’ equity
• Explain how changes in the balance sheet and income statement affect ROA and ROE
• Explain the effect of a huge cash dividend payment
Refer to the financial statement and ratio information for Microsoft on page 119 to answer the following
questions.
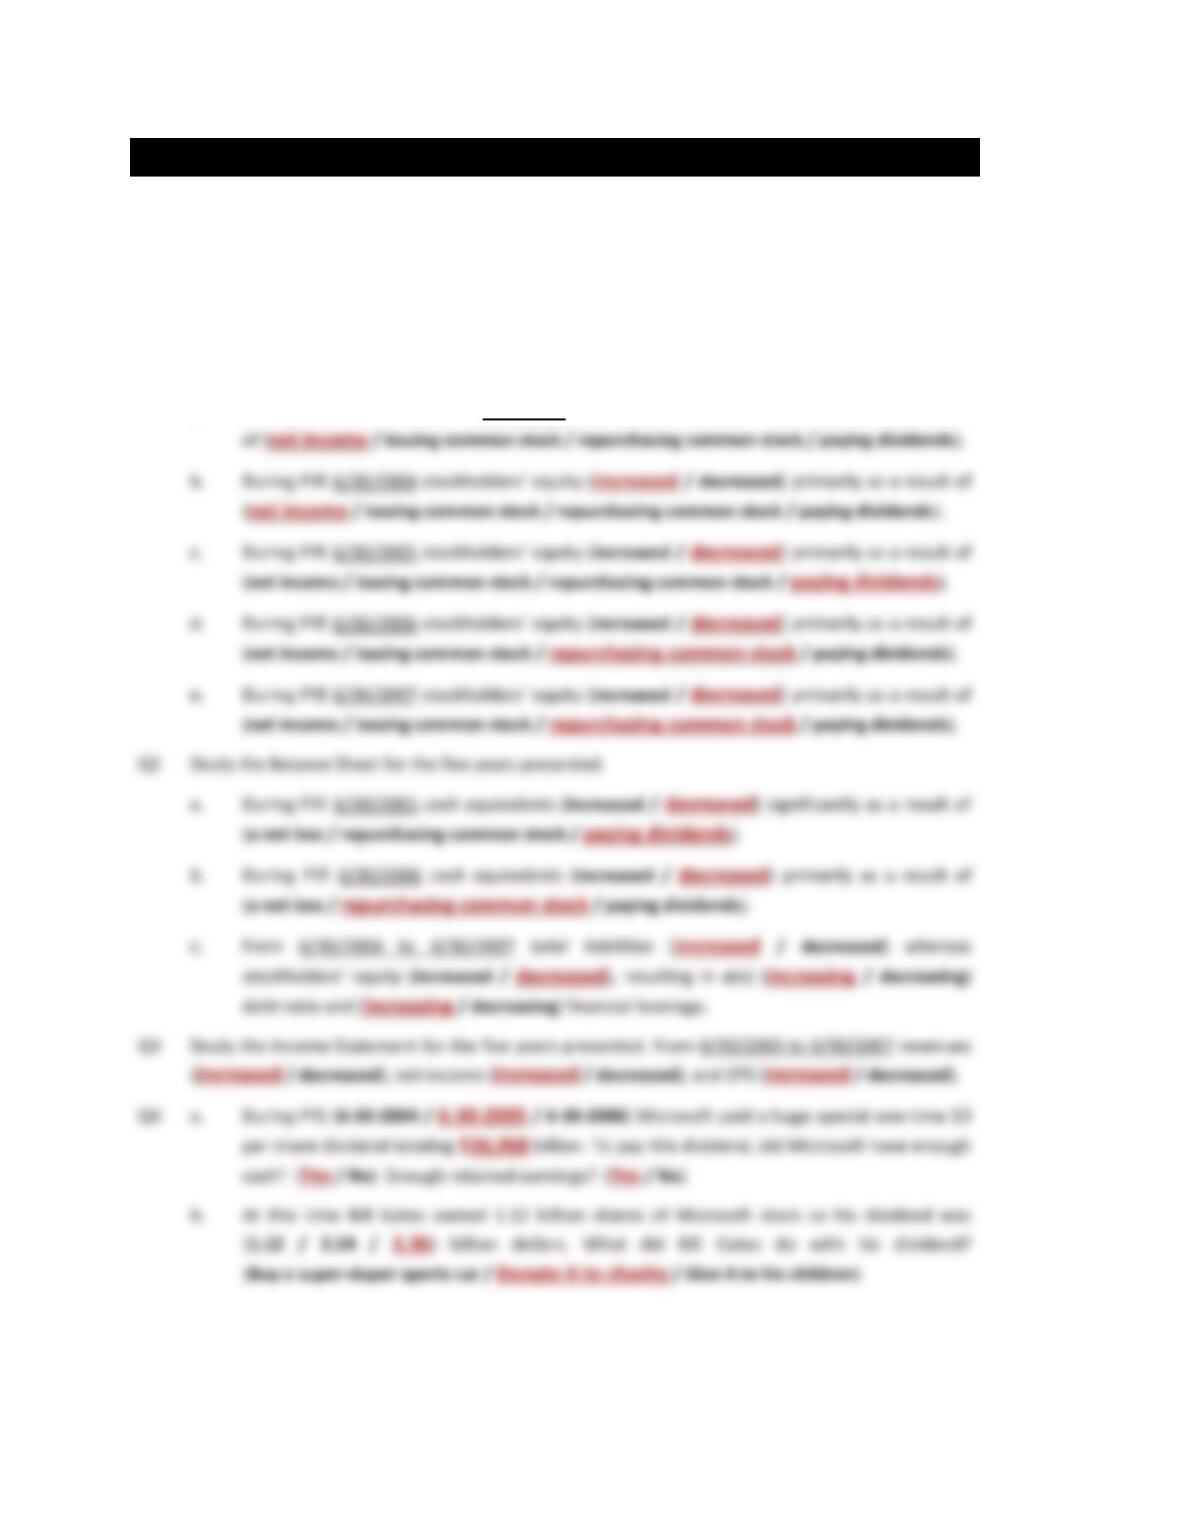
Q1 Study the Statement of Stockholders’ Equity for the five years presented.
a. During fiscal year ended (FYE) 6/30/2003 stockholders’ equity increased primarily as a result
6e Statement of Stockholders’ Equity Page 124 Chapter 4
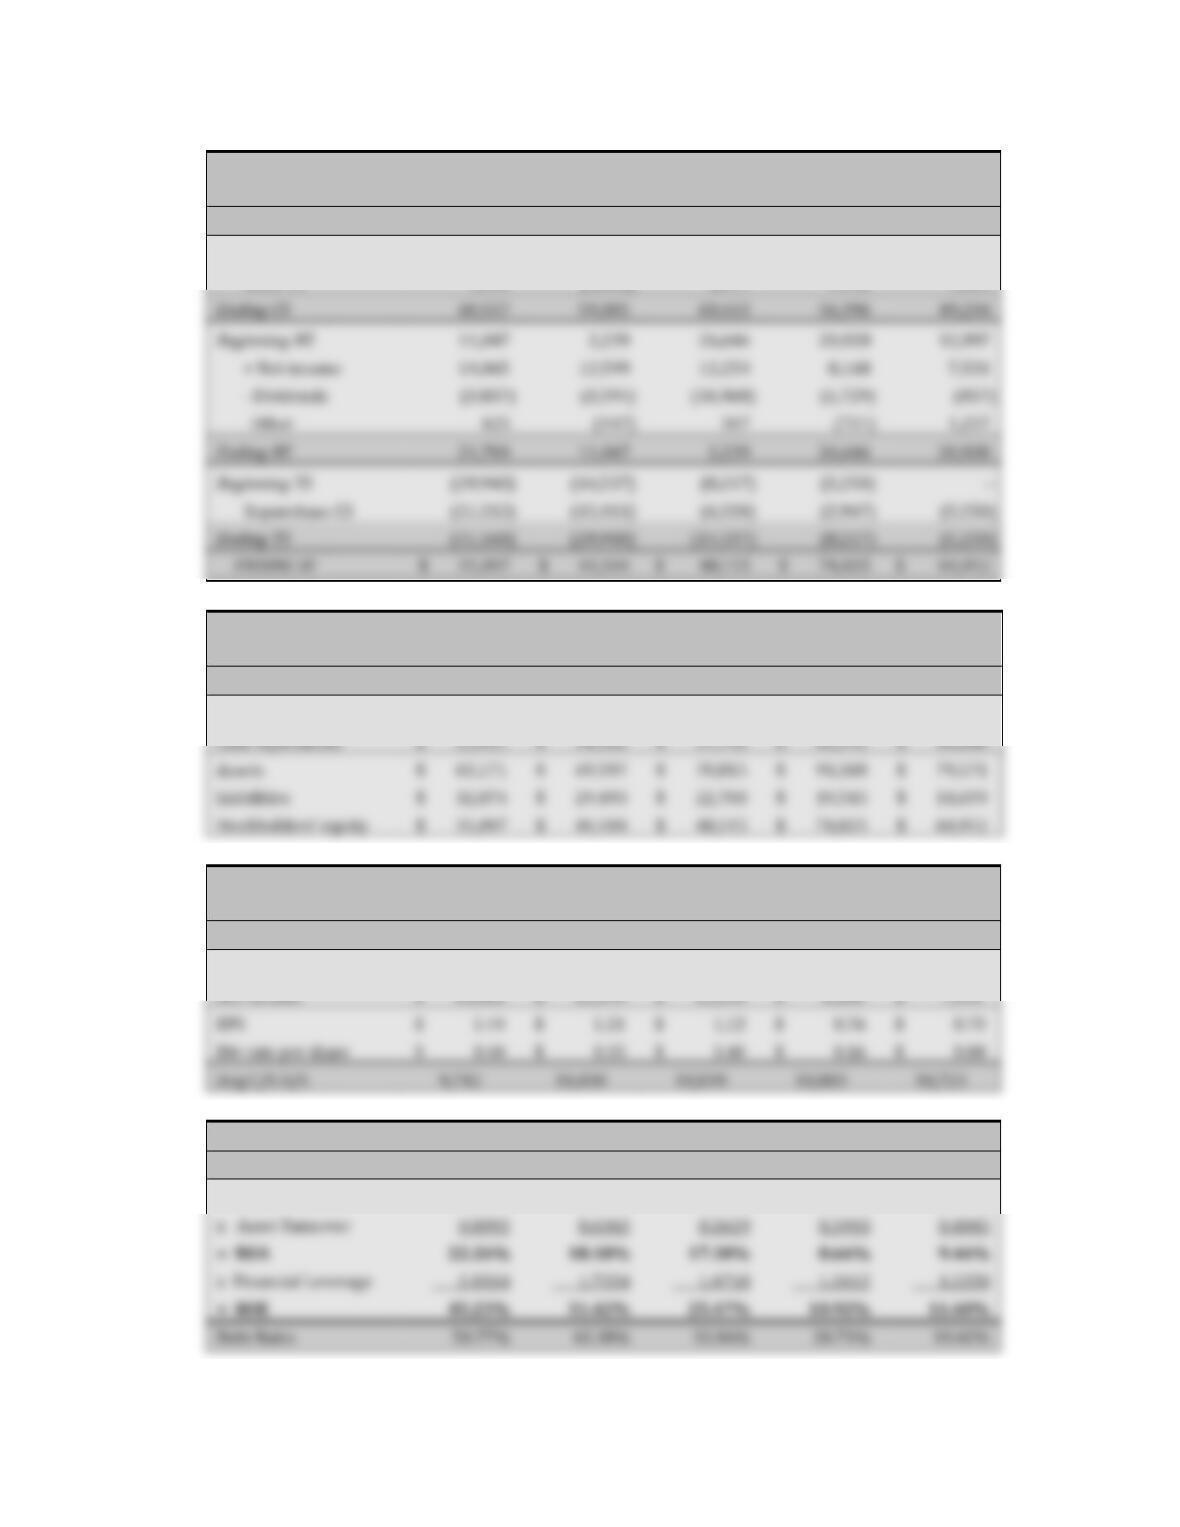
MICROSOFT
STATEMENT OF STOCKHOLDERS’ EQUITY
Adapted from the Form 10-K, $ in millions
6/30/2007
6/30/2006
6/30/2005
6/30/2004
6/30/2003
Beginning CS
$ 59,005
$ 60,413
$ 56,396
$ 49,234
$ 41,845
Issue CS
1,552
(1,408)
4,017
7,162
7,389
MICROSOFT
BALANCE SHEET
Selected Amounts in Millions
6/30/2007
6/30/2006
6/30/2005
6/30/2004
6/30/2003
Cash/Assets
37.06%
49.08%
53.31%
64.21%
61.64%
Cash equivalents
$ 23,411
$ 34,161
$ 37,751
$ 60,592
$ 49,048
Assets
$ 63,171
$ 69,597
$ 70,815
$ 94,368
$ 79,571
Liabilities
$ 32,074
$ 29,493
$ 22,700
$ 19,543
$ 14,659
$ 31,097
$ 40,104
$ 48,115
$ 74,825
$ 64,912
MICROSOFT
INCOME STATEMENT
Selected Amounts in Millions, Except per Share Data
Fiscal year ended…
6/30/2007
6/30/2006
6/30/2005
6/30/2004
6/30/2003
Revenue
$ 51,122
$ 44,282
$ 39,788
$ 36,835
$ 32,187
Net income
$ 14,065
$ 12,599
$ 12,254
$ 8,168
$ 7,531
EPS
$ 1.44
$ 1.21
$ 1.13
$ 0.76
$ 0.70
Div rate per share
$ 0.40
$ 0.35
$ 3.40
$ 0.16
$ 0.08
Avg C/S O/S
MICROSOFT
DUPONT ANALYSIS of ROE
6/30/2007
6/30/2006
6/30/2005
6/30/2004
6/30/2003
ROS
27.51%
28.45%
30.80%
22.17%
23.40%
x Asset Turnover
22.26%
18.10%
17.30%
45.23%
31.42%
25.47%
10.92%
11.60%
Ending CS
Beginning RE
2,239
+ Net income
8,168
7,531
– Dividends
(3,837)
(3,594)
(1,729)
Other
1,257
Ending RE
2,239
Beginning TS
(8,217)
(5,250)
Repurchase CS
(6,320)
(2,967)
(5,250)
Ending TS
(8,217)
6e Statement of Stockholders’ Equity Page 125 Chapter 4
Q5 Review the DuPont Analysis of ROE for the five years presented.
a. Asset turnover = Sales revenue / Total assets. During FYE 6/30/2005 revenue
c. Financial Leverage = SE / Total Assets. During FYE 6/30/2005 liabilities
Q6 What might have prompted this special one-time dividend?
Q7 Review the financial information presented for Microsoft. Explain how the special one-time $3
dividend affected each of the following items.
a. Cash, Asset Turnover, and ROA
6e Statement of Stockholders’ Equity Page 126 Chapter 4
Q9 Review the financial information presented for Microsoft. Explain how the purchase of common
stock (treasury stock) affected each of the following items.
a. Cash, Asset Turnover, and ROA
b. Debt Ratio, Financial Leverage, and ROE