Jiambalvo Managerial Accounting
4-16
d.
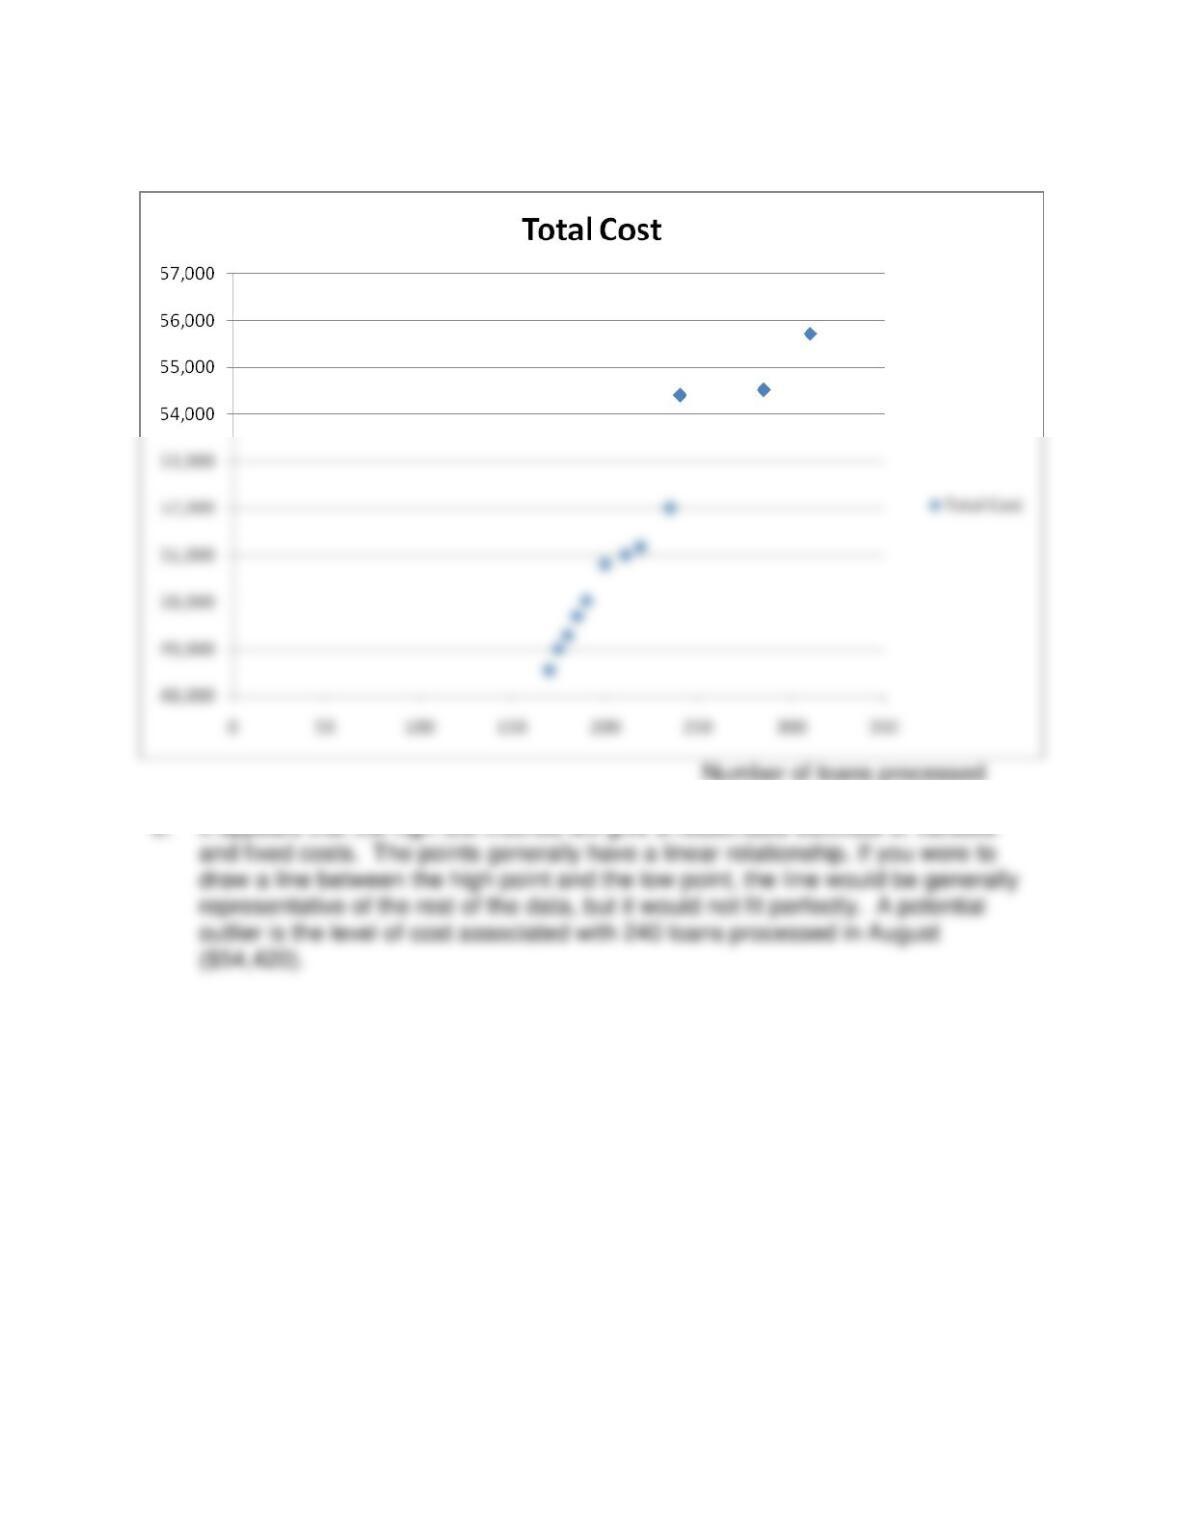
Number of loans processed
P11. [LO 2]
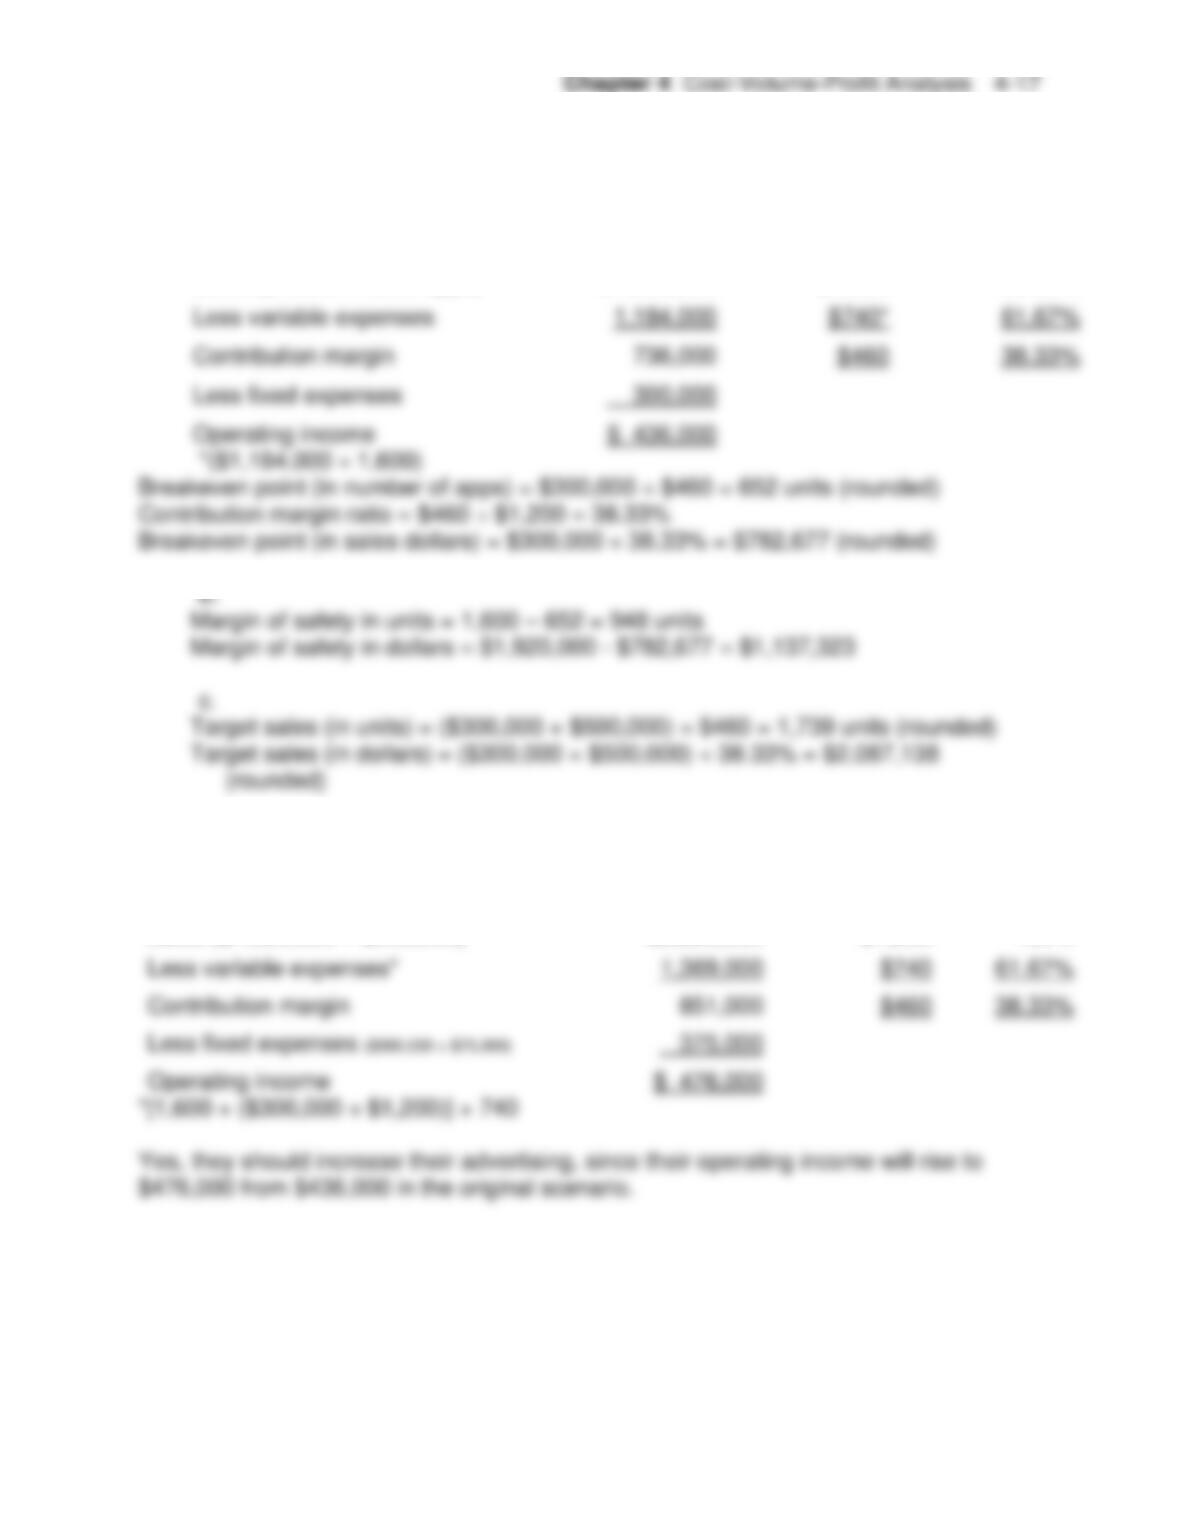
a.
Total
Per unit
Percent
Sales ($1,200 x 1,600 apps)
$1,920,000
$1,200
100.00%
Less variable expenses
$740*
61.67%
Contribution margin
38.33%
Less fixed expenses
Operating income
d. New income statement:
Total
Per unit
Percent
Sales ($1,920,000 + $300,000)
$2,220,000
$1,200
100%
Less variable expenses*
Contribution margin
Less fixed expenses ($300,000 + $75,000)
Operating income
Jiambalvo Managerial Accounting
4-18
P12. [LO 2]
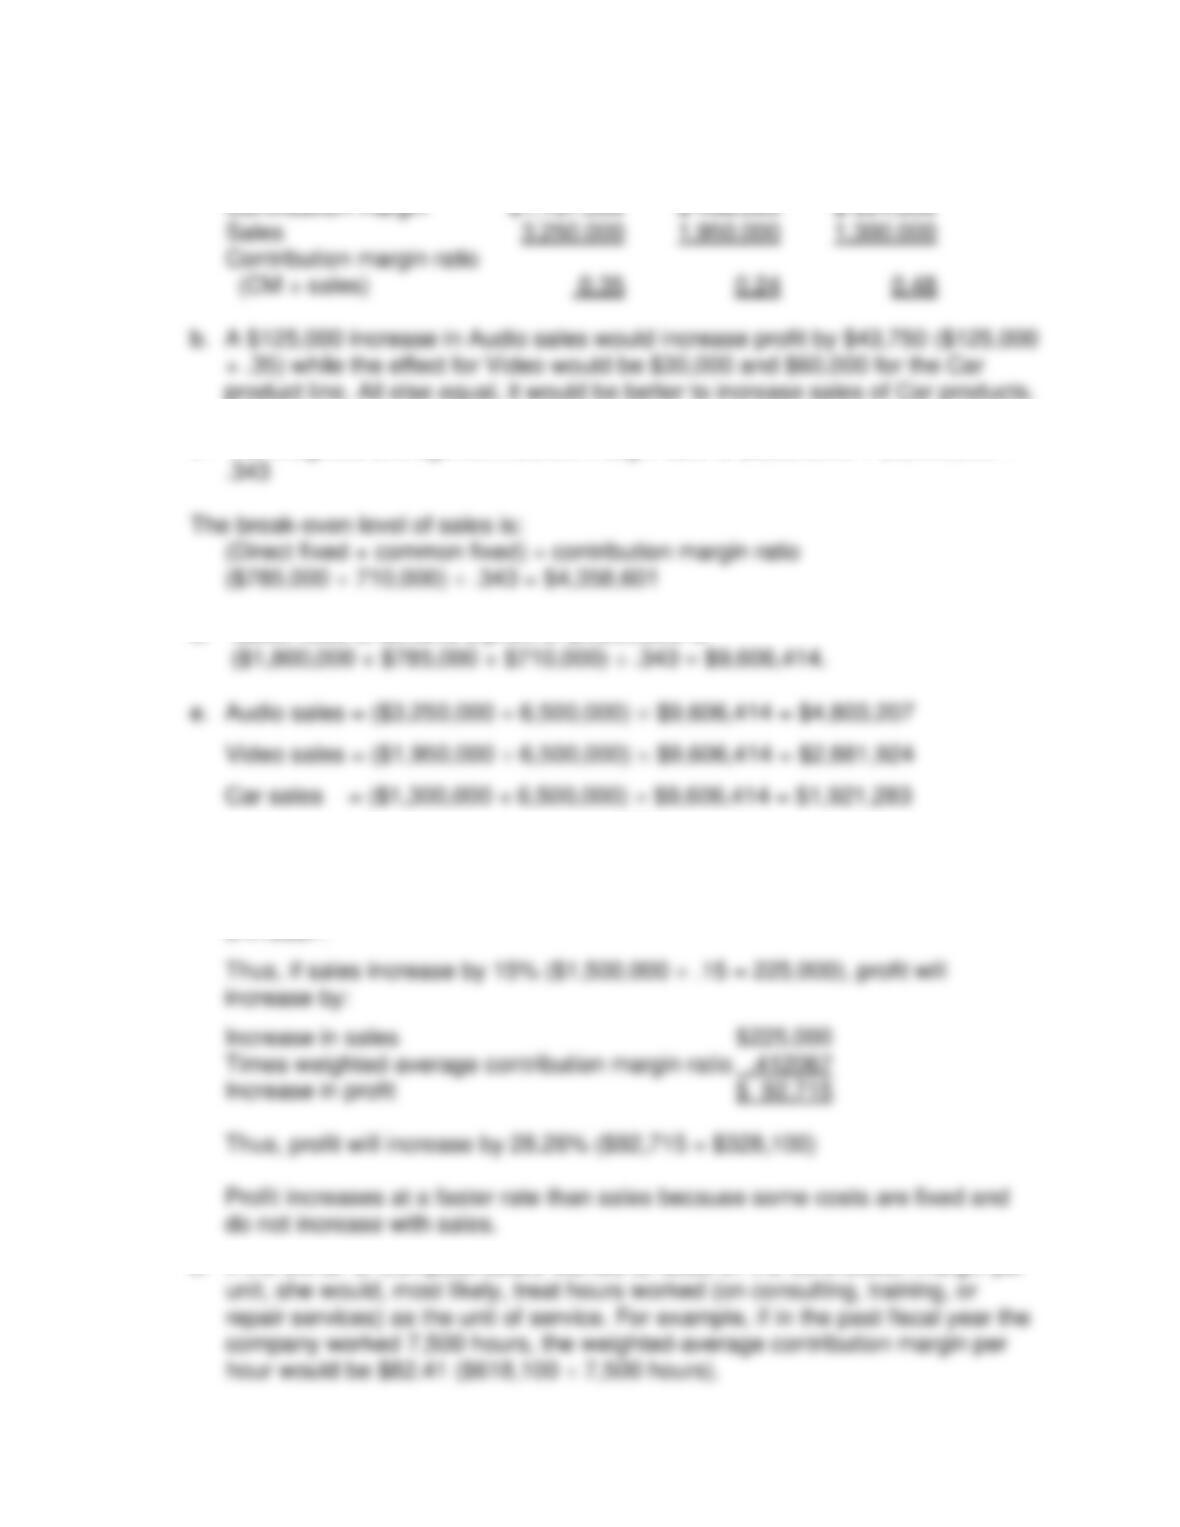
a. Audio Video Car
product line. All else equal, it would be better to increase sales of Car products.
c. The weighted average contribution margin ratio is $2,229,500 ÷ $6,500,000 =
d. Sales need to achieve a profit of $1,800,000 is
P13. [LO 2, 3]
a. The weighted-average contribution margin ratio is $618,100 ÷ $1,500,000 =
0.412067.
b. If the owner of ComputerGuard wanted to focus on the contribution margin per
Chapter 4 Cost-Volume-Profit Analysis 4-19
P14. [LO 2]
a.
Smasher
Basher
Dinker
Total
Units sold
2,000
3,000
3,000
8,000
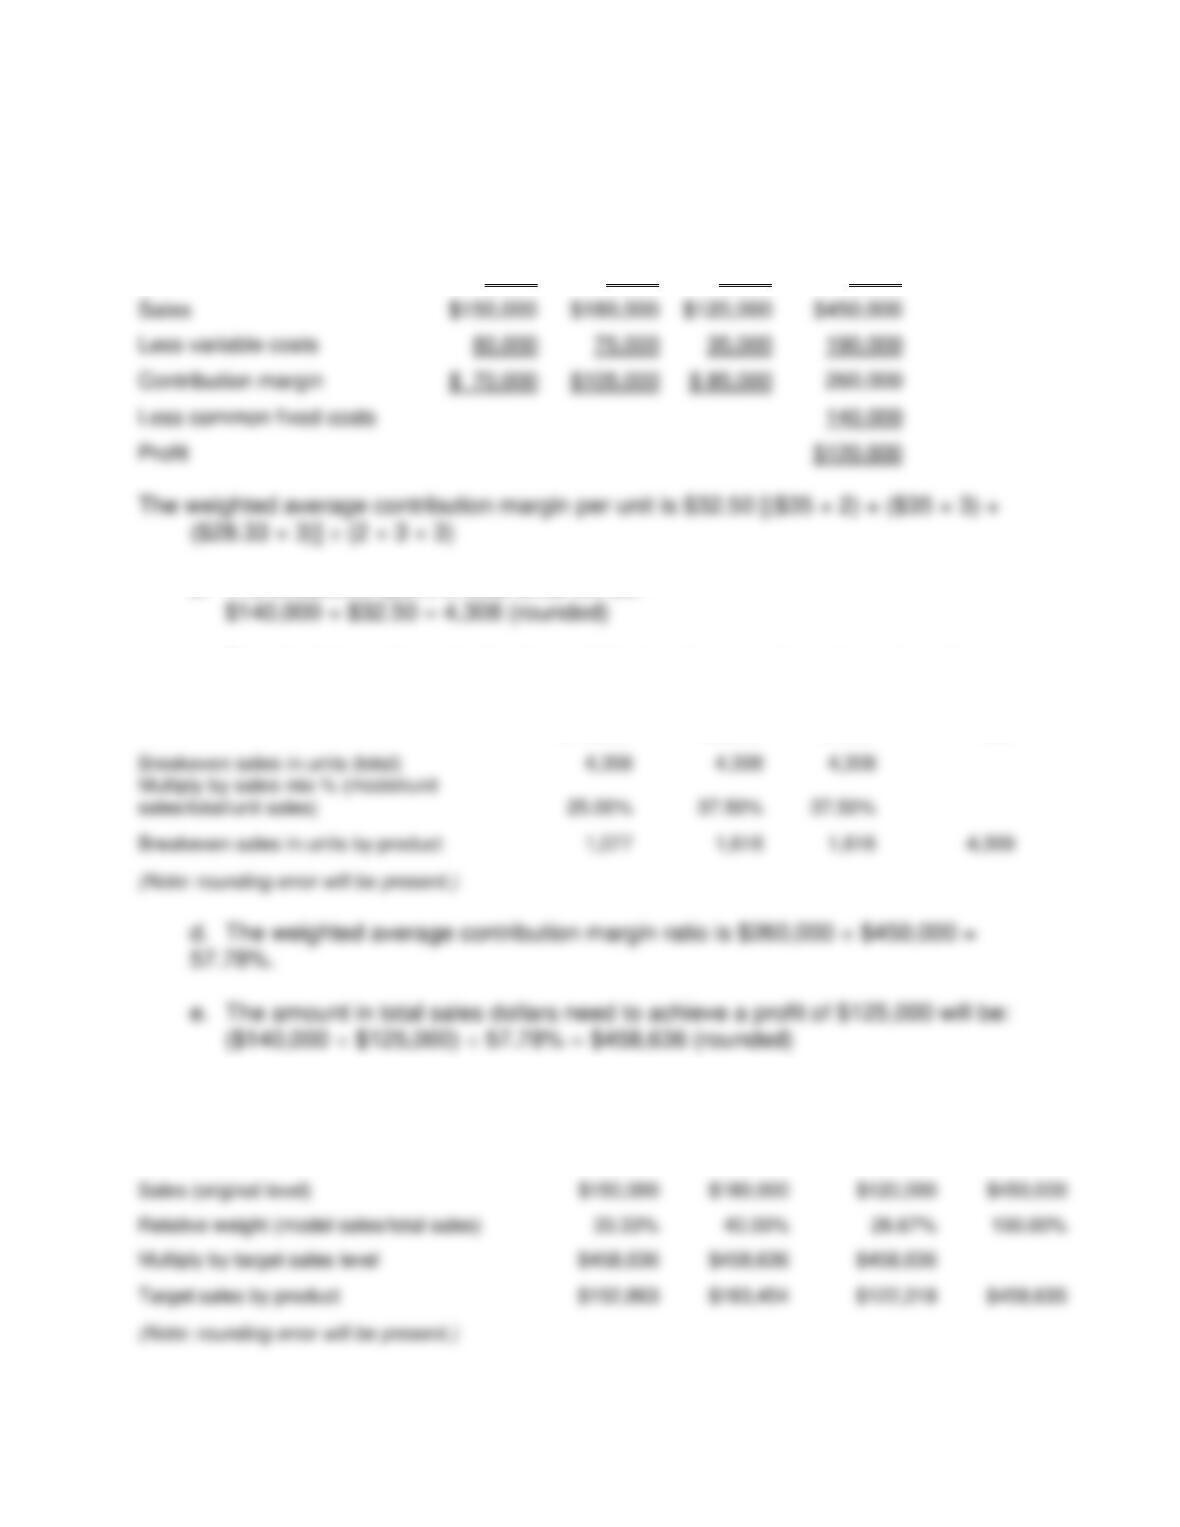
b. The breakeven point in total units will be:
c. To calculate each product’s share of the breakeven sales volume in units:
Smasher
Basher
Dinker
Total
Breakeven sales in units (total)
Breakeven sales in units by product
f. To calculate each product’s sales in order to earn a target profit of $125,000:
Smasher
Basher
Dinker
Total
Sales (original level)
Relative weight (model sales/total sales)
Multiply by target sales level
Target sales by product
Sales
Less variable costs
Contribution margin
Jiambalvo Managerial Accounting
4-20
P15. [LO 3]
P16. [LO 3]
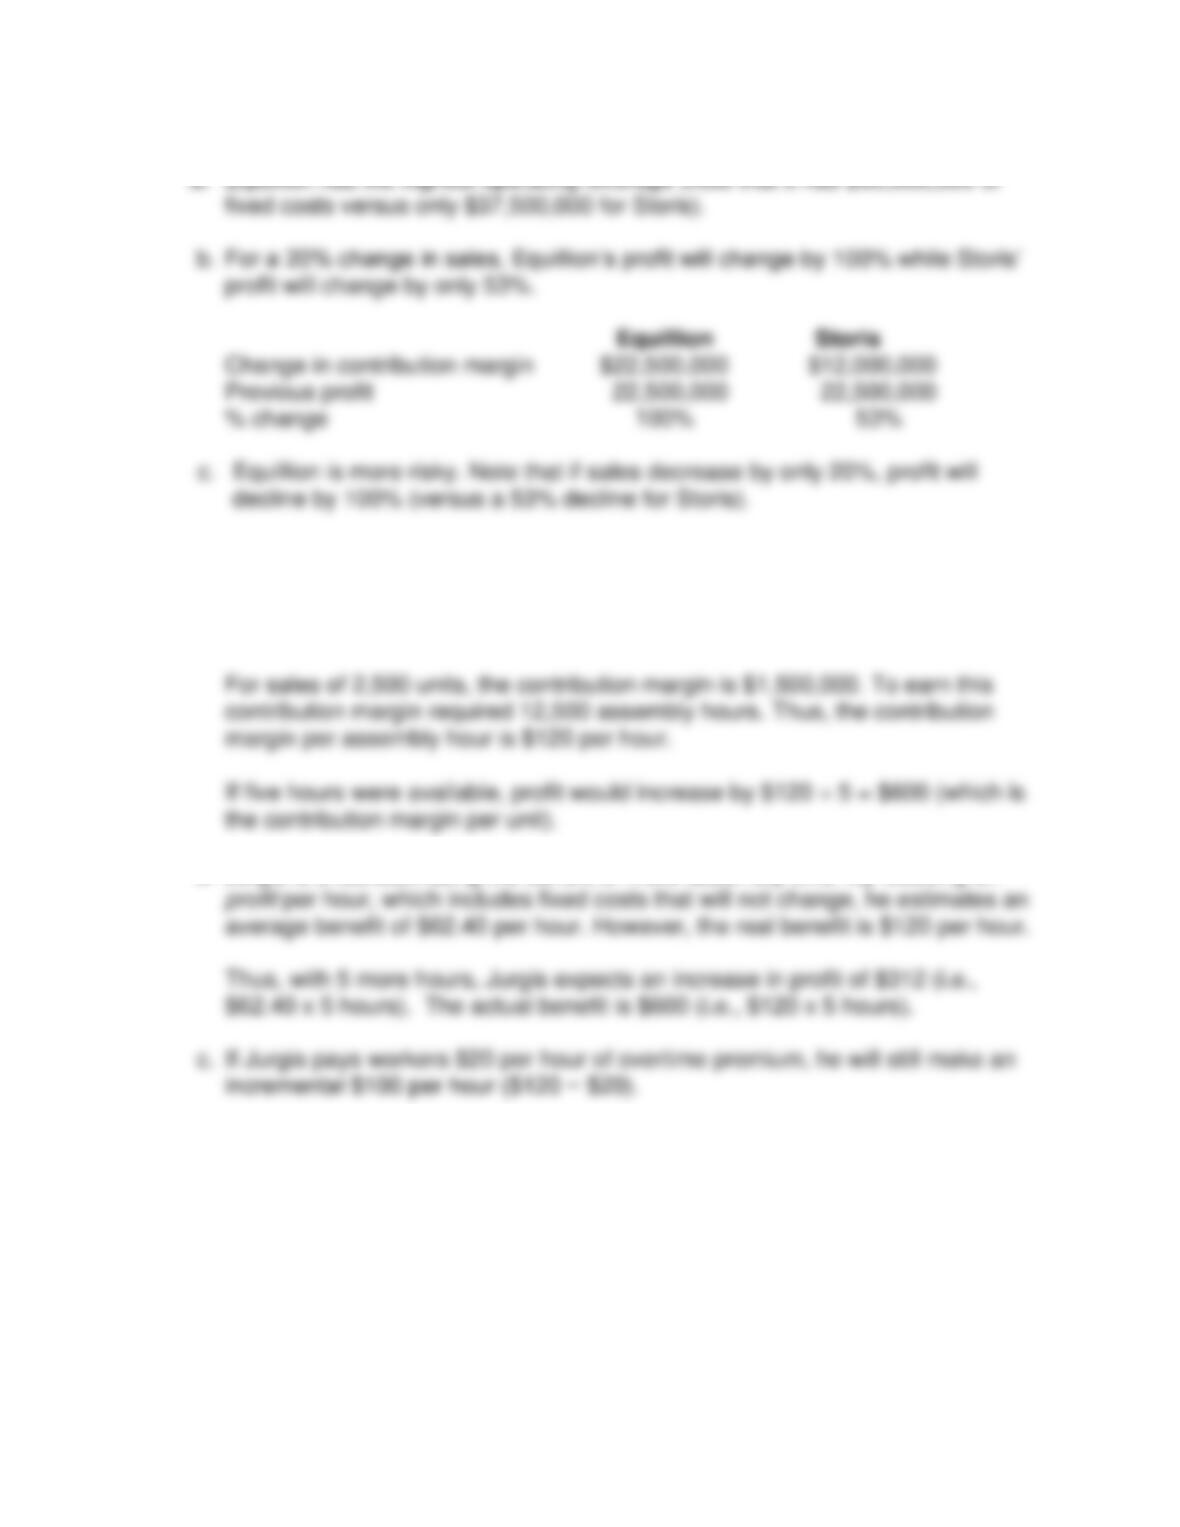
a. Jurgis is not approaching this problem in a proper manner. Instead of focusing
on profit per assembly hour, he should focus on the contribution margin per
assembly hour.
b. Jurgis is underestimating the benefit of more assembly time. By focusing on
P17. [LO 3]
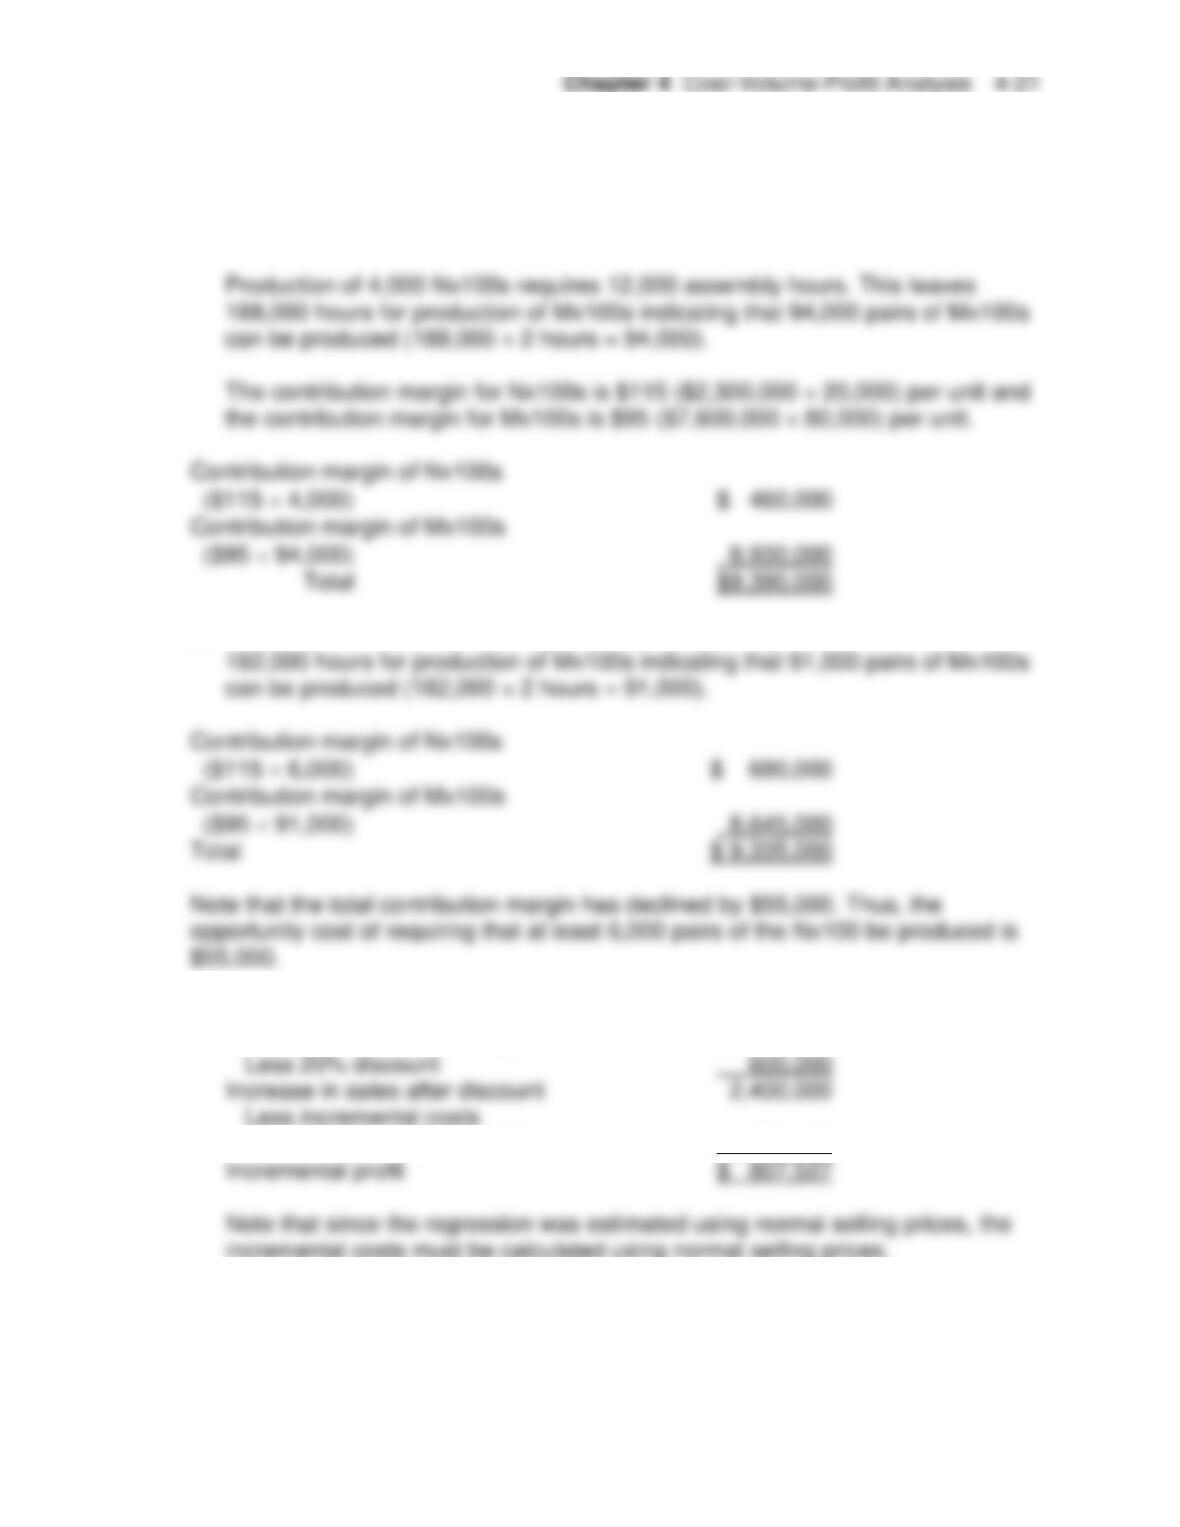
a. The Mx100 has the highest contribution per hour of assembly time. Therefore,
only the minimum number of Nx100s should be produced and the remaining
assembly time should be devoted to Mx100s.
b. Production of 6,000 Nx100s requires 18,000 assembly hours. This leaves
P18. [LO 1 and Appendix]
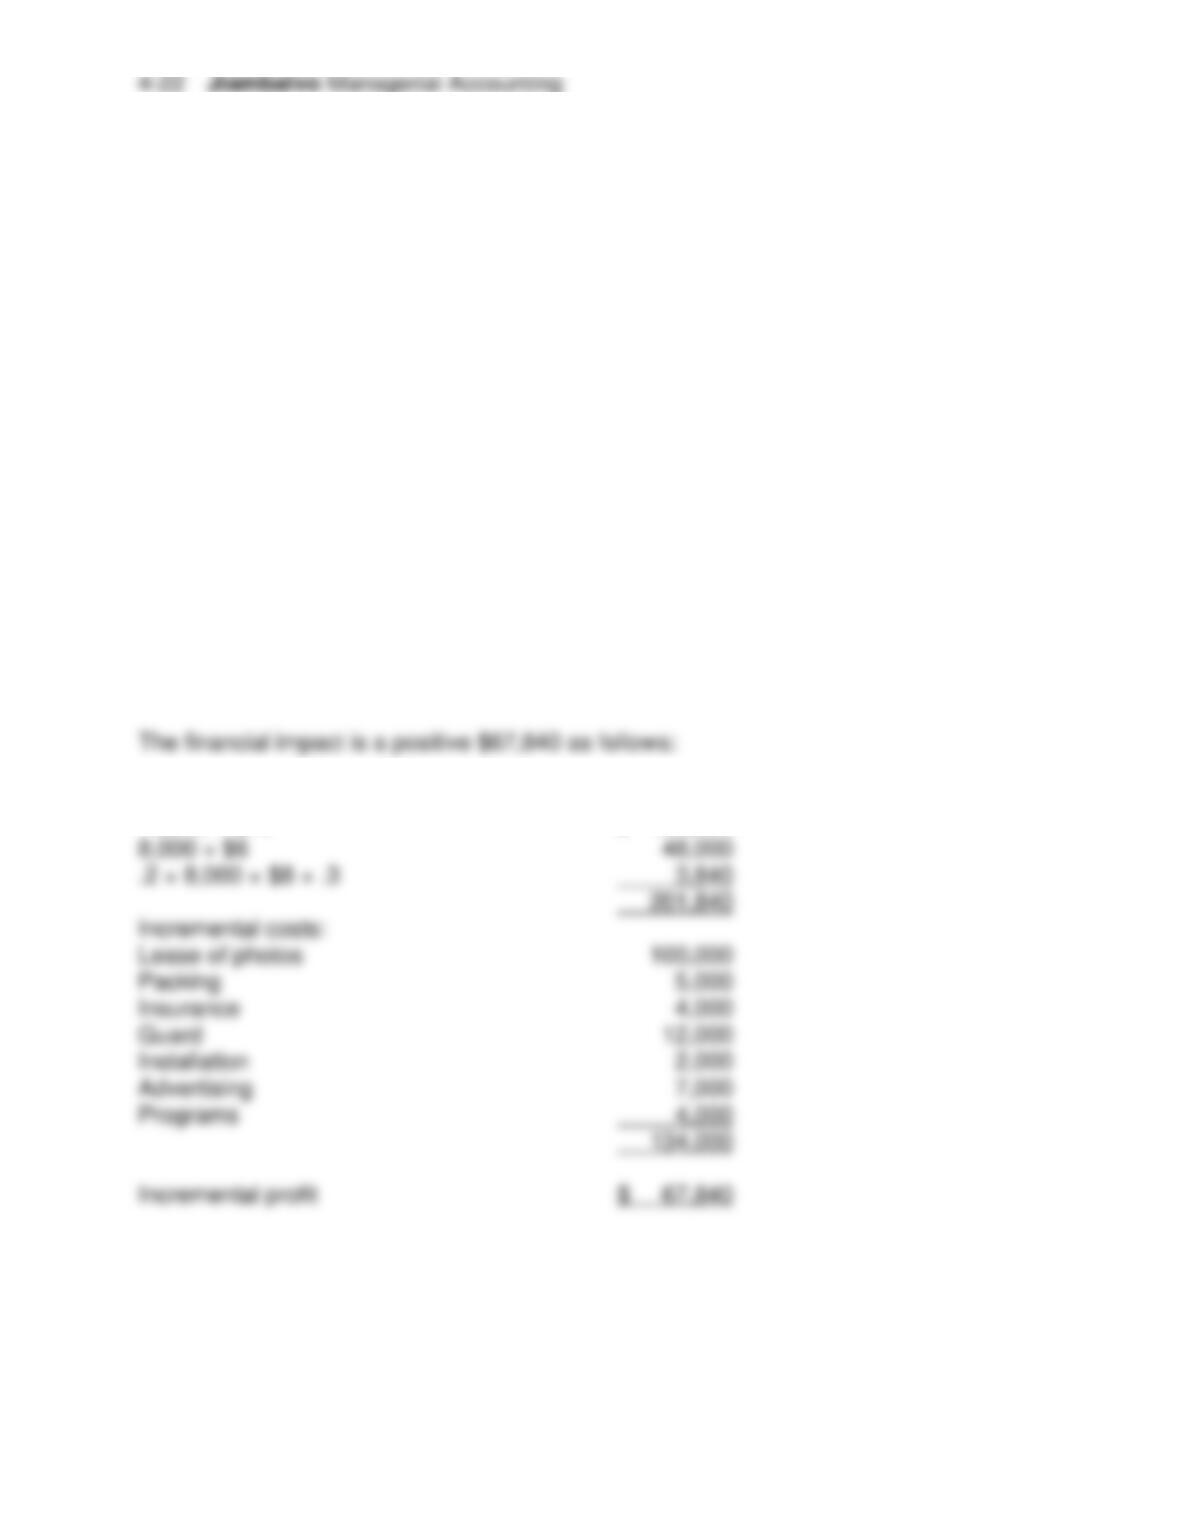
Increase in sales at normal prices $3,000,000
. 0.53082433 x $3,000,000 1,592,473
Case 4-1. [LO 1, 2]
ROTHMUELLER MUSEUM
Summary
A museum is trying to estimate the financial impact of a new exhibition.
• Links C-V-P analysis and decision making.
Questions to ask students
1. What’s the situation at Rothmueller Museum?
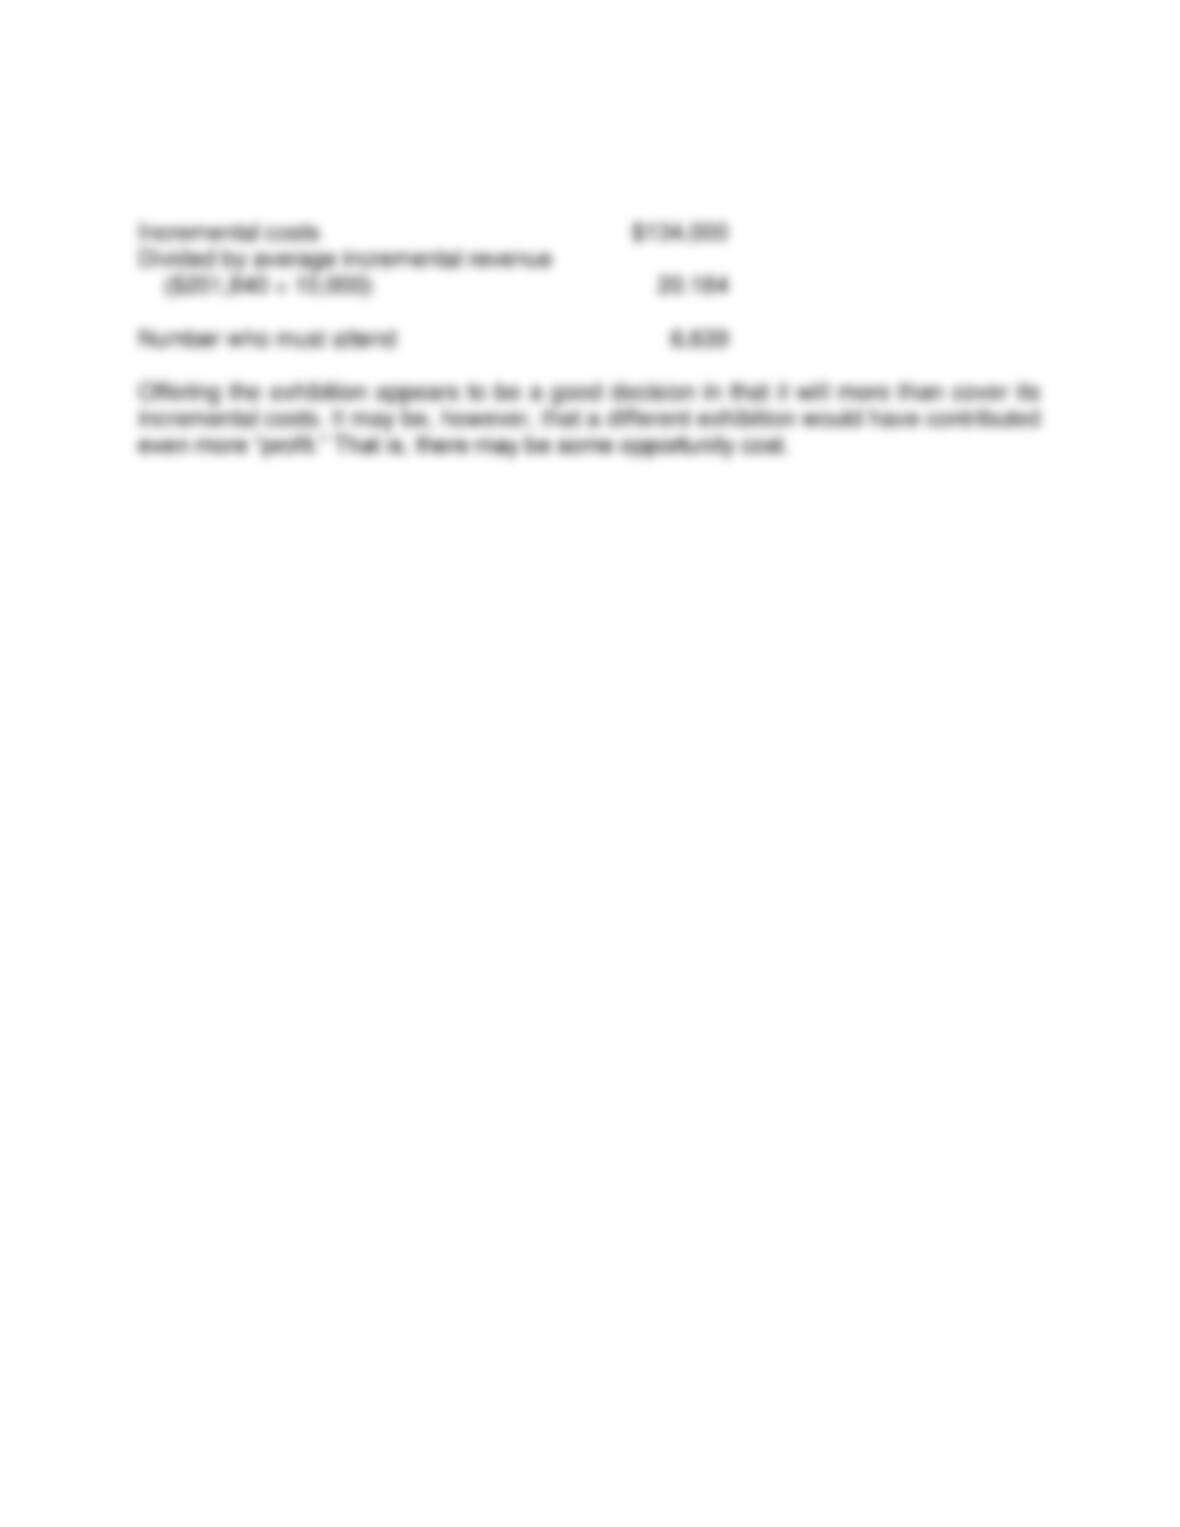
2. What is the financial impact of the Ansel Adams exhibition? Is offering the exhibition
a good decision from a financial standpoint?
3. How many people must attend the exhibition to break-even?
Discussion
I begin by asking a student to summarize the situation. Rothmueller Museum is planning
an Ansel Adams exhibit. Alice Morgan, the photographic curator, wants to estimate its
financial impact.
Incremental revenue:
10,000 × $15
$ 150,000
8,000 × $6
.2 × 8,000 × $8 × .3
3,840
Incremental costs:
Lease of photos
Packing
Insurance
Guard
Installation
Advertising
Programs
4,000
Incremental profit
$ 67,840
Chapter 4 Cost-Volume-Profit Analysis 4-23
a. 6,639 people must attend the exhibition in order for its financial impact to be
profit neutral (i.e., the museum will not be better off nor worse off financially).
Jiambalvo Managerial Accounting
4-24
Case 4-2. [LO 2]
MAYFIELD SOFTWARE, CUSTOMER TRAINING
Summary
An internal report shows that the customer training center is losing money. The
manager wants to know how many classes must be offered to break-even.
Questions to ask students
1. What’s the situation at the customer training center for Mayfield Software?
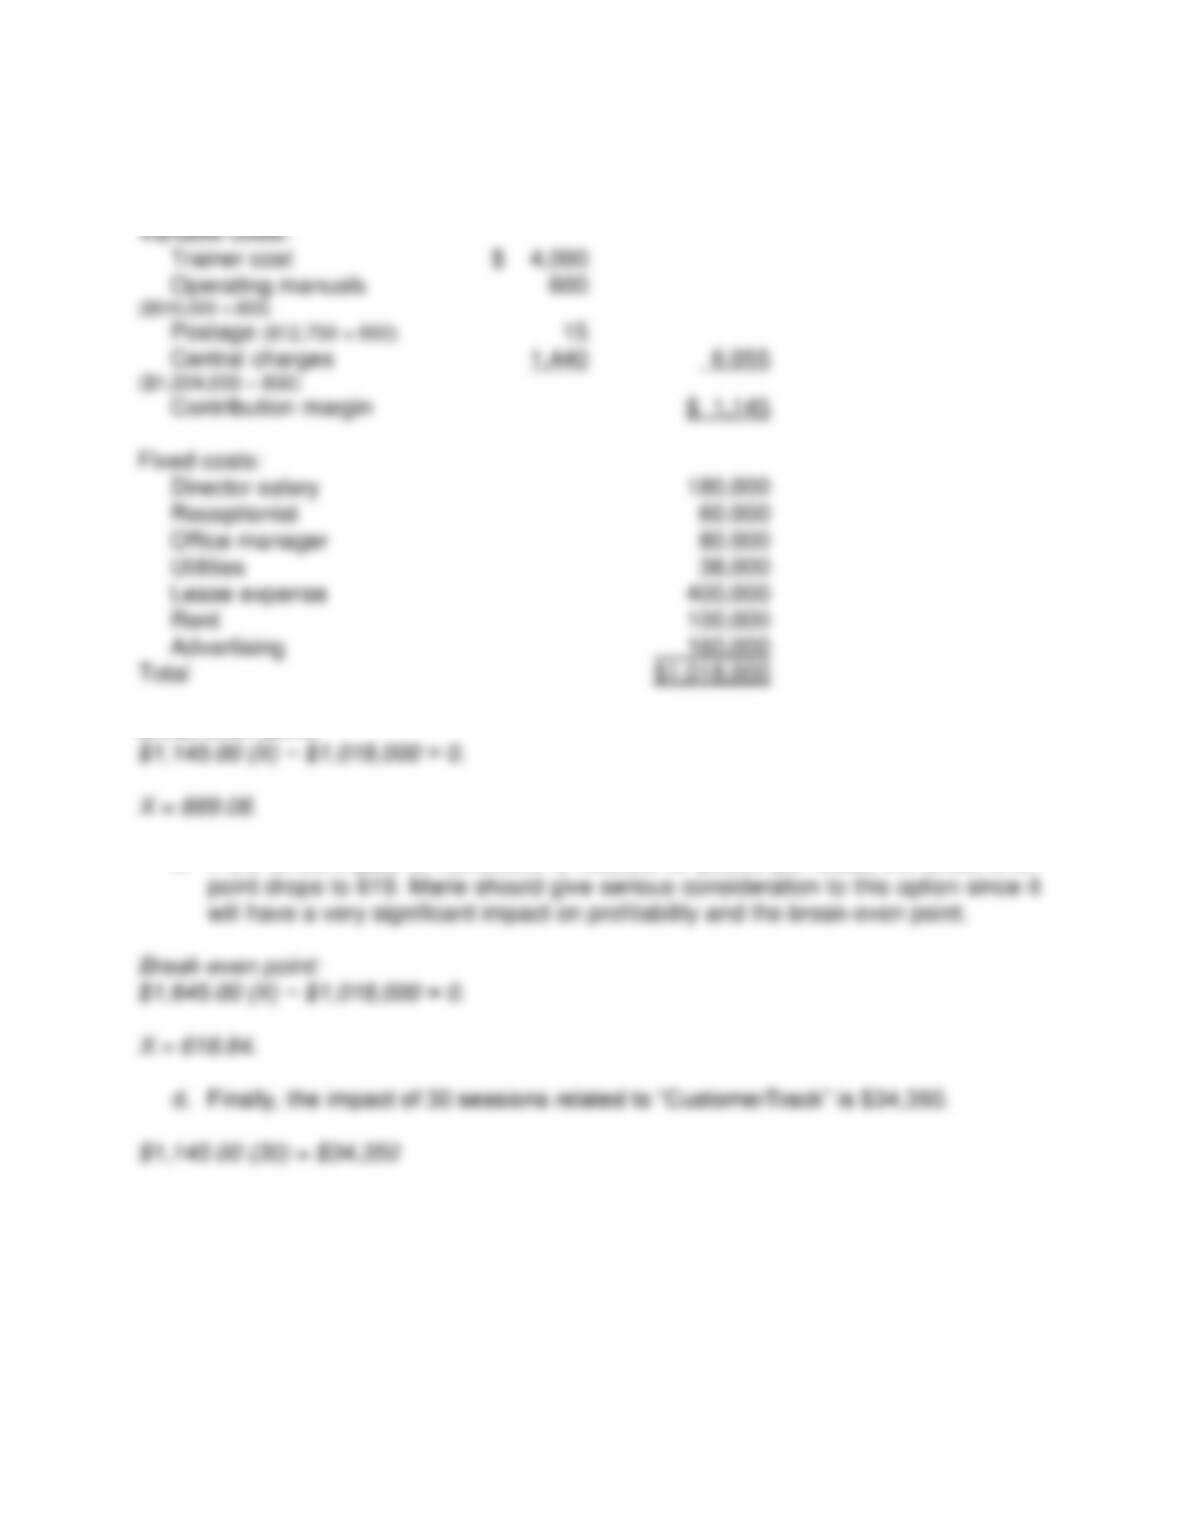
2. What will be the impact on company profit if the training center is closed?
3. How many classes must be offered to break-even given the current room
configuration and approach to allocation?
4. What happens to break-even if the amount paid to instructors is reduced to $3,500
per class?
5. What will be the impact on group profit if version 4.0 of “CustomerTrack” is
released?
Chapter 4 Cost-Volume-Profit Analysis 4-25
Contribution margin per class:
Revenue per class ($360 x 20)
$ 7,200
Break-even point:
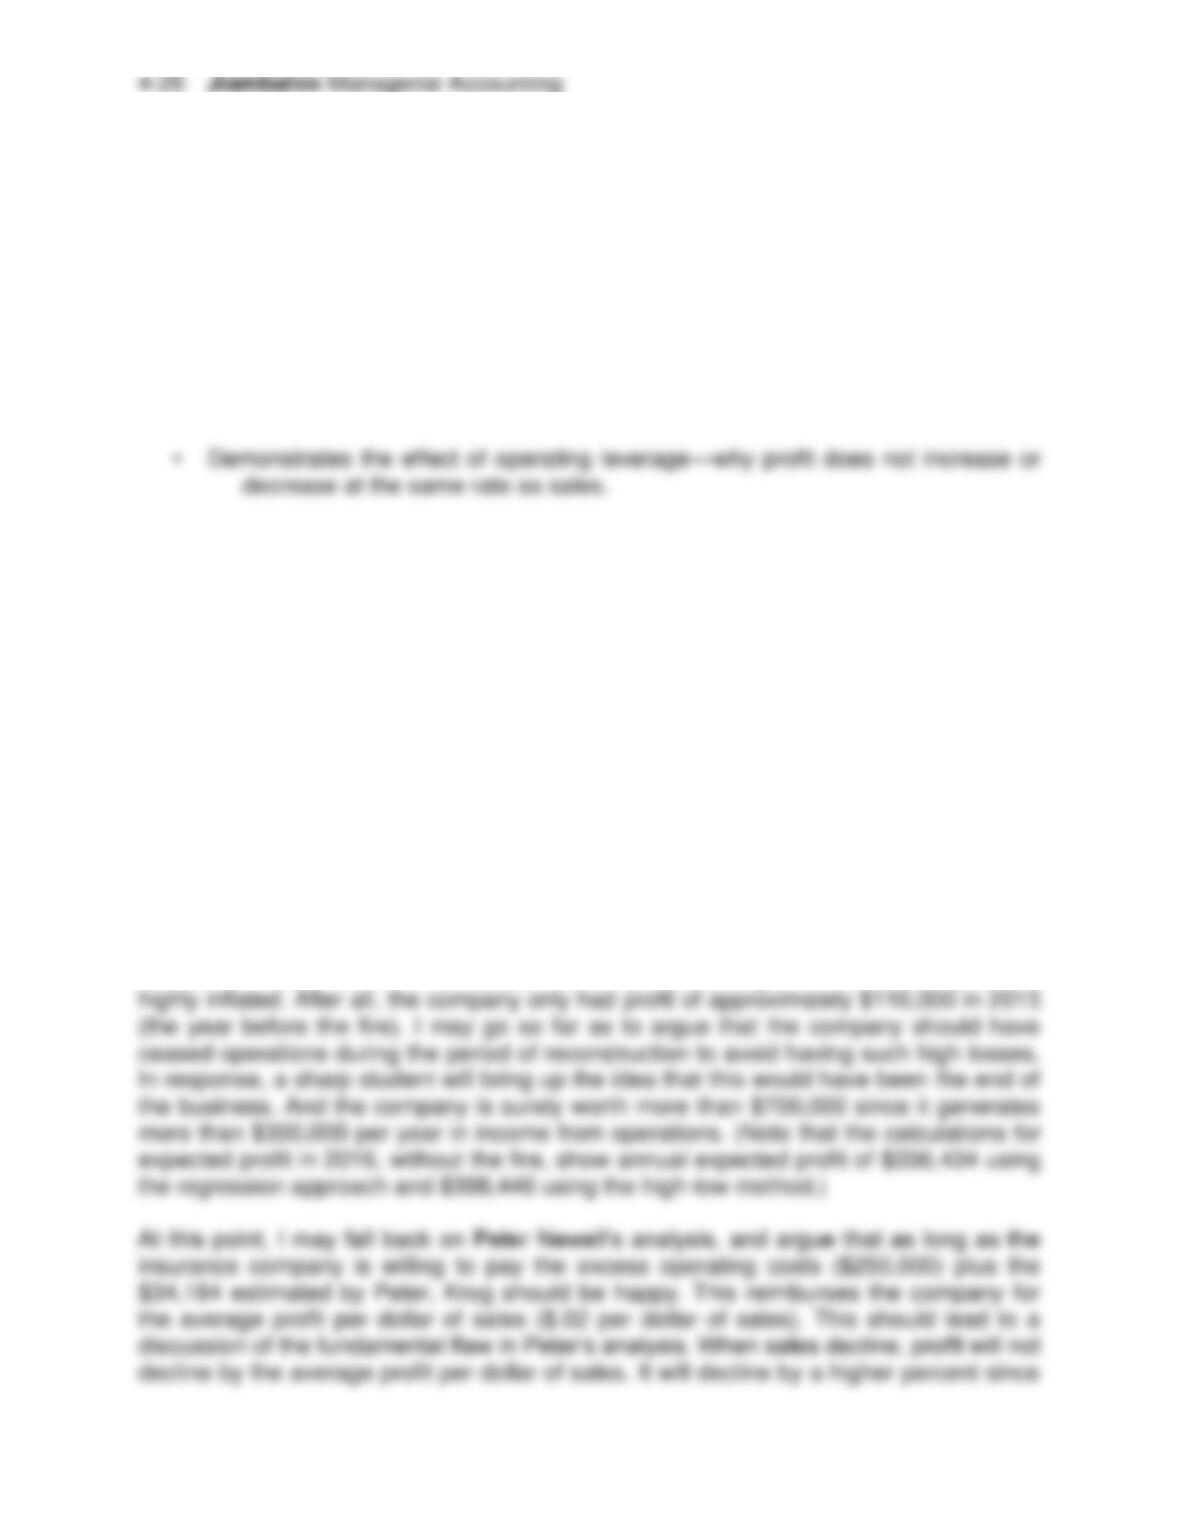
c. If the amount paid to instructors is reduced to $3,500 per class, the break-even
Variable costs:
Fixed costs:
400,000
100,000
Total
Case 4-3. [LO 1, 2]
KROG’S METALFAB, INC.
Summary
Company is trying to estimate lost profit, related to fire damage, so it can submit an
insurance claim.
• Focuses on cost estimation.
Questions to ask students
1. What is the situation facing Krog’s Metalfab?
2. What are your estimates of lost profit?
3. What is wrong with Peter Newell’s analysis?
Discussion
I begin the discussion the same way I begin the discussion of almost all cases, by
asking a student to summarize the situation. Krog had a fire at the beginning of 2016
that reduced capacity and profit during 2016. The company has insurance to cover lost
profit, but what is the amount of lost profit during 2016?
At this point, I generally ask 5-10 students to simply give me their lost profit estimates
and I put them on the board. If students have large estimates (say greater than
$700,000) I’ll play the role of the insurance company and argue that their estimates are
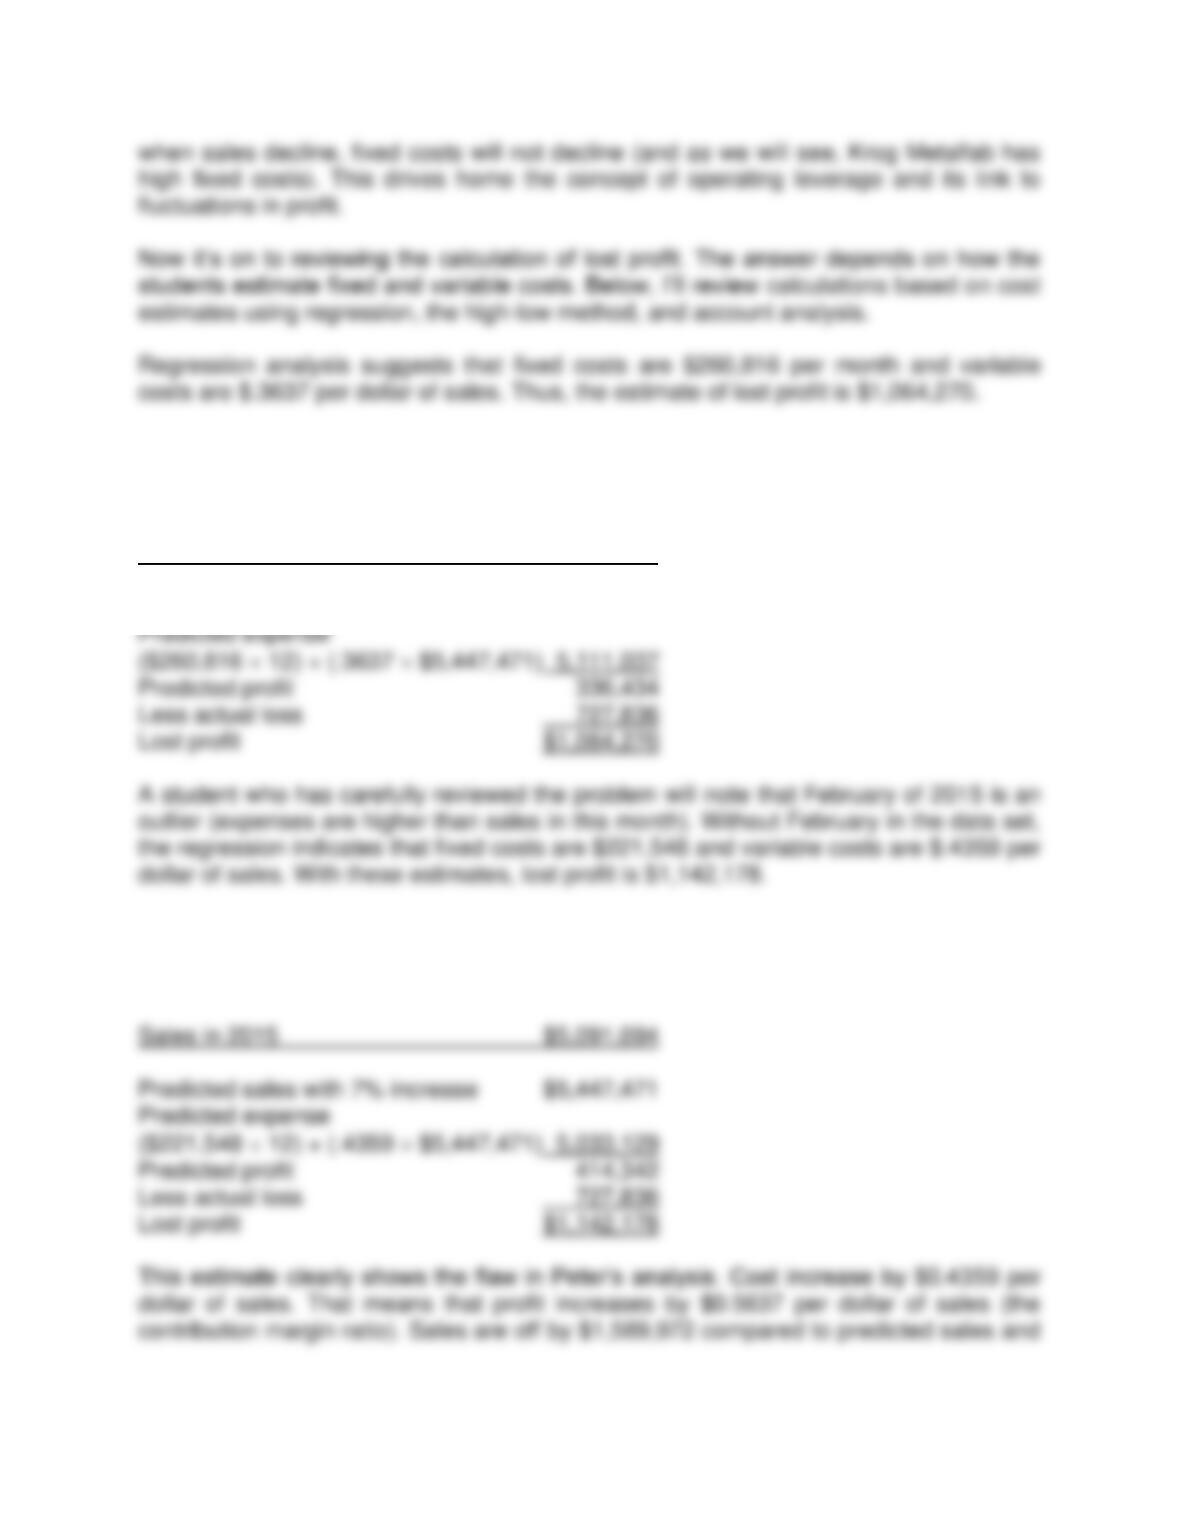
Chapter 4 Cost-Volume-Profit Analysis 4-27
Regression
Expense = $260,816 + .3637 Sales
R squared = .60
Sales in 2015 $5,091,094
Predicted sales with 7% increase $5,447,471
Regression
Expense = $221,548 + .4359 Sales
R squared = .99
Jiambalvo Managerial Accounting
4-28
High-Low Approach
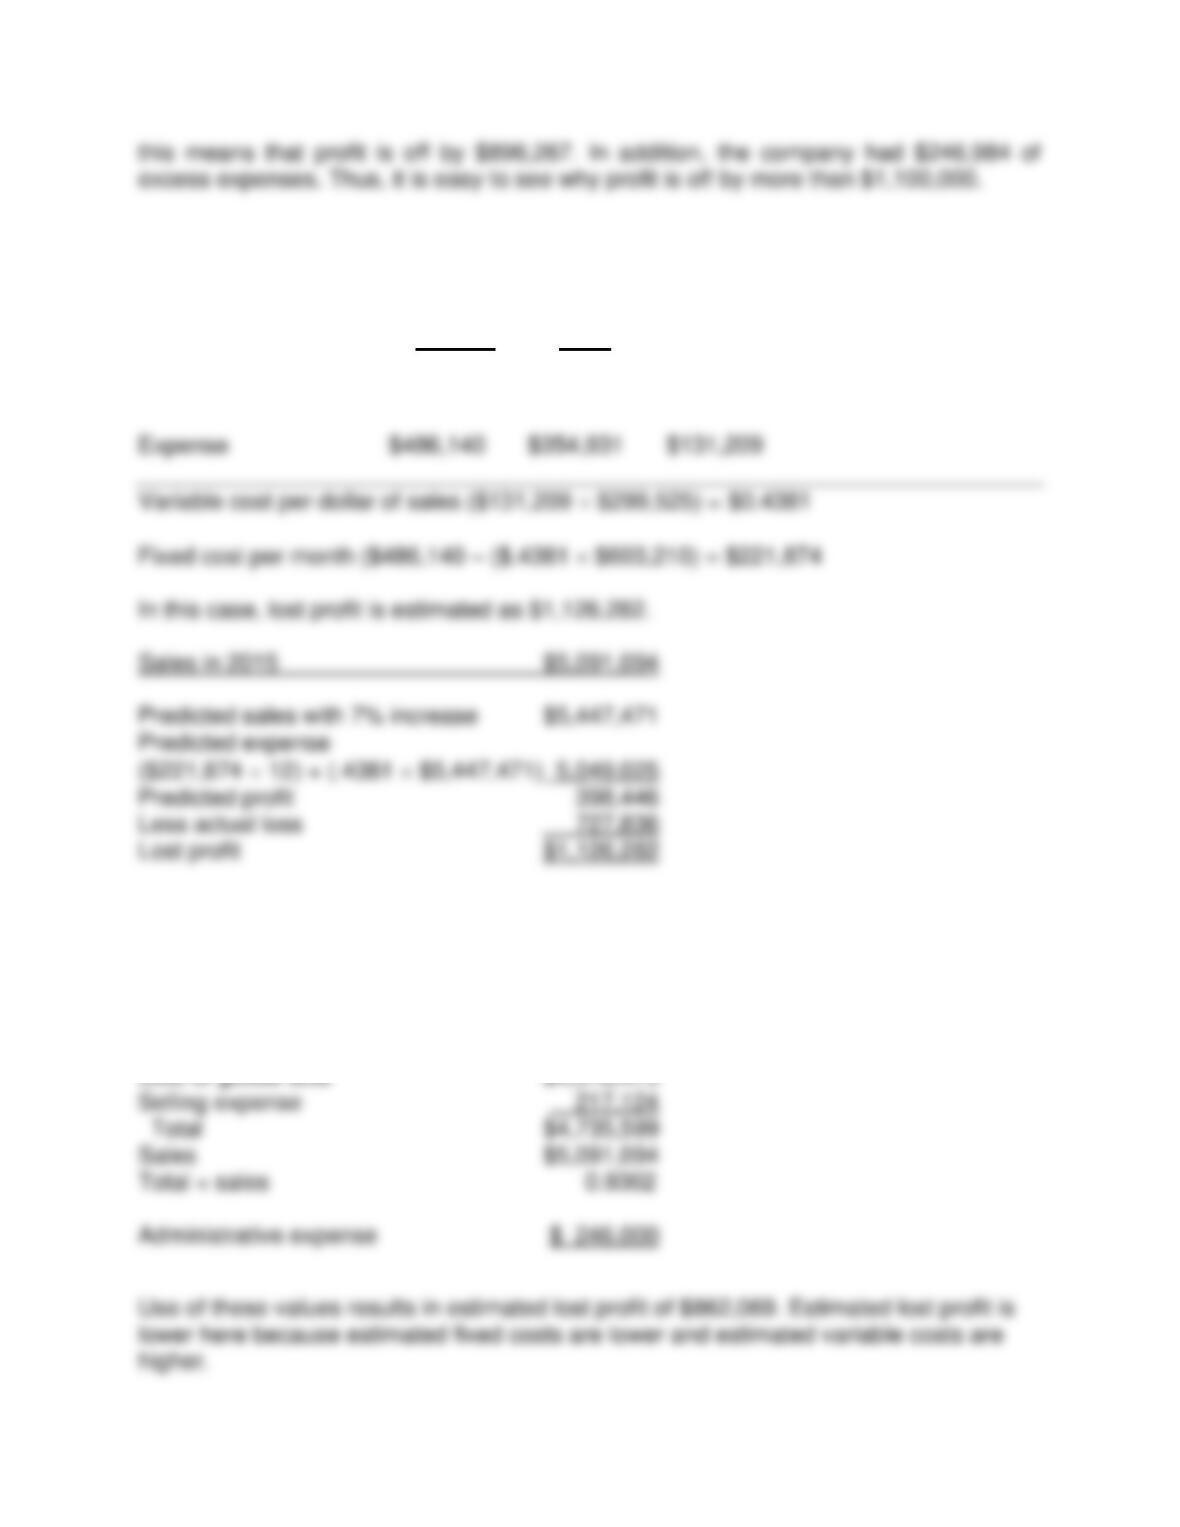
If students use the high-low method, they will estimate variable costs as $0.4381 per
dollar of sales and fixed costs as $221,874 per month.
August April
High Low Change
Sales $603,210 $303,685 $299,525
Account Analysis
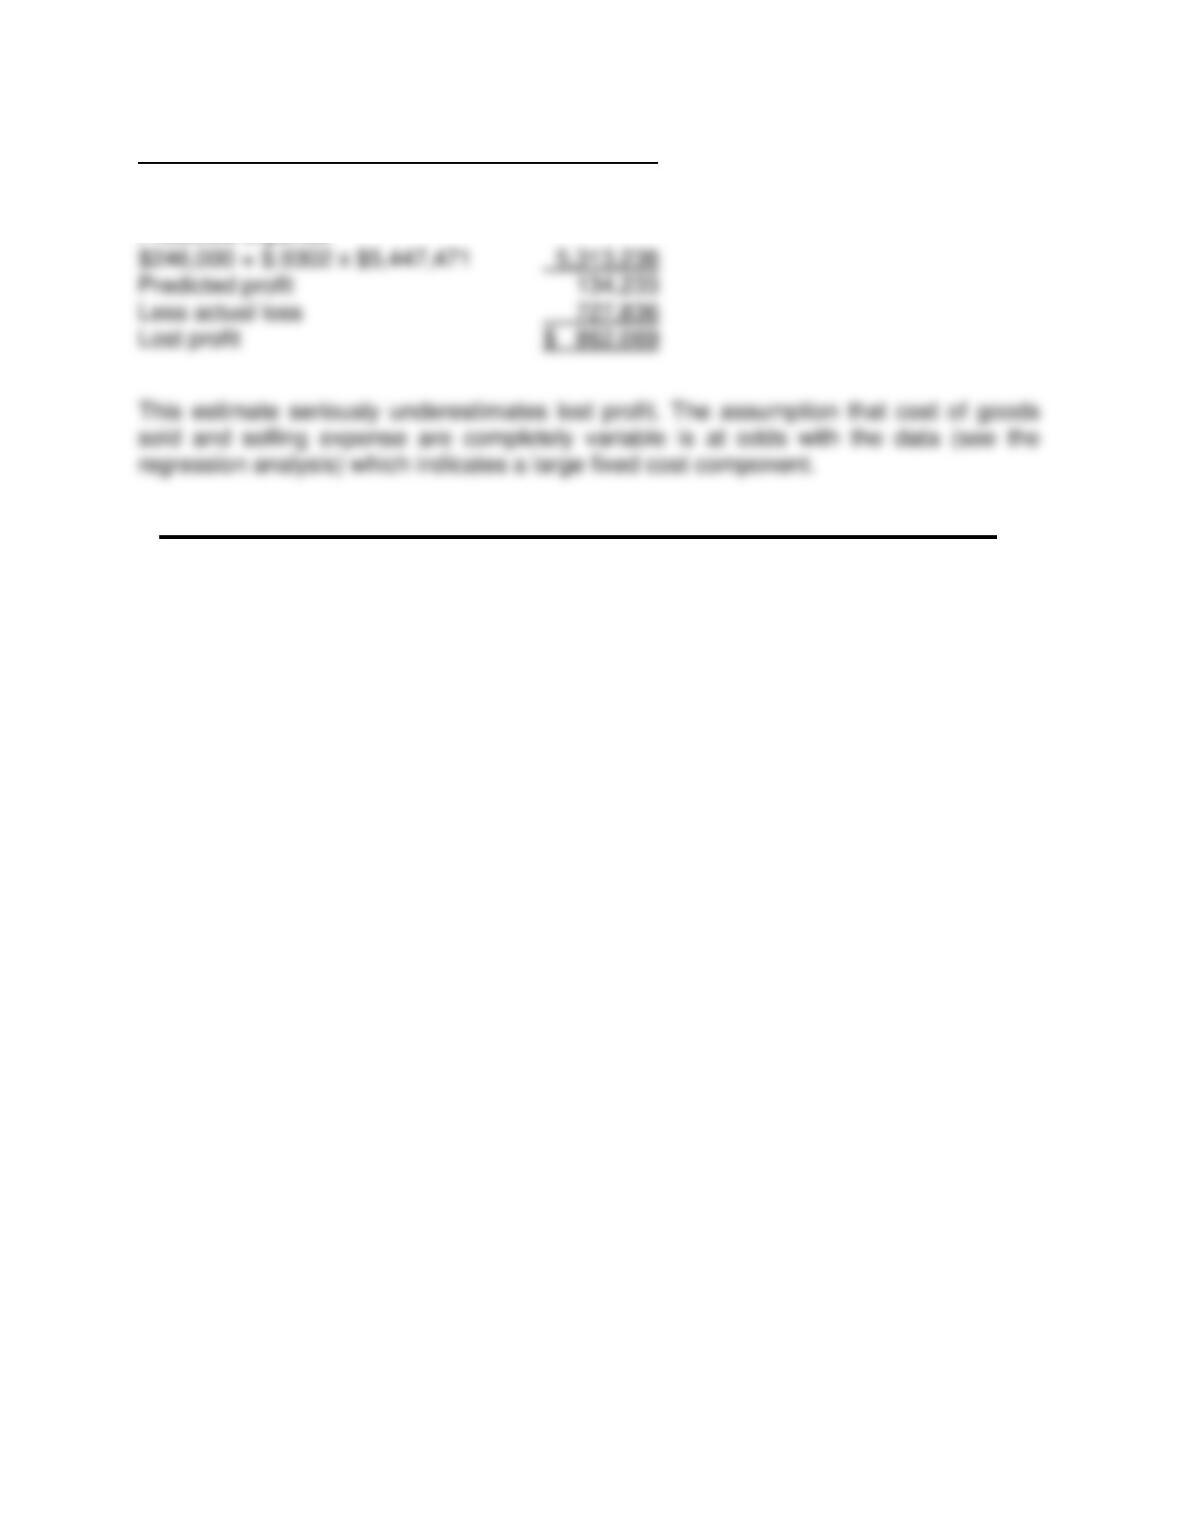
If students use account analysis, they are asked to classify cost of goods sold and
selling expense as variable and administrative costs as fixed. Using annual totals this
suggests that variable costs are $.9302 per dollar of sales and fixed costs are $246,000.
Chapter 4 Cost-Volume-Profit Analysis 4-29
Sales in 2015 $5,091,094
Predicted sales with 7% increase $5,447,471
Predicted expense