
4-1
CHAPTER 4
ACTIVITY-BASED COSTING
DISCUSSION QUESTIONS
1. A predetermined overhead rate is simply an
estimate of the overhead used per unit of
driver. It is calculated using budgeted over-
head and budgeted levels of the associated
driver. Predetermined rates are used be-
cause actual overhead may be incurred
nonuniformly throughout the year.
2. Under- and overapplied overhead are mea–
sures of the difference between the actual
and applied overhead assigned to production.
Underapplied overhead means too little was
applied, and overapplied means too much
was applied.
3. Plantwide overhead rates assign overhead to
products in proportion to the amount used of
the unit-based driver. If all products consume
overhead in proportion to this unit-based driv-
er, no distortion will occur. Cost distortion can
occur if the products consume some over-
head activities in different proportions than
those
assigned by the unit-based driver (the product
diversity factor). No significant distortion will
occur unless the activities that are consumed
in different proportions make up a significant
proportion of the total overhead costs. Thus,
two key factors are product diversity and sig-
nificant non-unit-level overhead costs.
4. Non-unit-related overhead activities are
those overhead activities that are not highly
correlated with production volume mea-
sures. Examples include setups, materials
handling, and inspection. Non-unit-based
cost drivers are causal factors that explain
the consumption of non-unit-related over-
head. Examples include setup hours, num-
ber of moves, and hours of inspection.
5. An overhead consumption ratio measures the
proportion of an overhead activity consumed
by a product.
6. Agree. Prime costs can be assigned using
direct tracing and therefore do not cause
cost distortions. Overhead costs, however,
are not directly traceable and can cause dis-
tortions. For example, using unit-based driv-
ers to trace non-unit-based overhead costs
would cause distortions.
7. Activity-based product costing is a costing
approach that first assigns costs to activities
and then to products. The assignment is
made possible through the identification of ac-
tivities, their costs, and the use of cost drivers.
8. The six steps are: (1) identify, define, and
classify activities and key attributes; (2) as-
sign the cost of resources to activities;
(3) assign the cost of secondary activities to
primary activities; (4) identify cost objects and
specify the amount of each activity consumed
by specific cost objects; (5) calculate primary
activity rates; and (6) assign activity costs to
cost objects.
9. The cost of resources is assigned to activities
using direct tracing and resource drivers. Re-
source drivers such as effort expended and
material usage trace costs to activities using
causal relationships. Assigning costs to activi-
ties requires unbundling the general ledger.
General ledger accounts accumulate costs by
department and by account—not by activity.
Thus, the costs in the general ledger account
must be reassigned to activities—this is what
unbundling means.
10. A bill of activities specifies the product, ex-
pected product quantity, activities, and amount
of each activity expected to be consumed by
each product.
11. Two types of activity drivers are transaction
drivers and duration drivers. Transaction driv-
ers measure the demands placed on an ac-
tivity using the number of times an activity is
performed. Duration drivers measure de-
mands by the time it takes to perform an ac-
tivity.
12. Unit-level activities are those that occur each
time a unit of product is produced. Batch–
level activities are those that are performed
each time a batch of products is produced.
Product-level or sustaining activities are
those that are performed as needed to sup-
port the various products produced by a
company. Facility-level activities are those
that sustain a factory’s general manufacturing
process.

13. TDABC simplifies ABC by eliminating the
need to do detailed interviews and surveys
to assess activity costs. By using objectively
determined capacity cost rates, activity rates
can be calculated directly.
14. Updating a TDABC model is easy because
activity rates are updated simply by updating
the capacity cost rate. Most changes in oper-
ating conditions are reflected by changes in
either resource costs or system time. These
changes are reflected in the capacity cost
rate which is then used to update the activity
rate.
15. Reduced systems can be achieved by apply-
ing the Pareto principle (or 80/20 rule) to ac-
tivity cost or a series of simultaneous equa-
tions based on consumption ratios. The
Pareto principle approach creates an approx-
imately relevant ABC system. The simultane-
ous equation approach creates a reduced
system that duplicates the accuracy. The Pa-
reto approach is easy to understand and im-
plement. The simultaneous equation ap-
proach creates a system that duplicates the
accuracy of the more complex system, and it
may be even smaller in size than the Pareto
approach. Preserving accuracy probably pro-
duces the most benefit and thus has the most
merit of the two approaches.
CORNERSTONE EXERCISES
Cornerstone Exercise 4.1
1. Plantwide rate = $2,000,000/50,000 = $40.00 per hour
Applied overhead:
Deluxe Regular
2. Overhead per unit (deluxe) = $400,000/20,000 = $20
3. There would be an increase of $400,000 ($40 × 10,000) of overhead assigned
to the deluxe speakers and so profitability for this product line would de-
Cornerstone Exercise 4.2
1. Overhead variance = $470,000 – $500,000 = $30,000 overapplied
2. Proration: (0.40 × $30,000; 0.2 × $30,000; 0.4 × $30,000)
Overhead Control …………………………………….. 30,000
Cost of Goods Sold …………………………….. 12,000
Prorated
Unadjusted Overapplied Adjusted
Balance Overhead Balance
Work-in-Process Inventory ……………. $100,000 $ 6,000 $94,000
4-4
Cornerstone Exercise 4.2 (Concluded)
3.
Cost of Goods Sold …………………………………. 30,000
Cornerstone Exercise 4.3
2. Overhead assignment:
Form A Form B
($80 × 3,500) + ($4 × 5,000) ………………………………… $300,000
($80 × 1,500) + ($4 × 15,000) ………………………………. $180,000
3. Overhead assignment:
Form A Form B
($80 × 1,200) + ($4 × 5,000) ………………………………… $116,000
4-5
Cornerstone Exercise 4.3 (Concluded)
Cornerstone Exercise 4.4
1.
Consumption Ratios
Overhead Activity Part X12 Part YK7 Activity Driver
Machining ……………………. 0.14a 0.86a Machine hours
Setups …………………………. 0.33b 0.67b Number of setups
2.
Consumption Ratios
Overhead Activity Part X12 Part YK7 Activity Driver
Plantwide:
Manufacturing ………….. 0.30a 0.70a Direct labor hours
3.
Consumption Ratios
Overhead Activity Part X12 Part YK7 Activity Driver
Plantwide:
4-6
Cornerstone Exercise 4.4 (Concluded)
The plantwide rate using machine hours may make the assignments better—all
but one of Part X12’s activities has a consumption ratio close to 0.14. If the
Cornerstone Exercise 4.5
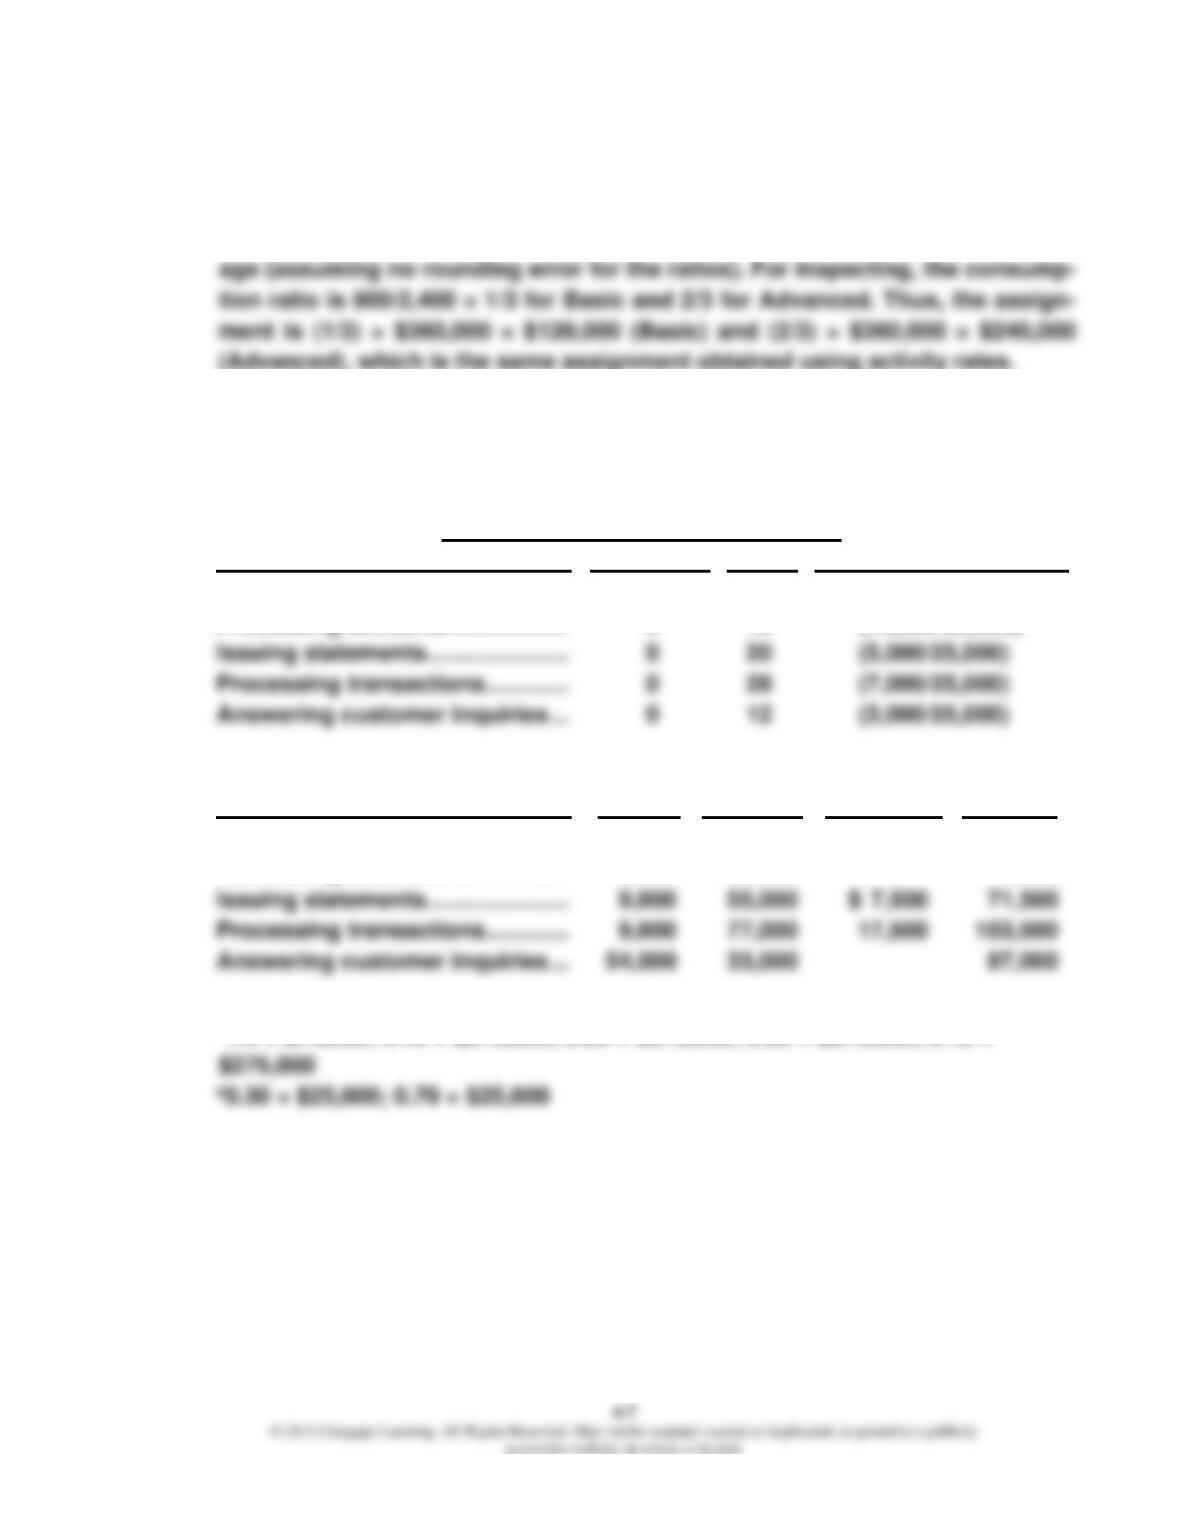
1. Machining rate: $6,000,000/600,000 = $10per machine hour
2.
Basic Advanced
Prime costs ………………………. $8,000,000 $ 30,000,000
Overhead costs:
Machining:
$10 × 100,000 ……………… 1,000,000
$10 × 500,000 ……………… 5,000,000
Engineering:
Prime cost per unit:
Overhead cost per unit: Basic: $94.60 − $80.00 = $14.60; YK7: $124.87 −
Cornerstone Exercise 4.5 (Concluded)
3. Using consumption ratios will yield exactly the same overhead assignments
as activity rates, if the actual activity usage is the same as the expected us-
Cornerstone Exercise 4.6
1.
Percentage of Time on Each Activity
Activity Supervisor Clerks Supporting Calculation
Supervising clerks …………………. 100% 0% (2,000/2,000)
Processing accounts ……………… 0 40 (10,000/25,000)
2.
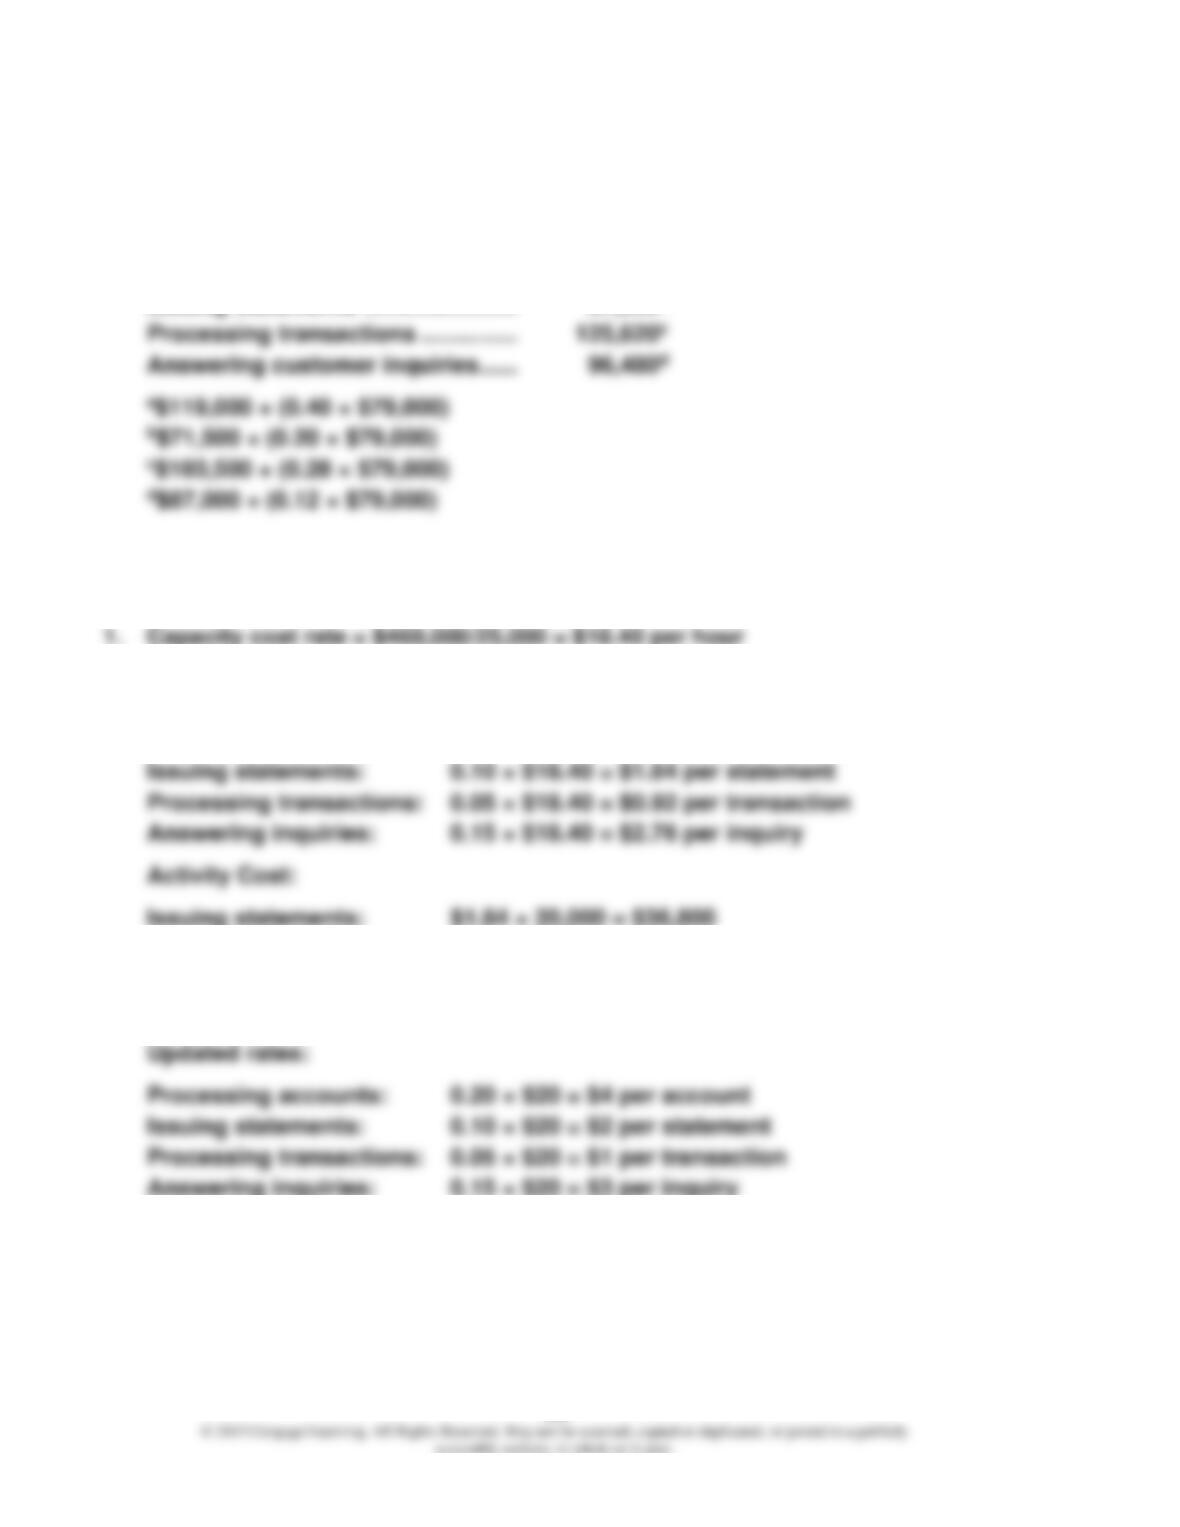
Activity Phonea Salariesb Computerc Total
Supervising clerks …………. $ 9,000 $ 70,000 $ 79,000
Processing accounts ……………… 9,000 110,000 119,000
a0.60 × $90,000 for customer inquiries; 0.10 × $90,000 for other activities
b1.0 × $70,000; 0.40 × $275,000; 0.20 × $275,000; 0.28 × $275,000; 0.12 ×
4-8
Cornerstone Exercise 4.6 (Concluded)
3. Supervising is a secondary activity and its costs are consumed by primary
activities (assigned in proportion to the labor content of each activity).
Processing accounts ………………… $150,600a
Issuing statements …………………… 87,300b
Cornerstone Exercise 4.7
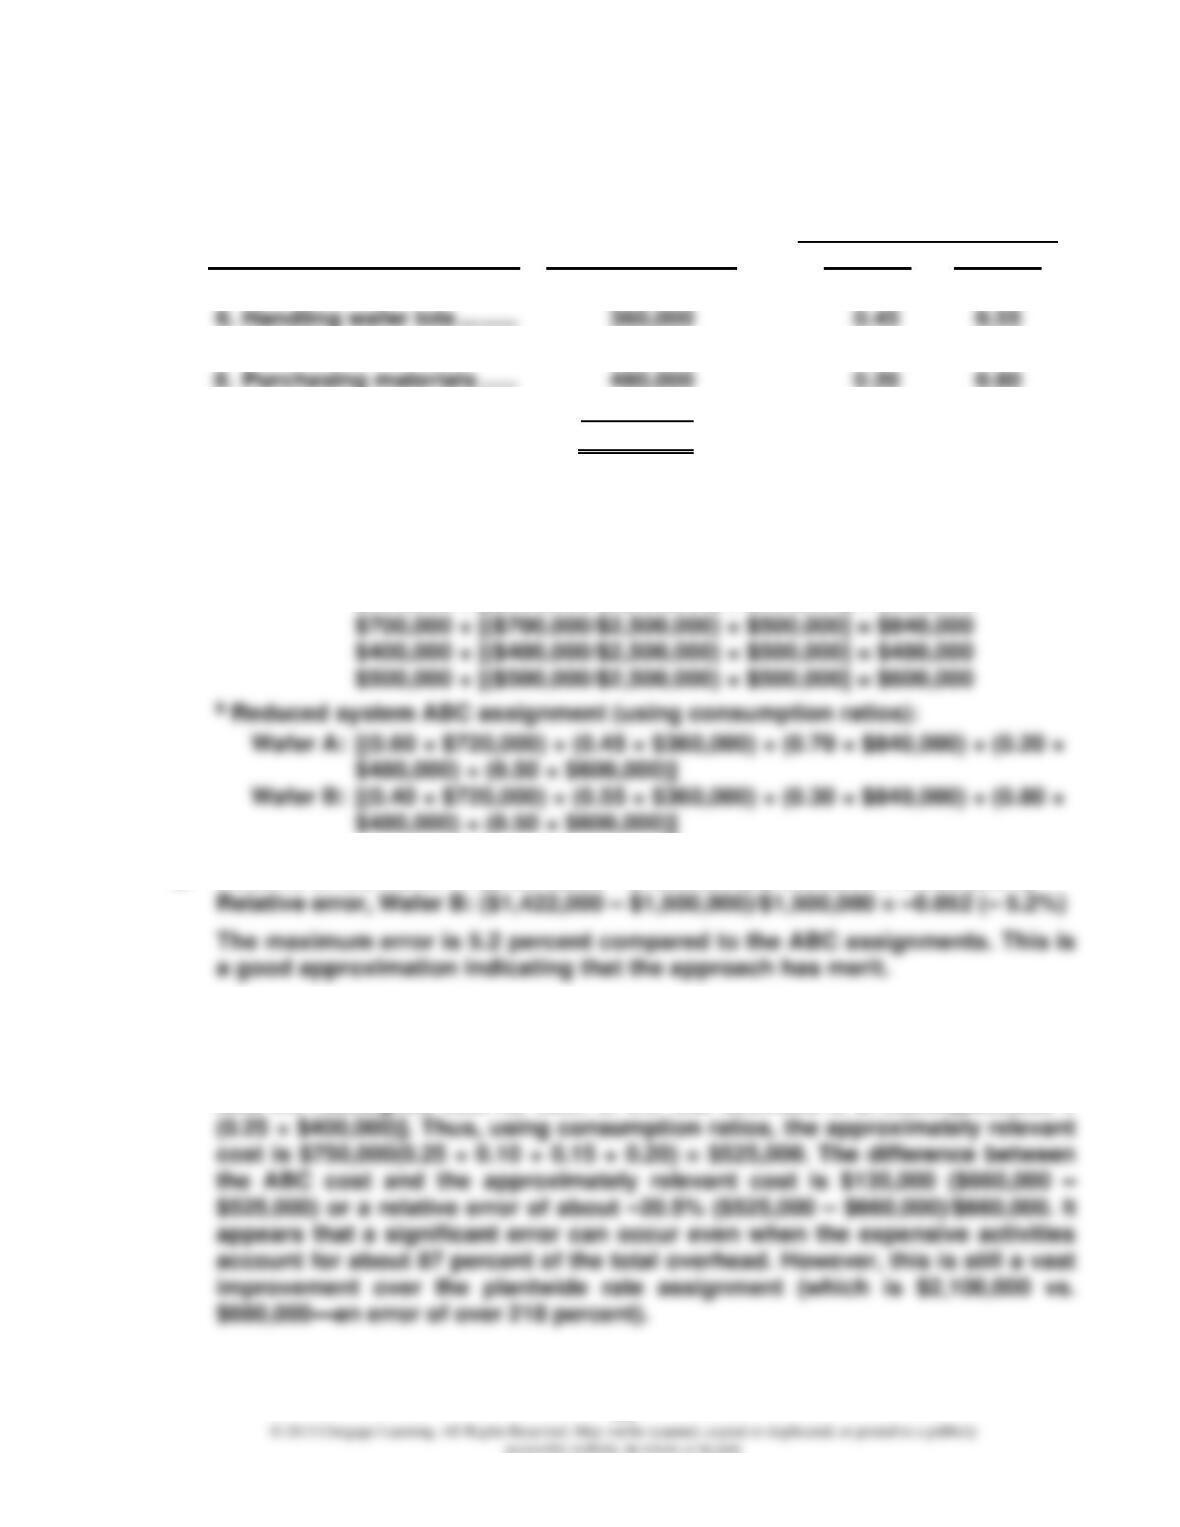
2. Rates:
Processing accounts: 0.20 × $18.40 = $3.68 per account
3. Capacity cost rate = $450,000/22,500* = $20 per hour
*25,000 – 0.10(25,000)
4-9
Cornerstone Exercise 4.8
1. Expected Consumption
Budgeted Activity Ratios
Activity Costa Wafer A Wafer B
3. Testing products …………. $ 720,000 0.60 0.40
7. Inserting dies ………………. 840,000 0.70 0.30
11. Moving materials …………. 600,000 0.50 0.50
Total activity cost ………… $3,000,000
Approximate ABC cost:b $1,578,000 $1,422,000
a Original activity cost plus share of the costs of the remaining “inexpensive”
activities (allocated in proportion to the original costs of the expensive
activities: $600,000 + [($600,000/$2,500,000) × $500,000] = $720,000
$300,000 + [($300,000/$2,500,000) × $500,000] = $360,000
2. Relative error, Wafer A: ($1,578,000 – $1,500,000)/$1,500,000 = 0.052 (5.2%)
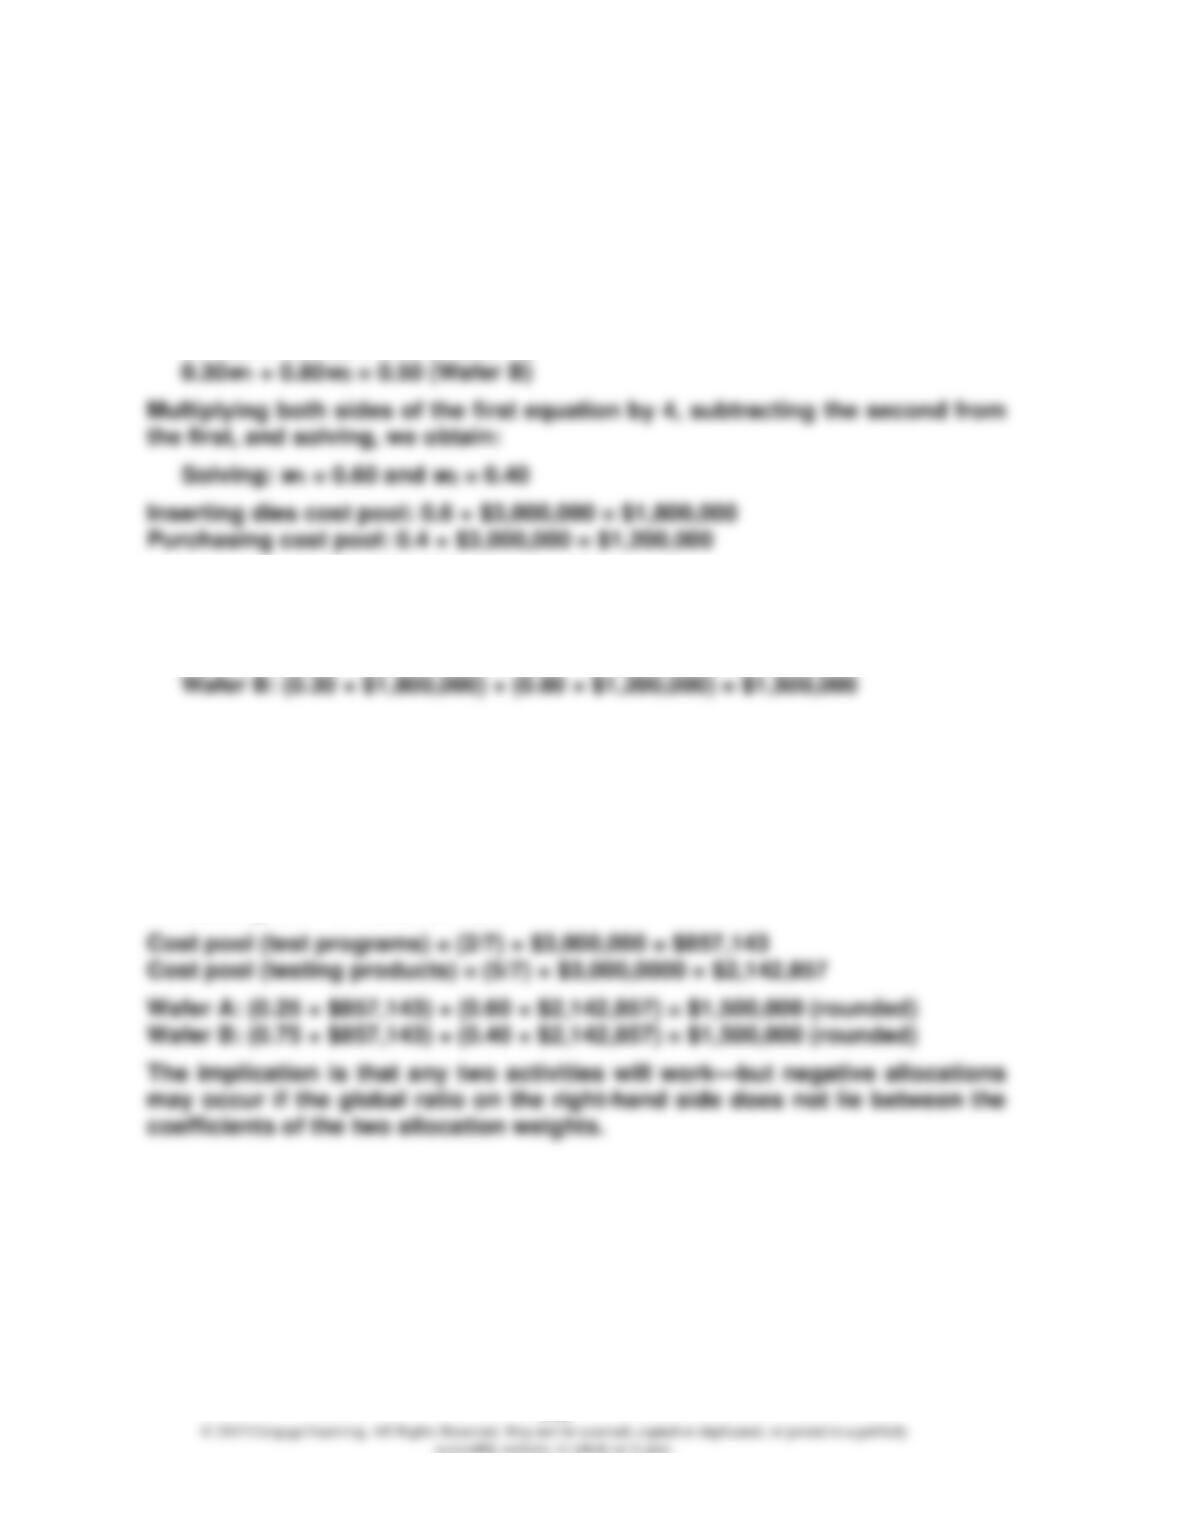
3. Using consumption ratios, the ABC cost of Wafer A is $650,000(0.25 + 0.10 +
0.15 + 0.20) + $50,000(0.60 + 0.55 + 0.45 + 0.70 + 0.35 + 0.65 + 0.50 + 0.30) =
$660,000. Since the cost is the same for each of the four most expensive activi-
ties, the reassigned cost for each of the four activities is $750,000[$650,000 +
4-10
Cornerstone Exercise 4.9
1. Global ratios:
Wafer A = 0.50 ($1,500,000/$3,000,000)
Wafer B = 0.50 ($1,500,000/$3,000,000)
Equations:
0.70w1 + 0.20w2 = 0.50 (Wafer A)
2. Using the consumption ratios, the same ABC cost assignment is realized with
two drivers:
Wafer A: (0.70 × $1,800,000) + (0.20 × $1,200,000) = $1,500,000
3. Equations:
0.25w1 + 0.60w2 = 0.50 (Wafer A)
0.75w1 + 0.40w2 = 0.50 (Wafer B)
Multiplying both sides of the first equation by 3, subtracting the second from
the first, and solving, we obtain:
Solving: w1 = 2/7 and w2 = 5/7
4-11
EXERCISES
Exercise 4.10
1. Predetermined overhead rate = $285,600/10,200 = $28 per direct labor hour
3. Actual overhead ………………………………………………. $285,000
4. Prime cost ……………………………………………………….. $1,050,000
Applied overhead …………………………………………….. 278,040
Exercise 4.11
1. Findley predetermined overhead rate = $912,000/48,000
= $19 per machine hour
2. Findley:
Actual overhead ………………………………………….. $915,000
Applied overhead ($19 × 47,780) ………………….. 907,820
Underapplied overhead …………………………... $ 7,180
Lemon:
4-12
Exercise 4.12
1. $5,700,000/375,000 = $15.20 per machine hour
2. $ 5,814,000 Applied overhead ($15.20 × 382,500)
4. Work-in-process inventory …. $ 576,000 (19.2%: $576,000/$3,000,000)
Finished goods inventory ….. 624,000 (20.8%: $624,000/$3,000,000)
Exercise 4.13
2. Department A: $720,000/120,000 = $6 per machine hour
3. Product X75 Product Y15
Plantwide:
210 × $5 = $1,050 210 × $5 = $1,050
Exercise 4.13 (Concluded)
4. Plantwide rate: $1,080,000/180,000 = $6
Department B: $360,000/60,000 = $6
Product X75 Product Y15
Plantwide:
Departmental:
Exercise 4.14
1. Yes. Direct materials and direct labor are directly traceable to each product;
their cost assignment should be accurate.
2. Note: Overhead rate = $150,000/$120,000 = 1.25 per direct labor dollar
(or 125% of direct labor dollars)
Standard: (1.25 × $30,000)/7,500 = $5.00 per purse
4-14
Exercise 4.14 (Concluded)
3. Setup rate = $45,000/1,500 hours
= $30 per setup hour
Standard Handcrafted
Setup rate:
$30 × 1,000 ………………… $ 30,000
$30 × 500 …………………… $15,000
Setup hours were chosen because the time per setup differs significantly
between standard and handcrafted purses. Transaction drivers measure
the number of times an activity is performed, while duration drivers measure
the time required. Duration drivers typically provide greater accuracy whenever
the time required per transaction is not the same for all products. This cost as-
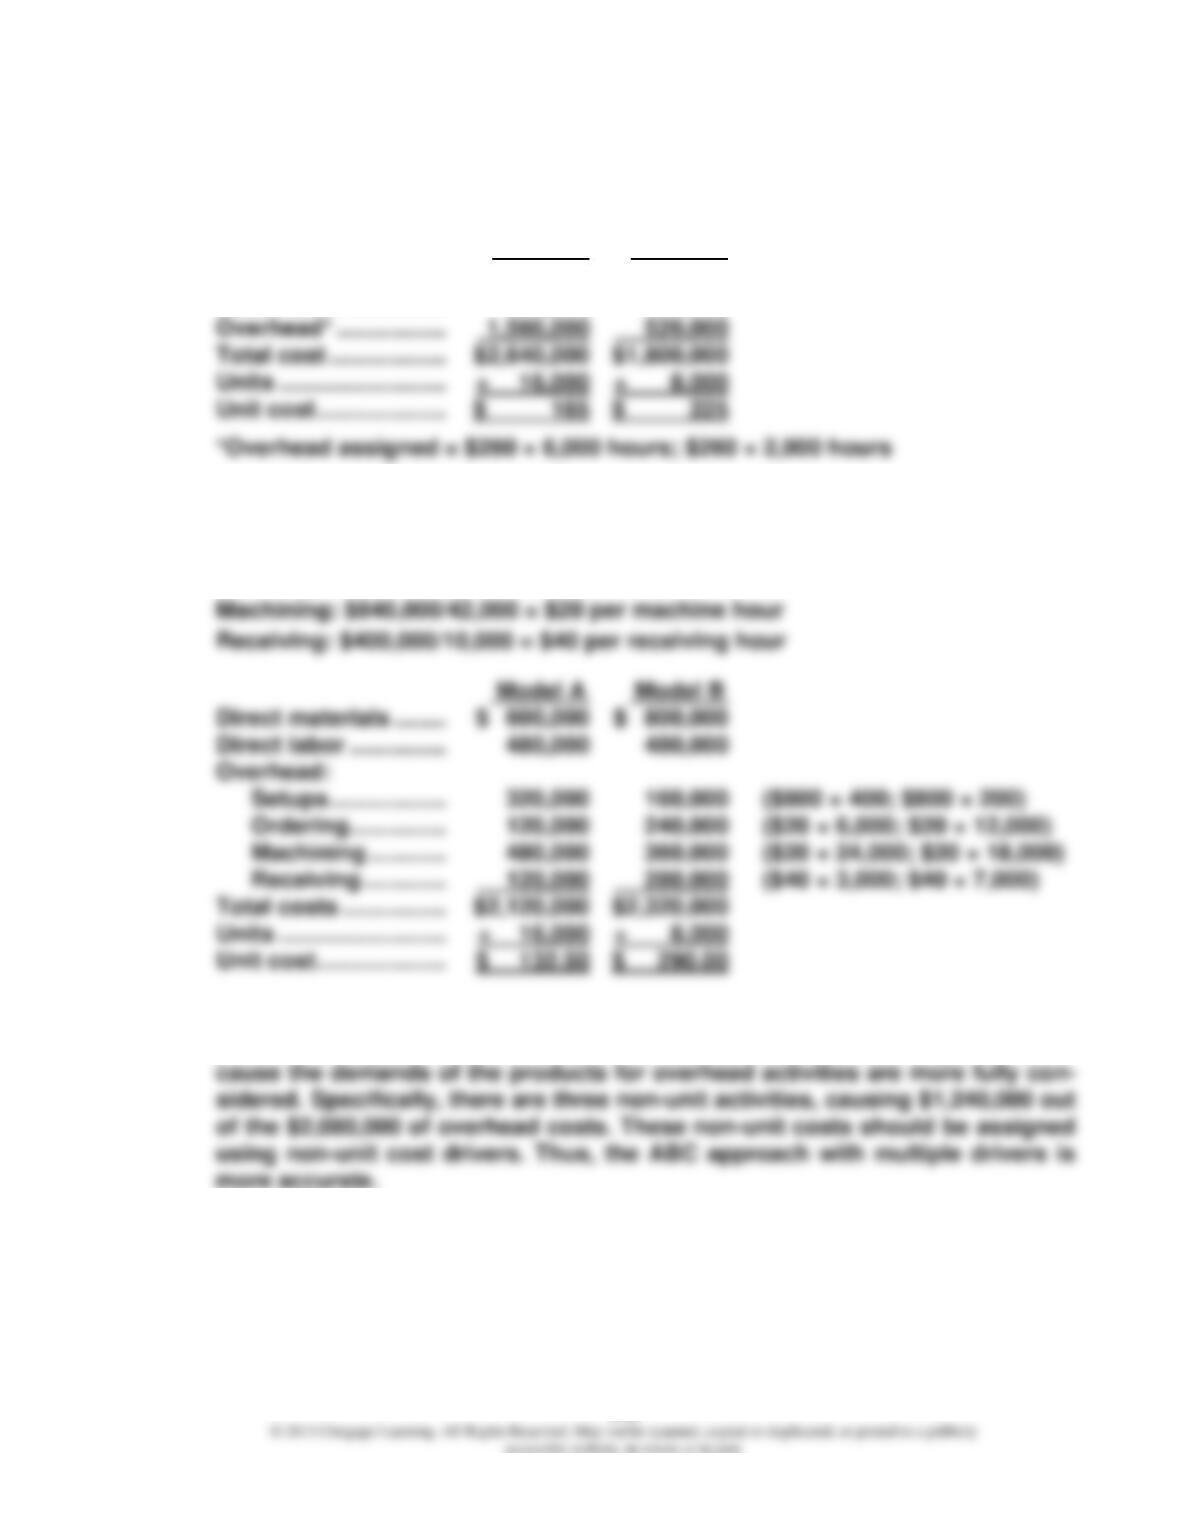
4-15
Exercise 4.15
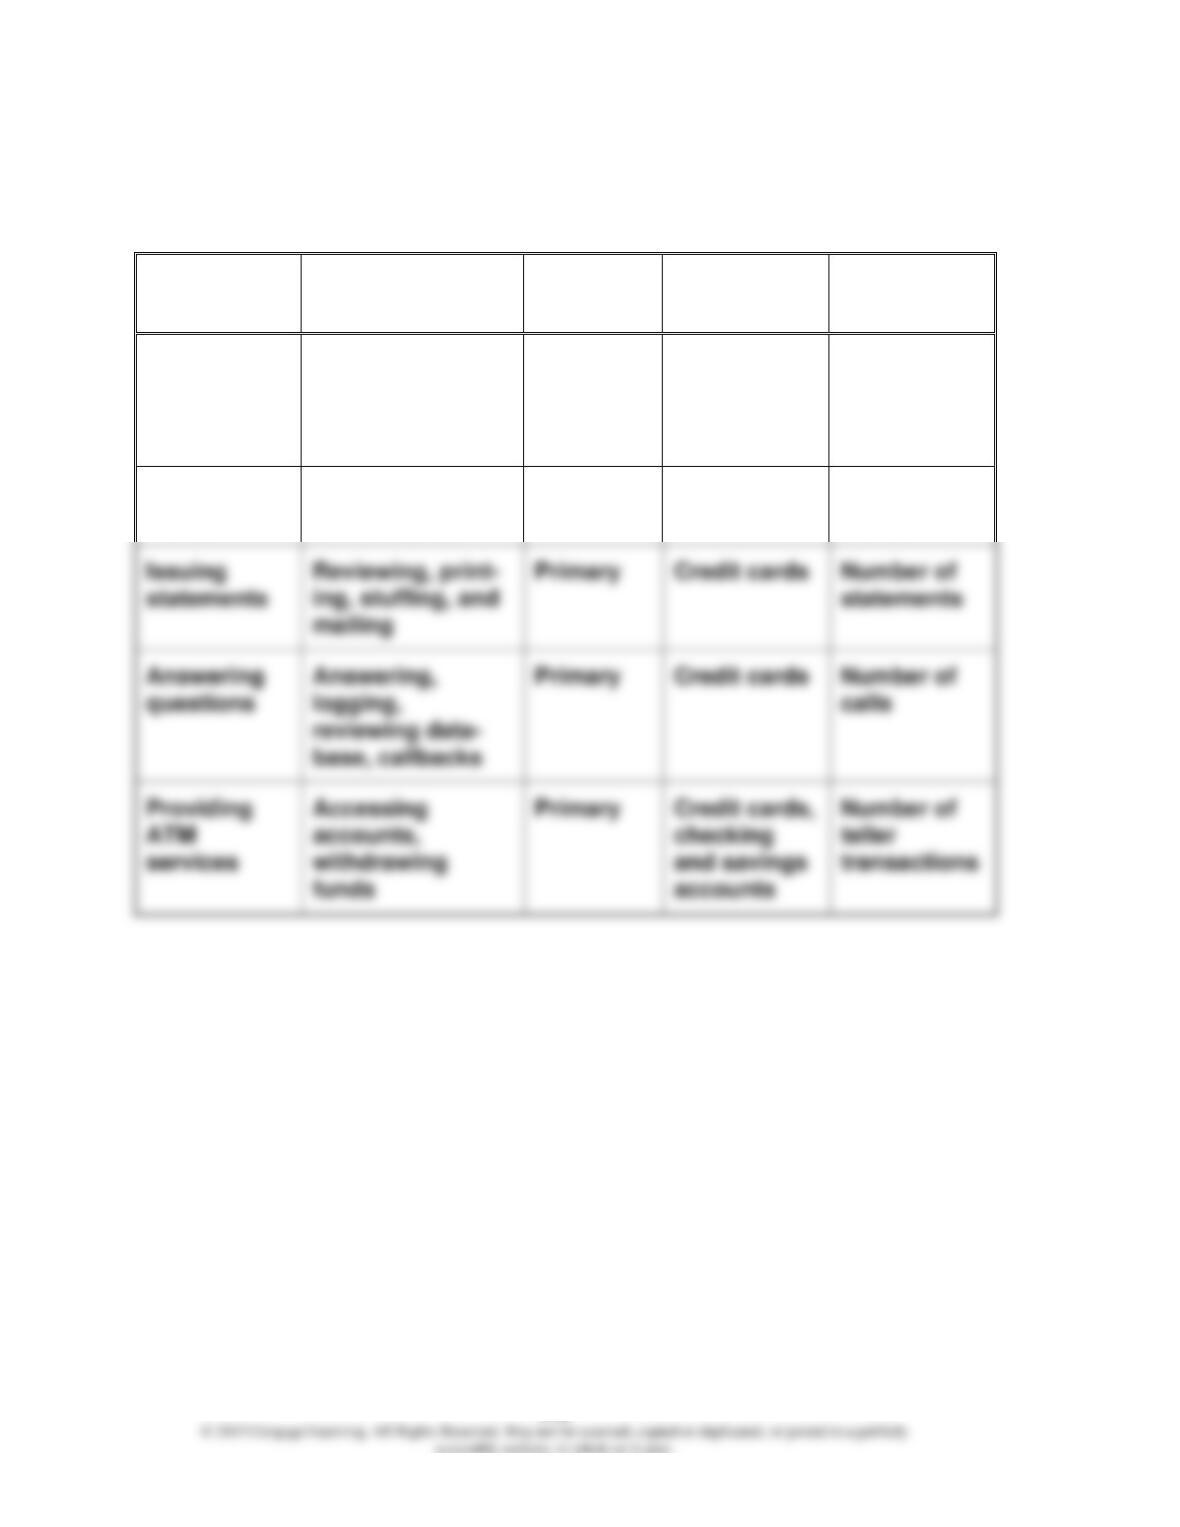
1. Overhead rate = $2,080,000/8,000 = $260 per direct labor hour
Model A Model B
Direct materials …….. $ 600,000 $ 800,000
Direct labor …………… 480,000 480,000
2. Activity rates:
Setups: $480,000/600 = $800 per setup
Ordering: $360,000/18,000 = $20 per order
3. In a firm with product diversity and significant non-unit overhead costs, multi-
ple rates using unit and non-unit drivers produce better cost assignments be-
4-16
Exercise 4.16
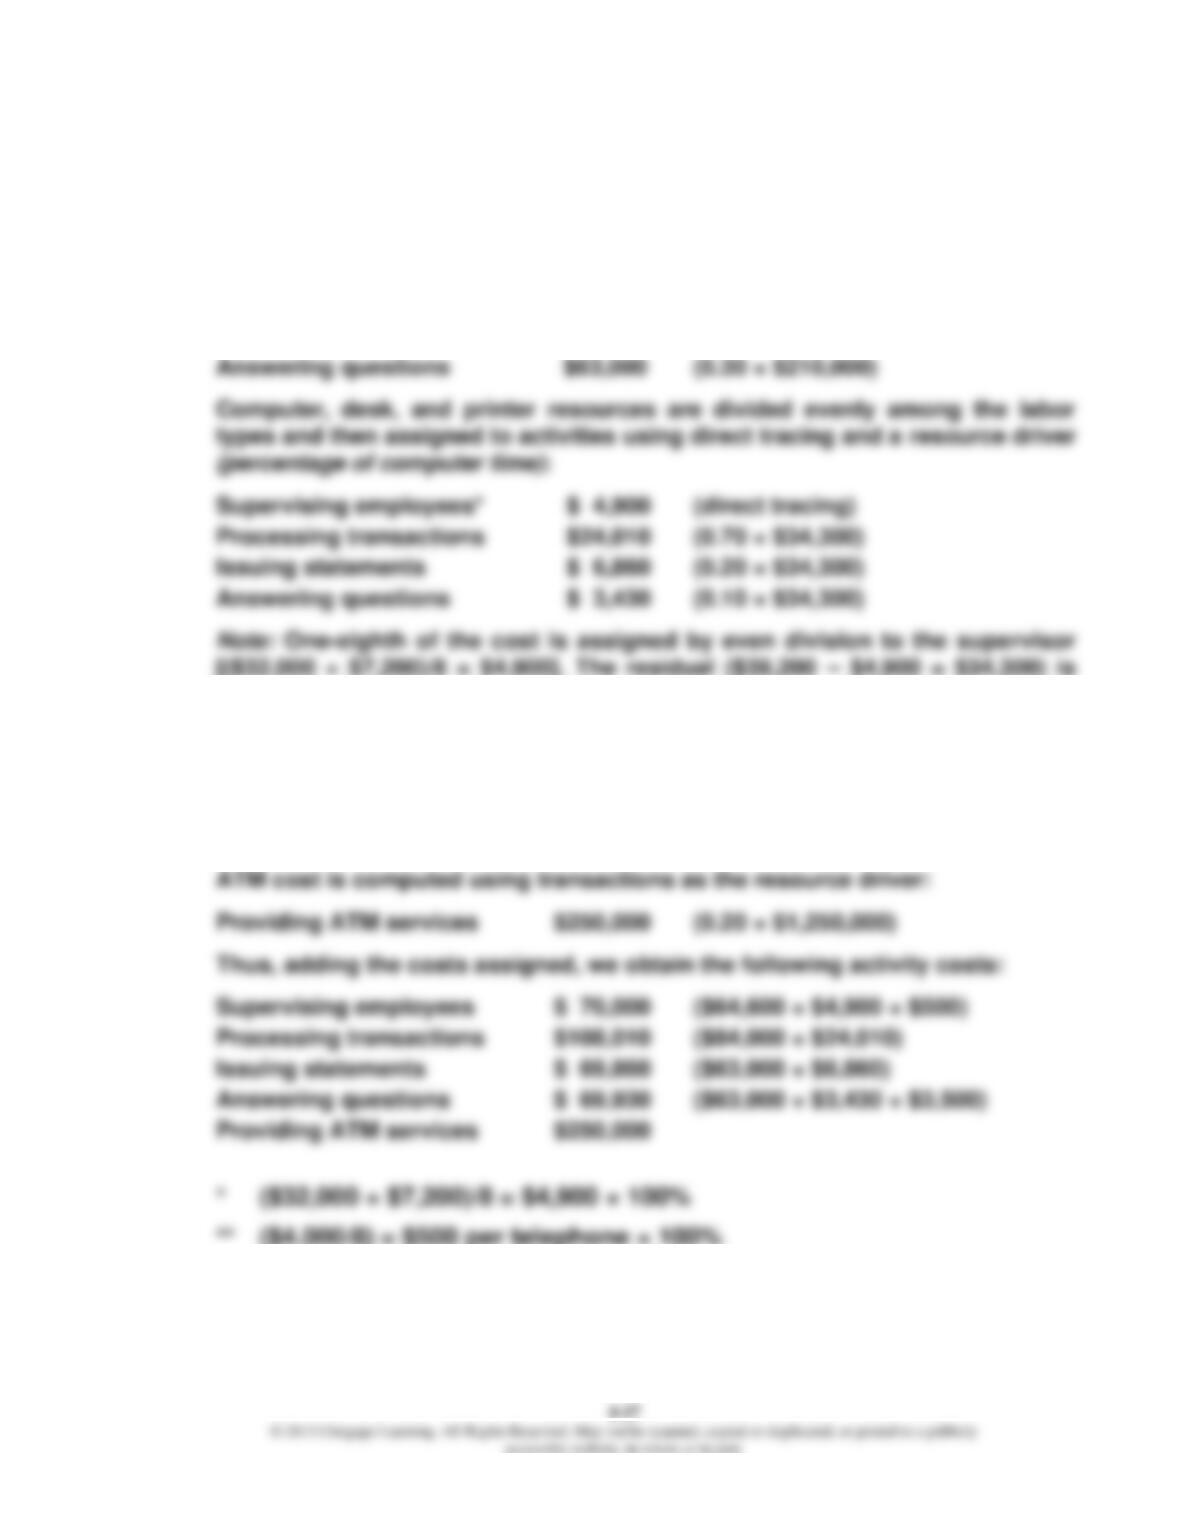
Activity Dictionary: Credit Card Department
Activity
Name
Activity
Description
Activity
Type
Cost
Object(s)
Activity
Driver
Supervising
employees
Scheduling,
coordinating,
and performance
evaluation
Secondary
Activities
within
department
Total labor
time for each
activity
Processing
transactions
Sorting, keying,
and verifying
Primary
Credit cards
Number of
transactions
Answering
Answering,
Primary
Credit cards
Number of
Providing
Accessing
Primary
Credit cards,
Number of
Exercise 4.17
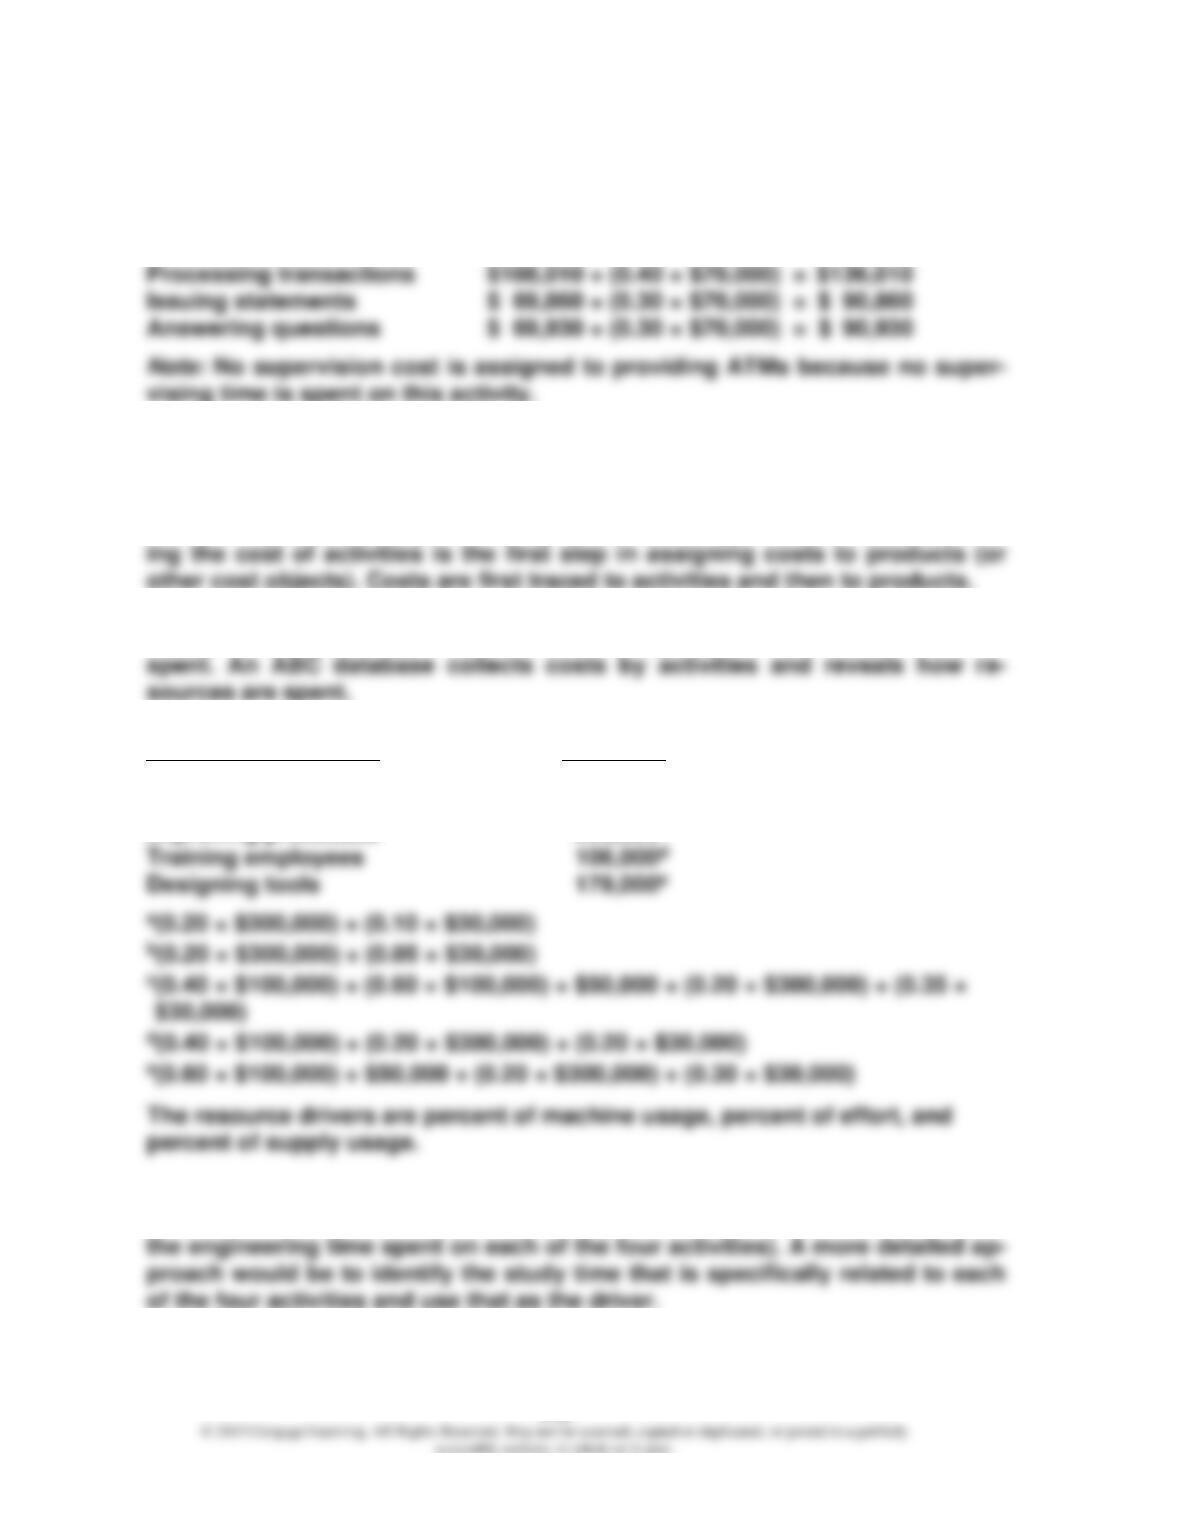
1. Labor cost is assigned to the activities using direct tracing and a resource
driver (percentage of time):
Supervising employees $64,600 (direct tracing)
Processing transactions $84,000 (0.40 × $210,000)
Issuing statements $63,000 (0.30 × $210,000)
assigned to the clerical group and then traced to the activities in proportion
to hours of computer usage.
Telephone cost is assigned to two activities:
Supervising employees** $ 500 (direct tracing)
Answering questions $3,500 (direct tracing)
4-18
Exercise 4.17 (Concluded)
2. The cost of supervision is assigned to the following primary activities (using
relative labor content of each activity):
Exercise 4.18
1. Unbundling means that general ledger costs are assigned to activities. Know-
2. The general ledger system collects costs by accounts. It reports what is
3. Activity Cost
Creating BOMs $ 63,000a
Studying capabilities 61,500b
Improving processes 220,500c
4. First, assign the cost of the activity, studying capabilities, to the other four
activities. A possible driver is engineering time (assign costs in proportion to
4-19
Exercise 4.18 (Concluded)
Second, assign the costs of the primary activities to jobs. Creating BOMs can
be assigned using number of BOMs (transaction) or time required to develop
BOMs (duration). Designing tools can be assigned to jobs using number of
Exercise 4.19
1. and 2.
Process Activities Level
Sustaining Providing space Facility
Procurement: Receiving goods Batch
Paying suppliers Batch
Manufacturing: Cutting Unit
Sewing Unit
Exercise 4.20
1. Capacity cost rate = $630,000/20,000 = $31.50 per hour
2. Activity rates:
Creating BOMs $31.50 × 0.5 = $15.75 per BOM
3. TDABC:
Job 150: $170.10 × 10 = $1,701
Job 151: $170.10 × 20 = $3,402
ABC:
4. BOM time = 0.50 + 0.30 (if custom product)